
94% of researchers rate our articles as excellent or good
Learn more about the work of our research integrity team to safeguard the quality of each article we publish.
Find out more
ORIGINAL RESEARCH article
Front. Chem., 13 January 2023
Sec. Analytical Chemistry
Volume 11 - 2023 | https://doi.org/10.3389/fchem.2023.1123003
 Lai Wei1,2,3
 Yu Ding1,2,3*Jing Chen1,2,3Linyu Yang1,2,3Jinyu Wei1,2,3Yinan Shi1,2,3Zigao Ma1,2,3Zhiying Wang1,2,3Wenjie Chen1,2,3Xingqiang Zhao1,2,3
Chemical fertilizers are important for effectively improving soil fertility, promoting crop growth, and increasing grain yield. Therefore, methods that can quickly and accurately measure the amount of fertilizer in the soil should be developed. In this study, 20 groups of soil samples were analyzed using laser-induced breakdown spectroscopy, and partial least squares (PLS) and random forest (RF) models were established. The prediction performances of the models for the chemical fertilizer content and pH were analyzed as well. The experimental results showed that the R2 and root mean square error (RMSE) of the chemical fertilizer content in the soil obtained using the full-spectrum PLS model were .7852 and 2.2700 respectively. The predicted R2 for soil pH was .7290, and RMSE was .2364. At the same time, the full-spectrum RF model showed R2 of .9471 (an increase of 21%) and RMSE of .3021 (a decrease of 87%) for fertilizer content. R2 for the soil pH under the RF model was .9517 (an increase of 31%), whereas RMSE was .0298 (a decrease of 87%). Therefore, the RF model showed better prediction performance than the PLS model. The results of this study show that the combination of laser-induced breakdown spectroscopy with RF algorithm is a feasible method for rapid determination of soil fertilizer content.
Soil is an indispensable part of the living environment of plants (Palansooriya et al., 2020) and a natural resource necessary for human survival (Zhang et al., 2018). Soil environment is directly related to the survival of plants and human beings (Gondek et al., 2018) and affects agricultural production (Hou et al., 2019). Crops cannot be planted without soil, and the fertility of the soil determines the growth and development of crops, which directly affects the yield and quality of the crops. Therefore, effective soil fertilization can promote sustainable development of agriculture and improve planting efficiency.
In modern agriculture, the use of chemical fertilizers is very prevalent. For example, ferrous sulfate fertilizer can not only supplement iron in plants, but also promote the absorption of nitrogen and phosphorus. Because ferrous sulfate has strong reducibility, it can also greatly regulate the oxidation-reduction process in plants. However, during fertilization, some areas receive excessive fertilizer, resulting in imbalances in the soil nutrient structure, worsening of the physical properties of soil, and concentrations of harmful metals and bacteria exceeding the standard values, which affects crop production (Guo et al., 2022). For example, long-term excessive use of nitrogen fertilizers (Zhao et al., 2022) leads to the loss of calcium, magnesium, and other elements, resulting in a continuous soil acidification and eventual loss of productivity. Excessive use of potassium fertilizers hinders the growth of crops, leading to lodging and other crop symptoms, reduction in crop production, and weakening of the production capacity of crops. At the same time, insufficient application of chemical fertilizers leads to insufficient soil fertility and reduced crop yield. Therefore, it is necessary to determine the contents of chemical fertilizers in soil.
At present, the contents of chemical fertilizers in soil are determined mainly through the potential method. Although this method has the advantages of accuracy and high precision (Topcu and Isildak, 2021), large-scale soil analysis is difficult because of the complicated pretreatment process and long analysis time. Therefore, it is necessary to develop a rapid and effective method for the determination of fertilizer content in soil. Laser-induced breakdown spectroscopy (LIBS) (Ding et al., 2021) is a new atomic emission spectroscopy technology with laser as the excitation source. Compared with the traditional analysis method, LIBS has the advantages of rapidness, real-time assessment (Ding et al., 2020), on-site micro-loss analysis (Qi et al., 2018), remote detection (Agresti et al., 2022), no need for complex sample preparation (Gupta et al., 2020), and simultaneous analysis of multiple elements (Shukla et al., 2022). In recent years, LIBS has been successfully used in geological exploration (Rethfeldt et al., 2021), metallurgical analysis (Myakalwar et al., 2021), medical diagnosis (Alsharnoubi et al., 2020), archaeology (Wallace et al., 2020), environmental monitoring (Ding et al., 2019), and other fields, including fertilizer detection. Danie et al. converted liquid fertilizer into a solid and used LIBS to analyze Cu, K, Mg, Mn, Zn, As, Cd, Cr, and Pb contents in the fertilizer, with a detection error of .02%–.06% (Andrade et al., 2017); Sha. et al. combined LIBS with multiple linear regression to determine the concentration of phosphorus in compound fertilizer (SHA et al., 2018); Senesi et al. analyzed phosphate rock and organic mineral phosphate fertilizer by single-pulse and double-pulse LIBS with principal content analysis and partial least squares (PLS) algorithm, and the identification results reached a confidence level of 95% (Senesi et al., 2017). At present, LIBS primarily focuses on the detection of elements in the fertilizer and is rarely applied to measuring the content of fertilizer in soil.
The soil matrix is complex; thus, its LIBS spectral information is also complicated (Chatterjee et al., 2019), which limits the application of LIBS technology to the accurate analysis of chemical fertilizer content in soil. Chemometric methods, such as PLS (Ewusi-Annan et al., 2020), support vector machine (Yuan et al., 2020), artificial neural networks (Babu et al., 2021), and random forest algorithm (Ding et al., 2020; Ding et al., 2019), are effective tools (Musyoka et al., 2022) for accurate qualitative and quantitative analysis using LIBS (Feng et al., 2022).
In this study, LIBS combined with PLS and RF algorithms was used to analyze soil samples with added ferrous sulfate fertilizer. Particularly, LIBS was used to readily and accurately determine the amount of fertilizer, thus providing effective reference for the follow-up management of fertilized soil.
The soil samples were obtained from a farmland in Yangzhong, Jiangsu Province. Twenty samples with different concentration gradients were prepared by adding different amounts of fertilizer to the soil. The concentration gradient and pH of the samples are listed in Table 1. In this experiment, ferrous sulfate fertilizer was used, and according to the amount of fertilizer, different quantities of the ferrous sulfate fertilizer were weighed, then added to 30 ml of distilled water, and stirred evenly. The prepared solutions were uniformly mixed with 100 g of the soil, put in an oven, and baked at 150°C for 10 h. The baked samples were then ground into powder; 2 g samples of soil powder were weighed, put into a tablet press, and pressed for 3 min at 20 MPa, yielding samples with a final diameter of 13 mm and a thickness of 5 mm.
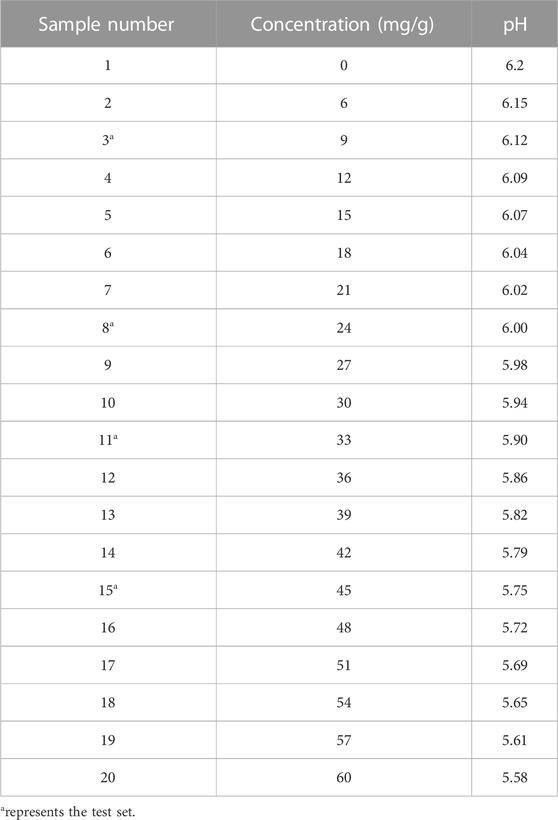
TABLE 1. Concentration of
A lamp-pumped electro-optic Q-switched compact nanosecond laser (Beamtech China, Dawa-200) was used as the excitation source (Figure 1). A wavelength of 1,064 nm, working frequency of the laser of 1 Hz, pulse energy of 55 mJ, spectral integration time of 1.05 m, and delay time of 3 μs were used in this study. During the experiment, the soil sample was placed directly on the moving stage, and the high-energy laser pulse was focused on the surface of the sample through a focusing mirror (with a focal length of 100 mm), which ablated the sample and generated plasma. Subsequently, the optical fiber probe collected the radiated spectral signal and coupled it to the spectrometer (Avantes AvaSpec-ULS2048-2-USB2, .07 nm). The wavelength range was 198–425 nm, with a total of 4,096 wavelength points.
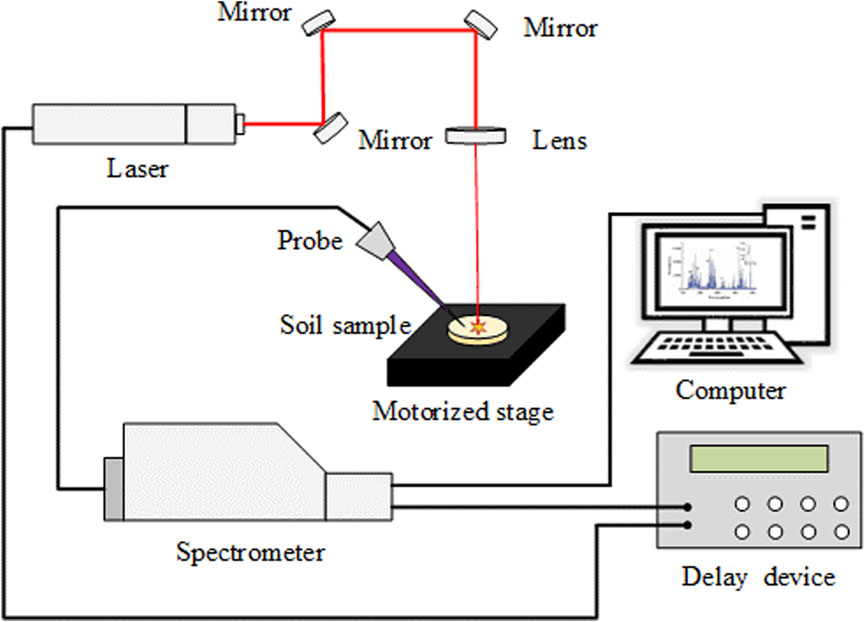
FIGURE 1. Experimental setup.
To reduce the fluctuation of the LIBS spectrum caused by the non-uniformity of the samples, 20 measurement points were randomly selected for each sample. Each measurement point was analyzed 3 times, and an average spectrum was recorded. Finally, 20 analysis spectra were obtained and averaged into one spectrum for each sample.
PLS is a regression-based mathematical optimization algorithm for multiple dependent and independent variables. In this method, the linear regression equation between independent and dependent variables is established, principal components are extracted step by step from the two matrices, variance and covariance are calculated, and iteration is performed one step at a time. Finally, according to the cross-validation results, the quantitative regression prediction and PLS analysis model are established (Alvarez et al., 2022). Conceptually, PLS primarily consists of extracting the first principal component from the independent variable and dependent variable matrix, and obtaining the covariance; then the second principal component is extracted and covariance is obtained, and this process is iterated. Finally, according to the cross-validation results, the final PLS quantitative regression prediction analysis model is established (Garcia et al., 2021). This algorithm can overcome the problem of collinearity between multiple independent variables.
RF is a classifier that contains multiple decision trees, and the output is determined by the mode of each tree’s output category. RF is a machine learning method (AGMD et al., 2021) which generates a large number of decision trees through randomly selected training samples and variable subsets, and uses these decision trees to predict the results to avoid over-fitting (Zagajewski et al., 2021). Compared with other traditional algorithms, RF has a higher calculation speed and stronger generalization ability and thus a lower risk of over-fitting (Gk et al., 2021).
Wavelength and intensity are important factors in the qualitative analysis of soil elemental content. Figure 2 shows the average LIBS spectra of all soil samples, and the elements with strong characteristic lines are marked according to the NIST database. As shown in Figure 2, Fe, Al, Ca, Mg, and Si are the main elements in soil, with the characteristic spectral lines of Fe Ⅱ (238.20 nm), Al Ⅰ (396.15 nm), Ca Ⅱ (393.36 nm), Mg Ⅱ (279.55 nm), and Si Ⅰ (251.61) nm.
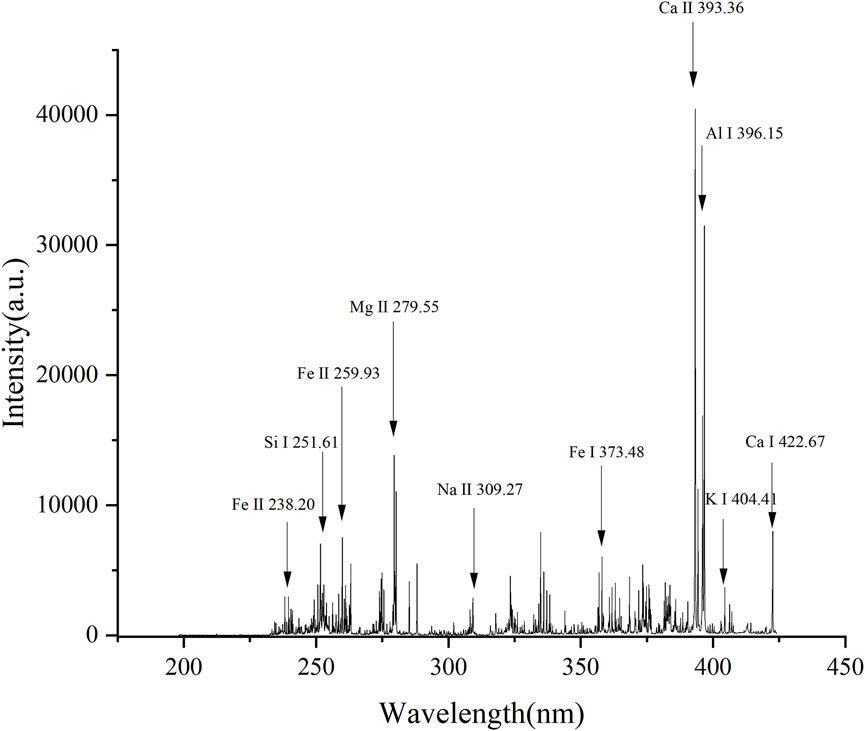
FIGURE 2. LIBS spectrum of soil samples.
Before the prediction, the PLS method was optimized. The principal factor number is an important parameter of the PLS model. To avoid insufficient fitting or over-fitting of the model, the principal factor number must be optimized. Thus, based on spectral data, PLS quantitative analysis models for soil fertilization content with 1–15 principal factors were established, and the curve fitting coefficient R2 and root mean square error (RMSE) predicted by the models were analyzed. The results are shown in Figure 3. R2 gradually increases with the increase in the principal factor number from one to 4. With a further increase in the principal factor number, R2 fluctuates and reaches the maximum value of .7852 when the principal factor number is 6. RMSE is at its maximum when the principal factor number is 2. At 6 principal factors, RMSE shows the minimum value of 2.2700. R2 and RMSE exhibit best values at six principal factors; thus, six was selected as the optimum principal factor number in this study. Therefore, the full-spectrum data for six factors was used to predict and analyze the content of fertilizer in soil. With the increase in soil fertilization, the pH of the soil changes to a certain extent; as this change impacts crop growth, LIBS was also used to explore soil pH in this study.
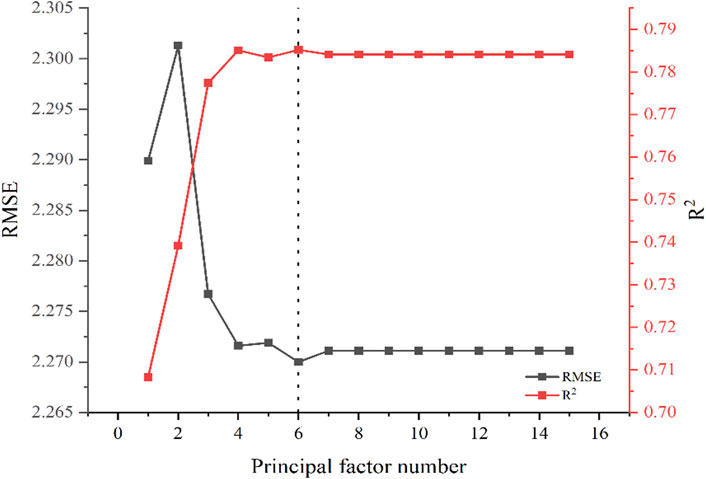
FIGURE 3. The relationship between principal factor number and R2/RMSE.
In this work, the full spectrum was used to predict the amount of fertilizer. Using the full-spectrum information with 4,096 spectral points as input variables, a PLS model was established to predict the amount of fertilizer. The prediction results are shown in Figure 4. Under the PLS model, the R2 and RMSE of the fertilizer content predicted using the full spectrum of soil are .7852 and 2.2700, respectively. The PLS model based on full-spectrum data was then used to predict the soil pH (Figure 5). The R2 and RMSE of pH in the test set are .7290 and .2364, respectively.

FIGURE 4. Prediction results using PLS model for fertilization.
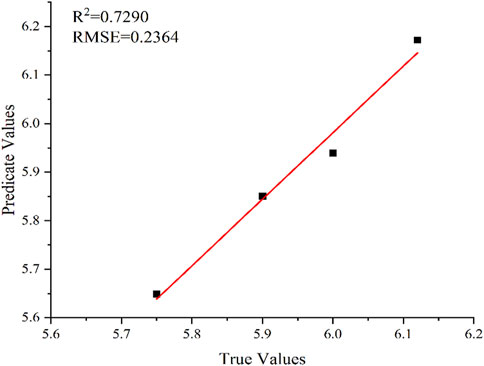
FIGURE 5. Prediction results using PLS model for/pH.
The results show that the accuracy of the PLS model in predicting the fertilizer content and soil pH are not satisfactory. The correlations between the actual and predicted values of the fertilizer content and pH are poor. The analysis error may be caused by excessive interference information in the soil spectrum, which had a negative impact on the prediction results of the model, resulting in the poor fitting of the PLS model, limited prediction performance, and failure to obtain good prediction results.
In the RF model, the main parameters affecting the model are ntree and mtry; ntree is the number of decision trees, and mtry specifies the number of variables used in binary trees in nodes and the number of variables affecting the data sets. In this experiment, we optimized the model by comparing the changes in R2 and RMSE predicted by the models with different ntree and mtry. Algorithm optimization was performed for ntree values in the range of 100–700, with the increments of 100. The mtry values were M, M/2, M/3, M/4, M/5, M/6, and M/7, where M is the total number of variables. The optimization process is shown in Figure 6. R2 gradually increases with ntree until it reaches the maxima at ntree = 300, then gradually decreases, and stabilizes, whereas mtry gradually increases in the change from M to M/4 and then gradually decreases in the variation from M/4 to M/7. Therefore, at the ntree and mtry of 300 and M/4, respectively, the model results are the best. The RF model was built based on the input variables and optimized model parameters, and the full spectrum was used to predict the fertilizer content and soil pH.
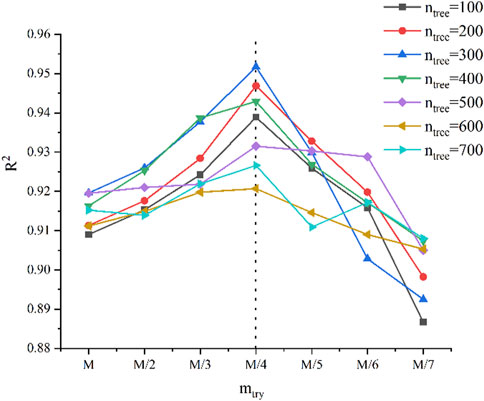
FIGURE 6. Prediction of R2 with different values of ntree and mtry.
All spectral points measured by LIBS were imported into the RF data model, and the prediction results are shown in Figure 7 (R2 = .9471 and RMSE = .3021). The RF model was also used to predict the soil pH based on full spectrum. The prediction results are shown in Figure 8 (R2 = .9517 and RMSE = .0298). Therefore, the optimized RF model shows good prediction results for the fertilizer content and soil pH.
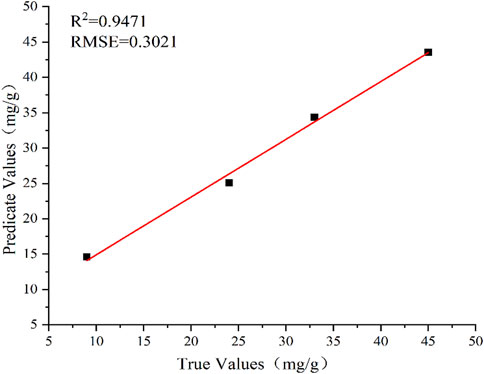
FIGURE 7. Prediction results using RF model for Fertilization.
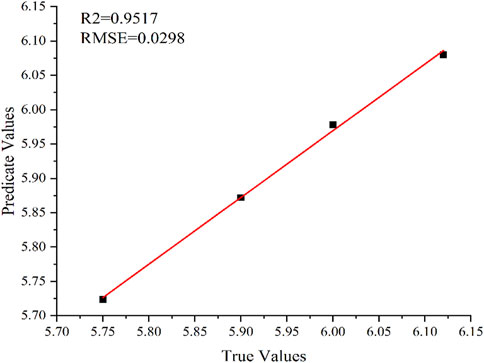
FIGURE 8. Prediction results using RF model for pH.
The comparison results of prediction performance is listed in Table 2. The results of the optimized PLS model (6 principal factors) for the full-spectrum prediction of fertilizer content are unsatisfactory. At the same time, the prediction accuracy of the RF model is considerably better: R2 is higher by 21% than that obtained using PLS (.9471 and .7853, respectively), and RMSE is lower by 87% (2.2700 and .3021, respectively). Thus, the RF model demonstrates better accuracy and stability of the prediction results. For the full-spectrum-based prediction of soil pH, R2 obtained by the RF model is higher by 31% than that in the PLS model (.9517 and .7290, respectively), whereas RMSE is lower by 87% (.0298 and .2364, respectively). Therefore, the RF prediction model also showed higher accuracy than the PLS model in predicting soil pH.
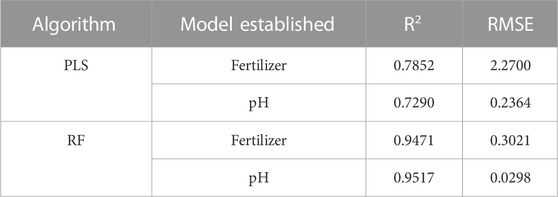
TABLE 2. Prediction results of two algorithm models
Thus, the optimized RF model is significantly better than the optimized PLS model in predicting fertilizer content and soil pH based on the full-spectrum data. The combination of LIBS with the RF method is effective and feasible for analyzing the amount of fertilizer in the soil and soil pH.
The main purpose of this study was to use LIBS in combination with PLS and RF methods to analyze soil samples with added ferrous sulfate fertilizer. Herein, the RF and PLS methods were used to predict the amount of fertilizer and pH of soil samples. The experimental results demonstrated that the R2 and RMSE for the prediction of fertilizer content in soil using the PLS model based on full spectrum were .7852 and 2.2700, respectively. The predicted R2 of soil pH was .7290 and RMSE was .2364. At the same time, the full-spectrum RF model showed the predicted R2 of .9471 (higher by 21%) and RMSE of .3021 (lower by 87%) for the fertilizer content; furthermore, for the soil pH, the predicted R2 was .9517 (higher by 31%), and RMSE was .0298 (lower by 87%). Thus, the RF model showed better prediction performance than the PLS model. Therefore, the combination of LIBS with the RF algorithm is a feasible method for determining the amount of fertilizer in the soil and the soil pH. The methods studied herein provide effective reference for the follow-up management of fertilized soil.
The raw data supporting the conclusion of this article will be made available by the authors, without undue reservation.
YD and LW contributed to the conceptualization and the design of the overall experiment. JC, LY, JW, YS, ZM, and ZW performed the experiment. ZW, WC, XZ completed a statistical analysis of the data. LW wrote the first draft of the manuscript. All authors contributed to manuscript revision, read, and approved the submitted version.
The research is funded by National Natural Science Foundation of China (Nos. 62105160).
The authors declare that the research was conducted in the absence of any commercial or financial relationships that could be construed as a potential conflict of interest.
All claims expressed in this article are solely those of the authors and do not necessarily represent those of their affiliated organizations, or those of the publisher, the editors and the reviewers. Any product that may be evaluated in this article, or claim that may be made by its manufacturer, is not guaranteed or endorsed by the publisher.
Agmd, Freitas., Minho, L., Elizabeth Alves de Magalhaes, B., Nei Lopes dos Santos, W., Soares Santos, L., and Augusto de Albuquerque Fernandes, S. (2021). Infrared spectroscopy combined with random forest to determine tylosin residues in powdered milk. Food Chem. 365, 130477. doi:10.1016/j.foodchem.2021.130477
Agresti, J., Indelicato, C., Perotti, M., Moreschi, R., Osticioli, I., Cacciari, I., et al. (2022). Quantitative compositional analyses of calcareous rocks for lime industry using LIBS. Molecules 27 (6), 1813. doi:10.3390/molecules27061813
Alsharnoubi, J., Nassef, Y., Fahmy, R. F., and Gamal, M. (2020). Using LIBS as a diagnostic tool in pediatrics beta-thalassemia. Lasers Med. Sci. 36, 957–963. doi:10.1007/s10103-020-03117-9
Alvarez, L. C., Purohit, P., Moros, J., and Laserna, J. (2022). Differentiation of closely related mineral phases in Mars atmosphere using frequency domain laser-induced plasma acoustics. Anal. Chim. Acta. 1226, 340261. doi:10.1016/j.aca.2022.340261
Andrade, D. F., Sperana, M. A., and Pereira-Filho, E. R. (2017). Different sample preparation methods for the analysis of suspension fertilizers combining LIBS and liquid-to-solid matrix conversion: Determination of essential and toxic elements. Anal. Methods. 9, 5156–5164. doi:10.1039/c7ay01049d
Babu, M. S., Imai, T., and Sarathi, R. (2021). Classification of aged epoxy micro–nanocomposites through PCA- and ANN-adopted LIBS analysis. IEEE Trans. Plasma Sci. IEEE Nucl. Plasma Sci. Soc. 49 (3), 1088–1096. doi:10.1109/tps.2021.3061410
Chatterjee, S., Singh, M., Biswal, B. P., Sinha, U. K., Patbhaje, S., and Sarkar, A. (2019). Application of laser-induced breakdown spectroscopy (LIBS) coupled with PCA for rapid classification of soil samples in geothermal areas. Anal. Bioanal. Chem. 411 (13), 2855–2866. doi:10.1007/s00216-019-01731-3
Deng, F., Ding, Y., Chen, Y., Zhu, S., and Chen, F. (2020). Quantitative analysis of the content of nitrogen and sulfur in coal based on laserinduced breakdown spectroscopy: Effects of variable selection. Plasma Sci. Technol. 22 (7), 074005. doi:10.1088/2058-6272/ab77d5
Ding, Y., Xia, G., Ji, H., and Xiong, X. (2019). Accurate quantitative determination of heavy metals in oily soil by laser induced breakdown spectroscopy (LIBS) combined with interval partial least squares (IPLS). Anal. Methods. 11 (29), 3657–3664. doi:10.1039/c9ay01030k
Ding, Y., Zhang, W., Zhao, X., Zhang, L., and Yan, F. (2020). A hybrid random forest method fusing wavelet transform and variable importance for the quantitative analysis of K in potassic salt ore using laser-induced breakdown spectroscopy. J. Anal. A. T. Spectrom. 35 (6), 1131–1138. doi:10.1039/d0ja00010h
Ewusi-Annan, E., Delapp, D. M., Wiens, R. C., and Melikechi, N. (2020). Automatic preprocessing of laser-induced breakdown spectra using partial least square regression and feedforward artificial neural network: Applications to Earth and Mars data. Spectrochim. Acta Part B A. T. Spectrosc. 171, 105930. doi:10.1016/j.sab.2020.105930
Feng, T., Chen, T., Li, M., Chi, J., Tang, H., Zhang, T., et al. (2022). Discrimination of the pollution grade of metal elements in atmospherically deposited particulate matter via laser-induced breakdown spectroscopy combined with machine learning method. Chemom. Intell. Lab. Syst. 231, 104691. doi:10.1016/j.chemolab.2022.104691
Garcia, J. A., Silva, J., and Pereira-Filho, E. R. (2021). LIBS as an alternative method to control an industrial hydrometallurgical process for the recovery of Cu in waste from electro-electronic equipment (WEEE). Microchem. J. 164 (17), 106007. doi:10.1016/j.microc.2021.106007
Gk, E. C., and Olgun, M. O. (2021). SMOTE-NC and gradient boosting imputation based random forest classifier for predicting severity level of Covid-19 patients with blood samples. Neural. comput. Appl. 33 (22), 15693–15707. doi:10.1007/s00521-021-06189-y
Gondek, K., Mierzwa-Hersztek, M., and Kopec, M. (2018). Mobility of heavy metals in sandy soil after application of composts produced from maize straw, sewage sludge and biochar. J. Environ. Manage. 210, 87–95. doi:10.1016/j.jenvman.2018.01.023
Guo, J. B., Li, C., Xu, X., Sun, M., and Zhang, L. (2022). Farmland scale and chemical fertilizer use in rural China: New evidence from the perspective of nutrient elements. J. Clean. Prod. 376, 134278. doi:10.1016/j.jclepro.2022.134278
Gupta, A. K., Aula, M., Negre, E., Viljanen, J., Pauna, H., Makela, P., et al. (2020). Analysis of ilmenite slag using laser-induced breakdown spectroscopy. Minerals 10, 855. doi:10.3390/min10100855
Hou, S., Zheng, N., Tang, L., Ji, X., Li, Y., and Hua, X. (2019). Pollution characteristics, sources, and health risk assessment of human exposure to Cu, Zn, Cd and Pb pollution in urban street dust across China between 2009 and 2018. Environ. Int. 128, 430–437. doi:10.1016/j.envint.2019.04.046
Ji, H. W., Ding, Y., Zhang, L., Hu, Y., and Zhong, X. (2021). Review of aerosol analysis by laser-induced breakdown spectroscopy. Appl. Spectrosc. Rev. 56 (3), 193–220. doi:10.1080/05704928.2020.1780604
Musyoka, W. D., Kalambuka, A. H., Dehayem-Kamadjeu, A., and Amiga Kaduki, K. (2022). Direct analysis of blood for diagnostic metals for malaria by peak-free laser-induced breakdown spectroscopy (LIBS) with artificial neural networks (ANN) and partial least squares (PLS). Anal. Lett. 55 (17), 2669–2682. doi:10.1080/00032719.2022.2067862
Myakalwar, A. K., Sandoval, C., YaezVelasquez, M., Sbarbaro, D., Sepulveda, B., and Yanez, J. (2021). LIBS as a spectral sensor for monitoring metallic molten phase in metallurgical applications—a review. Minerals 11 (10), 1073. doi:10.3390/min11101073
Palansooriya, K. N., Shaheen, S. M., Chen, S., Tsang, D. C., Hashimoto, Y., Hou, D., et al. (2020). Soil amendments for immobilization of potentially toxic elements in contaminated soils: A critical review. Environ. Int. 134, 105046. doi:10.1016/j.envint.2019.105046
Qi, J., Zhang, T., Tang, H., and Li, H. (2018). Rapid classification of archaeological ceramics via laser-induced breakdown spectroscopy coupled with random forest. Spectrochim. Acta Part B A. T. Spectrosc. 149, 288–293. doi:10.1016/j.sab.2018.09.006
Rethfeldt, N., Brinkmann, P., Riebe, D., Beitz, T., Kollner, N., Altenberger, U., et al. (2021). Detection of rare earth elements in minerals and soils by laser-induced breakdown spectroscopy (LIBS) using interval PLS. Minerals 11 (12), 1379. doi:10.3390/min11121379
Senesi, G. S., Romano, R. A., Marangoni, B. S., Nicolodelli, G., Villas-Boas, P. R., Benites, V. M., et al. (2017). Laser-induced breakdown spectroscopy associated with multivariate analysis applied to discriminate fertilizers of different nature. J. Appl. Spectrosc. 84 (5), 923–928. doi:10.1007/s10812-017-0566-4
Sha, W., Li, J. T., Lu, C. P., and Zhen, C. H. (2018). Quantitative analysis of P in compound fertilizer by laser-induced breakdown spectroscopy couplith linear multivariate calibration. Spectrosc. Spect. Anal. 39 (6), 1958–1964. doi:10.3964/j.issn.1000-0593
Shukla, V. K., Rai, A. K., Dwivedi, A., and Kumar, R. (2022). A quick analysis of various elements (heavy) in sand collected from the topical river (ganga and yamuna) using LIBS coupled with multivariate technique. Natl. Acad. Sci. Lett. 45 (5), 437–440. doi:10.1007/s40009-022-01163-1
Topcu, C., and Isildak, I. (2021). Novel micro flow injection analysis system for the potentiometric determination of tetraborate ions in environmental samples. Anal. Lett. 54 (5), 854–866. doi:10.1080/00032719.2020.1786105
Wallace, S., Smith, N., and Nerantzis, N. (2020). Handheld methods in archaeological research on large copper alloy assemblages: HH-XRF against HH-LIBS. Archaeometry 63 (2), 343–371. doi:10.1111/arcm.12595
Yuan, Z., Wei, L., Zhang, Y., Yu, M., and Yan, X. R. (2020). Hyperspectral inversion and analysis of heavy metal arsenic content in farml and soil based on optimizing CARS combined with PSOSVM algorithm. Spectrosc. Spect. Anal. 40 (2), 567–573. doi:10.3390/s20102777
Zagajewski, B., Kycko, M., Raczko, E., Njegovec, A., and Dabija, A. (2021). Comparison of random forest, support vector machines, and neural networks for post-disaster forest species mapping of the krkonoe/karkonosze transboundary biosphere reserve. Remote Sens. 13 (13), 2581. doi:10.3390/rs13132581
Zhang, J., Li, H., Zhou, Y., Dou, L., Cai, L., Mo, L., et al. (2018). Bioavailability and soil-to-crop transfer of heavy metals in farmland soils: A case study in the pearl river delta, south China. Environ. Pollut. 235, 710–719. doi:10.1016/j.envpol.2017.12.106
Keywords: LIBS, fertilizer, RF, PLS, pH
Citation: Wei L, Ding Y, Chen J, Yang L, Wei J, Shi Y, Ma Z, Wang Z, Chen W and Zhao X (2023) Quantitative analysis of fertilizer using laser-induced breakdown spectroscopy combined with random forest algorithm. Front. Chem. 11:1123003. doi: 10.3389/fchem.2023.1123003
Received: 13 December 2022; Accepted: 03 January 2023;
Published: 13 January 2023.
Edited by:
Qingyu Lin, Sichuan University, ChinaCopyright © 2023 Wei, Ding, Chen, Yang, Wei, Shi, Ma, Wang, Chen and Zhao. This is an open-access article distributed under the terms of the Creative Commons Attribution License (CC BY). The use, distribution or reproduction in other forums is permitted, provided the original author(s) and the copyright owner(s) are credited and that the original publication in this journal is cited, in accordance with accepted academic practice. No use, distribution or reproduction is permitted which does not comply with these terms.
*Correspondence: Yu Ding, ZGluZ3l1QG51aXN0LmVkdS5jbg==
Disclaimer: All claims expressed in this article are solely those of the authors and do not necessarily represent those of their affiliated organizations, or those of the publisher, the editors and the reviewers. Any product that may be evaluated in this article or claim that may be made by its manufacturer is not guaranteed or endorsed by the publisher.
Research integrity at Frontiers
Learn more about the work of our research integrity team to safeguard the quality of each article we publish.