Abstract
Nanomaterials have unique properties, functionalities, and excellent performance, and as a result have gained significant interest across disciplines and industries. However, currently, there is a lack of techniques that can assemble as-synthesized nanomaterials in a scalable manner. Electrophoretic deposition (EPD) is a promising method for the scalable assembly of colloidally stable nanomaterials into thick films and arrays. In EPD, an electric field is used to assemble charged colloidal particles onto an oppositely charged substrate. However, in constant voltage EPD the deposition rate decreases with increasing deposition time, which has been attributed in part to the fact that the electric field in the suspension decreases with time. This decreasing electric field has been attributed to two probable causes, (i) increased resistance of the particle film and/or (ii) the growth of an ion-depletion region at the substrate. Here, to increase EPD yield and scalability we sought to distinguish between these two effects and found that the growth of the ion-depletion region plays the most significant role in the increase of the deposit resistance. Here, we also demonstrate a method to maintain constant deposit resistance in EPD by periodic replenishing of suspension, thereby improving EPD’s scalability.
Highlights
1) Suspension replenishment enables constant deposit resistance with time.
2) Ion-depletion causes a decrease in the electric field during electrophoretic deposition.
3) Film formation plays an insignificant role in increasing deposit resistance.
4) Electric field can be maintained constant via ion-replenishing.
1 Introduction
The growth of nanotechnology is contingent upon further advancements in nanomanufacturing technologies (Philp and Fraser Stoddart, 1996; Whitesides and Grzybowski, 2002; Gates et al., 2005; Biswas et al., 2012; Bauer et al., 2018). Nanomanufacturing techniques can be broadly classified into top-down and bottom-up approaches or some combination of the two (Philp and Fraser Stoddart, 1996; Whitesides and Grzybowski, 2002; Gates et al., 2005; Merkel et al., 2010; Biswas et al., 2012; Pascall et al., 2014; Vogel et al., 2015; Jesse et al., 2016; Liu et al., 2016; Isaacoff and Brown, 2017; Fu et al., 2018; Yin et al., 2020). Top-down approaches involve cutting down macro-sized materials into nanomaterials with the help of external stimuli. Some examples of top-down approaches are lithography, molding, and milling. On the other hand, bottom-up approaches involve the assembly of atoms/molecules/colloidal particles into a larger nanostructure driven by interaction forces between them and/or external stimuli. Some examples of bottom-up approaches are atomic layer deposition, sol-gel nanofabrication, self-assembly, vapor deposition, Langmuir-Blodgett assembly, electric-field-assisted assembly, and capillary-force-assisted assembly. Both top-down and bottom-up approaches have benefits and limitations of their own. Top-down approaches have the advantage of precision and repeatability (Biswas et al., 2012; Jesse et al., 2016). However, they suffer from high capital and operating costs, low scalability, and diffraction limits of the electromagnetic wave being used which limits the feature size in lithography (Gates et al., 2005; Merkel et al., 2010; Biswas et al., 2012; Fu et al., 2018). Bottom-up approaches, on the other hand, have the advantage of high scalability, relatively low cost, the ability to fabricate structures upon non-planar substrates, and compatibility with organic materials (Philp and Fraser Stoddart, 1996; Whitesides and Grzybowski, 2002; Biswas et al., 2012; Vogel et al., 2015; Isaacoff and Brown, 2017; Yin et al., 2020). However, bottom-up approaches suffer from limited repeatability and a lack of control over the process. Thus, improvements and innovations in both top-down and bottom-up approaches are required to develop the next generation of nanomanufacturing technologies.
One promising bottom-up technique that is gaining attention in research labs and industry because of its scalability, cost-effectiveness, tunability, simple setup, and versatility in depositing a wide range of materials over many substrate shapes is electrophoretic deposition (EPD) (Besra and Liu, 2007; Dickerson and Boccaccini, 2011; Kalinina and Pikalova, 2019; Sikkema et al., 2020; Atiq Ur Rehman et al., 2021). EPD assembles charged colloidal particles onto an oppositely charged substrate under the application of an externally applied electric field. Due to its advantages, EPD has been used to form 2-D and 3-D assemblies of various classes of materials such as metals, ceramics, organics, and biomaterials onto planar, non-planar, and patterned substrates (Sarkar and Nicholson, 1996; Van der Biest and Vandeperre, 1999; Biest and Vandeperre, 2002; Zhitomirsky, 2002; Sarkar et al., 2004; Besra and Liu, 2007; Corni et al., 2008; Novak and König, 2009; Boccaccini et al., 2010b, 2010a; Boccaccini and Dickerson, 2013; Chavez-Valdez et al., 2013; Guo et al., 2015; Diba et al., 2016; Ma et al., 2018; Kalinina and Pikalova, 2019; Obregón et al., 2019; Hu et al., 2020; Lim et al., 2021). However, the underlying mechanisms and kinetics of EPD are still not well-understood (Dickerson and Boccaccini, 2011; Fuseini and Zaghloul, 2022).
Although the first-documented observation of electrophoresis was done by the French chemist Gautherot in 1801, it took more than a century before a theoretical framework for the kinetics of EPD were established by Hamaker in 1940 (Hamaker, 1940; Besra and Liu, 2007). According to Hamaker’s equation (Equation 1), EPD yield (m) depends on a sticking parameter (f) which is the ratio of the number of particles that adhere to the substrate and become part of the deposit to the total number of particles reaching the substrate, particle concentration (Cs), electrophoretic mobility of the particle being deposited (µ), area of the substrate (A), effective electric field in the suspension (E), and time (t):
Later it was observed that some of these factors do not necessarily remain constant but can decrease as a function of time, which can lead to a plateau in EPD yield (Sarkar and Nicholson, 1996; Anné et al., 2004; van der Biest et al., 2004; Wang et al., 2004; Stappers et al., 2008; Ferrari and Moreno, 2010). The particle concentration in the suspension decreases as particles deposit on the substrate, or as they settle out of the suspension. The electrophoretic mobility of the particles has also been shown to decrease during EPD due to a shift in the pH of the suspension (Kershner et al., 2004; Tiwari et al., 2020). Finally, the effective electric field in the suspension has been observed to decrease in the suspension during constant-voltage EPD (Zhang et al., 1994; Sarkar and Nicholson, 1996). The factors responsible for causing a decrease in particle concentration and particle electrophoretic mobility are well-understood and can be controlled (Sarkar and Nicholson, 1996; Besra and Liu, 2007; Tiwari et al., 2020). However, there is currently no consensus on the factor(s) that cause the decrease in electric field in the suspension (De and Nicholson, 2004; Kershner et al., 2004; Besra et al., 2010; Mishra et al., 2010; MISHRA et al., 2013; Tiwari et al., 2020).
In constant-voltage EPD, the total applied voltage difference (Vtotal) between the substrate and the counter-electrode is maintained constant using a power supply as shown with the help of a schematic in Figure 1. The Vtotal in the EPD cell is distributed as the sum of the voltage drop across the suspension (Vsus) and the voltage drop across the deposit (Vdep). The corresponding electric fields in the suspension (Esus) and the deposit (Edep) are not necessarily the same, or constant with time. In current literature, an increase in Vdep and corresponding Edep with time has been observed (Sarkar and Nicholson, 1996; Negishi et al., 2005; van Tassel and Randall, 2006b; Stappers et al., 2008). This increase in Vdep was widely attributed to the rise in local deposit resistance (Rdep) during EPD, which will be discussed in-depth in the next section. Consequently, there is a decrease in Vsus, and in the corresponding Esus (Negishi et al., 2004, 2005). Therefore, to understand and be able to better control the electric field on the deposit as well in the suspension, it is vital to understand the root cause behind the rise in local deposit resistance as a function of time.
FIGURE 1
There have been different explanations put forward to justify the increase in local deposit resistance during EPD (Boccaccini and Dickerson, 2013). Some researchers suggested that the increase in deposit resistance is caused because the thickness of the deposit is increasing with time (Sarkar and Nicholson, 1996). The hypothesis for this justification is that the resistivity of the deposit is higher than that of the suspension, and hence, an increase in deposit thickness leads to an increase in deposit resistance (Sarkar and Nicholson, 1996). However, further studies contradicted this claim by showing that the resistance of the deposit remains the same before and after the deposition, suggesting there must be another factor causing the rise in deposit resistance during EPD (Argirusis et al., 2006; Stappers et al., 2008; Schneider et al., 2010).
Further theoretical and experimental studies pointed to the electrochemical consumption of ions on the deposit electrode as the reason for the rise in deposit resistance during EPD (van Tassel and Randall, 2006b; Stappers et al., 2008; Hu et al., 2019). In a series of papers, Tassel et al. put forward a theory to explain the formation and stabilization of an ‘ion-depleted conduction region’ on the deposit electrode during constant-current EPD (De and Nicholson, 2004; van Tassel and Randall, 2006a, 2006b, 2007a, 2007b, 2007c). They showed that during EPD, a high resistivity ‘ion-depleted conduction region’ forms and grows due to the consumption of ions on the deposit electrode. In a typical electrochemical cell, this region will not be stable because of the immediate onset of convection currents that supply ions to this region. However, they argued that in an EPD cell, this region is stabilized against convection due to the buffering action of particles i.e., adsorption/desorption equilibria of ions from the particle surface present in the ion-depleted region. Thus, this region is confined to the deposited particle layer. The conduction of ionic current through this high resistivity ‘ion-depleted conduction region’ can proceed even above the equilibrium limit current and leads to a very high Rdep and Edep. On the other hand, in constant-voltage EPD, the electrochemical consumption of ions on the deposit electrode will also lead to the formation and growth of a stable ion-depleted conduction region. The only difference is that the current cannot exceed the equilibrium limit current in constant-voltage EPD. To study the role of the ion-depleted region on deposit resistance during constant-voltage EPD, Stappers et al. measured the deposit impedance as a function of time in a constant-voltage EPD via impedance spectroscopy (Stappers et al., 2008). They reported that the deposit impedance increases as deposition proceeds but returned to the original value after the deposition was stopped. Moreover, when they paused the deposition and replaced the particle suspension with the supernatant solution (without particles) and then resumed the deposition, the deposit impedance continued to increase. These two observations suggest that the deposit impedance is a function of the electrochemical depletion of ions on the deposit electrode rather than the growth of high-resistivity particle film. However, they were unable to maintain a constant deposit impedance and hence constant electric field, likely because they are merely recirculating the suspension from a reservoir where the ionic concentration was being depleted with time.
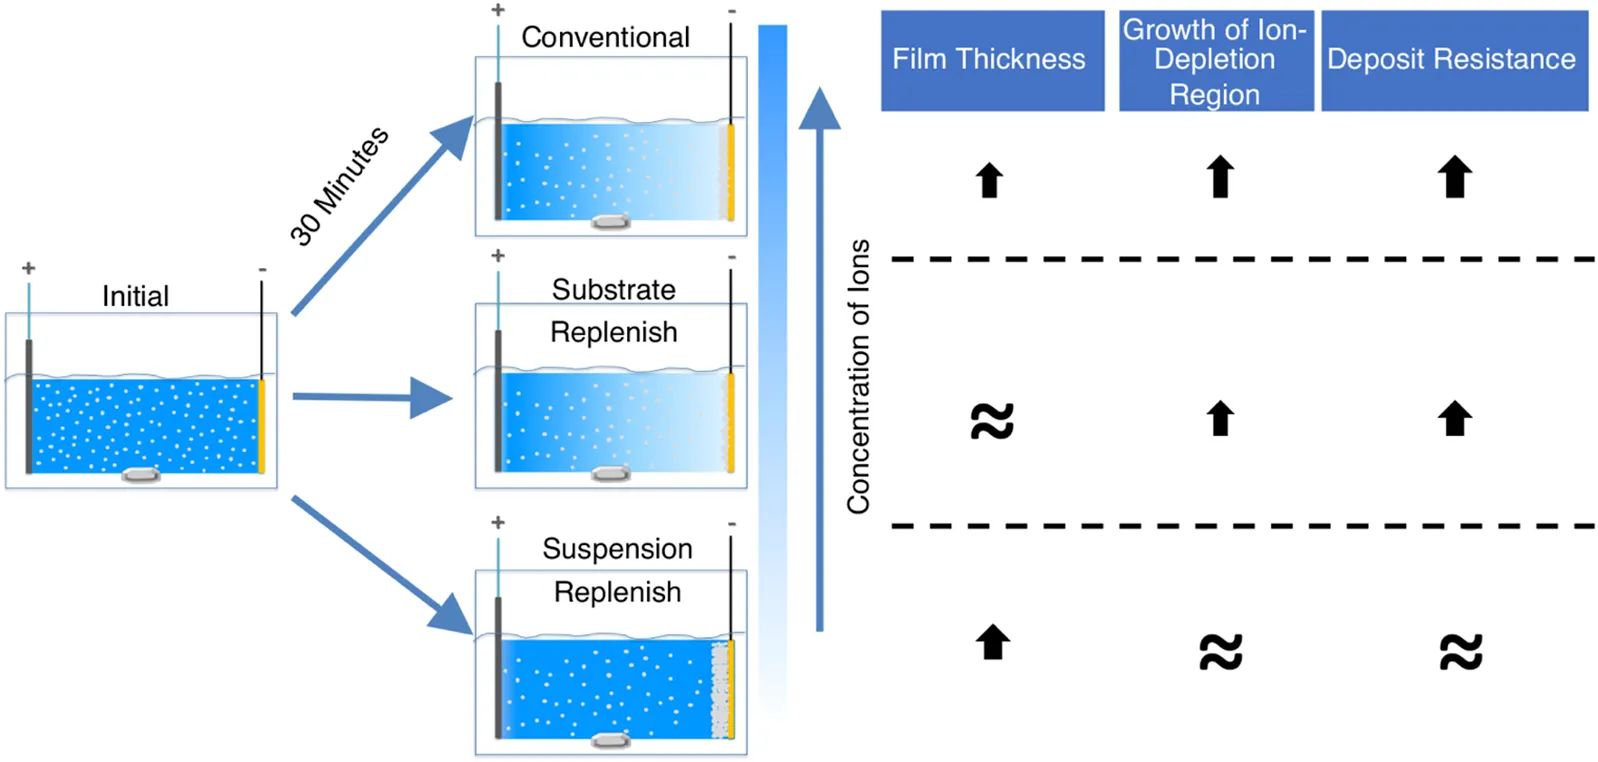
We hypothesized that instead of recirculating the suspension as per the study by Stappers et al., replenishing the suspension using a suspension-replenish EPD approach (Figure 2B) it would be possible to hinder the growth of the ion-depletion region and maintain constant deposit resistance as it will keep the ionic concentration constant during EPD. To confirm our hypothesis, in this study, we isolated and compared the individual effects of the growing deposit and the growing ion-depletion region on the increase in deposit resistance during constant-voltage EPD of alumina particles. We accomplished this by developing two modified EPD approaches (details provided in the experimental section), where either the substrate (along with the deposited film) or the suspension was replenished (Figure 2). Substrate-replenish EPD (Figure 2A) allowed us to periodically restart the growth of the deposit onto a fresh substrate while allowing the ion-depletion region to grow unhindered. On the other hand, suspension-replenish EPD (Figure 2B) allowed us to periodically restart the growth of the ion-depletion region by replenishing the ions and particles in the suspension while letting the deposit grow unhindered. We found that the growth of the ion-depletion region and not the deposit growth causes the increase in deposit resistance. We also found that the deposit resistance remained nearly constant during the suspension-replenish EPD. Thus, confirming our hypothesis that the growth of the ion-depletion region can be hindered, and deposit resistance can be kept constant via replenishment of ions using suspension-replenish EPD, which then helps maintain a near-constant electric field in the suspension.
FIGURE 2
For future work, improvements to suspension-replenish EPD can be achieved using a continuous-flow setup with automatic adjustments based on a live feedback mechanism to maintain constant particle concentration, pH, and conductivity in the EPD cell. Moreover, when measuring the electric field during EPD, one must be aware that the presence of the mulitmeter probe has the potential to impact the experiment. To overcome these challenges, computational tools can be utilized. Simulations of EPD experiments at varying scales will further help us visualize and understand the local and bulk electrochemical changes occurring during EPD.
2 Experimental details
2.1 Suspension preparation and characterization
α-alumina nanoparticles (> 99% purity, 80 nm diameter, 3.97 g/cm3 density) were purchased from US Research Nanomaterials, Inc., USA. A positively charged suspension of 0.25 volume % α-alumina nanoparticles was prepared in ethanol (200 proof ethanol, Acros Organics) by using hydrochloric acid (Technical HCl, Fischer Chemical) as the dispersing agent. The suspension was sonicated using an ultrasonicator (Branson SFX 550 probe ultra-sonicator). Effective pH (pHe) measurements were made using the ASTM D6423-19 standard protocol using a Thermo Scientific 5107 BNMD No-Cal pH/Automated Temperature Compensation combination electrode connected to a Thermo Scientific Orion Star A111 bench-top pH meter (Fuel and Engines, 1999). pHe measurements were recorded after 30 s of immersion in a stirred suspension. A Malvern Panalytical Zetasizer was used to measure the electrophoretic mobility and zeta potential of the nanoparticles in suspension. The Hückel model was used to calculate the zeta potential from particle mobility (Hunter, 2001). The suspension, with a pHe of 1.70 +/- 0.04 obtained by mixing 0.4 ml of 0.02 M HCL in ethanol solution with 19.6 ml of ethanol having particle mobility and zeta potential of 0.74 +/- 0.07 µm cm/V.s and 53.90 +/- 4.79 mV respectively, was used as the starting suspension for all depositions.
2.2 Electrophoretic depositions
Figure 3 shows a schematic and a corresponding photograph of the electrophoretic deposition setup that was used to perform the deposition of alumina nanoparticles using an applied electric field of 100 V/cm. Here, a hexagonal weighing boat was used to contain 20 ml of suspension. A magnetic stir rod and plate were used to stir the suspension during deposition. The electric field was applied by connecting a counter electrode (graphite) and a substrate placed 33 mm apart in the suspension to the positive and negative terminals of the power supply, respectively. To fabricate the substrate, a 10 nm titanium adhesion layer was sputtered onto a 100 4-inch prime-grade silicon wafer followed by sputtering of 100 nm gold layer using a KJL CMS-18 sputtering instrument. The wafer was then diced into 6 mm (width) × 20 mm (height) substrates using an ADT 7100 dicing saw. To image the EPD films, a cross-section of the film was prepared using an FEI Helios Nanolab 600 dual-beam focused ion beam (FIB)/Scanning Electron Microscope (SEM) using methods described elsewhere (Langford and Petford-Long, 2001). Imaging of the cross-section was performed using the same instrument; the cross-section was tilted 45° relative to the electron beam and dynamic focus was used to keep the entire cross-section in focus.
FIGURE 3
2.2.1 Substrate replenish electrophoretic deposition
In this substrate replenish EPD approach, we ran 30-min depositions starting with a fresh suspension of alumina nanoparticles at 100 V/cm while pausing the deposition at 10-min and 20-min time points to remove the substrate covered with deposit and to introduce a fresh substrate (without any deposit). The old suspension was collected in a centrifuge tube whilst the substrate is being replenished. After the substrate was replaced, the old suspension was reintroduced into the EPD boat followed by resumption of deposition (Figure 2A).
2.2.2 Suspension replenish electrophoretic deposition
In this suspension replenish EPD approach, we performed 30-min depositions starting with a fresh suspension of alumina nanoparticles at 100 V/cm while pausing the deposition at 10-min and 20-min time points to remove the old suspension and introduce a fresh suspension followed by resumption of the deposition (Figure 2B).
2.3 Deposit resistance measurement
The deposit resistance was calculated via Ohm’s law using the voltage difference measured between the substrate (deposit electrode) and a Pt wire (0.1 mm diameter) submerged at a distance of 1 mm parallel to the center of the substrate and the current value that was recorded from the power supply. A Siglent SDM 3055 digital multimeter and multimeter probe were used to measure the voltage difference as shown with the help of a schematic in Figure 3. The Pt wire was electrically connected to the multimeter probe with copper (Cu) tape. A distance of 1 mm was chosen as it allowed us to keep the Pt wire as close to the substrate as possible without disrupting the film growth since our films did not grow thicker than 1 mm. The voltage readings were automatically recorded using the Easy DMM software (Siglent).
3 Results and discussion
3.1 Deposit resistance during conventional electrophoretic deposition
Figure 4 shows a photograph and an optical micrograph of a typical film obtained via electrophoretic deposition of α-alumina nanoparticles. Here, full coverage of the submerged part of the substrate with the particles is seen. The porous structure of the films is evident from the SEM images of the top view (Figure 5A) as well as the cross-sectional view (Figure 5B) of the film. Due to edge effects i.e., the concentration of electric field on the substrate edges, the film thickness was highest at the edges as evident in Figure 4A (Pascall et al., 2013). It was also observed that the film roughness increased with time, which could be attributed to the decreasing stability of the suspension as the pHe of the suspension shifts towards the isoelectric point of alumina with time (Tiwari et al., 2020). The decrease in suspension stability leads to the agglomeration of particles in the suspension, which these agglomerates then deposit onto the substrate and increase film roughness Joung and Buie, 2011.
FIGURE 4
FIGURE 5
To measure how the deposit resistance changes during conventional electrophoretic deposition, we performed 30-min depositions of the positively charged alumina nanoparticles with an applied electric field of 100 V/cm. Figure 6 shows that the deposit resistance increases exponentially during conventional EPD. This increase can be attributed to the growing thickness of the film of deposited alumina nanoparticles since it has a higher resistivity than the suspension it is replacing (Sarkar and Nicholson, 1996). Secondly, it could be caused due to the formation and growth of a high resistivity ion-depletion region on the substrate. This region is formed because of the depletion of H3O+ or H2EtO+ ions as they undergo electrochemical reactions to form H2 gas on the substrate (De and Nicholson, 2004; van Tassel and Randall, 2007a). This region is not present on the counter electrode because the primary reactions there result in the generation of ions (H2EtO+ or H3O+) while the depletion of Cl- ions as they undergo electrochemical conversion into Cl2 is negligible (van Tassel and Randall, 2007b). Therefore, both deposit and ion-depletion regions grow unhindered for the entire duration of the deposition in conventional EPD as shown with the help of a schematic in Figure 7A.
FIGURE 6
FIGURE 7
3.2 Deposit resistance during substrate-replenish electrophoretic deposition
To isolate the effect of the ion-depletion region growth on the deposit resistance, we performed substrate-replenish EPD (Figure 2A). In this modified EPD approach, we ran 30-min depositions starting with a fresh suspension of alumina nanoparticles at 100 V/cm while pausing the deposition at 10-min and 20-min time points to remove the substrate and introduce a fresh substrate followed by resumption of the deposition. Here, the ion-depletion region is growing for the entire 30-min duration of the experiment, while the deposit growth is restarted every 10 min via substrate-replenishment, shown schematically in Figure 7B. Figure 6 shows that the deposit resistance in substrate-replenish EPD increases exponentially from 0 to 10 min and then drops sharply to nearly the original value at 10 min, followed by an exponential rise from 10 to 20 min and drop to nearly the original value at 20 min, and finally an exponential rise from 20 to 30 min. The increase in deposit resistance during substrate-replenish EPD is quite similar to that in conventional EPD (Figure 6) suggesting that the deposit resistance is mainly a function of the ion-depletion region growth.
Note, that there are two minor differences between the deposit resistance increase in conventional and substrate-replenish EPD. First, the rate of the exponential rise in deposit resistance from 10 to 30 min in substrate-replenish EPD is greater than that in conventional EPD, which we attributed to the faster electrochemical depletion of ions in the substrate replenish EPD because of the greater conductive surface area provided by periodic replacement of substrate covered by deposit film with fresh substrates having no deposit on them to begin with. Secondly, the return of deposit resistance deposit to the baseline resistance at 10- and 20-min time-points is attributed to the temporary removal of the ion-depletion region as the suspension is homogenized upon collection in the centrifuge tube.
3.3 Deposit resistance during suspension-replenish electrophoretic deposition
Finally, to isolate the effect of the growing deposit on the deposit resistance, we performed suspension-replenish EPD (Figure 2B). In this modified EPD approach, we ran 30-min depositions starting with a fresh suspension of alumina nanoparticles at 100 V/cm while pausing the deposition at 10-min and 20-min time points to remove the old suspension and introduce a fresh suspension followed by resumption of the deposition. In this approach, the deposit is growing for the entire 30 min while the ion-depletion region growth is restarted every 10 min with suspension-replenishment as shown with the help of a schematic in Figure 7C. Figure 6 shows that in suspension-replenish EPD, deposit resistance remains nearly constant with time relative to the conventional and substrate-replenish EPD. These results further confirm that the deposit resistance is primarily a function of the growth of the ion-depletion region and not due to the deposit growth. This also proves our hypothesis that the deposit resistance increase can be mitigated by minimizing the growth of the ion-depletion region via the replenishment of ions.
In summary, deposit resistance increases by a factor of only 3.7x during suspension-replenish EPD compared to 36x and 29x in conventional and substrate-replenish EPD, respectively. Therefore, it can be concluded that the growth of the ion-depletion region and not the deposit growth is the main driver for the increase in deposit resistance during EPD in agreement with recent studies (Argirusis et al., 2006; Stappers et al., 2008; Schneider et al., 2010). This also confirms our hypothesis that the deposit resistance and hence electric field can be maintained nearly constant by hindering the growth of the ion-depletion region via ion replenishment using a novel suspension replenish EPD approach which can help improve EPD yield.
4 Conclusion
In this work, we isolated the individual effects of the growth of the ion-depletion region and deposit growth on the local deposit resistance increase during electrophoretic deposition. We found that the main cause for the increase in deposit resistance is the ion-depletion region which forms and grows due to the electrochemical depletion of ions on the substrate. On the other hand, the effect of deposit growth on the increase in deposit resistance was found to be minimal. We also showed that deposit resistance, which is known to be the cause behind the decrease in electric field in the suspension during constant-voltage EPD can be maintained nearly constant via ion-replenishment using a new suspension-replenish EPD. While in Stappers et al.’s study, deposit resistance increased with time, which is most likely due to the fact they were recirculating instead of replenishing the suspension (Stappers et al., 2008). Thus, by using a suspension replenish approach the electric field in the suspension can be maintained constant improving EPD yield. Thereby, enabling a route to manufacture nanomaterials-based products and devices in an efficient and scalable manner.
Statements
Data availability statement
The original contributions presented in the study are included in the article/supplementary material, further inquiries can be directed to the corresponding author.
Author contributions
PT, carried out the majority of the experiments outlined in the manuscript, NF also contributed to the experimental efforts. PT, DA, and JA conceived of the ideas, and JA was in charge of overall planning. PT drafted the manuscript with support from NF, DA, and JA.
Acknowledgments
We would like to acknowledge the National Science Foundation for providing the funds for this work through the Scalable Nanomanufacturing Program, Award No. CMMI-1727930. We would also like to acknowledge the Research Service Center at the University of Florida for providing the characterization facility and tools, and Dr. Nicholas Rudawski for helping with the preparation of the cross-section of our deposit using Focused-Ion Beam (FIB) and subsequent imaging using Scanning Electron Microscope (SEM).
Conflict of interest
The authors declare that the research was conducted in the absence of any commercial or financial relationships that could be construed as a potential conflict of interest.
Publisher’s note
All claims expressed in this article are solely those of the authors and do not necessarily represent those of their affiliated organizations, or those of the publisher, the editors and the reviewers. Any product that may be evaluated in this article, or claim that may be made by its manufacturer, is not guaranteed or endorsed by the publisher.
References
1
AnnéG.VanmeenselK.VleugelsJ.van der BiestO. (2004). Influence of the suspension composition on the electric field and deposition rate during electrophoretic deposition. Colloids Surfaces A Physicochem. Eng. Aspects245, 35–39. 10.1016/j.colsurfa.2004.07.001CrossRef Full Text | Google Scholar
2
ArgirusisC.DamjanovićT.SchneiderO. (2006). An impedance study of the electrophoretic deposition from yttrium silicate suspensions. J. Mat. Sci.41, 8059–8067. 10.1007/s10853-006-0417-9CrossRef Full Text | Google Scholar
3
Atiq Ur RehmanM.ChenQ.BraemA.ShafferM. S. P.BoccacciniA. R. (2021). Electrophoretic deposition of carbon nanotubes: recent progress and remaining challenges. Int. Mater. Rev.66, 533–562. 10.1080/09506608.2020.1831299CrossRef Full Text | Google Scholar
4
BauerM. J.WenX.TiwariP.ArnoldD. P.AndrewJ. S. (2018). Magnetic field sensors using arrays of electrospun magnetoelectric Janus nanowires. Microsyst. Nanoeng.4, 37. 10.1038/s41378-018-0038-xPubMed Abstract | CrossRef Full Text | Google Scholar
5
BesraL.LiuM. (2007). A review on fundamentals and applications of electrophoretic deposition (EPD). Prog. Mat. Sci.52, 1–61. 10.1016/j.pmatsci.2006.07.001CrossRef Full Text | Google Scholar
6
BesraL.UchikoshiT.SuzukiT. S.SakkaY. (2010). Experimental verification of pH localization mechanism of particle consolidation at the electrode/solution interface and its application to pulsed DC electrophoretic deposition (EPD). J. Eur. Ceram. Soc.30, 1187–1193. 10.1016/j.jeurceramsoc.2009.07.004CrossRef Full Text | Google Scholar
7
BiestO. O. Van DerVandeperreL. J. (2002). Electrophoretic deposition. Membr. Technol.2002, 13. 10.1016/S0958-2118(02)80166-5CrossRef Full Text | Google Scholar
8
BiswasA.BayerI. S.BirisA. S.WangT.DervishiE.FaupelF. (2012). Advances in top-down and bottom-up surface nanofabrication: techniques, applications & future prospects. Adv. Colloid Interface Sci.170, 2–27. 10.1016/j.cis.2011.11.001PubMed Abstract | CrossRef Full Text | Google Scholar
9
BoccacciniA. R.ChoJ.SubhaniT.KayaC.KayaF. (2010a). Electrophoretic deposition of carbon nanotube-ceramic nanocomposites. J. Eur. Ceram. Soc.30, 1115–1129. 10.1016/j.jeurceramsoc.2009.03.016CrossRef Full Text | Google Scholar
10
BoccacciniA. R.DickersonJ. H. (2013). Electrophoretic deposition: fundamentals and applications. J. Phys. Chem. B117, 1501. 10.1021/jp211212yPubMed Abstract | CrossRef Full Text | Google Scholar
11
BoccacciniA. R.KeimS.MaR.LiY.ZhitomirskyI. (2010b). Electrophoretic deposition of biomaterials. J. R. Soc. Interface7, S581–S613. 10.1098/rsif.2010.0156.focusPubMed Abstract | CrossRef Full Text | Google Scholar
12
Chavez-ValdezA.ShafferM. S. P.BoccacciniA. R. (2013). Applications of graphene electrophoretic deposition. A review. J. Phys. Chem. B117, 1502–1515. 10.1021/jp3064917PubMed Abstract | CrossRef Full Text | Google Scholar
13
CorniI.RyanM. P.BoccacciniA. R. (2008). Electrophoretic deposition: From traditional ceramics to nanotechnology. J. Eur. Ceram. Soc.28, 1353–1367. 10.1016/j.jeurceramsoc.2007.12.011CrossRef Full Text | Google Scholar
14
DeD.NicholsonP. S. (2004). Role of ionic depletion in deposition during electrophoretic deposition. J. Am. Ceram. Soc.82, 3031–3036. 10.1111/j.1151-2916.1999.tb02198.xCrossRef Full Text | Google Scholar
15
DibaM.FamD. W. H.BoccacciniA. R.ShafferM. S. P. (2016). Electrophoretic deposition of graphene-related materials: A review of the fundamentals. Prog. Mater. Sci.82, 83–117. 10.1016/j.pmatsci.2016.03.002CrossRef Full Text | Google Scholar
16
DickersonJ. H.BoccacciniA. R. (2011). Electrophoretic deposition of nanomaterials. Germany: Springer. Google Scholar
17
FerrariB.MorenoR. (2010). EPD kinetics: A review. J. Eur. Ceram. Soc.30, 1069–1078. 10.1016/j.jeurceramsoc.2009.08.022CrossRef Full Text | Google Scholar
18
FuX.CaiJ.ZhangX.LiW. diGeH.HuY. (2018). Top-down fabrication of shape-controlled, monodisperse nanoparticles for biomedical applications. Adv. Drug Deliv. Rev.132, 169–187. 10.1016/j.addr.2018.07.006PubMed Abstract | CrossRef Full Text | Google Scholar
19
FuelE.EnginesA. S. (1999). Standard test method for determination of pHe of ethanol , denatured fuel ethanol , and fuel ethanol ( ASTM D6423 − 14). Readings, 4–6. 10.1520/D6423-14.2CrossRef Full Text | Google Scholar
20
FuseiniM.ZaghloulM. M. Y. (2022). Statistical and qualitative analyses of the kinetic models using electrophoretic deposition of polyaniline. J. Industrial Eng. Chem.113, 475–487. 10.1016/j.jiec.2022.06.023CrossRef Full Text | Google Scholar
21
GatesB. D.XuQ.StewartM.RyanD.WillsonC. G.WhitesidesG. M. (2005). New approaches to nanofabrication: Molding, printing, and other techniques. Chem. Rev.105, 1171–1196. 10.1021/cr030076oPubMed Abstract | CrossRef Full Text | Google Scholar
22
GuoX.LiX.LiH.ZhangD.LaiC.LiW. (2015). A comprehensive investigation on the electrophoretic deposition (EPD) of Nano-Al/Ni energetic composite coatings for the combustion application. Surf. Coatings Technol.265, 83–91. 10.1016/j.surfcoat.2015.01.056CrossRef Full Text | Google Scholar
23
HamakerH. C. (1940). Formation of a deposit by electrophoresis. Trans. Faraday Soc.35, 279–287. 10.1039/tf9403500279CrossRef Full Text | Google Scholar
24
HuS.LiW.FinkleaH.LiuX. (2020). A review of electrophoretic deposition of metal oxides and its application in solid oxide fuel cells. Adv. Colloid Interface Sci.276, 102102. 10.1016/j.cis.2020.102102PubMed Abstract | CrossRef Full Text | Google Scholar
25
HuS.LiW. W.LiW. W.ZhangN.QiH.FinkleaH.et al (2019). A study on the electrophoretic deposition of gadolinium doped ceria on polypyrrole coated yttrium stabilized zirconia. J. Colloid Interface Sci.555, 115–123. 10.1016/j.jcis.2019.07.094PubMed Abstract | CrossRef Full Text | Google Scholar
26
HunterR. J. (2001). Foundations of colloid science. United Kingdom: Oxford University Press. Google Scholar
27
IsaacoffB. P.BrownK. A. (2017). Progress in top-down control of bottom-up assembly. Nano Lett.17, 6508–6510. 10.1021/acs.nanolett.7b04479PubMed Abstract | CrossRef Full Text | Google Scholar
28
JesseS.BorisevichA. Y.FowlkesJ. D.LupiniA. R.RackP. D.UnocicR. R.et al (2016). Directing matter: Toward atomic-scale 3D nanofabrication. ACS Nano10, 5600–5618. 10.1021/acsnano.6b02489PubMed Abstract | CrossRef Full Text | Google Scholar
29
JoungY. S.BuieC. R. (2011). Electrophoretic deposition of unstable colloidal suspensions for superhydrophobic surfaces. Langmuir27, 4156–4163. 10.1021/la200286tPubMed Abstract | CrossRef Full Text | Google Scholar
30
KalininaE. G.PikalovaE. Y. (2019). New trends in the development of electrophoretic deposition method in the solid oxide fuel cell technology: Theoretical approaches, experimental solutions and development prospects. Russ. Chem. Rev.88, 1179–1219. 10.1070/rcr4889CrossRef Full Text | Google Scholar
31
KershnerR. J.BullardJ. W.CimaM. J. (2004). The role of electrochemical reactions during electrophoretic particle deposition. J. Colloid Interface Sci.278, 146–154. 10.1016/j.jcis.2004.05.017PubMed Abstract | CrossRef Full Text | Google Scholar
32
LangfordR. M.Petford-LongA. K. (2001). Preparation of transmission electron microscopy cross-section specimens using focused ion beam milling. J. Vac. Sci. Technol. A Vac. Surfaces, Films19, 2186–2193. 10.1116/1.1378072CrossRef Full Text | Google Scholar
33
LimD.NohS.SongY. (2021). Programmable nanoparticle patterning by droplet electrophoretic deposition. J. Mater. Res. Technol.14, 3150–3160. 10.1016/j.jmrt.2021.08.068CrossRef Full Text | Google Scholar
34
LiuN.WangF.LiuL.YuH.XieS.WangJ.et al (2016). Rapidly patterning micro/nano devices by directly assembling ions and nanomaterials. Sci. Rep.6, 32106–32110. 10.1038/srep32106PubMed Abstract | CrossRef Full Text | Google Scholar
35
MaY.HanJ.WangM.ChenX.JiaS. (2018). Electrophoretic deposition of graphene-based materials: A review of materials and their applications. J. Materiomics4, 108–120. 10.1016/j.jmat.2018.02.004CrossRef Full Text | Google Scholar
36
MerkelT. J.HerlihyK. P.NunesJ.OrgelR. M.RollandJ. P.DesimoneJ. M. (2010). Scalable, shape-specific, top-down fabrication methods for the synthesis of engineered colloidal particles. Langmuir26, 13086–13096. 10.1021/la903890hPubMed Abstract | CrossRef Full Text | Google Scholar
37
MishraM.BhattacharjeeS.BesraL.SharmaH. S.UchikoshiT.SakkaY. (2010). Effect of pH localization on microstructure evolution of deposits during aqueous electrophoretic deposition (EPD). J. Eur. Ceram. Soc.30, 2467–2473. 10.1016/j.jeurceramsoc.2010.04.034CrossRef Full Text | Google Scholar
38
MishraM.SakkaY.UchikoshiT.BesraL. (2013). pH localization: a case study during electrophoretic deposition of ternary MAX phase carbide-Ti3SiC2. J. Ceram. Soc. Jpn.121, 348–354. 10.2109/jcersj2.121.348CrossRef Full Text | Google Scholar
39
NegishiH.YamajiK.ImuraT.KitamotoD.IkegamiT.YanagishitaH. (2005). Electrophoretic deposition mechanism of YSZ/n-Propanol suspension. J. Electrochem. Soc.152, J16. 10.1149/1.1845301CrossRef Full Text | Google Scholar
40
NegishiH.YamajiK.SakaiN.HoritaT.YanagishitaH.YokokawaH. (2004). Electrophoretic deposition of YSZ powders for solid oxide fuel cells. J. Mater. Sci.39, 833–838. 10.1023/B:JMSC.0000012911.86185.13CrossRef Full Text | Google Scholar
41
NovakS.KönigK. (2009). Fabrication of alumina parts by electrophoretic deposition from ethanol and aqueous suspensions. Ceram. Int.35, 2823–2829. 10.1016/j.ceramint.2009.03.033CrossRef Full Text | Google Scholar
42
ObregónS.AmorG.VázquezA. (2019). Electrophoretic deposition of photocatalytic materials. Adv. Colloid Interface Sci.269, 236–255. 10.1016/j.cis.2019.05.003PubMed Abstract | CrossRef Full Text | Google Scholar
43
PascallA. J.QianF.WangG.WorsleyM. A.LiY.KuntzJ. D. (2014). Light-directed electrophoretic deposition: A new additive manufacturing technique for arbitrarily patterned 3D composites. Adv. Mat.26, 2252–2256. 10.1002/adma.201304953PubMed Abstract | CrossRef Full Text | Google Scholar
44
PascallA. J.SullivanK. T.KuntzJ. D. (2013). Morphology of electrophoretically deposited films on electrode strips. J. Phys. Chem. B117, 1702–1707. 10.1021/jp306447nPubMed Abstract | CrossRef Full Text | Google Scholar
45
PhilpD.Fraser StoddartJ. (1996). Self-Assembly in natural and unnatural systems. Angew. Chem. Int. Ed. Engl.35, 1154–1196. 10.1002/anie.199611541CrossRef Full Text | Google Scholar
46
SarkarP.DeD.RhoH. (2004). Synthesis and microstructural manipulation of ceramics by electrophoretic deposition. J. Mater. Sci.39, 819–823. 10.1023/B:JMSC.0000012909.46419.0eCrossRef Full Text | Google Scholar
47
SarkarP.NicholsonP. S. (1996). Electrophoretic deposition (EPD): Mechanisms, kinetics, and application to ceramics. J. Am. Ceram. Soc.79, 1987–2002. 10.1111/j.1151-2916.1996.tb08929.xCrossRef Full Text | Google Scholar
48
SchneiderO.Große-BrauckmannJ.ArgirusisC. (2010). Impedance study of the electrophoretic deposition of yttrium silicate from a polymeric precursor sol. J. Eur. Ceram. Soc.30, 1089–1096. 10.1016/j.jeurceramsoc.2009.07.020CrossRef Full Text | Google Scholar
49
SikkemaR.BakerK.ZhitomirskyI. (2020). Electrophoretic deposition of polymers and proteins for biomedical applications. Adv. Colloid Interface Sci.284, 102272. 10.1016/j.cis.2020.102272PubMed Abstract | CrossRef Full Text | Google Scholar
50
StappersL.ZhangL.van der BiestO.FransaerJ. (2008). The effect of electrolyte conductivity on electrophoretic deposition. J. Colloid Interface Sci.328, 436–446. 10.1016/j.jcis.2008.09.022PubMed Abstract | CrossRef Full Text | Google Scholar
51
TiwariP.FersonN. D.AndrewJ. S. (2020). Elucidating the role of electrophoretic mobility for increasing yield in the electrophoretic deposition of nanomaterials. J. Colloid Interface Sci.570, 109–115. 10.1016/j.jcis.2020.02.103PubMed Abstract | CrossRef Full Text | Google Scholar
52
Van der BiestO. O.VandeperreL. J. (1999). Electrophoretic deposition of materials. Annu. Rev. Mat. Sci.29, 327–352. 10.1146/annurev.matsci.29.1.327CrossRef Full Text | Google Scholar
53
van der BiestO.PutS.AnnéG.VleugelsJ. (2004). Electrophoretic deposition for coatings and free standing objects. J. Mater. Sci.39, 779–785. 10.1023/B:JMSC.0000012905.62256.39CrossRef Full Text | Google Scholar
54
van TasselJ. J.RandallC. A. (2007a). Ionic gradients at an electrode above the equilibrium limit current. 1. Concentration and charge gradients in an immobile electrolyte. J. Phys. Chem. C111, 3341–3348. 10.1021/jp064804yCrossRef Full Text | Google Scholar
55
van TasselJ. J.RandallC. A. (2007b). Ionic gradients at an electrode above the equilibrium limit current. 2. Transition to convection. J. Phys. Chem. C111, 3349–3357. 10.1021/jp064805qCrossRef Full Text | Google Scholar
56
van TasselJ. J.RandallC. A. (2007c). Ionic gradients at an electrode above the equilibrium limit current. 3. Stabilization of ion depleted conduction by a nanoporous alumina layer during electrophoretic deposition. J. Phys. Chem. C111, 3358–3365. 10.1021/jp064807aCrossRef Full Text | Google Scholar
57
van TasselJ. J.RandallC. A. (2006a). Mechanisms of electrophoretic deposition. Key Eng. Mater.314, 167–174. 10.4028/0-87849-998-9.167CrossRef Full Text | Google Scholar
58
van TasselJ. J.RandallC. A. (2006b). Role of ion depletion in the electrophoretic deposition of alumina powder from ethanol with increasing quantities of HCl. J. Mat. Sci.41, 8031–8046. 10.1007/s10853-006-0770-8CrossRef Full Text | Google Scholar
59
VogelN.RetschM.FustinC. A.del CampoA.JonasU. (2015). Advances in colloidal assembly: The design of structure and hierarchy in two and three dimensions. Chem. Rev.115, 6265–6311. 10.1021/cr400081dPubMed Abstract | CrossRef Full Text | Google Scholar
60
WangY. C.LeuI. C.HonM. H. (2004). Kinetics of electrophoretic deposition for nanocrystalline zinc oxide coatings. J. Am. Ceram. Soc.87, 84–88. 10.1111/j.1551-2916.2004.00084.xCrossRef Full Text | Google Scholar
61
WhitesidesG. M.GrzybowskiB. (2002). Self-assembly at all scales. Science295, 2418–2421. 10.1126/science.1070821PubMed Abstract | CrossRef Full Text | Google Scholar
62
YinJ.HuangY.HameedS.ZhouR.XieL.YingY. (2020). Large scale assembly of nanomaterials: Mechanisms and applications. Nanoscale12, 17571–17589. 10.1039/d0nr04156dCrossRef Full Text | Google Scholar
63
ZhangZ.HuangY.JiangZ. (1994). Electrophoretic deposition forming of SiC‐tzp composites in a nonaqueous sol media. J. Am. Ceram. Soc.77, 1946–1949. 10.1111/j.1151-2916.1994.tb07075.xCrossRef Full Text | Google Scholar
64
ZhitomirskyI. (2002). Cathodic electrodeposition of ceramic and organoceramic materials. Fundamental aspects. Adv. Colloid Interface Sci.97, 279–317. 10.1016/S0001-8686(01)00068-9PubMed Abstract | CrossRef Full Text | Google Scholar
Summary
Keywords
electrophoretic deposition kinetics, colloidal processing, scalable nanomanufacturing, materials assembly, alumina
Citation
Tiwari P, Ferson ND, Arnold DP and Andrew JS (2022) Overcoming the rise in local deposit resistance during electrophoretic deposition via suspension replenishing. Front. Chem. 10:970407. doi: 10.3389/fchem.2022.970407
Received
15 June 2022
Accepted
22 July 2022
Published
26 August 2022
Volume
10 - 2022
Edited by
Rajni Verma, The University of Melbourne, Australia
Reviewed by
Gayani Pathiraja, University of North Carolina at Greensboro, United States
Aminul Islam, Jashore University of Science and Technology, Bangladesh
Updates
Copyright
© 2022 Tiwari, Ferson, Arnold and Andrew.
This is an open-access article distributed under the terms of the Creative Commons Attribution License (CC BY). The use, distribution or reproduction in other forums is permitted, provided the original author(s) and the copyright owner(s) are credited and that the original publication in this journal is cited, in accordance with accepted academic practice. No use, distribution or reproduction is permitted which does not comply with these terms.
*Correspondence: Jennifer S. Andrew, jandrew@mse.ufl.edu
This article was submitted to Nanoscience, a section of the journal Frontiers in Chemistry
Disclaimer
All claims expressed in this article are solely those of the authors and do not necessarily represent those of their affiliated organizations, or those of the publisher, the editors and the reviewers. Any product that may be evaluated in this article or claim that may be made by its manufacturer is not guaranteed or endorsed by the publisher.