 Pier Luigi Gentili
 Juan Perez-Mercader
95% of researchers rate our articles as excellent or good
Learn more about the work of our research integrity team to safeguard the quality of each article we publish.
Find out more
PERSPECTIVE article
Front. Chem. , 30 August 2022
Sec. Chemical Physics and Physical Chemistry
Volume 10 - 2022 | https://doi.org/10.3389/fchem.2022.950769
This article is part of the Research Topic Approaching Human Intelligence through Chemical Systems: Development of Unconventional Chemical Artificial Intelligence. View all 11 articles
Chemical micro-heterogeneity is an attribute of all living systems and most of the soft and crystalline materials. Its characterization requires a plethora of techniques. This work proposes a strategy for quantifying the degree of chemical micro-heterogeneity. First of all, our approach needs the collection of time-evolving signals that can be fitted through poly-exponential functions. The best fit is determined through the Maximum Entropy Method. The pre-exponential terms of the poly-exponential fitting function are used to estimate Fuzzy Entropy. Related to the possibility of implementing Fuzzy sets through the micro-heterogeneity of chemical systems. Fuzzy Entropy becomes a quantitative estimation of the Fuzzy Information that can be processed through micro-heterogeneous chemical systems. We conclude that our definition of Fuzzy Entropy can be extended to other kinds of data, such as morphological and structural distributions, spectroscopic bands and chromatographic peaks. The chemical implementation of Fuzzy sets and Fuzzy logic will promote the development of Chemical Artificial Intelligence.
Microheterogeneity refers to systems that are heterogeneous at the microscopic level (Kalyanasundaram, 2012). There are numerous examples of micro-heterogeneous systems in both soft and crystalline materials (Chen, 2022). They might be broadly classified into five major sets (I) molecular aggregates composed of surfactants, lipids or other compounds, (II) natural and synthetic polymeric systems (III) nanomaterials and colloidal dispersions, (IV) adsorbed and intercalated guest-host solid materials (V) the multi-compartments and multiphase assemblies of living beings and their mimicries (Cheng and Perez-Mercader, 2020). The heterogeneity can be at the level of single particles (i.e., intra-entities) and/or inter-entities (Chen, 2022) (Rabanel et al., 2019).
No single technique can unveil all the details of these micro-heterogeneous systems. Techniques such as electron, fluorescence, Raman and atomic force microscopies, diffraction of X-rays and neutrons allow taking two- and three-dimensional snapshots of these micro-heterogeneous systems at intra- and inter-entities levels (Rabanel et al., 2019). Other relevant data on the collective features of micro-heterogeneous samples can be collected by techniques such as NMR and ESR. The Kirkwood-Buff theory (Kirkwood and Buff, 1951) describes solution mixtures containing any number of components; and it has been proven a solid framework for providing expressions of macroscopic thermodynamic features for any stable solution mixture as a function of its composition (Pierce et al., 2008) (Newman, 1994). In time-resolved spectroscopies or other techniques, transient signals monitor the dynamics and kinetics of molecular events occurring in the micro-heterogenous systems, thus providing a picture of their time evolution, including during non-equilibrium stages. The time-evolving signal
In many cases, decay kinetics from complex systems and fractal structures have been fitted by stretched exponential functions (Berberan-Santos et al., 2005) of the type:
or the less-known compressed hyperbola (or Becquerel) function (Menezes et al., 2013) of the type:
However, it has been shown (Hirayama et al., 1990) that stretched exponential functions can be substituted by the fitting function appearing in Eq. 1. In certain conditions, a sum of compressed hyperbolas can be replaced by a sum of exponential functions (Menezes et al., 2013). In Eq. 1, the determination of the “image
Although deconvolution is well conditioned, inverting the Laplace transform is ill-conditioned (McWhirter and Pike, 1978). This implies that minor errors in the data can lead to considerable uncertainty in the reconstruction of
In the following paragraphs, the basic principles of the MEM are briefly recalled. Then, a discretization of the “image
The MEM’s roots reside in Bayesian probability (Jaynes, 1957) (Brochon, 1994). It provides “the least biased estimate possible on the given information; i.e., it is maximally non-committal with regard to missing information”. According to Bayes’ theorem, the probability of the hypothesis
The term
In Eq. 5,
with
The term
The term
where
By introducing all the terms in Eq. 4, the explicit definition of the “posterior probability”
where
A possible shape of
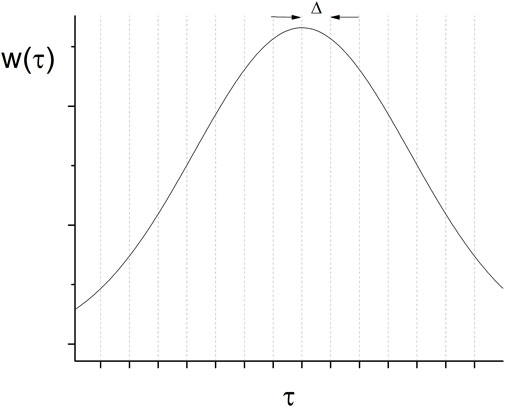
FIGURE 1. Quantization of the continuous variable τ.
The quantized variable
Then, the probability that
As
If
The information entropy of the continuous probability distribution function
Introducing the quantized variable
Since
But as
The fitting procedure of the time-resolved signals through the MEM allows determining the weights
The variable
The distribution of lifetimes, obtained by fitting a specific time-resolved signal,
Based on this second property, it is reasonable to propose the normalized version of the Fuzzy Entropy that becomes independent of the number of exponential terms used in the fitting procedure:
The
βbis)
Finally, both
γ) The value of Fuzzy Entropy depends on the physicochemical context of the chemical system: the more significant its micro-heterogeneity, the larger its Fuzzy Entropy.
Some experimental proofs of this third property are reported in the next paragraph. This paragraph is concluded by asserting that among the different definitions of Fuzzy Entropy that have been proposed (Al-sharhan et al., 2001), only that presented in Eqs. 20c and 21 is valuable for our case. The Fuzzy Entropy, appearing in Eqs. 20c and 21, is appropriate for characterizing the micro-heterogeneity of a chemical sample, based on the information retrieved by fitting any exponential time-resolved signal using the MEM.
The γ property of normalized Fuzzy Entropy, defined in Eq. 21, implies that
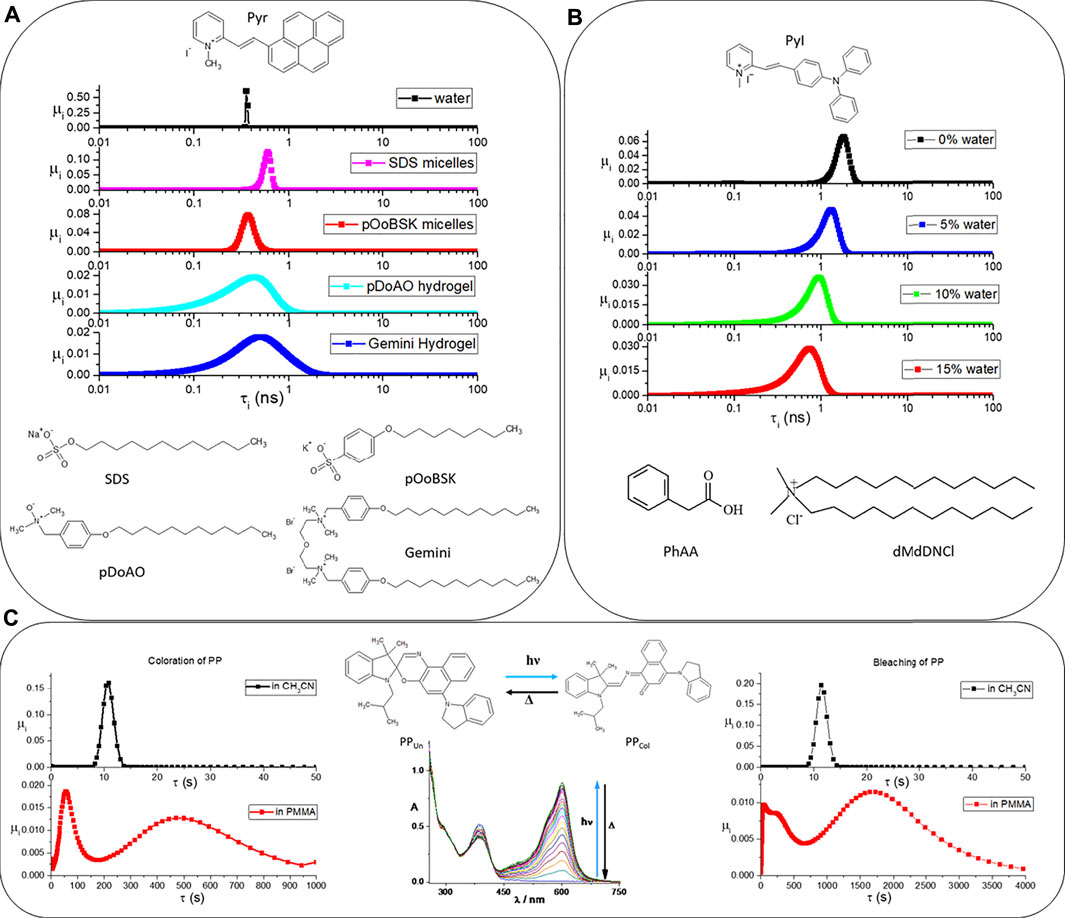
FIGURE 2. In (A), the fluorescence lifetimes’ distributions of Pyr in water (black points), SDS micelles (pink points), pOoBSK micelles (red points), pDoAO hydrogel (cyan points), and Gemini hydrogel (blue points) are shown. In (B), the fluorescence lifetimes’ distributions of PyI in PhAA/dMdDNCl after adding 0% (black points), 5% (blue points), 10% (green points), and 15% (red points) of water are reported. In (C), the photochromism of PP (see the molecular structures of both colored and uncolored forms and the spectra recorded upon UV irradiation) has been investigated in acetonitrile and in PMMA. The plots containing the black points refer to the distributions of lifetimes for the coloration (on the left) and bleaching (on the right) kinetics in acetonitrile. The plots below, with red dots, refer to the same kinetics collected in PMMA.
The first example refers to the fluorescent salt 2-[(1-pyrenyl)-ethenyl]-1-methylpyridinium (Pyr). The Pyr’s fluorescent lifetimes distribution is susceptible to its micro-environment (Cesaretti et al., 2016). When Pyr is dissolved in pure water, the distribution is rather sharp (see Figure 2A): there are two principal components (
The second example refers to another fluorescent N-methylpyridinium iodide, i.e., 2–4-(diphenylamino)phenyl-ethenyl-1-methylpyridinium iodide (PyI) used to probe the effect of water into the microheterogeneity of a Deep Eutectic Solvent (DES), which is made of phenylacetic acid (PhAA) and N,N,N,N-dimethyldidodecylammonium chloride (dMdDNCl) mixed in 2:1 M ratio (Tiecco et al., 2021). Figure 2B reports the fluorescent lifetimes’ distribution for PyI dissolved in PhAA/dMdDNCl and determined after addition of different amounts of water. The distribution in black (see graph on top of Figure 2B) has been determined for the DES having only its hydration water: the weighted averaged lifetime
Finally, the third example is shown in Figure 2C. It regards the photochromic spiroxazine PP. When PPUn is irradiated by UV, the spiro C-O bond of the oxazine is broken, and a merocyanine (PPCol) is produced. PPCol also absorbs in the visible region. The spectral modifications that are recorded upon UV irradiation are shown in the graph below the PP’s molecular structures. Merocyanine is metastable. If UV irradiation is discontinued, spontaneous thermal bleaching of the color can be observed. The PP’s coloration and bleaching kinetics have been collected in two very different micro-environments: PP dissolved in a homogeneous solvent, such as the acetonitrile, and PP encapsulated in a micro-heterogeneous and viscous environment, such as a film of poly(methyl methacrylate) (PMMA) (di Nunzio et al., 2010). Both the coloration and bleaching kinetics have been fitted by poly-exponential functions through MEM. The outputs are shown in Figure 2C. They reveal that PMMA slows down the PP’s photochromism and that the polymer significantly broadens the distributions of lifetimes. The black traces, which are relatively sharp, refer to acetonitrile, whereas the red traces refer to PMMA. The values of Fuzzy Entropy quantitatively remark the differences in the lifetimes’ distributions.
This work proposes an approach for quantitatively determining the degree of micro-heterogeneity of any chemical sample. Our approach requires, at first, the acquisition of a time-resolved signal that can be fitted by a poly-exponential function. Then, the least number of exponential terms and their relative weights are determined through the MEM. The relative weights are then used to calculate the normalized Fuzzy Entropy
It is interesting to note that the definition of
Any compound will exhibit different
In this paper, we point out that there exists a way for quantifying micro-heterogeneity. The approach we propose is synthetically the following one.
First, we collect a transient signal generated by our sample in its environment (for instance, a luminescence decay after photo-excitation).
Second, we fit the transient signal using the Maximum Entropy Method (MEM). Then, MEM gives us the least number of exponential terms needed to describe the experimental signal (please, see paragraph 2). A weight
Finally, we propose the Normalized Fuzzy Entropy, expressed through Eq. 21, to quantitatively determine the micro-heterogeneity which is then based on the weight
The original contributions presented in the study are included in the article, further inquiries can be directed to the corresponding author.
All authors listed have made a substantial, direct, and intellectual contribution to the work and approved it for publication.
PG thanks Università degli Studi di Perugia (Italy) for their funding of this work within the program “Ricerca di Base 2021”. JP-M thanks Repsol, S.A. (Spain) for their funding of this work and their continued support. The funders had no role in study design, data collection and analysis, decision to publish, or preparation of the manuscript.
The authors declare that the research was conducted in the absence of any commercial or financial relationships that could be construed as a potential conflict of interest.
All claims expressed in this article are solely those of the authors and do not necessarily represent those of their affiliated organizations, or those of the publisher, the editors and the reviewers. Any product that may be evaluated in this article, or claim that may be made by its manufacturer, is not guaranteed or endorsed by the publisher.
1We remind the reader that De Luca and Termini (1972) were the first to propose a definition of the entropy
Al-Sharhan, S., Karray, F., Gueaieb, W., and Basir, O. (2001). Fuzzy entropy: A brief surveyCat, in 10th IEEE international conference on fuzzy systems, 02-05 December 2001, Melbourne, VIC, Australia.
Bellacanzone, C., Tarpani, L., Gentili, P. L., and Latterini, L. (2020). Effects of glutathione on the luminescent behavior of CdSe-nanocrystals. J. Luminescence 226, 117513. doi:10.1016/j.jlumin.2020.117513
Berberan-Santos, M. N., Bodunov, E. N., and Valeur, B. (2005). Mathematical functions for the analysis of luminescence decays with underlying distributions 1. Kohlrausch decay function (stretched exponential). Chem. Phys. 315 (1-2), 171–182. doi:10.1016/j.chemphys.2005.04.006
Bhatia, P. K., Singh, S., and Kumar, V. (2013). On a generalized hyperbolic measure of fuzzy entropy. Int. J. Math. Archives 4 (12), 136–142.
Bhatia, P. K., Singh, S., and Kumar, V. (2015). On applications of a generalized hyperbolic measure of entropy. Int. J. Intelligent Syst. Appl. 7, 36–43. doi:10.5815/ijisa.2015.07.05
Brochon, J. C. (1994). Maximum entropy method of data analysis in time-resolved spectroscopy. Methods Enzymol. 240, 262–311. doi:10.1016/s0076-6879(94)40052-0
Cesaretti, A., Carlotti, B., Gentili, P. L., Germani, R., Spalletti, A., and Elisei, F. (2016). Twisting in the excited state of an N-methylpyridinium fluorescent dye modulated by nano-heterogeneous micellar systems. Photochem. Photobiol. Sci. 15 (4), 525–535. doi:10.1039/c5pp00388a
Chakraborty, S., Steinbach, P. J., Paul, D., Mu, H., Broyde, S., Min, J. H., et al. (2018). Enhanced spontaneous DNA twisting/bending fluctuations unveiled by fluorescence lifetime distributions promote mismatch recognition by the Rad4 nucleotide excision repair complex. Nucleic Acids Res. 46 (3), 1240–1255. doi:10.1093/nar/gkx1216
Chen, Q. (2022). Beyond snowflakes: Heterogeneity in nanomaterials. Nano Lett. 22 (1), 3–5. doi:10.1021/acs.nanolett.1c03400
Cheng, G., and Perez-Mercader, J. (2020). Dissipative self-assembly of dynamic multicompartmentalized microsystems with light-responsive behaviors. Chem 6 (5), 1160–1171. doi:10.1016/j.chempr.2020.02.009
Comez, L., Gentili, P. L., Paolantoni, M., Paciaroni, A., and Sassi, P. (2021). Heat-induced self-assembling of BSA at the isoelectric point. Int. J. Biol. Macromol. 177, 40–47. doi:10.1016/j.ijbiomac.2021.02.112
Cover, T. M., and Thomas, J. A. (2006). Elements of information theory” john wiley & sons, inc. Hoboken, New Jersey.
De Luca, A., and Termini, S. (1972). A definition of a nonprobabilistic entropy in the setting of fuzzy sets theory. Inf. control 20 (4), 301–312. doi:10.1016/s0019-9958(72)90199-4
di Nunzio, M. R., Gentili, P. L., Romani, A., and Favaro, G. (2010). Photochromism and thermochromism of some spirooxazines and naphthopyrans in the solid state and in polymeric film. J. Phys. Chem. C 114 (13), 6123–6131. doi:10.1021/jp9109833
Dueñas-Díez, M., and Pérez-Mercader, J. (2019). How chemistry computes: Language recognition by non-biochemical chemical automata. From finite automata to turing machines. iScience 19, 514–526. doi:10.1016/j.isci.2019.08.007
Friar, J., Goldman, T., and Perez-Mercader, J. (2016). Ubiquity of Benford's law and emergence of the reciprocal distribution. Phys. Lett. A 380 (22-23), 1895–1899. doi:10.1016/j.physleta.2016.03.045
Gentili, P. L., Clementi, C., and Romani, A. (2010). Ultraviolet–visible absorption and luminescence properties of quinacridone–barium sulfate solid mixtures. Appl. Spectrosc. 64 (8), 923–929. doi:10.1366/000370210792080993
Gentili, P. L., Rightler, A. L., Heron, B. M., and Gabbutt, C. D. (2016). Extending human perception of electromagnetic radiation to the UV region through biologically inspired photochromic fuzzy logic (BIPFUL) systems. Chem. Commun. 52 (7), 1474–1477. doi:10.1039/C5CC09290F
Gentili, P. L. (2014). The fuzziness of a chromogenic spirooxazine. Dyes Pigments 110, 235–248. doi:10.1016/j.dyepig.2014.03.024
Gentili, P. L. (2018). The fuzziness of the molecular world and its Perspectives. Molecules 23, 2074. doi:10.3390/molecules23082074
Gentili, P. L. (2021). Establishing a new link between fuzzy logic, neuroscience, and quantum mechanics through bayesian probability: Perspectives in artificial intelligence and unconventional computing. Molecules 26 (19), 5987. doi:10.3390/molecules26195987
Gull, S. F., and Daniell, G. J. (1978). Image reconstruction from incomplete and noisy data. Nature 272 (5655), 686–690. doi:10.1038/272686a0
Haldar, S. (2022). Delving into membrane heterogeneity utilizing fluorescence lifetime distribution analysis. J. Membr. Biol., 1–9. doi:10.1007/s00232-022-00235-z
Hirayama, S., Sakai, Y., Ghiggino, K. P., and Smith, T. A. (1990). The application of a simple deconvolution method to the analysis of stretched exponential fluorescence decay functions. J. Photochem. Photobiol. A Chem. 52 (1), 27–38. doi:10.1016/1010-6030(90)87086-Q
Jaynes, E. T. (1957). Information theory and statistical mechanics. Phys. Rev. 106, 620–630. doi:10.1103/physrev.106.620
Jaynes, E. T. (1988). The relation of bayesian and maximum entropy methods. In: Erickson, G.J., smith, C.R. (eds) maximum-entropy and bayesian methods in science and engineering. Fundam. Theor. Phys. 31, 32. doi:10.1007/978-94-009-3049.0.2
Kirkwood, J. G., and Buff, F. P. (1951). The statistical mechanical theory of solutions. I. J. Chem. Phys. 19 (6), 774–777. doi:10.1063/1.1748352
Krishnamoorthy, G., and Ira, (2001). Fluorescence lifetime distribution in characterizing membrane microheterogeneity. J. Fluoresc. 11, 247–253. doi:10.1023/A:1013943721692
Livesey, A. K., and Brochon, J. C. (1987). Analyzing the distribution of decay constants in pulse-fluorimetry using the maximum entropy method. Biophysical J. 52 (5), 693–706. doi:10.1016/s0006-3495(87)83264-2
Ma, C., Laaksonen, A., Liu, C., Lu, X., and Ji, X. (2018). The peculiar effect of water on ionic liquids and deep eutectic solvents. Chem. Soc. Rev. 47 (23), 8685–8720. doi:10.1039/C8CS00325D
McWhirter, J. G., and Pike, E. R. (1978). On the numerical inversion of the Laplace transform and similar Fredholm integral equations of the first kind. J. Phys. A Math. Gen. 11 (9), 1729–1745. doi:10.1088/0305-4470/11/9/007
Menezes, F., Fedorov, A., Baleizão, C., Valeur, B., and Berberan-Santos, M. N. (2013). Methods for the analysis of complex fluorescence decays: Sum of Becquerel functions versus sum of exponentials. Methods Appl. Fluoresc. 1 (1), 015002. doi:10.1088/2050-6120/1/1/015002
Newman, K. E. (1994). Kirkwood–buff solution theory: Derivation and applications. Chem. Soc. Rev. 23 (1), 31–40. doi:10.1039/CS9942300031
Parkash, O. M., Sharma, P. K., and Mahajan, R. (2008). New measures of weighted fuzzy entropy and their applications for the study of maximum weighted fuzzy entropy principle. Inf. Sci. 178 (11), 2389–2395. doi:10.1016/j.ins.2007.12.003
Penconi, M., Gentili, P. L., Massaro, G., Elisei, F., and Ortica, F. (2014). A triplet—Triplet annihilation based up-conversion process investigated in homogeneous solutions and oil-in-water microemulsions of a surfactant. Photochem. Photobiol. Sci. 13 (1), 48–61. doi:10.1039/c3pp50318f
Pierce, V., Kang, M., Aburi, M., Weerasinghe, S., and Smith, P. E. (2008). Recent applications of Kirkwood–Buff theory to biological systems. Cell biochem. Biophys. 50 (1), 1–22. doi:10.1007/s12013-007-9005-0
Rabanel, J. M., Adibnia, V., Tehrani, S. F., Sanche, S., Hildgen, P., Banquy, X., et al. (2019). Nanoparticle heterogeneity: An emerging structural parameter influencing particle fate in biological media? Nanoscale 11 (2), 383–406. doi:10.1039/C8NR04916E
Singh, S., and Sharma, S. (2019). On generalized fuzzy entropy and fuzzy divergence measure with applications. Int. J. Fuzzy Syst. Appl. 8 (3), 47–69. doi:10.4018/ijfsa.2019070102
Steinbach, P. J. (2002). Inferring lifetime distributions from kinetics by maximizing entropy using a bootstrapped model. J. Chem. Inf. Comput. Sci. 42 (6), 1476–1478. doi:10.1021/ci025551i
Steinbach, P. J., Ionescu, R., and Matthews, C. R. (2002). Analysis of kinetics using a hybrid maximum-entropy/nonlinear-least-squares method: Application to protein folding. Biophysical J. 82 (4), 2244–2255. doi:10.1016/S0006-3495(02)75570-7
Tiecco, M., Di Guida, I., Gentili, P. L., Germani, R., Bonaccorso, C., and Cesaretti, A. (2021). Probing the structural features and the micro-heterogeneity of various deep eutectic solvents and their water dilutions by the photophysical behaviour of two fluorophores. J. Mol. Liq. 331, 115718. doi:10.1016/j.molliq.2021.115718
Keywords: micro-heterogeneous chemical systems, time-resolved signals, maximum entropy method (MEM), molecular information, molecular computing, fuzzy sets, chemical artificial intelligence
Citation: Gentili PL and Perez-Mercader J (2022) Quantitative estimation of chemical microheterogeneity through the determination of fuzzy entropy. Front. Chem. 10:950769. doi: 10.3389/fchem.2022.950769
Received: 23 May 2022; Accepted: 26 July 2022;
Published: 30 August 2022.
Edited by:
Djalal Trache, Ecole Militaire Polytechnique, AlgeriaReviewed by:
Dilip H. Dagade, Shivaji University, IndiaCopyright © 2022 Gentili and Perez-Mercader. This is an open-access article distributed under the terms of the Creative Commons Attribution License (CC BY). The use, distribution or reproduction in other forums is permitted, provided the original author(s) and the copyright owner(s) are credited and that the original publication in this journal is cited, in accordance with accepted academic practice. No use, distribution or reproduction is permitted which does not comply with these terms.
*Correspondence: Pier Luigi Gentili, cGllcmx1aWdpLmdlbnRpbGlAdW5pcGcuaXQ=
Disclaimer: All claims expressed in this article are solely those of the authors and do not necessarily represent those of their affiliated organizations, or those of the publisher, the editors and the reviewers. Any product that may be evaluated in this article or claim that may be made by its manufacturer is not guaranteed or endorsed by the publisher.
Research integrity at Frontiers
Learn more about the work of our research integrity team to safeguard the quality of each article we publish.