
94% of researchers rate our articles as excellent or good
Learn more about the work of our research integrity team to safeguard the quality of each article we publish.
Find out more
ORIGINAL RESEARCH article
Front. Chem., 30 August 2022
Sec. Theoretical and Computational Chemistry
Volume 10 - 2022 | https://doi.org/10.3389/fchem.2022.949461
This article is part of the Research TopicWomen in Chemistry 2022View all 28 articles
Due to the influence of uncontrollable factors such as the environment and instruments, noise is unavoidable in a spectral signal, which may affect the spectral resolution and analysis result. In the present work, a novel spectral denoising method is developed based on the Hilbert–Huang transform (HHT) and F-test. In this approach, the original spectral signal is first decomposed by empirical mode decomposition (EMD). A series of intrinsic mode functions (IMFs) and a residual (r) are obtained. Then, the Hilbert transform (HT) is performed on each IMF and r to calculate their instantaneous frequencies. The mean and standard deviation of instantaneous frequencies are calculated to further illustrate the IMF frequency information. Third, the F-test is used to determine the cut-off point between noise frequency components and non-noise ones. Finally, the denoising signal is reconstructed by adding the IMF components after the cut-off point. Artificially chemical noised signal, X-ray diffraction (XRD) spectrum, and X-ray photoelectron spectrum (XPS) are used to validate the performance of the method in terms of the signal-to-noise ratio (SNR). The results show that the method provides superior denoising capabilities compared with Savitzky–Golay (SG) smoothing.
As a fast, non-destructive analytical technique, spectral analysis plays an increasingly important role in the fields of traditional Chinese medicine (TCM) (Ma et al., 2020), food (Bian et al., 2017; Amendola et al., 2020), bio-medicine (Wu et al., 2021; Yang et al., 2022), and the environment (Sipponen and Osterberg, 2019), etc. However, spectra often contain noise from instruments and operational errors. Instrumental noise mainly includes dark noise caused by the thermal effect, photon noise caused by the photon hitting detector, and electronic noise caused by the A/D converter and circuit board error. In addition, non-standard experimental operations can also produce noise (Mishra et al., 2020). The noise could obscure some useful information in the spectra, which results in low resolution and prediction accuracy. Therefore, it is essential to remove noise from the spectra without unduly reducing the underlying information (Chen et al., 2004).
The commonly used spectral signal denoising methods are Savitzky–Golay (SG) smoothing (Savitzky and Golay, 1964) and wavelet transformation (WT) (Shao et al., 2002). SG smoothing is a filtering method based on local polynomial least square fitting in the time domain, also known as convolution smoothing, which has been developed from the moving average method (Zhang et al., 2019). The SG smoothing is a weighted average method that emphasizes the role of the center point (Chu X. L. et al., 2022). A symmetric window of i = 2ω+1 is used, where i and ω are the points of the moving window (i.e., window size) and half window width, respectively. The smoothed value at wavelength k is
where hi is the smoothing coefficient, which can be obtained by polynomial fitting based on the least square. H is the normalized factor
To overcome the drawbacks of WT, Huang et al. (1998) introduced the Hilbert–Huang transform (HHT), which includes empirical mode decomposition (EMD) and Hilbert transform (HT). EMD can decompose any complex signal into a finite number of intrinsic modal function components (IMFs) and a residual (Bian et al., 2016). Compared with WT, the decomposition of EMD does not require any predefined basis function, which is adaptive and can be applied to any signal (Wang et al., 2018; Yao et al., 2019). Then, HT is performed on each IMF, and their corresponding instantaneous frequencies can be obtained (Peng et al., 2005). HHT denoising has been successfully used in fault diagnosis (Jin et al., 2015; Fan et al., 2022), speech recognition (Krishna and Ramaswamy, 2017), biomedical signal (Lin and Zhu, 2012; Chen et al., 2021), geophysics (Tang et al., 2015; Chen et al., 2017), and so on. However, spectral denoising by HHT is seldom used in analytical chemistry. Moreover, previous studies have determined the cut-off point between noise and useful signal by observing IMF components. However, it is difficult to distinguish. Therefore, it is crucial to determine the cut-off point between high and low frequencies.
In this research, an effective method based on HHT and F-test is proposed to eliminate the noise from the noisy spectral signal. Initially, EMD is introduced to decompose the original spectrum. A series of IMFs from high to low frequencies are obtained. Then, HT is applied to each IMF to obtain instantaneous frequencies. The mean instantaneous frequency combined with the F-test is used to determine the cut-off point between noise components and non-noise ones. Artificially chemical noised signal, X-ray diffraction (XRD) spectrum, and X-ray photoelectron spectrum (XPS) were used to verify the effectiveness and feasibility of the proposed method. The performance of the method is evaluated by the SNR and compared with SG smoothing.
EMD is a new adaptive spectral decomposition method. Through a sifting process, EMD can decompose spectra into a certain number of IMFs and a residual. With the increase in IMF orders, the degree of oscillation becomes lower and lower (Bian et al., 2017). The flow chart of the sifting process of EMD is shown in Figure 1.
First, in the sifting process for the spectrum, all local maxima and minima of the original spectrum x are connected to form upper and lower envelopes by cubic spline lines, respectively. Then, the mean values m of the two envelopes are computed by the simple average. Subsequently, component h is computed by which the difference between the original spectrum x and mean values m can be found. Whether h is an IMF by definition is determined. It is worth noting that the IMFs satisfy two conditions. One is that in the whole data set, the number of extreme and zero-crossings must either be the same or different at most by one. The other is that at any point, the mean value of the upper and lower envelopes is zero (Sun et al., 2006). If h does not meet the IMF definition, h, as a new cycle performs the abovementioned operations until an IMF is obtained. After determining an IMF component, the component h is subtracted from the spectrum x to get the residual r, and whether the residual r becomes a monotone function is judged. Finally, the sifting process ends till the residue contains no more than one extreme.
Although the oscillations decrease with the increase of IMF orders, it is difficult to know the frequency value of the IMF itself. HT is introduced to calculate the instantaneous frequency of each IMF (Li et al., 2016).
For a signal x(τ), its Hilbert transform H(t) is defined as
Eq. 2 defines HT as the convolution of x(τ) with 1/t. Therefore, HT emphasizes the local properties of x(τ). Then, P indicates the Cauchy principal value of the singular integral to avoid singularities at
With this definition, x(τ) and H(t) form the complex conjugate pair, and an analytic signal, Z(t), is obtained,
in which,
where a(t) is the instantaneous amplitude of x(τ), which can reflect the change of energy of x(τ) with t. θ(t) is the instantaneous phase of x(τ), and the instantaneous frequency ω(t) of signal x(τ) can be obtained as follows,
A novel method is proposed for spectral denoising based on EMD and HT. EMD is used to decompose the original spectrum into mono-component IMFs with different frequencies. HT is combined with F-test to determine the cut-off point of IMFs between noise components and non-noise ones. The denoising process of the method is shown in Figure 2. The corresponding MATLAB code and datasets can be downloaded from the website https://github.com/bianxihui/chemometrics-matlab-HHT-with-F-test. The details could be described as follows.
1) The original spectrum x is decomposed into a finite and often small number of frequency components containing n IMFs and a residue r by EMD. The low-order IMFs correspond to the high-frequency components and vice versa.
2) HT is applied to each IMF component and r to calculate their corresponding instantaneous frequency f1 f2 … fn fn+1 by using Eqs 2 and 5, 6. Meanwhile, mean and standard deviations of f1 f2 … fn fn+1 are obtained.
3) The cut-off point k is judged by Eq. 7,
where SDk and SDk+1 are the standard deviation of fn+1, fn … f2 f1, and Fk is the ratio of (SDk)2 to (SDk+1)2. The significant difference of Fk is determined by the F-test with a 99.95% confidence interval. The degrees of freedom are set to 2 and 4, respectively. Furthermore, the F-test is being applied to distinguish a significant difference between the kth and (k+1)-th SD of fs. When Fk has a significant difference, k is judged as the cut-off point.
4) IMF1, IMF2, and IMFk are the noising components that are deleted. The denoising spectrum is reconstructed by summing IMFk+1, IMFk+2, IMFn, and r.
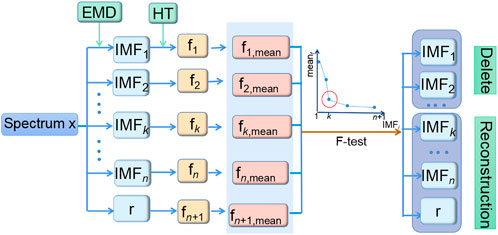
FIGURE 2. Flowchart of the spectral denoising method based on Hilbert–Huang transform combined with the F-test.
The artificially chemical noised signal, XRD spectrum, and XPS spectrum are used to evaluate the performance of the proposed method. The artificially chemical noised signal is shown in Figure 3A, which is composed of 501 variables recorded in the range of 1–501, with a digitization interval of 1. It contains an artificially chemical signal with random noise in which the pure artificially chemical signal y1 is produced by the Gaussian function represented by Eq. 8, as shown in Figure 3B.
The noise signal y2 is added by Eq. 9.
where p represents the number of variables of an artificially chemical signal, that is, 501 values are generated. Moreover, randn generates values from a normal distribution with mean 1 and standard deviation 1, as shown in Figure 3C. The artificially chemical noised signal y = y1+y2.
The spectrum from the study by Wang et al. is measured on an X-ray diffractometer (D/MAX-RB, Japan) for catalyst materials (Fe/SCN) (Wang et al., 2021; Chu Y. Y et al., 2022). The diffraction angle range is 20–80°, the interval is 0.02°, and there are 3,001 variables.
The spectrum from the study by Chu et al. is measured on an X-ray photoelectron spectrometer (PHI 5700) for catalyst materials (FeNiOS-NS) (Chu Y. Y. et al., 2022). The binding energy is 700.08–740.08 eV, the interval is 0.1 eV, and there are 400 variables.
Figure 4 shows the original spectrum of XRD and XPS. By visual inspection, in Figure 4A, the spectral noise distribution is uniform, and the peak appears at the diffraction angle of 40–50 degrees. In Figure 4B, the spectrum contains sharp noise, which covers the peaks. Therefore, it is necessary to remove the useless noise and retain the useful peaks.
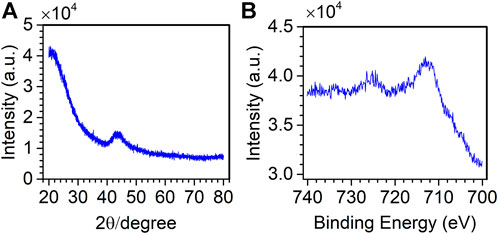
FIGURE 4. XRD spectrum of the Fe/SCN catalyst (A) and the XPS spectrum of the FeNiOS-NS catalyst (B).
Based on the self-adaption and frequency decomposition superiorities, EMD is introduced to decompose the original artificially chemical noised signal. Figure 5A shows the decomposition result of EMD for an artificially chemical noised signal. The original spectrum is decomposed into eight IMFs (IMF1–IMF8) and an r. It is clear that the oscillation frequency decreases as the order of IMF becomes larger. By visual inspection, IMF1–IMF4 are obvious noise components with little information, while an r is the low-frequency components, which are extremely slow. However, it is difficult to determine whether IMF5 is a noise component or not.
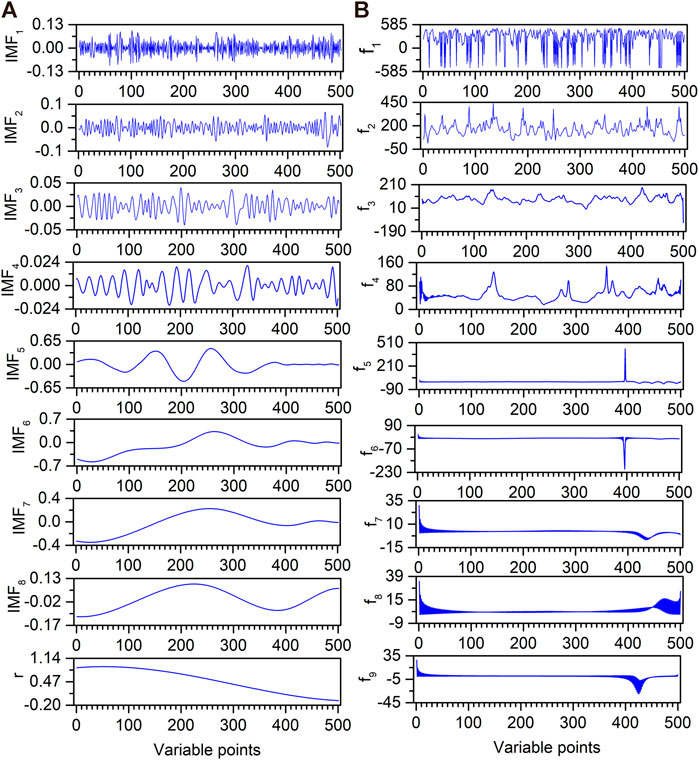
FIGURE 5. EMD decomposition results (A) and their corresponding instantaneous frequencies (B) for artificially chemical noised signal.
Different IMF components have different frequencies, and HT can be used to calculate their instantaneous frequencies. The HT results for IMFs of artificially chemical noised signals are shown in Figure 5B. The f1 contains a large number of peaks. With the increase of the f order, the number of peaks gradually decreases. Although the total variation range of the instantaneous frequency becomes smaller with the increase of the f order, the instantaneous frequency value for each variable is different for the same f order. Thus, the mean instantaneous frequencies of fn+1, fn, … f1 are calculated to observe the trends in frequencies. Meanwhile, the standard deviations of fn+1, fn, … f1 are further calculated for evaluating the noising degree of IMFs. As shown in Figure 6, the mean and standard deviation of f1–f4 are much higher than those of f5–f9. Furthermore, the mean of f5–f9 tends to be flat, and the standard deviation of f5–f9 is relatively low. Subsequently, IMF4 is judged as the cut-off point by the F-test. Therefore IMF1–IMF4 are deleted as noise, and IMF5–IMF8 and an r are reconstituted as useful signals.
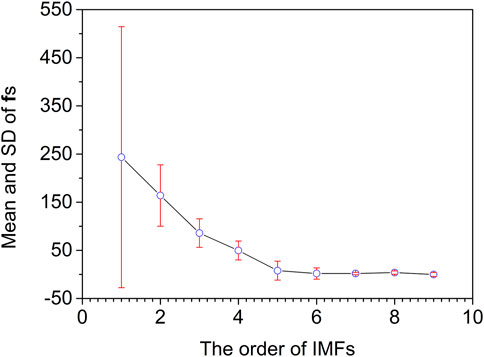
FIGURE 6. Mean and standard deviation of instantaneous frequencies for artificially chemical noised signal.
To better evaluate the performance of the proposed method, SG smoothing applied to the artificially chemical noised signal denoising is compared with that of the proposed method, and SG smoothing window size is selected as 13. The comparison between the proposed method and the SG smoothing denoising results are shown in Figure 7. It is obvious from the figure that the spectrum is smoother and the peaks are more obvious after denoising by the proposed method. In order to illustrate quantitatively the superiority of the proposed method, the SNR of the two methods is calculated, where the SNR of the proposed method and SG smoothing is 22.59 and 21.60, respectively. It can be seen that compared with SG smoothing denoising, the SNR of the proposed method of denoising is improved and the denoising effect is more ideal.
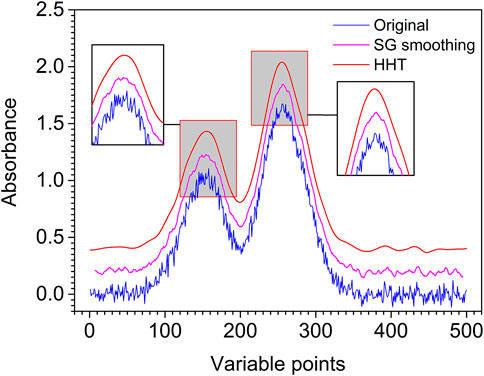
FIGURE 7. Original (blue line), SG smoothing (pink line), and HHT denoising (red line) artificially chemical noised signal.
To compare and verify the denoising effect of the proposed denoising method on the actual spectrum, noisy XRD and XPS spectra were selected for denoising. Figure 8A depicts the decomposition result of EMD for an XRD spectrum. The original spectrum is decomposed into eight IMFs (IMF1–IMF8) and an r. It is difficult to determine whether IMF5 and IMF6 are noise components or not by visual inspection. The instantaneous frequency of each IMF is obtained by HT, as shown in Figure 8B. With the increase of the f order, the number of peaks gradually decreases. Figure 9A depicts the EMD results of an XPS spectrum which is decomposed into six IMFs (IMF1–IMF6) and an r. The corresponding frequencies fs are calculated in Figure 9B. Similarly, whether IMF4 is a noise component or not, cannot be determined.
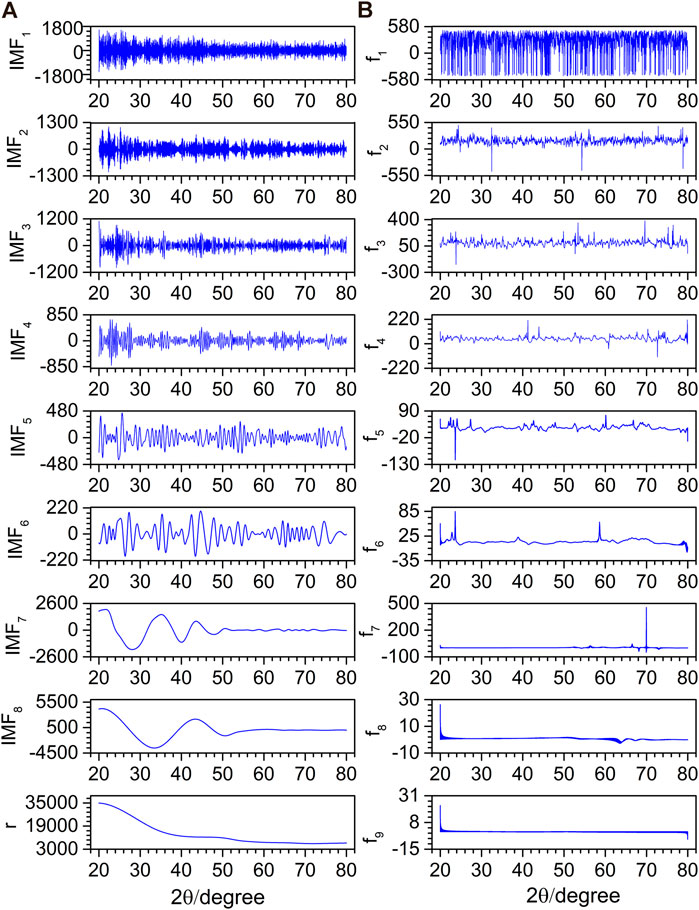
FIGURE 8. EMD decomposition results (A) and their corresponding instantaneous frequencies (B) for the XRD spectrum.
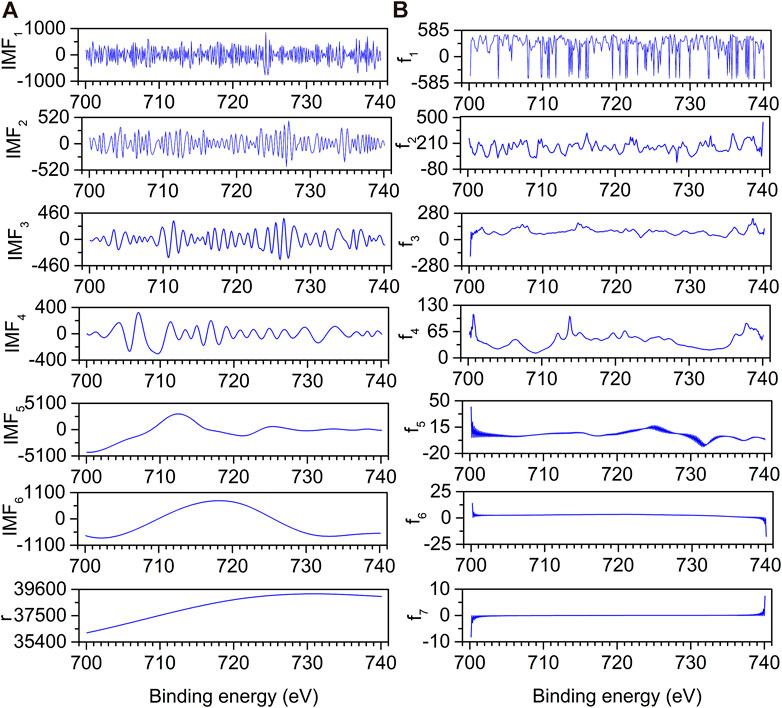
FIGURE 9. EMD decomposition results (A) and their corresponding instantaneous frequencies (B) for XPS spectrum.
The mean and standard deviation of the f order for XRD and XPS spectra are calculated. As shown in Figure 10A, for the XRD spectrum, with the increase of IMF orders, the mean instantaneous frequency of f first decreases and then approaches being flat. The change in the standard deviation of f is directly proportional to the mean instantaneous frequency. The IMF with a large mean instantaneous frequency has a large standard deviation. Five is determined as the cut-off point by the F-test for the XRD spectrum. IMF6–IMF8 and an r are reconstructed as the denoising XRD spectrum. As shown in Figure 10B, for the XPS spectrum, the variation of the mean and standard deviation of fs is similar to that of the XRD spectrum. Four is determined as the cut-off point by the F-test for the XPS spectrum. IMF5, IMF6, and an r are reconstructed as the denoising XPS spectra.
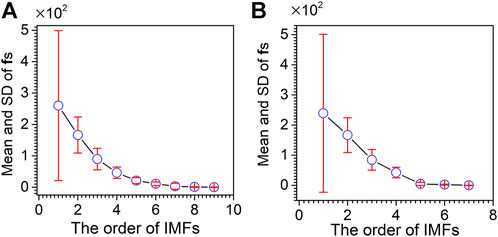
FIGURE 10. Mean and standard deviation of instantaneous frequencies for the XRD spectrum (A) and XPS spectrum (B).
The SG smoothing is also applied to noisy XRD and XPS spectra. 21 and 17 are selected as the window size for the two spectra. Figures 11A,B show the denoising results of XRD and XPS spectra by SG smoothing and the proposed method. It is clear from Figure 11A that SG smoothing cannot remove the noise completely, and some noise is still left in the spectrum. In contrast to SG smoothing, the method proposed in this research not only makes the spectrum exceedingly smooth after denoising, but useful information is also retained. From Figure 11B, XPS spectral noise is also not completely removed by SG smoothing, especially at the three peaks. However, most of the noise is removed by the proposed method while retaining useful information.
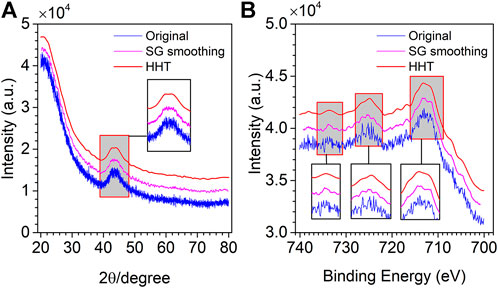
FIGURE 11. Original (blue line), SG smoothing (pink line) and HHT denoising (red line) XRD spectrum (A) and XPS spectrum (B).
A novel denoising method is proposed based on HHT combined with the F-test. EMD is applied to adaptively decompose the spectrum without setting parameters. Then, HT is performed on IMFs to calculate the instantaneous frequencies. In addition, mean instantaneous frequencies are combined with the F-test as the criterion for distinguishing noise components and non-noise ones. It is concluded that the proposed denoising method is valid by noise removal for the artificially chemical noised signal, XRD, and XPS spectra. Moreover, compared with SG smoothing, the proposed method shows superiority both in observation and the SNR.
The raw data supporting the conclusions of this article will be made available by the authors, without undue reservation.
XB: project administration, supervision, validation, writing—review and editing, and funding acquisition. ML: methodology, software, visualization, and writing—original draft. YC: investigation, data curation, and validation. PL: supervision, resources, and writing—review, and editing. XT: funding acquisition, resources, and supervision.
This study is supported by the Key Lab of Process Analysis and Control of Sichuan Universities (No. 2020001) and the Opening Foundation of State Key Laboratory of Plateau Ecology and Agriculture (No. 2021-KF-07).
The authors declare that the research was conducted in the absence of any commercial or financial relationships that could be construed as a potential conflict of interest.
All claims expressed in this article are solely those of the authors and do not necessarily represent those of their affiliated organizations, or those of the publisher, the editors, and the reviewers. Any product that may be evaluated in this article, or claim that may be made by its manufacturer, is not guaranteed, or endorsed by the publisher.
Amendola, L., Firmani, P., Bucci, R., Marini, F., and Biancolillo, A. (2020). Authentication of sorrento walnuts by NIR spectroscopy coupled with different chemometric classification strategies. Appl. Sci. (Basel). 10 (11), 4003. doi:10.3390/app10114003
Bian, X. H., Chen, D., Cai, W. S., Grant, E., and Shao, X. G. (2011). Rapid determination of metabolites in bio-fluid samples by Raman spectroscopy and optimum combinations of chemometric methods. Chin. J. Chem. 29 (11), 2525–2532. doi:10.1002/cjoc.201180425
Bian, X. H., Li, S. J., Lin, L. G., Tan, X. Y., Fan, Q. J., and Li, M. (2016). High and low frequency unfolded partial least squares regression based on empirical mode decomposition for quantitative analysis of fuel oil samples. Anal. Chim. Acta 925, 16–22. doi:10.1016/j.aca.2016.04.029
Bian, X. H., Zhang, C. X., Liu, P., Wei, J. F., Tan, X. Y., Lin, L. G., et al. (2017). Rapid identification of milk samples by high and low frequency unfolded partial least squares discriminant analysis combined with near infrared spectroscopy. Chemom. Intell. Lab. Syst. 170, 96–101. doi:10.1016/j.chemolab.2017.09.004
Chen, D., Cai, W. S., Shao, X. G., and Su, Q. (2004). A background and noise elimination method for quantitative calibration of near infrared spectra. Anal. Chim. Acta 511 (1), 37–45. doi:10.1016/j.aca.2004.01.042
Chen, D., Chen, Z. W., and Grant, E. (2011). Adaptive wavelet transform suppresses background and noise for quantitative analysis by Raman spectrometry. Anal. Bioanal. Chem. 400 (2), 625–634. doi:10.1007/s00216-011-4761-5
Chen, L. L., Wang, C. Y., Chen, J. J., Xiang, Z. J., and Hu, X. (2021). Voice disorder identification by using Hilbert-Huang transform (HHT) and K nearest neighbor (KNN). J. Voice 35 (6), 932.e1–932.e11. doi:10.1016/j.jvoice.2020.03.009
Chen, Y. K., Zhou, Y. T., Chen, W., Zu, S. H., Huang, W. L., and Zhang, D. (2017). Empirical low-rank approximation for seismic noise attenuation. IEEE Trans. Geosci. Remote Sens. 55 (8), 4696–4711. doi:10.1109/TGRS.2017.2698342
Chu, X. L., Huang, Y., Yun, Y. H., and Bian, X. H. (2022). “Spectral preprocessing methods” in chemometric methods in analytical spectroscopy technology.. Springer, Singapore Press, 111–168.
Chu, Y. Y., Zhang, X. X., Deng, B. H., Wang, K. X., and Tan, X. Y. (2022). A facile method to synthesize 3D nanosheets of Fe/S doped α-Ni(OH)2 as an electrocatalyst for improved oxygen evolution reaction. Nanotechnology 33 (40), 405605. doi:10.1088/1361-6528/ac5aeb
Fan, M. L., Cai, W. S., and Shao, X. G. (2017). Investigating the structural change in protein aqueous solution using temperature-dependent near-infrared spectroscopy and continuous wavelet transform. Appl. Spectrosc. 71, 472–479. doi:10.1177/0003702816664103
Fan, M., Xia, J. L., Meng, X. Y., and Zhang, K. (2022). Single-phase grounding fault types identification based on multi-feature transformation and fusion. Sensors 22 (9), 3521. doi:10.3390/s22093521
Huang, N. E., Sheng, Z., Long, S. R., Wu, M. L. C., Shih, H. H., Zheng, Q. N., et al. (1998). The empirical mode decomposition and the Hilbert spectrum for nonlinear and non-stationary time series analysis. P. Roy. Soc. A-Math Phy. 454, 903–995. doi:10.1098/rspa.1998.0193
Jin, S., Kim, J. S., and Lee, S. K. (2015). Sensitive method for detecting tooth faults in gearboxes based on wavelet denoising and empirical mode decomposition. J. Mech. Sci. Technol. 29 (8), 3165–3173. doi:10.1007/s12206-015-0715-8
Krishna, P. K. M., and Ramaswamy, K. (2017). Single channel speech separation based on empirical mode decomposition and Hilbert transform. IET signal Process. 11 (5), 579–586. doi:10.1049/iet-spr.2016.0450
Le Van Quyen, M, Foucher, J., Lachaux, J. P., Rodriguez, E., Lutz, A., Martinerie, J., et al. (2001). Comparison of Hilbert transform and wavelet methods for the analysis of neuronal synchrony. J. Neurosci. Methods 111 (2), 83–98. doi:10.1016/S0165-0270(01)00372-7
Li, H., Xue, G. Q., Zhao, P., Zhong, H. S., and Khan, M. Y. (2016). The hilbert-huang transform based denoising method for the TEM response of a PRBS source signal. Pure Appl. Geophys. 173 (8), 2777–2789. doi:10.1007/s00024-016-1308-x
Lin, C. F., and Zhu, J. D. (2012). Hilbert-huang transformation-based time-frequency analysis methods in biomedical signal applications. Proc. Inst. Mech. Eng. H. 226 (H3), 208–216. doi:10.1177/0954411911434246
Ma, L. J., Liu, D. H., Du, C. Z., Lin, L., Zhu, J. Y., Huang, X. G., et al. (2020). Novel NIR modeling design and assignment in process quality contral of honeysuckle flower by QbD. Spectrochimica Acta Part A Mol. Biomol. Spectrosc. 242, 118740. doi:10.1016/j.saa.2020.118740
Mishra, P., Biancolillo, A., Roger, J. M., Marini, F., and Rutledge, D. N. (2020). New data preprocessing trends based on ensemble of multiple preprocessing techniques. TrAC Trends Anal. Chem. 132, 116045. doi:10.1016/j.trac.2020.116045
Peng, Z. K., Tse, P. W., and Chu, F. L. (2005). An improved Hilbert-Huang transform and its application in vibration signal analysis. J. Sound. Vib. 286 (1-2), 187–205. doi:10.1016/j.jsv.2004.10.005
Savitzky, A., and Golay, M. J. E. (1964). Smoothing and differentiation of data by simplified least squares procedures. Anal. Chem. 36, 1627–1639. doi:10.1021/ac60214a047
Shao, L. M., Lin, X. Q., and Shao, X. G. (2002). A wavelet transform and its application to spectroscopic analysis. Appl. Spectrosc. Rev. 37 (4), 429–450. doi:10.1081/ASR-120016391
Shao, X. G., Cui, X. Y., Wang, M., and Cai, W. S. (2019). High order derivative to investigate the complexity of the near infrared spectra of aqueous solutions. Spectrochimica Acta Part A Mol. Biomol. Spectrosc. 213, 83–89. doi:10.1016/j.saa.2019.01.059
Sipponen, M. H., and Osterberg, M. (2019). Aqueous ammonia pre-treatment of wheat straw: process optimization and broad spectrum dye adsorption on nitrogen-containing lignin. Front. Chem. 7, 545. doi:10.3389/fchem.2019.00545
Sun, Z. Q., Zhou, J. M., and Zhou, P. (2006). Application of Hilbert-Huang transform to denoising in vortex flowmeter. J. Cent. South Univ. Technol. 13 (5), 501–505. doi:10.1007/s11771-006-0076-7
Tang, J. T., Ren, Z. Y., Zhou, C., Zhang, L. C., Yuan, Y., and Xiao, X. (2015). Frequency-domain electromagnetic methods for exploration of the shallow subsurface: a review. Chin. J. Geophys-Ch 58 (8), 2681–2705. doi:10.6038/cjg20150807
Wang, K. X., Chu, Y. Y., Zhang, X. X., Zhao, R. C., and Tan, X. Y. (2021). Facile method to synthesize a high-activity S-doped Fe/SNC single-atom catalyst by metal-organic frameworks for oxygen reduction reaction in acidic medium. Energy Fuels 35 (24), 20243–20249. doi:10.1021/acs.energyfuels.1c03198
Wang, R. K., Sun, S. G., Guo, X. H., and Yan, D. (2018). EMD threshold denoising algorithm based on variance estimation. Circuits Syst. Signal Process. 37 (12), 5369–5388. doi:10.1007/s00034-018-0819-3
Wu, X. Y., Bian, X. H., Lin, E., Wang, H. T., Guo, Y. G., and Tan, X. Y. (2020). Weighted multiscale support vector regression for fast quantification of vegetable oils in edible blend oil by ultraviolet-visible spectroscopy. Food Chem. 342, 128245. doi:10.1016/j.foodchem.2020.128245
Wu, Z. X., Jiang, D. J., Hsieh, C. W., Chen, G. Y., Liao, B., Cao, D. S., et al. (2021). Hyperbolic relational graph convolution networks plus: a simple but highly efficient QSAR-modeling method. Brief. Bioinform. 22 (5), bbab112. doi:10.1093/bib/bbab112
Yang, X., Wu, Z. Y., Ou, Q. H., Qian, K., Jiang, L. Q., Yang, W. Y., et al. (2022). Diagnosis of lung cancer by FTIR spectroscopy combined with Raman spectroscopy based on data fusion and wavelet transform. Front. Chem. 10, 810837. doi:10.3389/fchem.2022.810837
Yao, Z. J., Liu, X. J., Yang, W. J., Wang, C. C., and Chang, S. P. (2019). A coarse-to-fine denoising method for dynamic calibration signals of pressure sensor based on adaptive mode decompositions. Measurement 163, 107935–171321. doi:10.1016/j.measurement.2020.107935
Zhang, G. W., Peng, S. L., Cao, S. Y., Zhao, J., Xie, Q., Han, Q. J., et al. (2019). A fast progressive spectrum denoising combined with partial least squares algorithm and its application in online Fourier transform infrared quantitative analysis. Anal. Chim. Acta. 1074, 62–68. doi:10.1016/j.aca.2019.04.055
Keywords: denoising, Hilbert–Huang transform, empirical mode decomposition, x-ray diffraction, x-ray photoelectron spectrum, f-test
Citation: Bian X, Ling M, Chu Y, Liu P and Tan X (2022) Spectral denoising based on Hilbert–Huang transform combined with F-test. Front. Chem. 10:949461. doi: 10.3389/fchem.2022.949461
Received: 21 May 2022; Accepted: 01 August 2022;
Published: 30 August 2022.
Edited by:
Ganna Gryn’ova, Heidelberg University, GermanyReviewed by:
Wensheng Cai, Nankai University, ChinaCopyright © 2022 Bian, Ling, Chu, Liu and Tan. This is an open-access article distributed under the terms of the Creative Commons Attribution License (CC BY). The use, distribution or reproduction in other forums is permitted, provided the original author(s) and the copyright owner(s) are credited and that the original publication in this journal is cited, in accordance with accepted academic practice. No use, distribution or reproduction is permitted which does not comply with these terms.
*Correspondence: Xihui Bian, YmlhbnhpaHVpQDE2My5jb20=
Disclaimer: All claims expressed in this article are solely those of the authors and do not necessarily represent those of their affiliated organizations, or those of the publisher, the editors and the reviewers. Any product that may be evaluated in this article or claim that may be made by its manufacturer is not guaranteed or endorsed by the publisher.
Research integrity at Frontiers

Learn more about the work of our research integrity team to safeguard the quality of each article we publish.