 Iqbaal Abdurrokhman
 Anna Martinelli
95% of researchers rate our articles as excellent or good
Learn more about the work of our research integrity team to safeguard the quality of each article we publish.
Find out more
ORIGINAL RESEARCH article
Front. Chem. , 01 July 2022
Sec. Green and Sustainable Chemistry
Volume 10 - 2022 | https://doi.org/10.3389/fchem.2022.915683
This article is part of the Research Topic Ionic liquids and Deep Eutectic Solvents: two contrasting options or opposite sides of the same coin? View all 5 articles
Binary mixtures based on the two protic ionic liquids 1-ethylimidazolium triflate ([C2HIm][TfO]) and 1-ethylimidazolium bis(trifluoromethanesulfonyl)imide ([C2HIm][TFSI]) have been investigated, with focus on phase behavior, ionic conductivity, and intermolecular interactions as a function of composition (χTFSI indicating the mole fraction of the added compound). It is found that on addition of [C2HIm][TFSI] to [C2HIm][TfO], the melting temperature is first decreased (0
The field of proton exchange membrane (PEM) fuel cells is experiencing a time of revitalized interest and intense research (Jiao et al. (2021); Gittleman et al. (2021)). Progresses with focus on electrodes, catalysts, and electrolytes have been made to improve the performance of the fuel cell device (Wang et al. (2018; 2020)). In the case of PEM fuel cells, the proton-conducting membrane has a crucial role and usually consists of a solid/liquid hybrid material. The state-of-the-art material is a hydrated, perfluorinated polymer that performs best under hydrated conditions and at relatively low temperatures (below 80°C to avoid water evaporation) (Wong et al. (2019); Karimi et al. (2019)). However, materials able to conduct protons under anhydrous conditions and at higher operating temperatures (i.e., above at least 120°C) are desired in order to fit a broader range of applications. In this context, ionic liquids are prominent candidates as new, robust ion- and proton-conducting materials, which can provide good thermal stability as well as high ionic conductivity at anhydrous conditions (Greaves and Drummond (2015)).
Ionic liquids, also known as low-temperature molten salts, are ideally composed of only ions, typically bulky and asymmetric organic cations and anions such that a neat ion packing is prevented and the melting temperature is low. To be classified as ionic liquids, the melting temperature must, by definition, be lower than 100°C. The first ionic liquid was reported in 1914 by Paul Walden (Walden (1914)), who synthesized the archetypical protic ionic liquid ethylammonium nitrate. Since then, and in particular, during the last 20–30 years, the research on ionic liquids has exponentially increased (Lei et al. (2017)) and several sub-classes of ionic liquids are now recognized, such as protic and aprotic ionic liquids, task-specific ionic liquids, and polyionic liquids. In this quickly expanding field, understanding the structure–performance relationship has become pivotal to find pure ionic liquids, hybrid material concepts, or liquid mixtures suitable for specific applications and processes. Ionic liquids have revealed to be multiscale materials, and their behavior in the tiny space of nanopores or nanochannels has become an important field of research, in particular with focus on wall interactions that can fundamentally change the physicochemical properties of nanoconfined ionic liquids (Garaga et al. (2018); Zhang et al. (2017)). Finally, in many chemical reactions and processes, ionic liquids act as efficient solvents and/or catalysts (Dai et al. (2021); Glinska et al. (2021)).
The dual property of high ionic conductivity and low vapor pressure is particularly interesting for using ionic liquids as high-temperature electrolytes in, e.g., fuel cells, but also in supercapacitors and lithium or sodium ion batteries (Stettner and Balducci (2021); Watanabe et al. (2017)). Recent research has also focused on binary mixtures of ionic liquids, either protic or aprotic, and on the possibility of tuning physicochemical properties to target a specific application (Chatel et al. (2014)). A pioneering study of the mixtures of ionic liquids having a common cation but different anions revealed a dependence of properties (for instance the 1H NMR chemical shift of the most acidic hydrogen atom on the cation) on the size, symmetry, and coordination ability of the mixed anions (D’Anna et al. (2012)). In another study by Yambou et al. (Yambou et al. (2020)), the focus was on mixtures based on aprotic ionic liquids for use in capacitors at low temperatures. The cation was 1-ethyl-3-methylimidazolium, while the three fluorinated anions were FSI−, TFSI−, and BF4−. The authors could identify several low-melting mixtures that could stay liquid down to -90°C, implying a potential use extended to unusually low temperatures. Moreover, based on the Walden plot, all mixtures could be classified as “good ionic liquids”. In particular, the mixtures containing the FSI− and the BF4− anions displayed superior ionicity, which was explained by the negligible increase in viscosity opposite to the case of mixing with the TFSI− anion instead. Moreover, Kunze et al. (Kunze et al. (2010)) have investigated a number of mixtures based on pyrrolidinium cations and, for instance, FSI− or TFSI− as the anions, finding that the matrix for crystallization is strongly defined by the anions (pure or mixed) hence determining the phase behavior observed by DSC. Very low melting temperatures could be achieved upon mixing, reaching down to −40°C. On the same line but with focus on protic cations, Fumino and co-workers (Fumino et al. (2015)) have investigated the mixing behavior of the protic ionic liquids triethylammonium methylsulfonate [Et3NH][CH3SO3] and triethylammonium triflate [Et3NH][CF3SO3]. The results obtained by far-infrared spectroscopy and molecular dynamics simulations revealed a deviation from ideal mixing, which was explained by a non-ideal H-bond mixing with highly competing anions. Still, in the context of protic ionic liquid mixtures, Miran et al. (Miran et al. (2014)) have reported a study on mixtures based on diethylmethylammonium hydrogensulfate ([dema][HSO4] and diethylmethylammonium bis(trifluo-romethanesulfonyl)amide ([dema][NTf2]), in which the anions were derived from acids with distinct acidities (i.e. different pKa values). The authors found a lower N-H stretching frequency in [dema][HSO4] than in [dema][NTf2], revealing that the [HSO4]− anion can form stronger hydrogen bonds with the [dema]+ cation via the NH group. Because of the established hydrogen bonds in the mixtures, the authors propose a proton transport mechanism not only by the vehicular mechanism but also including proton hopping (that is, by the Grotthuss mechanism).
Based on these behaviors, protic ionic liquids and mixtures thereof are closely related to deep eutectic solvents (DES) (Smith et al. (2014)), both classes of materials being of interest for the possibility of tuning properties by an adequate choice of the mixed compounds. One important aspect of research has been the suppression of the melting temperature, and another is the enhancement of transport properties for energy applications (Abbott et al. (2021)). Also, both DESs and protic ionic liquids display extended networks of hydrogen bonds (Low et al. (2019)), which are responsible for many of the observed physicochemical properties. In a way, protic ionic liquids can be seen as the link between more conventional aprotic ionic liquids and DESs (Abbott et al. (2021)). Moreover, DESs are easier to prepare and may be cheaper than protic ionic liquids. Nevertheless, the work presented here focuses exclusively on mixing protic ionic liquids, with the studied binary mixtures having in common the protic cation 1-ethylimidazolium. This cation was selected based on the knowledge that imidazolium-based cations result in higher conductivity and lower viscosity than other cations like for instance those derived from pyrrolidinium or piperidinium. Hence, solutions have been prepared by mixing the two protic ionic liquids 1-ethylimidazolium triflate [C2HIm][TfO] and 1-ethylimidazolium bis(trifluoromethylsulfonyl)imide [C2HIm][TFSI]; the two anions TfO− and TFSI− deriving from acids of slightly different acidities (pKa (TfO) = −11.4 and pKa (TFSI) = −12.3 in 1,2-dichloroethane) but also of different size, shape, and symmetry. The TFSI anion is frequently chosen since it typically results in a low-viscosity ionic liquid in combination with many cations; TfO has a related chemical structure but results in a more hydrophilic ionic liquid. Primarily, we have investigated the effect of mixing on phase behavior, ionic conductivity, and strength of intermolecular interactions.
The protic ionic liquids 1-ethylimidazolium triflate [C2HIm][TfO] and 1-ethylimidazolium bis(trifluorome-thylsulfonyl)imide [C2HIm][TFSI] were purchased from Io.Li.Tec GmbH, stored inside a nitrogen-filled glovebox and then used without further purification. The molecular structure of the ions constituting these protic ionic liquids is presented in Figure 1. The two protic ionic liquids were mixed at different ratios, resulting in mixtures with a varying mole fraction, χ, of [C2HIm][TFSI] with χ ranging from 0 to 1. The sample preparation was done inside the glovebox in order to prevent absorption of moisture.
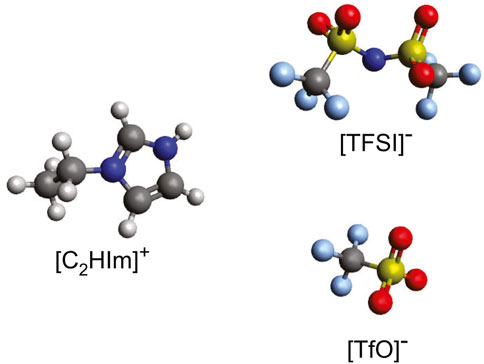
FIGURE 1. Molecular structure of the 1-ethylimidazolium cation (C2HIm+), and of the triflate (TfO−) and bis (trifluoromethylsulfonyl)imide (TFSI−) anions, which are the constituting ions in the two protic ionic liquids investigated. The color code of the atoms is as follows: red, oxygen; gray, carbon; light blue, fluorine; dark blue, nitrogen; and yellow, sulfur.
The phase behavior, with respect to melting temperature, crystallization temperature, and glass transition temperature, was determined using a differential scanning calorimetry (DSC) instrument from Mettler Toledo equipped with STARe software. The samples were prepared to have a mass of ca 5–6 mg and were placed in 40 μl sealed aluminum crucibles. The scanning method included an equilibration time of 1 minute at 60°C, followed by cooling the sample down to −100°C at a cooling rate of 20°C/min and a subsequent heating back to 60°C at a rate of 5°C/min. This procedure was repeated twice to analyze the material’s response to subsequent cycles. The sample preparation was done inside a nitrogen-filled glovebox. The melting temperature (Tm) of all samples was extracted from the minimum of the endothermic peak detected in the DSC curve during the second heating scan.
Infrared spectroscopy: Infrared spectra were collected using an infrared spectrometer from Perkin-Elmer, in the ATR (Attenuated Total Reflection) mode using a single-reflection diamond crystal from Gladi ATR. The spectra were collected to cover the spectral range 400–4,000 cm−1, by 16 cumulative scans and with a resolution of 2 cm−1. Nitrogen gas was flowed over the samples during the entire course of the measurements to avoid uptake of moisture by the ionic liquid.
Raman spectroscopy: Raman spectra were recorded at room temperature using a custom-made cell of stainless steel with the sample contained in an internal glass tube. The sample was loaded into this cell inside the glovebox. The Raman spectra were recorded using an InVia Reflex spectrometer from Renishaw, covering the spectral range 100–4,000 cm−1. The 785 nm laser was used as the excitation source, setting the power to approximately 10 mW. The spectra were obtained by averaging over 5 scans with an exposure time of 10 s each. The resolution, using a grating with 1,200 grooves per mm, was 2 cm−1.
The ionic conductivity was measured using a broadband dieletric spectroscopy (BDS) instrument from Novocontrol equipped with a cryo-cooling system. The temperature was varied from 20 to 140°C, with a temperature stabilization time of 600 s. The frequency window was chosen to cover the range from 10–1–107 Hz. The measurements were done using a low alternating voltage of 10 mV. The samples were placed in a sandwich type of electrochemical cell between two stainless steel electrodes, while the dimensions of the analyzed liquid were kept constant using a Teflon spacer with a diameter of 5 mm and a thickness of 3.1 mm.
The phase behavior of materials can be appropriately studied using methods for thermal analysis, such as differential scanning calorimetry also known as DSC (Gabbott (2008)). By DSC, first-order phase transitions like melting and crystallization as well as glass transitions can be detected and assigned to a specific temperature. In principle, during a DSC measurement, the response of the investigated material as heat is exchanged is measured as a function of temperature (by comparing to the case of an empty cell exposed to the same heating/cooling conditions). This analysis enables distinguishing between exothermic events (e.g., crystallization) and endothermic events (e.g., melting), while a glass transition will appear as a step change in the baseline (i.e. a change in heat capacity). The DSC thermograms recorded for pure protic ionic liquids as well as their binary mixtures during cooling and heating scans are presented in Figure 2 (more detailed information on these DSC scans is available in Supplementary Figure S1). This figure shows that, except for minor shifts, the DSC traces are well reproduced over subsequent cycles. Figure 2 also shows that mixing [C2HIm][TFSI] with [C2HIm][TfO] has a profound influence on the observed phase behavior.
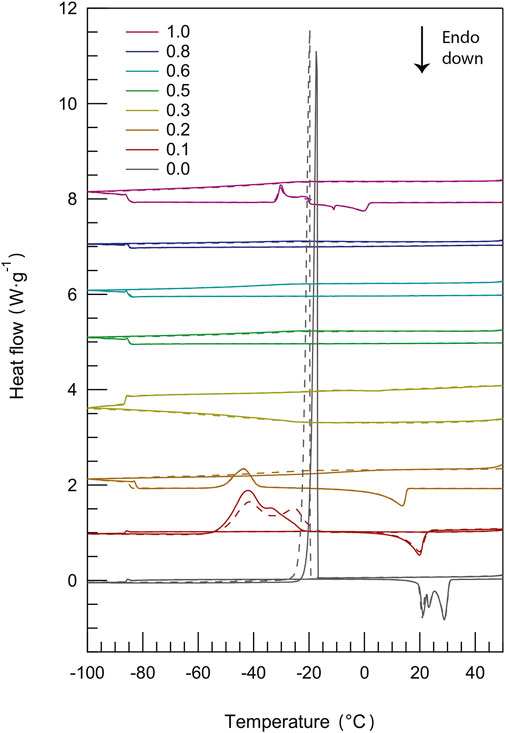
FIGURE 2. Differential scanning calorimetry (DSC) curves recorded during cooling and heating scans (two cycles) for all protic ionic liquid mixtures, with the content of [C2HIm][TFSI] increasing from bottom (χ = 0.0) to top (χ = 1.0).
The pure protic ionic liquid [C2HIm][TfO] (χ = 0.0) has distinct crystallization (upon cooling) and melting (upon heating) transitions, the latter showing multiple and proximate endothermic peaks. This feature had previously been observed by Yaghini et al. (Yaghini et al. (2015)) for the same ionic liquid and can be attributed to the presence of polymorphic phases (i.e. of energetically close crystal structures). The fact that multiple peaks are not resolved during crystallization is due to the faster rate used upon cooling. In the phase behavior of an ionic liquid of similar structure, that is imidazolium methanesulfonate (Luo et al. (2013)), the multiple endothermic peaks close to melting have been attributed to a plastic crystal phase with some orientational degrees of freedom also involving
Upon further addition of [C2HIm][TFSI] (χ = 0.2), cold crystallization is observed during heating, indicating the unease of the liquid system to form a crystalline structure during cooling. Furthermore, this peak is of lower intensity while the subsequent melting feature is further shifted towards lower temperatures. Still, with reference to the report presented by Gomez et al. (Gomez et al. (2018)), the mixture with χ = 0.2 displays type-three of the phase behavior. The mixture with χ = 0.3 has a DSC trace equivalent to that of the mixture with χ = 0.2, but the peaks associated to the phase transitions (cold crystallization and melting) are of extremely low intensity (see Supplementary Figure S2), and are therefore not visible in the scale used in Figure 2. Interestingly, in the intermediate compositional range where 0.3 < χ ≤ 0.8, no first-order phase transitions are observed. Given this scenario, a glass transition may be expected instead, congruent with type-one of the phase behavior (Gomez et al. (2018)). However, this was not the case in our study, implying that the liquid mixtures remain supercooled in the entire temperature range investigated. Finally, for the pure protic ionic liquid [C2HIm][TFSI] (χ = 1.0) a phase behavior with a cold crystallization directly followed by a broad melting is observed (phase behavior of type-three), as already reported before (Yaghini et al. (2015)). In the case of ionic liquids based on TFSI, the co-existence of two conformations, i.e. the cisoid and the transoid (Martinelli et al. (2011)), must be considered, which results in different cation–anion structural configurations that may contribute to the width of the melting transition. In addition, benchmarking to DSC results previously reported (Yaghini et al. (2016)), the shape of the cold crystallization and melting peaks suggests the presence of tiny amounts of the (unprotonated) base in the nominally pure protic ionic liquid.
As a complement to these qualitative observations, precise melting temperatures (better visualized in the close-up plot of Figure 3A) and the heat of melting have been estimated from an accurate peak fitting analysis (see Supplementary Figure S3 for an example of the applied procedure). Both the melting temperature and the heat of melting decrease monotonically with the addition of [C2HIm][TFSI], at least for χ ≤ 0.3, a trend that reflects intermolecular interactions of decreasing strengths, Figure 3B and Figure 3C. This change may be rationalized by considering the intrinsic properties of the anions, TFSI− being a bulkier anion with a larger charge delocalization than TfO−, hence involved in weaker cation–anion interactions (which is congruent with the melting temperature of pure [C2HIm][TFSI] being lower than that of pure [C2HIm][TfO]). Moreover, in the mixtures, local disorder is increased since multiple types of cation–anion interactions can be established (which involve TFSIcis, TFSItrans, and TfO); in particular, TFSI provides multiple sites for the formation of hydrogen bonds through the four oxygen atoms and the central nitrogen distributed over the larger molecule, while TfO has the–SO3 group as the specific hydrogen bond acceptor site. As a side note, the heat of melting for the neat ionic liquid [C2HIm][TfO] is here estimated to be 66 J/g which, considering the molecular weight of this ionic liquid being equal to 246.21 g/mol, translates into ∼16 kJ/mol, a value that is in accordance with the heat of melting of other related ionic liquids such as, for instance, [C2C1Im][TfO] (∼17 kJ/mol (Valderrama and Cardona (2021)). A gradual decrease of the heat of melting upon addition of a second component to an ionic liquid has previously been observed in a variety of systems, for instance when adding the Li-TFSI salt to [PYR23][TFSI] (Martinelli et al. (2009)), water to [C2HIm][TfO] (Yaghini et al. (2015)), or imidazole to [C2HIm][TFSI] (Yaghini et al. (2016)). On the same line, Elhi et al. (Elhi et al. (2020)) have investigated mixtures of ionic liquids based on the choline cation and different carboxylate anions, reporting several eutectic mixtures. In these mixtures, the melting temperature was considerably lower than that of the pure components (the depression of Tm being as large as 45°C in some cases) and the eutectic behavior was observed at mole fractions of the second component between 0.4 and 0.6. Through this study, the authors observed that a greater depression of the melting point could be achieved by mixing anions of different sizes, e.g. acetate with 2-methylbutyrate. The phase behavior observed in our study for 0.3 < χ ≤ 0.8, with a wide temperature range of the liquidus state and a featureless DSC trace, is similar to that observed in mixtures of [C2HIm][TFSI] and imidazole for mole fractions of imidazole between 0.17 and 0.8, as reported by Yaghini et al. (Yaghini et al. (2016)). Notably, the suppression of crystallization/melting during DSC scans has also been observed upon addition of [C2HIm][TFSI] to either [C2HIm][BF4] or [C2HIm][FSI] (Yambou et al. (2020)).
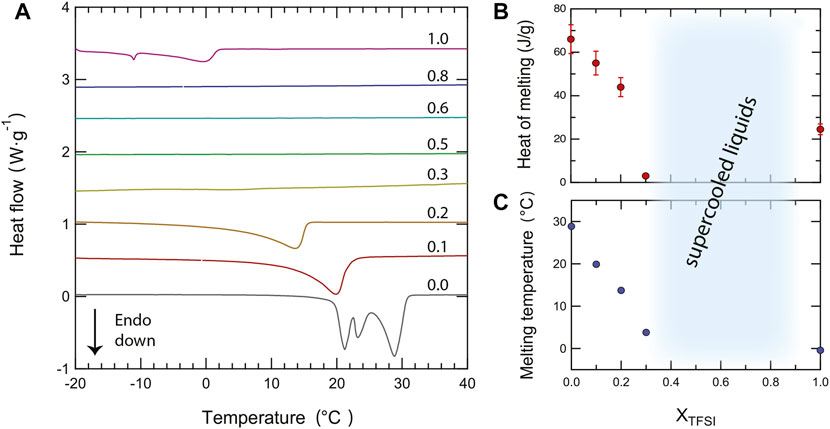
FIGURE 3. Close-up of the differential scanning calorimetry (DSC) curves in the temperature range of the melting transition (−20—40°C) recorded during the second heating scan for all protic ionic liquid mixtures (A). From bottom to top, traces are shown for an increasing amount of the second component [C2HIm][TFSI], given in mole fraction, χ, and ranging from 0 to 1. The compositional dependence of the heat of fusion (B) and of the melting temperature (C) is also shown.
As a further approach to the experimental data, we have tried to model the depression of the melting point using the well known Van’t Hoff relation ΔTm = K⋅i⋅m (Berton et al. (2019)), where K is the cryoscopic constant of the solvent (in this case C2HImTfO), i is the dissociation constant of the solute (in this case C2HImTFSI), and m is the molality (here moles of C2HImTFSI in kilograms of C2HImTfO).1 Figure 4 shows that this model fits very well the experimental data, at least in the molality range where Tm has been detected. Also, assuming that i takes a value of 2 (Berton et al. (2019)) by dissociation into one [C2HIm] cation and one [TFSI] anion, the linear fit of the experimental data returns a cryoscopic constant for C2HImTfO equal to 6.96°C mol−1 kg (obtained from the linear slope, that is K⋅i, equal to 13.918 ± 1.06). For comparison, the cryoscopic constant was found to be equal to 6.25°C mol−1 kg for trifuoroacetic acid (Harris and Milne (1976)). To the best of our knowledge, the cryoscopic constant of ionic liquids has not been reported nor investigated before, wherefore this result may turn to be an interesting input for further thermal analyses of ionic liquid-based mixtures.
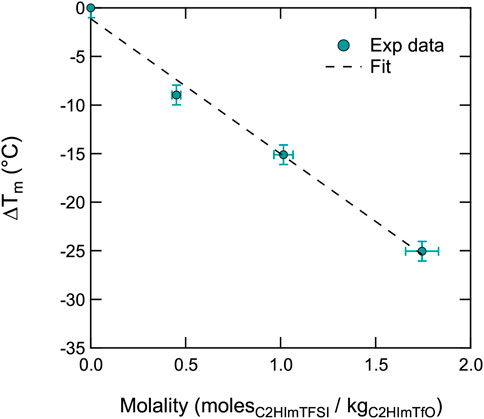
FIGURE 4. Depression of the melting temperature Tm (of [C2HIm][TfO]) as a function of composition (given in molality).
By closer inspection of the DSC traces in the low temperature range, we also found interesting trends for the glass transition temperature, Tg. For certain samples, the glass transition temperature was observed as a clear step change of the baseline during the heating scans, as shown in Figure 5, whereas during cooling, this was not as clear indicating that under the conditions used for fast cooling (20 °C/min), these liquids were supercooled into a non-equilibrium state. The values of Tg were determined from the mid-point of the step change and were found to be in the range between −86 and −82°C. As the inset plot of Figure 5 shows, these values are slightly dependent on composition, decreasing with an increasing content of the protic ionic liquid [C2HIm][TFSI]. This effect is similar to the one observed by Thoms et al. (Thoms et al. (2017)) upon mixing the ionic liquid [BMIM][TFSI] with [BMIM][Cl]. The non-linear change in Tg with composition suggests the more important role of the bulky TFSI anion in determining Tg. In general, an added component that results in a decrease of Tg is called a plasticizer.
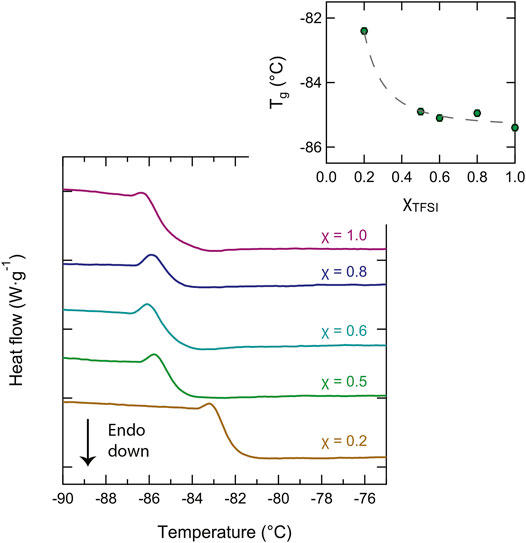
FIGURE 5. Close-up of the DSC traces showing the low-temperature range where the glass transition temperature, Tg, appears. The dependence of Tg on composition is shown in the inset plot.
To conclude, the effect of adding [C2HIm][TFSI] to [C2HIm][TfO] is, at low molar fractions, to decrease the melting temperature in those mixtures that show a solid–liquid phase transition and, at intermediate molar fractions, to generate mixtures with no phase transitions at all, hence offering a wider temperature range of the liquid state. In addition, from the viewpoint of the glass transition Tg, added [C2HIm][TFSI] has a small but measureable plasticizing effect. The most relevant properties achieved from DSC are also given in Table 1. In order to better understand the aspect of intermolecular interactions underpinning these effects, we have used vibrational spectroscopy, as described in more details in the following section.
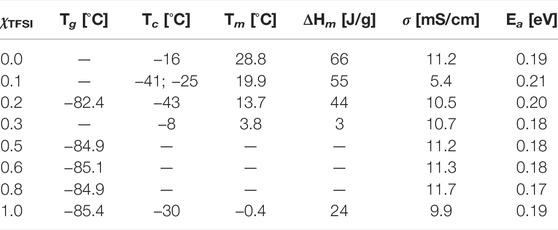
TABLE 1. Temperature of glass transition (Tg), temperature of crystallization (Tc), temperature of melting (Tm), enthalpy of melting (Hm), ionic conductivity (σ) at 60 °C, and activation energy (Ea) of the pure liquids and their binary mixtures as a function of composition (χTFSI).
By vibrational spectroscopy, quantitative and qualitative studies of materials can be performed. The composition and type of intermolecular interactions can be studied, encompassing the strength of hydrogen bonds, presence of ion pairs or ion aggregates, and conformational states. For the specific case of ionic liquids, an extensive review of the use of vibrational spectroscopy has been recently provided by Paschoal et al. (Paschoal et al. (2017)). Although infrared and Raman spectroscopies are usually used in tandem because they probe the same vibrational modes (though filtered by different selection rules), they are based on fundamentally different phenomena; Raman spectra arise from scattered light subsequent to laser–matter interaction while infrared spectra result from absorption (alternatively transmission or reflection) by the matter of light in the infrared spectrum. In this work, vibrational spectroscopy, including Raman and infrared spectroscopies, has been employed to investigate the nature of interactions established between cations and anions within the different liquid mixtures. Figure 6 shows all the infrared spectra in the high frequency region (A) and in the mid-to-low frequency region (B). The spectra are shown after normalization to the mode at 1,580 cm−1 (indicated by an asterisk), which is assigned to the in-plane ring deformations of the imidazolium ring and has shown to be independent of the type of anion associated to the cation (Morais et al. (2022)).
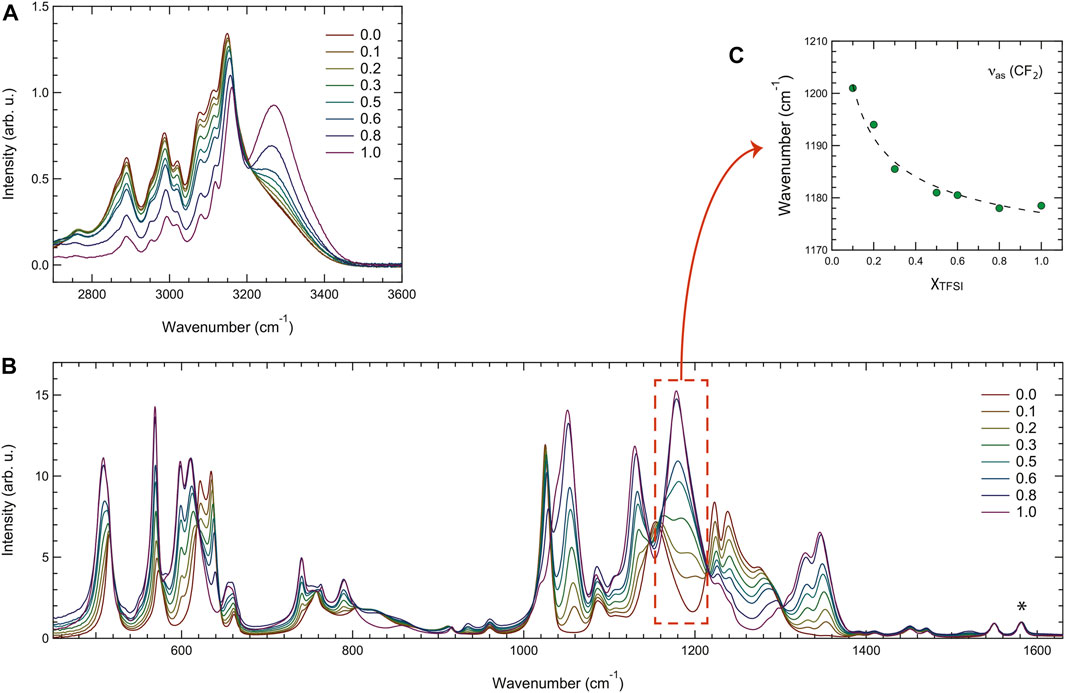
FIGURE 6. Infrared spectra recorded for all the binary mixtures in the high- (A), and mid- and low-frequency ranges (B). The asterisk in the plot (B) indicates the vibrational mode used for normalization. The frequency of the asymmetric stretching mode (νas) in the CF3 group of TFSI as a function of composition is shown in (C).
Figure 6A includes the C-H stretching modes of the ethyl chain (2,700–3,200 cm−1) and the N-H stretching mode of the imidazolium ring (3,200–3,500 cm−1). The latter is distinct and peaked at 3,267 cm−1 for [C2HIm][TFSI], in agreement with a previous spectroscopic investigation (Yaghini et al. (2015)), while for decreasing mole fractions of this ionic liquid, hence approaching the case of pure [C2HIm][TfO], the N-H stretching mode red shifts and broadens considerably. These two simultaneous effects may, at least partly, explain why the whole region of the C-H stretching modes appears enhanced in intensity (as if laying over a higher background). The vibrational modes attributed to C-H stretching do not change significantly with composition, as expected, considering that these groups are not in direct interaction with the anions. The spectral range 1,000–1,700 cm−1 shown in Figure 6B contains many vibrations assigned to the anions and shows intensity changes that can simply be explained by the varying population of TfO− and TFSI− species. Most of these vibrations shift in frequency with composition, one example being the asymmetric stretching mode of CF2 in the CF3 group of TFSI− shown in the plot of Figure 6C. The spectral range 400–700 cm−1, also shown in Figure 6B, contains mainly vibrations assigned to the bending modes of the CF3 and SO2/SO3 groups of the TFSI− and TfO− anions. Even here, intensities change systematically with the composition.
To get a deeper insight of this spectral evolution, an accurate peak-fit analysis has been applied to the recorded infrared spectra in the high frequency range, an example being illustrated in Supplementary Figure S4. The fitting model was chosen from fitting the spectrum of pure [C2HIm][TfO], using the least number of fitting components and keeping the position of all fitting peaks fixed except for the peak describing the N-H stretching, which was free to take any position and width values. Moreover, in the fitted spectral range 2,750–3,600 cm−1 a linear background was assumed. This peak-fit analysis reveals an average blue shift of the N-H stretching frequency with an increasing amount of [C2HIm][TFSI], confirming the hypothesis that [C2HIm]⋅⋅⋅[TFSI] interactions via NH⋅⋅⋅anion hydrogen bonding are weaker than those between [C2HIm] and [TfO]. This hypothesis was further confirmed by theoretical calculations that reveal a NH+⋅⋅⋅O− distance longer for the case of TFSI− (1.95 Å) than TfO− (1.76 Å). However, the NH+⋅⋅⋅O− hydrogen bond has a similar angle in the cases of the two anions, as illustrated in the images of Supplementary Figure S5. As shown in Supplementary Figure S6, the frequency change of the N-H stretching mode with the composition is very close to linear and, given the used model with only one component for the N-H stretching mode, this frequency represents an average of all types of cations present in each mixture.
Since the modes most sensitive to intermolecular interactions, from the perspective of the anion, appear stronger in Raman spectroscopy, we have also analyzed the Raman spectra collected for the ionic liquid mixtures as shown in Figure 7. In particular, compared to infrared spectroscopy, Raman spectroscopy provides a higher spectral resolution which allows a more precise distinction of proximate vibrations and a more accurate analysis of frequency shifts. For this analysis, we have focused on two characteristic Raman signatures of the TfO− anion, i.e. the symmetric stretching of -SO3 at 1,033 cm−1 (νsSO3) and the symmetric stretching (with some contribution from bending as well (Morais et al. (2022)) of -CF3 at 759 cm−1 (νsCF3). These vibrations have previously been at focus in several computational and experimental studies of material systems containing the Li-triflate salt (Gejji et al. (1993); Hu et al. (2005); Huang et al. (1994); Caruso et al. (2002)). These vibrations are strong in the Raman spectrum and interfere only marginally with modes arising from the TFSI− anion, which simplifies the use and interpretation of peak-fit procedures. Also, the νsSO3 mode is non-degenerate, which allows distinguishing between anionic species in different energetic environments, in particular if splitting was observed (Huang et al. (1994)).
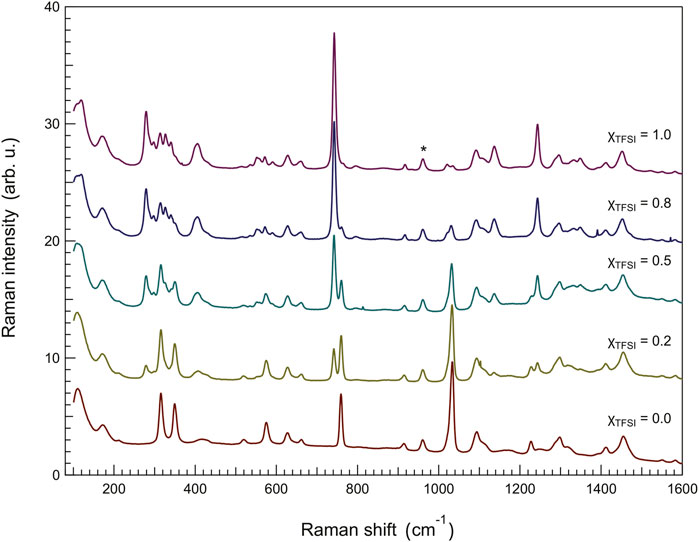
FIGURE 7. Raman spectra recorded for the binary mixtures, showing the frequency region 80–1,600 cm−1. The asterisk shows the vibrational mode used for normalization, that is the mode at 961 cm−1 assigned to the C6–C7 stretching mode in the ethyl chain of the imidazolium cation.
The results of our peak-fit procedure (see an example in Supplementary Figure S7) reveal a red shift of the main νs(SO3) mode and a blue shift of the νs(CF3) mode for increasing amounts of [C2HIm][TFSI], Figure 8. A number of previous studies have focused on these specific modes to understand the type of coordination of the triflate anion (TfO−), investigating the case of LiTfO dissolved in solvents or polymers (like polyethylene oxide, PEO) with the aim to distinguish between free anions, ion pairs, and more complex ion aggregates [Gejji et al. (1993); Hu et al. (2005); Huang et al. (1994); Caruso et al. (2002)]. The interpretation of the frequency shifts in the Raman spectrum, however, has not been straightforward since both geometry and proximity influence the direction of the shift for these vibrations (red shift or blue shift). Nevertheless, the frequency of a stretching mode correlates directly with the strength of the molecular bond; hence a red shift indicates an elongation of the chemical bond and vice versa for a blue shift. Based on this, our results indicate that, on average, the S-O bond elongates while the C-F bond shortens as the protic ionic liquid [C2HIm][TFSI] is added to [C2HIm][TfO], Figure 8. Moreover, although distinct, the recorded shifts are limited to a few wavenumbers (3,031–3,034 cm−1 and 759–761 cm−1) within the whole compositional range, suggesting that the TfO− remains in the state of a free anion. Indeed, based on the available literature, if the TfO− anion had changed to be part of a contact ion pair or a more complex aggregate, distinct new modes at ∼1,042 cm−1 and ∼1,052 cm−1 will have been observed (Huang et al. (1994); Caruso et al. (2002); Hu et al. (2005)), which is clearly not the case in this study. Interestingly, the vibrational mode at 742 cm−1, a strong signature of the TFSI− anion sensitive to intermolecular interactions, also red shifts as the protic ionic liquid [C2HIm][TfO] is mixed to [C2HIm][TFSI] (see Supplementary Figure S8). Thus, both anions are affected by composition in the way they interact with the cation, and the mixtures cannot be seen as simple weighted averages of the two pure protic ionic liquids. In light of these results, the overall blue shift of the N-H stretching mode observed by infrared spectroscopy as more TFSI− is added, can be explained by the concomitant increase of [C2HIm][TFSI] species and the weakening of interactions within the already present [C2HIm][TfO] species. These trends, along with the phase behavior shown by DSC, indicate that upon mixing these two protic ionic liquids a more disordered and less strongly coordinated ionic system is created.
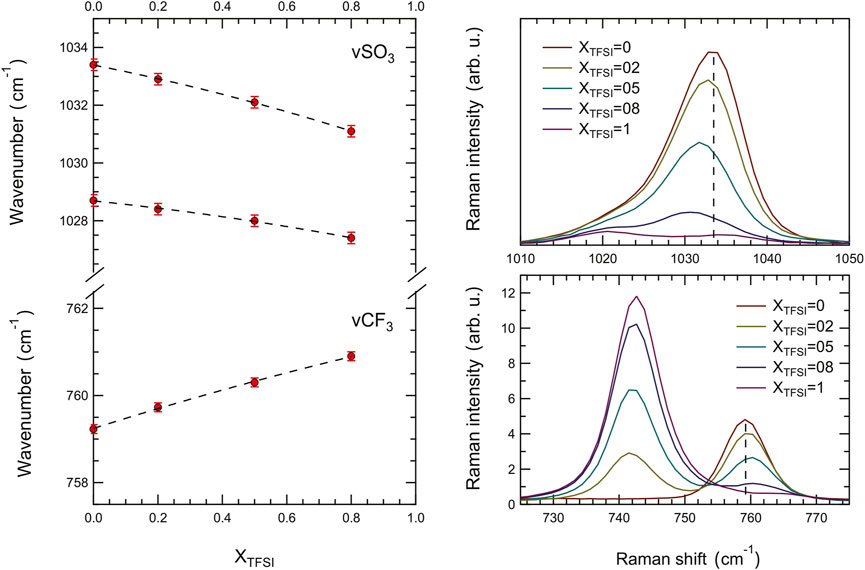
FIGURE 8. Composition dependence of the Raman frequency shift of the symmetric S-O and C-F stretching modes in the TfO anion.
The ionic conductivity of liquid materials can be measured by electrochemical impedance spectroscopy using a simple dip probe or a more advanced broadband dielectric spectrometer. The latter is also known as BDS and allows for measuring a variety of dielectric properties of materials covering a wide range of frequencies, typically in the range of 10−1–10−7 Hz, and large temperature windows (down to the temperature of liquid nitrogen) (Woodward (2021)). The ionic conductivity of the liquids investigated in this work was measured by BDS, covering wide frequency and temperature windows. The frequency dependence of the real part of conductivity, σ′(ν), is presented in Supplementary Figure S9 for temperatures between 20 and 140°C. All the plots reveal the frequency dependence typically observed in ionic liquids and other ion-conducting materials (Sippel et al. (2015); Shojaatalhosseini et al. (2017)). For all mixtures, a plateau is observed at frequencies approximately between 103 and 106 Hz, from which the direct current ionic conductivity (σdc) can be extrapolated. At frequencies lower than 103 Hz, σ′ decreases due to the known effect of electrode polarization (Sangoro et al. (2011); Sangoro et al. (2014); Sippel et al. (2015)). This is typically associated to an upturn of the real part of permittivity, ϵ’(ν) (see also Supplementary Figure S10), that in ionic liquids is anomalously large (Sippel et al. (2015)). The plateau values, i.e. the values of σdc, increase with temperature as expected and are all shown in the Arrhenius plot of Figure 9. These values fall within the range 1⋅10–3–4⋅10–1 S/cm for temperatures between 20 and 140°C. An exception is the case of the pure ionic liquid [C2HIm][TfO] (χ = 0), which shows a discrete jump in conductivity below 30°C (see also Figure 9A) which is simply the effect of a first-order phase transition from the solid to the liquid state, congruent with the DSC trace shown in Figure 3 and the related phase diagram discussed previously. As proposed by Luo et al. (Luo et al. (2013)) while studying the ionic liquid imidazolium methanesulfonate, the increase in ionic conductivity with temperature may be explained by a more disordered system (with possible contributions from rotational freedom) that creates vacancies facilitating ionic motion.
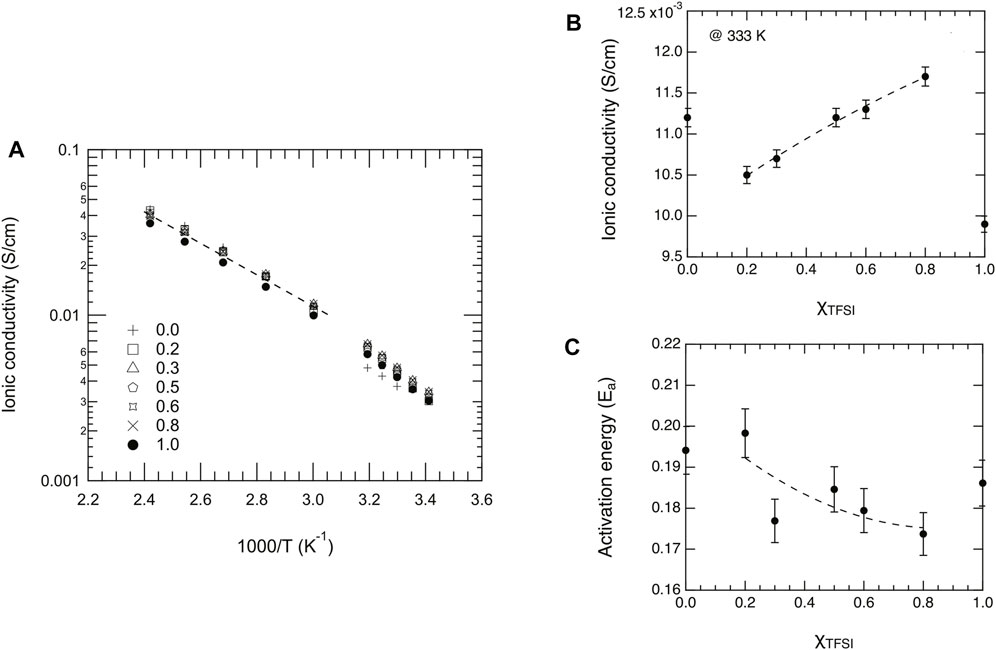
FIGURE 9. (A) Arrhenius plot of the dc ionic conductivity as a function of reciprocal temperature and for different mole fractions, χ, of [C2HIm][TFSI]. (B) Ionic conductivity extrapolated for the different liquids at the temperature of 333 K. (C) Activation energy, Ea, as a function of composition (χTFSI) estimated from fitting a limited number of data points in the high temperature limit.
For a deeper interpretation of these experimental data, a selected number of data points have been fitted with the Arrhenius equation
A series of mixtures based on the protic ionic liquids 1-ethylimidazolium triflate and 1-ethylimidazolium bis(trifluoromethylsulfonyl)imide have been investigated, the cation being in common and the anions differing in size, symmetry, and pKa. Complementary experimental methods such as vibrational spectroscopy, calorimetry, and dielectric spectroscopy have been employed with the aim of correlating the dynamics and local structure. Our results reveal that upon increasing the content of TFSI− in the mixture, the phase behavior changes; in particular, the melting temperature is first decreased (χ ≤ 0.3) and then suppressed (0.3
The raw data supporting the conclusions of this article will be made available by the authors, without undue reservation.
The first author IA has formulated the scientific question and designed the experimental work. He has also performed all the experiments, analyzed the experimental data, and prepared the first version of the figures for the discussion of the results. The discussion of the results and the writing of the manuscript have been carried out under the iterative supervision of AM.
The Knut and Alice Wallenberg Foundation (Wallenberg Academy Fellows Award, grant 2016-0220) is kindly acknowledged for the financial support given to this project.
The authors declare that the research was conducted in the absence of any commercial or financial relationships that could be construed as a potential conflict of interest.
All claims expressed in this article are solely those of the authors and do not necessarily represent those of their affiliated organizations, or those of the publisher, the editors, and the reviewers. Any product that may be evaluated in this article, or claim that may be made by its manufacturer, is not guaranteed or endorsed by the publisher.
The authors acknowledge Jan Swenson for making the BDS instrumentation available to measure ionic conductivity and other dielectric properties.
The Supplementary Material for this article can be found online at: https://www.frontiersin.org/articles/10.3389/fchem.2022.915683/full#supplementary-material
1To calculate molalities, the following molecular weights have been used; 246.21 g/mol for C2HImTfO and 377.28 g/mol for C2HImTFSI.
2In this Arrhenius equation, σ is the ionic conductivity (in S/cm), σ0 is the ionic conductivity extrapolated for infinite temperatures, Ea is the activation energy, kB is the Boltzmann’s constant and T is the temperature (in K).
Abbott, A. P., Edler, K. J., and Page, A. J. (2021). Deep Eutectic Solvents-The Vital Link between Ionic Liquids and Ionic Solutions. J. Chem. Phys. 155, 150401. doi:10.1063/5.0072268
Berton, P., Kelley, S. P., Bridges, N. J., Klingshirn, M. A., Huddleston, J. G., Willauer, H. D., et al. (2019). Water in Solutions of Chaotropic and Kosmotropic Salts: a Differential Scanning Calorimetry Investigation. J. Chem. Eng. Data 64, 4781–4792. doi:10.1021/acs.jced.9b00222
Bulut, S., Eiden, P., Beichel, W., Slattery, J. M., Beyersdorff, T. F., Schubert, T. J. S., et al. (2011). Temperature Dependence of the Viscosity and Conductivity of Mildly Functionalized and Non-functionalized [Tf2N]− Ionic Liquids. ChemPhysChem 12, 2296–2310. doi:10.1002/cphc.201100214
Caruso, T., Capoleoni, S., Cazzanelli, E., Agostino, R. G., Villano, P., and Passerini, S. (2002). Characterization of Peo-Lithium Triflate Polymer Electrolytes: Conductivity, Dsc and Raman Investigations. Ionics 8, 36–43. doi:10.1007/BF02377751
Chatel, G., Pereira, J. F. B., Debbeti, V., Wang, H., and Rogers, R. D. (2014). Mixing Ionic Liquids - "simple Mixtures" or "double Salts"? Green Chem. 16, 2051–2083. doi:10.1039/C3GC41389F
D'Anna, F., Marullo, S., Vitale, P., and Noto, R. (2012). Binary Mixtures of Ionic Liquids: a Joint Approach to Investigate Their Properties and Catalytic Ability. ChemPhysChem 13, 1877–1884. doi:10.1002/cphc.201100878
Dai, Y., Chen, Z., Liu, X., Xing, J., Jiao, Y., Fan, D., et al. (2021). Extraction Mechanism Analysis and Energy Saving Enhancement of Extraction Separation of Methyl Tert-Butyl Ether and Methanol by Ionic Liquid Based on Molecular Dynamics Simulation. Sep. Purif. Technol. 279, 119717. doi:10.1016/j.seppur.2021.119717
Elhi, F., Gantman, M., Nurk, G., Schulz, P. S., Wasserscheid, P., Aabloo, A., et al. (2020). Influence of Carboxylate Anions on Phase Behavior of Choline Ionic Liquid Mixtures. Molecules 25, 1691. doi:10.3390/molecules25071691
Fumino, K., Bonsa, A.-M., Golub, B., Paschek, D., and Ludwig, R. (2015). Non-ideal Mixing Behaviour of Hydrogen Bonding in Mixtures of Protic Ionic Liquids. ChemPhysChem 16, 299–304. doi:10.1002/cphc.201402760
Gabbott, P. (2008). “A Practical Introduction to Differential Scanning Calorimetry,” in Book: Principles and Applications of Thermal Analysis. Editor G. Paul, 1–50. ISBN-13: 978-1-4051-3171-1. Chapter 1.
Garaga, M. N., Dracopoulos, V., Werner-Zwanziger, U., Zwanziger, J. W., Maréchal, M., Persson, M., et al. (2018). A Long-Chain Protic Ionic Liquid inside Silica Nanopores: Enhanced Proton Mobility Due to Efficient Self-Assembly and Decoupled Proton Transport. Nanoscale 10, 12337–12348. doi:10.1039/c8nr02031k
Gejji, S. P., Hermansson, K., Tegenfeldt, J., and Lindgren, J. (1993). Geometry and Vibrational Frequencies of the Lithium Triflate Ion Pair: an Ab Initio Study. J. Phys. Chem. 97, 11402–11407. doi:10.1021/j100146a011
Gittleman, C. S., Jia, H., De Castro, E. S., Chisholm, C. R. I., and Kim, Y. S. (2021). Proton Conductors for Heavy-Duty Vehicle Fuel Cells. Joule 5, 1660–1677. doi:10.1016/j.joule.2021.05.016
Glinska, K., Gitalt, J., Torrens, E., Plechkova, N., and Bengoa, C. (2021). Extraction of Cellulose from Corn Stover Using Designed Ionic Liquids with Improved Reusing Capabilities. Process Saf. Environ. Prot. 147, 181–191.
Gómez, E., Calvar, N., Domínguez, Á., and Macedo, E. A. (2018). Thermal Behavior and Heat Capacities of Pyrrolidinium-Based Ionic Liquids by Dsc. Fluid Phase Equilibria 470, 51–59. doi:10.1016/j.fluid.2018.04.003
Greaves, T. L., and Drummond, C. J. (2015). Protic Ionic Liquids: Evolving Structure-Property Relationships and Expanding Applications. Chem. Rev. 115, 11379–11448. doi:10.1021/acs.chemrev.5b00158
Harriss, M. G., and Milne, J. B. (1976). The Trifluoroacetic Acid Solvent System. Part V. Cryoscopic Measurements. Can. J. Chem. 54, 3031–3037. doi:10.1139/v76-429
Hu, Y., Wang, Z., Li, H., Huang, X., and Chen, L. (2005). Spectroscopic Studies on the Mechanism of Liquid Formation and Ionic Conductivity in the LiCF3SO3/acetamide Complex System. Vib. Spectrosc. 37, 1–10. doi:10.1016/j.vibspec.2004.03.003
Huang, W., Frech, R., and Wheeler, R. A. (1994). Molecular Structures and Normal Vibrations of Trifluoromethane Sulfonate (CF3SO3-) and its Lithium Ion Pairs and Aggregates. J. Phys. Chem. 98, 100–110. doi:10.1021/j100052a018
Jiao, K., Xuan, J., Du, Q., Bao, Z., Xie, B., Wang, B., et al. (2021). Designing the Next Generation of Proton-Exchange Membrane Fuel Cells. Nature 595, 361–369. doi:10.1038/s41586-021-03482-7
Karimi, M. B., Mohammadi, F., and Hooshyari, K. (2019). Recent Approaches to Improve Nafion Performance for Fuel Cell Applications: A Review. Int. J. Hydrogen Energy 44, 28919–28938. doi:10.1016/j.ijhydene.2019.09.096
Kunze, M., Jeong, S., Paillard, E., Winter, M., and Passerini, S. (2010). Melting Behavior of Pyrrolidinium-Based Ionic Liquids and Their Binary Mixtures. J. Phys. Chem. C 114, 12364–12369. doi:10.1021/jp103746k
Lei, Z., Chen, B., Koo, Y.-M., and MacFarlane, D. R. (2017). Introduction: Ionic Liquids. Chem. Rev. 117, 6633–6635. doi:10.1021/acs.chemrev.7b00246
Low, K., Tan, S. Y. S., and Izgorodina, E. I. (2019). An Ab Initio Study of the Structure and Energetics of Hydrogen Bonding in Ionic Liquids. Front. Chem. 7, 208. doi:10.3389/fchem.2019.00208
Luo, J., Conrad, O., and Vankelecom, I. F. J. (2013). Imidazolium Methanesulfonate as a High Temperature Proton Conductor. J. Mat. Chem. A 1, 2238–2247. doi:10.1039/C2TA00713D
Martinelli, A., Matic, A., Jacobsson, P., Börjesson, L., Fernicola, A., and Scrosati, B. (2009). Phase Behavior and Ionic Conductivity in Lithium Bis(trifluoromethanesulfonyl)imide-Doped Ionic Liquids of the Pyrrolidinium Cation and Bis(trifluoromethanesulfonyl)imide Anion. J. Phys. Chem. B 113, 11247–11251. doi:10.1021/jp905783t
Martinelli, A., Matic, A., Johansson, P., Jacobsson, P., Börjesson, L., Fernicola, A., et al. (2011). Conformational Evolution of TFSI− in Protic and Aprotic Ionic Liquids. J. Raman Spectrosc. 42, 522–528. doi:10.1002/jrs.2713
Miran, M. S., Yasuda, T., Susan, M. A. B. H., Dokko, K., and Watanabe, M. (2014). Binary Protic Ionic Liquid Mixtures as a Proton Conductor: High Fuel Cell Reaction Activity and Facile Proton Transport. J. Phys. Chem. C 118, 27631–27639. doi:10.1021/jp506957y
Morais, E. M., Abdurrokhman, I., and Martinelli, A. (2022). Solvent-free Synthesis of Protic Ionic Liquids. Synthesis, Characterization, and Computational Studies of Triazolium Based Ionic Liquids. J. Mol. Liq. 2022, 119358. doi:10.1016/j.molliq.2022.119358
Moynihan, C., Gavin, D., and Syed, R. (1982). Pre-exponential Term in the Arrhenius Equation for Electrical Conductivity of Glass. J. de Physique 12, 395–398. doi:10.1051/jphyscol:1982975
Paschoal, V. H., Faria, L. F. O., and Ribeiro, M. C. C. (2017). Vibrational Spectroscopy of Ionic Liquids. Chem. Rev. 117, 7053–7112. doi:10.1021/acs.chemrev.6b00461
Sangoro, J. R., Iacob, C., Agapov, A. L., Wang, Y., Berdzinski, S., Rexhausen, H., et al. (2014). Decoupling of Ionic Conductivity from Structural Dynamics in Polymerized Ionic Liquids. Soft Matter 10, 3536–3540. doi:10.1039/C3SM53202J
Sangoro, J. R., Iacob, C., Naumov, S., Valiullin, R., Rexhausen, H., Hunger, J., et al. (2011). Diffusion in Ionic Liquids: the Interplay between Molecular Structure and Dynamics. Soft Matter 5, 1678. doi:10.1039/c0sm01404d
Shojaatalhosseini, M., Elamin, K., and Swenson, J. (2017). Conductivity-relaxation Relations in Nanocomposite Polymer Electrolytes Containing Ionic Liquid. J. Phys. Chem. B 121, 9699–9707. doi:10.1021/acs.jpcb.7b03985
Sippel, P., Lunkenheimer, P., Krohns, S., Thoms, E., and Loidl, A. (2015). Importance of Liquid Fragility for Energy Applications of Ionic Liquids. Sci. Rep. 5, 13922. doi:10.1038/srep13922
Smith, E. L., Abbott, A. P., and Ryder, K. S. (2014). Deep Eutectic Solvents (Dess) and Their Applications. Chem. Rev. 114, 11060–11082. doi:10.1021/cr300162p
Stettner, T., and Balducci, A. (2021). Protic Ionic Liquids in Energy Storage Devices: Past, Present and Future Perspective. Energy Storage Mater. 40, 402–414. doi:10.1016/j.ensm.2021.04.036
Thoms, E., Sippel, P., Reuter, D., Weiss, M., Loidl, A., and Krohns, S. (2017). Dielectric Study on Mixtures of Ionic Liquids. Sci. Rep. 7, 7463. doi:10.1038/s41598-017-07982-3
Valderrama, J. O., and Cardona, L. F. (2021). Predicting the Melting Temperature and the Heat of Melting of Ionic Liquids. J. Ionic Liq. 1, 100002. doi:10.1016/j.jil.2021.100002
Walden, P. (1914). Molecular Weights and Electrical Conductivity of Several Fused Salts. Bull. Acad. Imper. Sci. Petersbg. 8, 405–422.
Wang, G., Yu, Y., Liu, H., Gong, C., Wen, S., Wang, X., et al. (2018). Progress on Design and Development of Polymer Electrolyte Membrane Fuel Cell Systems for Vehicle Applications: A Review. Fuel Process. Technol. 179, 203–228. doi:10.1016/j.fuproc.2018.06.013
Wang, Y., Ruiz Diaz, D. F., Chen, K. S., Wang, Z., and Adroher, X. C. (2020). Materials, Technological Status, and Fundamentals of PEM Fuel Cells - A Review. Mater. Today 32, 178–203. doi:10.1016/j.mattod.2019.06.005
Watanabe, M., Thomas, M. L., Zhang, S., Ueno, K., Yasuda, T., and Dokko, K. (2017). Application of Ionic Liquids to Energy Storage and Conversion Materials and Devices. Chem. Rev. 117, 7190–7239. doi:10.1021/acs.chemrev.6b00504
Wong, C. Y., Wong, W. Y., Ramya, K., Khalid, M., Loh, K. S., Daud, W. R. W., et al. (2019). Additives in Proton Exchange Membranes for Low- and High-Temperature Fuel Cell Applications: A Review. Int. J. Hydrogen Energy 44, 6116–6135. doi:10.1016/j.ijhydene.2019.01.084
Woodward, W. H. H. (2021). Broadband Dielectric Spectroscopy-A Practical Guide. Am. Chem. Soc. 1, 3–59. doi:10.1021/bk-2021-1375.ch001
Yaghini, N., Gómez-González, V., Varela, L. M., and Martinelli, A. (2016). Structural Origin of Proton Mobility in a Protic Ionic Liquid/imidazole Mixture: Insights from Computational and Experimental Results. Phys. Chem. Chem. Phys. 18, 23195–23206. doi:10.1039/C6CP03058K
Yaghini, N., Pitawala, J., Matic, A., and Martinelli, A. (2015). Effect of Water on the Local Structure and Phase Behavior of Imidazolium-Based Protic Ionic Liquids. J. Phys. Chem. B 119, 1611–1622. doi:10.1021/jp510691e
Yambou, E. P., Gorska, B., and Béguin, F. (2020). Binary Mixtures of Ionic Liquids Based on Emim Cation and Fluorinated Anions: Physico-Chemical Characterization in View of Their Application as Low-Temperature Electrolytes. J. Mol. Liq. 298, 111959. doi:10.1016/j.molliq.2019.111959
Zhang, S., Zhang, J., Zhang, Y., and Deng, Y. (2017). Nanoconfined Ionic Liquids. Chem. Rev. 117, 6755–6833. doi:10.1021/acs.chemrev.6b00509
BDS, broadband dielectric spectroscopy; BF4, tetrafluoroborate; BMIM, butyl-methylimidazolium; Cl, chloride; C2HIm, 1-ethylimidazolium; CF3SO3, triflate; CH3SO3, methylsulfonate; dema, diethylmethylammonium; DES, deep eutectic solvent; DSC, differential scanning calorimetry; Et3NH, triethylammonium; FSI, bis(fluorosulfonyl)imide; HSO4, hydrogen sulfate; NMR, nuclear magnetic resonance; NTf2, bis(trifluoromethanesulfonyl)imide; PEM, proton exchange membrane; PEO, polyethylene oxide; PYR, pyrrolidinium; TfO, triflate; TFSI, bis(trifluoromethanesulfonyl)imide; VFT, Vogel–Fulcher–Tammann.
Keywords: protic ionic liquids, mixtures, imidazolium, vibrational spectroscopy, phase behavior, ionic conductivity
Citation: Abdurrokhman I and Martinelli A (2022) Binary Mixtures of Imidazolium-Based Protic Ionic Liquids. Extended Temperature Range of the Liquid State Keeping High Ionic Conductivities. Front. Chem. 10:915683. doi: 10.3389/fchem.2022.915683
Received: 08 April 2022; Accepted: 20 May 2022;
Published: 01 July 2022.
Edited by:
Isabel Maria Marrucho, Universidade de Lisboa, PortugalReviewed by:
Dr. Manish Pratap Singh, Veer Bahadur Singh Purvanchal University, IndiaCopyright © 2022 Abdurrokhman and Martinelli. This is an open-access article distributed under the terms of the Creative Commons Attribution License (CC BY). The use, distribution or reproduction in other forums is permitted, provided the original author(s) and the copyright owner(s) are credited and that the original publication in this journal is cited, in accordance with accepted academic practice. No use, distribution or reproduction is permitted which does not comply with these terms.
*Correspondence: Anna Martinelli, YW5uYS5tYXJ0aW5lbGxpQGNoYWxtZXJzLnNl
Disclaimer: All claims expressed in this article are solely those of the authors and do not necessarily represent those of their affiliated organizations, or those of the publisher, the editors and the reviewers. Any product that may be evaluated in this article or claim that may be made by its manufacturer is not guaranteed or endorsed by the publisher.
Research integrity at Frontiers
Learn more about the work of our research integrity team to safeguard the quality of each article we publish.