
95% of researchers rate our articles as excellent or good
Learn more about the work of our research integrity team to safeguard the quality of each article we publish.
Find out more
ORIGINAL RESEARCH article
Front. Chem. , 04 July 2022
Sec. Chemical Physics and Physical Chemistry
Volume 10 - 2022 | https://doi.org/10.3389/fchem.2022.915335
This article is part of the Research Topic Efficient Near-Infrared-Emitting Materials: Design, Synthesis, Mechanisms, and Applications View all 5 articles
 Karmel De Oliveira Lima1
 Fábio José Caixeta1
 Vítor Dos Santos De Souza1
 Leonardo Sousa Rosa1Victor Del Vecchio Soares1Carolina Assunção Crumo1Ivana Aparecida Borin1
 Jefferson Luis Ferrari2
 Rogéria Rocha Gonçalves1*
This paper reports on the preparation of Er3+/Yb3+/Tm3+, Er3+/Yb3+/Nd3+, and Er3+/Tm3+/Nd3+ triply doped and Er3+-doped SiO2-Ta2O5 glass ceramic nanocomposites and active planar waveguides by the sol–gel process using the dip-coating technique as deposition method. The investigation of their structural, morphological, and luminescent properties using XRD, AFM, and photoluminescence analysis, are reported here. The XRD results showed the presence of L-Ta2O5 nanocrystals dispersed in the SiO2-based amorphous host for all the nanocomposites and films. The rare earth ion (RE3+) doping concentration affected both the crystallinity, and the crystallite sizes of the Ta2O5 dispersed into SiO2-Ta2O5 nanocomposites and waveguides. AFM characterization revealed crack free and smooth surface roughness and differences in viscoelasticity on the Er3+-doped SiO2-Ta2O5 films surface, which allows the identification of Ta2O5 nanocrystals on the SiO2 amorphous host. The Er3+ doped and triply doped SiO2-Ta2O5 nanocomposites displayed broad- and super broadband NIR emissions with a FWHM up to 173 nm achieved in the telecom wavelengths. The lifetime of the 4I13/2 emitting level of the Er3+-doped SiO2-Ta2O5 waveguides is strongly dependent on Er3+ concentration and an emission quenching was negligible up to 0.81 mol%. The structural and luminescent investigations indicated that RE3+-doped SiO2-Ta2O5 glass ceramics are promising candidates for photonic applications in optical devices operating in wide wavelengths at the telecom bands.
The global internet traffic has greatly grown over the last years, for instance, by 2023 the forecasts have pointed out 5.3 billion users, 29.3 billion networked devices, 14.7 billion machine-to-machine connections, and global fixed broadband speeds will reach 110.4 Mbps (Cisco, 2020). Moreover, mainly due to the Coronavirus disease (COVID-19) pandemic it going to keep increasing. Home office, online learning, streaming services, e-commerce, delivery, social media platforms, gaming, and so on have boosted the global internet consuming. Indeed, according to Packet Clearing House (PCH) the domestic bandwidth production has soared worldwide over the last year (PCH, 2021). In this context, one of the most pressing technological challenges to overcome nowadays is the ever-increasing demand for telecommunication networks that can carry larger data volumes. Therefore, developing efficient new photonic materials for telecommunications is imperative.
Since the 1980s the optical fibers and erbium doped fiber amplifiers (EDFAs) that work at 1.5 μm region have played an important role concerning high transmission rate, large capacity and low-losses of signal transmission in the so called third telecommunication window (Mears et al., 1987; Desurvire et al., 1987). Notwithstanding, erbium doped planar waveguide amplifiers (EPWAs) have been successfully used as efficiency platforms for optical information transport in integrated optics (IO) (Ferrari et al., 2021).
Erbium (Er3+) ion doped materials are very used as optical amplifiers for operation in the S, C, and L telecom bands (1460–1610 nm), depending fundamentally on the chemical composition of the matrix.
An important aspect to be consider in telecommunication is bandwidth. Over the past decades, much attention has been dedicated to obtaining luminescent materials that emit broad emission bands in the near infrared (NIR) region for optical amplification. Several strategies concerning hosts and doping parameters have been adopted to enlarge NIR emission not only in the S, C, and L, but also O, E, and U telecom bands. Among the many strategies developed for the preparation of superbroadband optical amplifiers reported in the literature, special attention has been devoted to glassy and glass-ceramic materials doped with bismuth ion (Bi+) and several rare earth ions (RE3+) (Rivera et al., 2014; Sun et al., 2014; Martins et al., 2019; Thipparapu et al., 2019).
The use of several RE3+ dopants in waveguide materials proposes the widest gain amplification spectrum, increasing the transmission capacity of them. Thulium (Tm3+) doped amplifiers can operate in the S-band (1460–1530 nm), as well in the region from 1.2 to 2 μm, increasing the transmission via shifting away from the third telecommunication window (Muscelli et al., 2016; Aquino et al., 2018; Khamis and Ennser, 2019). Neodymium (Nd3+) single doped materials show one near-infrared band emission at 1.3 µm, which is placed in the O- and E-bands (Herrera et al., 2021; Xia et al., 2021). The combination of different RE ions in the same host, allows the wide or ultra-wide band optical amplifier development which could span most part of the low-loss region of the main telecommunication window (Shen et al., 2020b).
A key point concerning the development of photonic materials doped with rare earth (RE) ions is the choice of the host lattice. In this sense, refractive index, phonon energy, RE solubility, symmetry sites, emission quenchers, optical transparency, and chemical stability are the most critical factors for the development of photonic devices with broadband emissions.
Several matrices have been investigated for photonic applications, especially for optical amplification, such as RE3+ doped tellurite glasses due to them lower phonon energies (Huang et al., 2004; Shen et al., 2020b), phosphate glasses due to them mechanical strength, good thermal stability and excellent flexibility (Li et al., 2016). The RE3+ ions combinations with other ones (Bi3+, Bi+, Cr3+, …) in glasses and glass-ceramics, have been studied in the last decades (Meng et al., 2005; Yang et al., 2018; Dan et al., 2020).
Among the potential RE doped matrices for telecommunication, tantalum oxide (Ta2O5) has attractive properties like low phonon energy (<700 cm−1), transparency over a wide spectral range from visible to NIR regions, high refractive index (n ∼ 2.15), chemical stability (Muscelli et al., 2016). Previous studies published by some of the authors have revealed that Er3+ doped SiO2-Ta2O5 glass ceramics can be potentially used in EDWA and WDM devices (Ferrari et al., 2010), showing NIR emission with bandwidth values from 65 to 91 nm, indicating that Er3+ ions are preferentially placed in the Ta2O5 sites due to the complex structure of Ta2O5 (Ferrari et al., 2011a).
Materials with potential applications as active planar waveguides have played an important role in the development of optics and optoelectronics applications due to their excellent performance, low cost, and ease of fabrication.
Planar waveguides have to combine several requirements in order to achieve high light confinement coefficient and low propagation losses, such as high control of refractive index values, absence or high control of phase separation, high solubility of lanthanide ions (Terui and Kobayashi, 1978; Benatsou et al., 1997) among others.
One of the best and low cost experimental routes to the manufacture of multicomponent glass ceramics and planar waveguides is the sol-gel process (Benatsou et al., 1997; Gonçalves et al., 2002, 2004). This methodology presents several advantages in comparison with melt-quenching technique, being considered an adequate method to control all the requirements mentioned above, considering that such a process allows the possibility of synthesis of multicomponent systems, high homogeneity, among other factors.
This study reports on the synthesis, structural and morphological characterization, and luminescent properties of rare earth ion (RE3+)-doped SiO2-Ta2O5 glass ceramic nanocomposites and active planar waveguides prepared by the sol–gel methodology. More specifically, we have prepared photonic glass ceramic materials with several Er3+ concentrations and different RE3+ doping combinations to widen the near infrared (NIR) emission band and consequently enable the application in a wider region in the window used in telecommunications. The preparation of materials with broad- and super broadband opens the possibility of manufacturing integrated optics components such as optical amplifiers based on RE3+ -doped planar waveguide amplifiers operating in a wide range of wavelengths for new concept of optical devices.
Er2O3 (99.9%), Yb2O3 (99.9%), Tm2O3 (99.9%), Nd2O3 (99.9%), tantalum ethoxide (99.98%), 2-ethoxyethanol (99%) and tetraethylorthosilicate (TEOS, 98%) were purchased from Sigma Aldrich. Anhydrous ethanol (≤0.005% H2O) was obtained from Merck. HCL PA-ACS-ISO (37wt%) were acquired from Panreac.
Er3+/Yb3+/Tm3+, Er3+/Yb3+/Nd3+, Er3+/Tm3+/Nd3+ triply doped and Er3+-doped SiO2-Ta2O5 nanocomposites and films were prepared by the sol–gel methodology. First, the Er3+, Yb3+, Tm3+, and Nd3+ chloride ethanolic solutions were prepared by dissolving Er2O3, Yb2O3, Tm2O3, and Nd2O3, respectively, in HCl PA-ACS-ISO under stirring. The solutions were subsequently dried at 80°C with addition of anhydrous ethanol. Finally, the resulting dopant solutions were titrated by ethylenediaminetetraacetic acid (EDTA, 0.0515 mol L−1) complexation in Acetic Acid-Sodium Acetate buffer (pH 5.4); xylenol orange was used as indicator.
A final reaction volume of 20.0 ml, with total Si + Ta concentration of 0.448 mol L−1 and Si/Ta 70:30 molar ratio, was prepared. In a container under stirring at room temperature, anhydrous ethanol, tantalum ethoxide, 2-ethoxyethanol, and the dopant solutions were added. In a seconder container under stirring at room temperature, anhydrous ethanol, tetraethylorthosilicate, and HCl PA-ACS-ISO were added at TEOS/HCl 50:1 ratio. Then, the contents of the two containers were mixed under stirring at room temperature for 30 min. The obtained sols were used to prepare the films, as described in detail elsewhere (Ferrari et al., 2010), or dried for 60 days for xerogel formation. The resulting xerogels were ground to powder and annealed at 900 and 1100°C for 8 h. Table 1 summarizes the prepared samples.
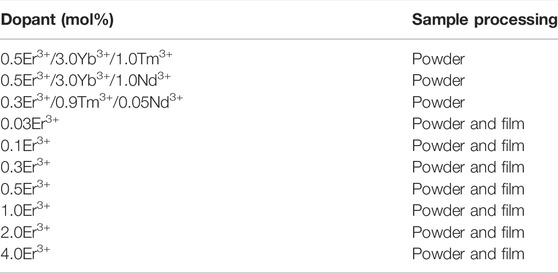
TABLE 1. Triply doped and Er3+-doped SiO2-Ta2O5 nanocomposites and films.
The powder X-ray diffraction (XRD) measurements of the triply doped SiO2-Ta2O5 nanocomposites were carried out on a Siemens-Bruker D5005-AXS diffractometer operating with CuKα (40 kV and 30 mA) radiation (1.5406 Å) and equipped with a graphite monochromator. The powder XRD patterns were recorded at 0.02°s−1, in the 2θ range between 5 and 90°. As for the powder XRD patterns of the Er3+-doped SiO2-Ta2O5 powders and films, they were registered in the 2θ range between 15 and 70°. The crystallite sizes were determined by the Scherrer formula (Patterson, 1939). The calculation was based on the measurement of integral breadth values in the corresponding XRD pattern. The planar waveguide surfaces were investigated by Atomic Force Microscopy (AFM) with a Shimadzu scanning probe microscope (SPM-9600) operating at the contact and dynamic modes. Surface roughness was evaluated by using the images collected with the software SPM, version 3.03.
The Photoluminescence (PL) emission spectra of the triply doped SiO2-Ta2O5 nanocomposites in the near infrared (NIR) region were recorded at room temperature on a FluoroLog-3 Horiba Jobin Yvon spectrofluorometer equipped with a H10330-75 NIR photomultiplier. The excitation sources were 808-nm and 980-nm diode lasers (DMC Group) operating at 1000 mW.
The PL emission spectra in the region between 1280–1700 and 1400–1680 nm of the Er3+-doped SiO2-Ta2O5 nanocomposites and the PL decay curves of the Er3+-doped SiO2-Ta2O5 waveguides were registered at room temperature on a Fluorolog 3-222 Horiba Jobin Yvon spectrofluorometer equipped with an InGaAs detector. The excitation source was a 980-nm laser operating at 302 mW (CrystaLaser). The emission decays of the 4I13/2 emitting level of Er3+ in the SiO2-Ta2O5 films were measured under excitation at the Er3+:4I15/2→4I11/2 transition at room temperature and recorded with an oscilloscope (Tektronix TDS 2022B).
Figure 1 presents the powder XRD patterns of the triply doped SiO2-Ta2O5 nanocomposites annealed at 900°C for 8 h. The powder XRD patterns of the Er3+/Yb3+/Tm3+ and Er3+/Yb3+/Nd3+ triply doped nanocomposites displayed an amorphous halo from 15° to 40°, and no crystallization peaks were detected. On the other hand, the Er3+/Tm3+/Nd3+ triply doped nanocomposite presented crystallization peaks at 22.8°, 36.7°, 46.7°, and 55.5°, assigned to the (0 0 1), (1 11 1), (0 0 2), and (1 11 2), respectively, crystalline planes of orthorhombic L- Ta2O5 (Stephenson and Roth, 1971). A full description and discussion of such crystalline phase can be seen elsewhere (Stephenson and Roth, 1971; Ferrari et al., 2011b). Herein, it is evidenced that Ta2O5 crystallization was significantly affected where the process was delayed for samples with the highest concentrations of RE3+ concentration (the total RE3+ concentration was 4.5, 4.5, and 1.25 mol% for the Er3+/Yb3+/Tm3+, Er3+/Yb3+/Nd3+, and Er3+/Tm3+/Nd3+ triply doped nanocomposites, respectively) in which the ions may be acting on the surface of the particles reducing the energy surface avoiding their increasing. This observation corroborates the indication that RE3+ ions will preferentially be distributed in an environment rich in tantalum oxide. With the formation of nanoparticles with controlled segregation, the distribution of lanthanide ions will be into the tantalum oxide nanocrystals, as observed in previous works. The RE3+ distribution in nanocrystals containing the complex structure of tantalum oxide has revealed the distribution of RE3+ ions in a wide range of slightly different symmetry sites, resulting in an inhomogeneous broadening of the emission band in the near infrared (Ferrari et al., 2011b).
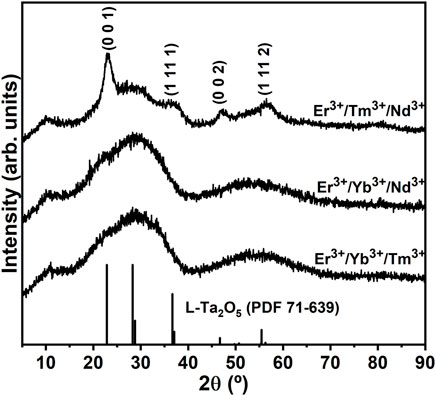
FIGURE 1. Powder XRD patterns of triply doped SiO2-Ta2O5 nanocomposites annealed at 900°C for 8 h.
One of our goals was to obtain a broad emission band around the 1.5-µm region, so inhomogeneous broadening was desirable due to the large number of symmetry sites occupied by RE3+ ions. In this sense, the reduction in crystallization can directly influence the inhomogeneous broadening of the NIR emission band, as we will see below.
Figure 2 depicts the powder XRD patterns of the Er3+-doped SiO2-Ta2O5 nanocomposites doped with 0.3, 2.0, and 4.0 mol% Er3+ concentrations. The powder XRD peak positions and relative intensities of all the Er3+-doped nanocomposites agreed well with the peak positions and relative intensities reported for the orthorhombic L-Ta2O5 system. The powder XRD of Er3+-doped SiO2-Ta2O5 exhibited amorphous SiO2 halos localized between 2θ = 15 and 40°. We did not detect any additional reflection peak, which indicated the absence of secondary phases composed by Er3+ ions, at least within the detection limits of this technique. The L-Ta2O5 powder XRD peaks enlarged with increasing Er3+ concentration, pointing to the influence of Er3+ insertion on nanocomposite crystallinity.
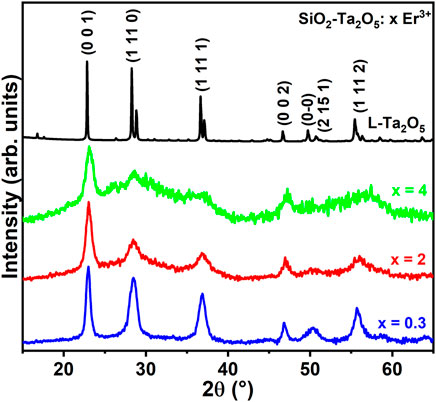
FIGURE 2. Powder XRD patterns of 0.3, 2.0, and 4.0 mol% Er3+-doped SiO2-Ta2O5 nanocomposites calcined at 1100°C for 8 h.
Bragg peak broadening in diffractograms can be related to structural factors, such as microstrains and crystallite domain sizes. To evaluate the changes caused by the different Er3+ doping levels, we estimated the average crystallite sizes of the Ta2O5 crystals dispersed in the amorphous silica host by using the Scherrer’s formula. This formula is described by t = βλ/Bcosθ, where t is the average crystallite size, β is the Scherrer constant related to the crystallite morphology (is assumed 0.89 for spherical crystallites), λ is the X-Ray wavelength (in Å), B is the integral breadth, and θ is the diffraction angle (in rad) of the peak used in this calculation(Patterson, 1939). Table 2 lists the calculated average crystallite sizes for the 0.3, 2.0, and 4.0 mol% Er3+-doped SiO2-Ta2O5 nanocomposites as well as undoped Ta2O5.
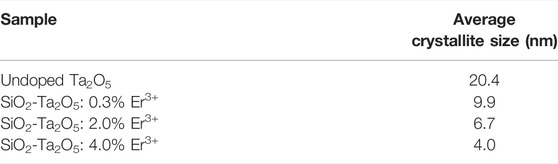
TABLE 2. Average crystallite diameters of undoped Ta2O5 and 0.3, 2.0, and 4.0 mol% Er3+-doped SiO2-Ta2O5 nanocomposites calcined at 1100°C for 8 h.
The crystallite size calculations were performed based on the reflection peaks assigned to the (0 0 1), (1 11 0) and (1 11 1) planes of the L-Ta2O5 crystalline phase. From the diffractogram data it is possible to observe a drastic reduction in the intensity of the powder XRD peaks as well as their broadening. The crystallite dimensions decreased from 9.9 to 4.0 nm as the Er3+ doping level increases. RE3+ addition to the SiO2-Ta2O5 systems generated additional site distortions and defects, reducing long-distance packing and lowering the degree of crystallinity of the systems. The RE3+ dopant promoted a restricting force on the host grain boundaries. If we consider that the restricting forces were greater than the driving forces for grain growth, the grain boundary motion could be hindered, so that crystallite sizes decreased with increasing amount of RE3+ dopant, agreeing with our findings for the triply doped SiO2-Ta2O5 nanocomposites. The same crystallite size changing as a function of RE3+ insertion has been reported for Sm3+-doped ZnO thin films (He et al., 2015; Kayani et al., 2020), Er3+-doped Y2O3 obtained by polymeric precursor (Perrella et al., 2014), and Er3+-doped NiO-based nanoparticles (Shkir, 2020), among others. The larger RE3+ ionic radii compared to the radii of the metal ions in these hosts produced strains in the matrix lattice, reducing further crystal growth. We attributed the powder XRD pattern of the 0.1 mol% Er3+-doped SiO2-Ta2O5 densified planar waveguide (Figure 3) to reflection planes of the orthorhombic L-Ta2O5 crystalline phase, with the presence of an additional peak at 33°, ascribed to the Si (100) substrate. This diffraction profile indicated that L-Ta2O5 crystals were dispersed in the amorphous silica host, as reported previously for analogous SiO2-Ta2O5 nanocomposites.
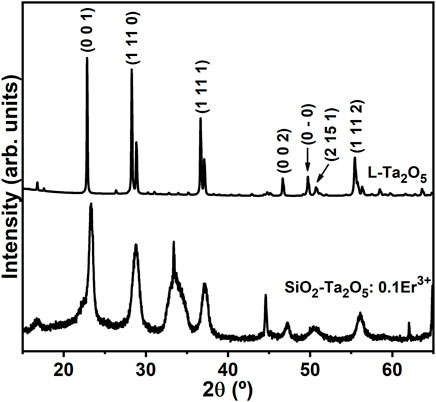
FIGURE 3. Powder XRD patterns of the 0.1 mol% Er3+-doped SiO2-Ta2O5 densified film and pure commercial L-Ta2O5 powder.
Figure 4 displays the powder XRD patterns of the planar waveguides prepared with several Er3+ doping concentrations. All the powder XRD patterns showed the characteristic L-Ta2O5 diffraction peak at 23°, attributed to the (0 0 1) plane, attesting the crystallization of Ta2O5 nanoparticles into the silica-based host. The other powder XRD peaks of the orthorhombic L-Ta2O5 crystalline phase are not well pronounced due to the intense diffraction signals assigned to the silica on silicon (1 0 0) substrate.
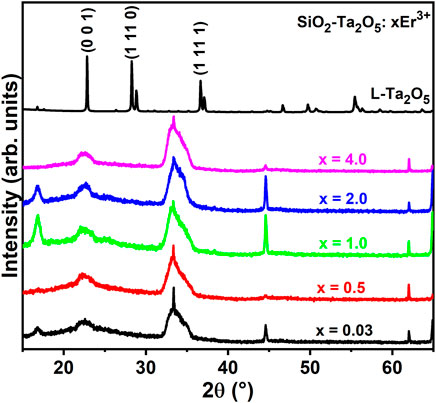
FIGURE 4. Powder XRD patterns of the 0.03, 0.5, 1.0, 2.0, and 4.0 mol% Er3+-doped SiO2-Ta2O5 films.
The planar waveguide surfaces were evaluated by atomic force microscopy (AFM) using the contact and tapping scan modes. Figure 5 shows a typical surface image of the 0.03 mol% of Er3+-doped SiO2-Ta2O5 film, which is crack-free and has a smooth surface with low roughness mean surface (Ra) of 0.205 nm. The low Ra value confirms a high optical quality of the film, as required for waveguide application, where the roughness of the surface represents a significant source of losses during light propagation. Figure 5B illustrates roughness analyses, which indicate not only a homogeneous surface but also a low content of surface defects in small depths. The presence of defects was identified on film surface by drawing profile lines on the topographical image (Figure 5C).
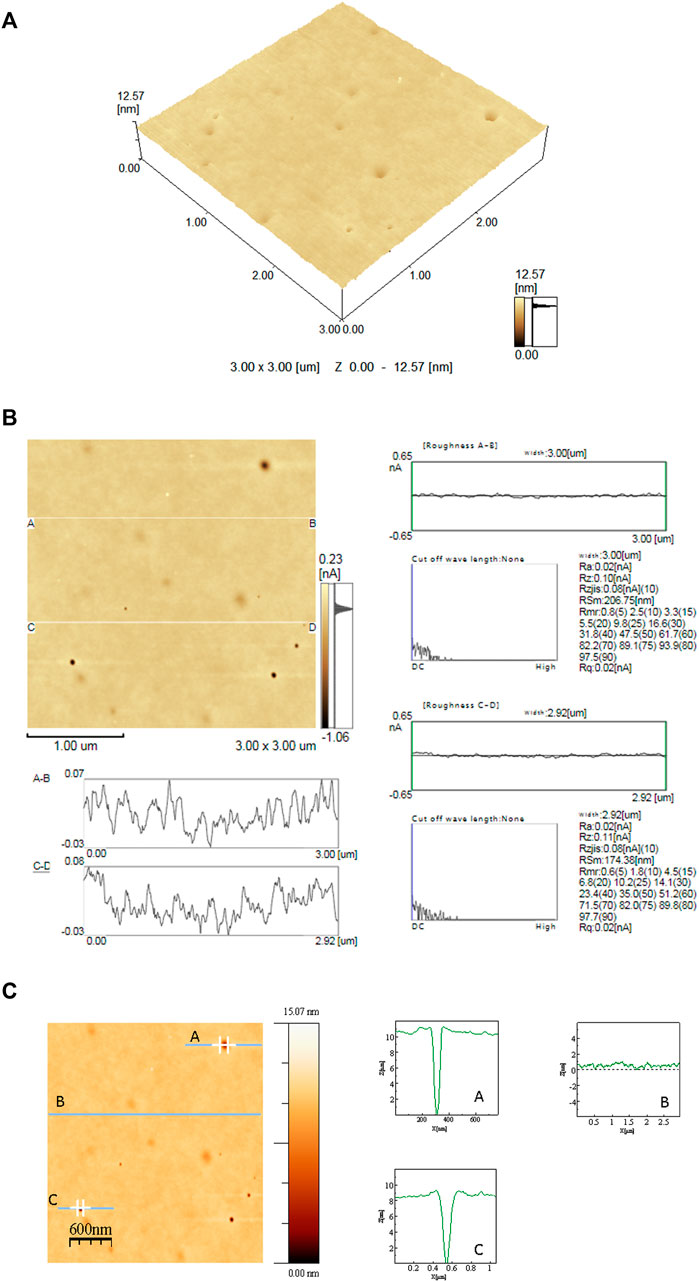
FIGURE 5. 3D (A) and 2D (B) AFM topographical images, obtained in the contact mode, of the 0.03% Er3+-doped SiO2-Ta2O5 multilayered film prepared by the sol-gel route and deposited on a SiO2/Si substrate. (C) 2D AFM topographical image obtained in the contact mode of drawing profile lines the 0.03% Er3+-doped SiO2-Ta2O5 multilayered film prepared by the sol-gel route, deposited on a SiO2/Si substrate.
Figure 5C illustrates the depth profiles of the segments displayed in the 2D AFM image. Considering the surface roughness in the A and C traces, we observed pores with a minimum height of 8 nm and diameters between 39 and 137 nm.
The purpose of using the dynamic mode is to map differences in viscoelasticity on the sample surface, which allows the Ta2O5 nanocrystals to be detected on the SiO2 amorphous host (Pang et al., 2000). The phase images obtained by scanning the film in the dynamic mode show the regions with low viscoelasticity composition, corresponding to the Ta2O5 nanocrystals, in darker tones than the silica-based host (Figure 6).
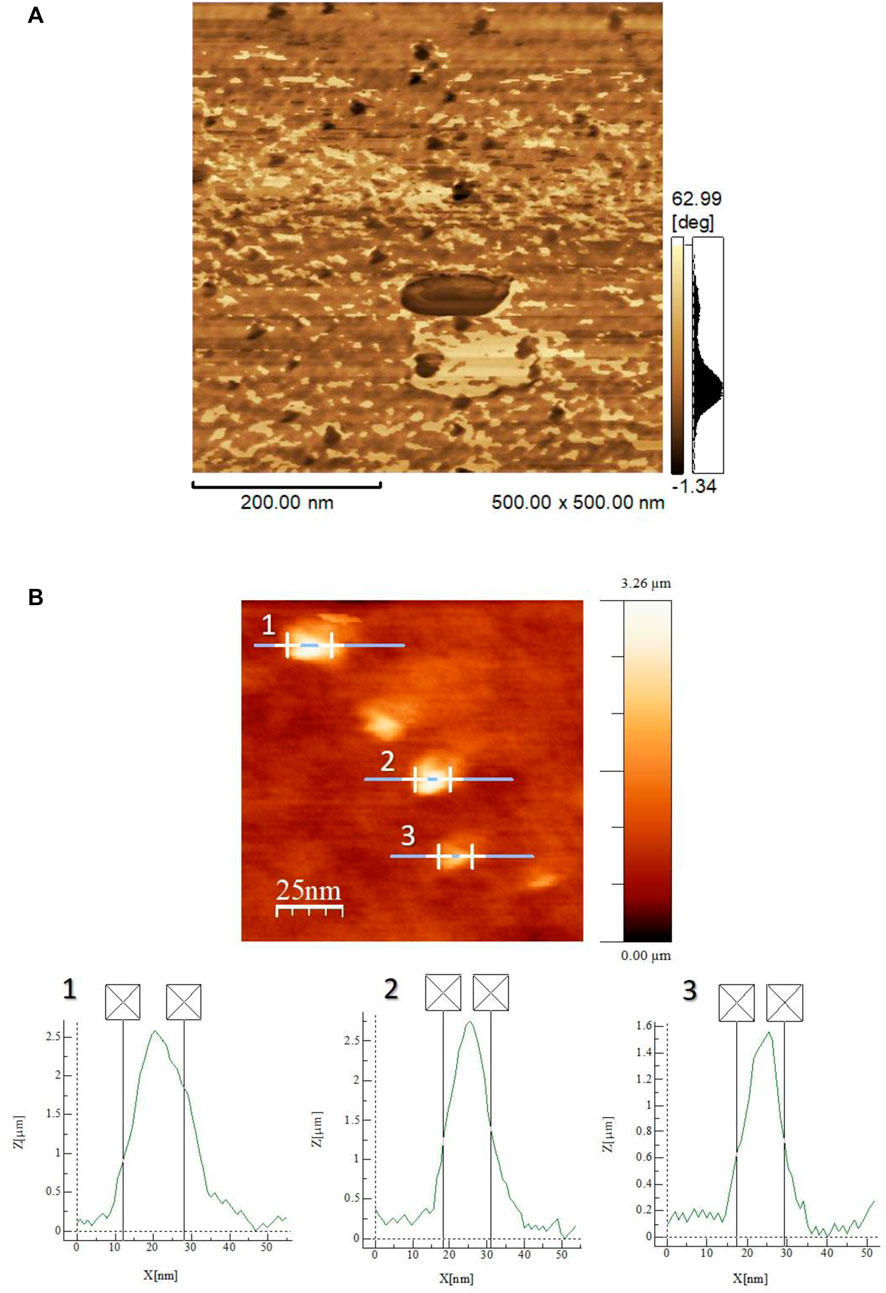
FIGURE 6. AFM phase-contrast image (A) and 2D AFM topographical image obtained in the dynamic mode and the bright spot dimension graphs (B) of the 0.03% Er3+-doped SiO2-Ta2O5 multilayered film prepared by the sol–gel route, deposited on a SiO2/Si substrate.
Figure 6B displays the 2D AFM topographical image obtained in the dynamic mode of the 0.03% Er3+-doped SiO2-Ta2O5 planar waveguide. We attributed the bright regions in the topographical images (Figure 6B) of this glass ceramic matrix to superficial Ta2O5 nanocrystals and/or aggregates. The bright spot diameters ranged from 12 to 16 nm. These Ta2O5 dimensions agreed with the crystallite size values calculated from the most intense L-Ta2O5 diffraction peak of the Er3+-doped SiO2-Ta2O5 nanocomposites. It is important to emphasize that usually the characterization of films using techniques such as transmission electron microscopy to observe the formation of nanocrystals requires complex techniques for sample preparation with high cost and long time. In this work, an AFM was applied mapping the sample according to viscoelastic properties. This allowed the observation of the formation of tantalum oxide nanocrystals distributed in the homogeneous silica-based matrix.
Figure 7 shows the PL emission spectra of the triply doped SiO2-Ta2O5 nanocomposites in the NIR region under excitation at 808 and 980 nm. Intense broad NIR emission band was detected, with maximum positioned around 1.3-, 1.5-, and 1.65-µm regions, assigned to the 4F3/2→4I13/2, 4I13/2→4I15/2, and 3F4→3H6 transitions of the Nd3+, Er3+, and Tm3+ ions, respectively. Figure 8 displays the diagram of partial energy levels of the Er3+, Yb3+, Tm3+, and Nd3+ ions and the possible excitation/emission mechanisms involved in the intraconfigurational f-f transitions in the NIR region. Table 3 lists the full-width at half-maximum (FWHM) values of the bands centered in the 1.5-µm region. The most satisfactory results concerning broad NIR emission emerge upon excitation at 808 nm, with FWHM value of 173 (±5 nm), which has been observed for the Er3+/Tm3+/Nd3+ doped SiO2-Ta2O5 nanocomposite. The FWHM values obtained in the present work are lower than ones obtained for some RE-doped tellurite glass (Rivera et al., 2014; Hou et al., 2021). However, they are similar to others presented in the literature (Han et al., 2014; Shen et al., 2020a). The advantage of using SiO2-Ta2O5 based materials is related to their low toxicity, easy preparation, stability under different chemical and physical conditions, not mention the optical properties of silica.
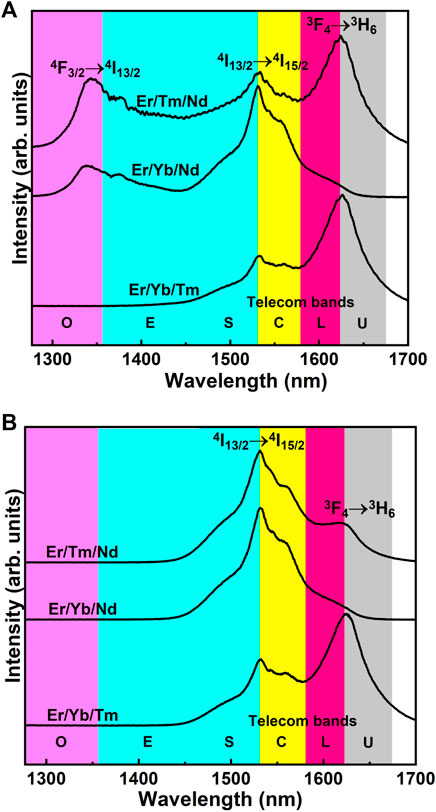
FIGURE 7. PL emission spectra of triply doped SiO2-Ta2O5 nanocomposites under excitation at (A) 808 nm and (B) 980 nm.
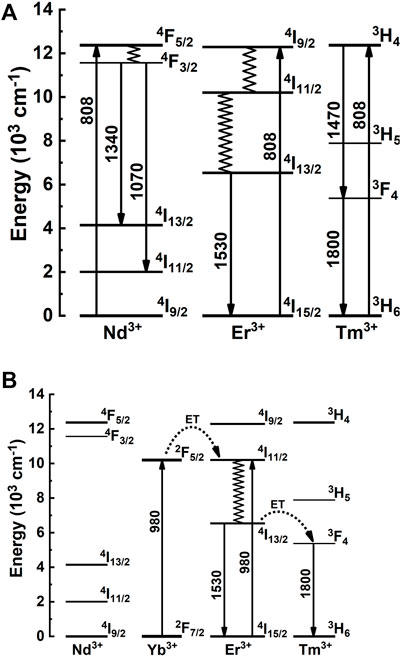
FIGURE 8. Partial energy levels diagram of the Nd3+, Er3+ and Tm3+ ions under excitation at 808 nm (A), and Yb3+, Er3+, Tm3+ ions under excitation at 980 nm (B) and possible excitation/emission mechanisms.
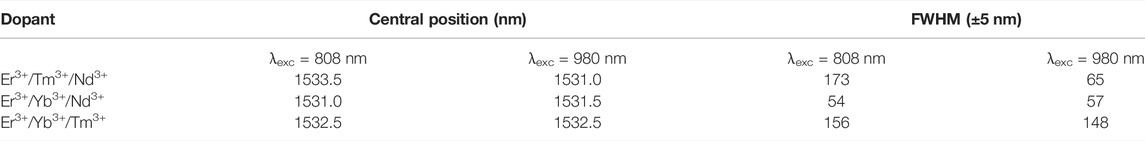
TABLE 3. FWHM values of triply doped SiO2-Ta2O5 nanocomposites under excitation at 808 and 980 nm.
The inhomogeneous broadening of all the NIR emission spectra demonstrated that the Er3+, Nd3+, and Tm3+ ions were preferentially located in different symmetry sites of the orthorhombic L-Ta2O5 structure, as observed previously by Er3+ doped SiO2-Ta2O5 nanocomposite (; Ferrari et al., 2011a and Ferrari et al., 2011b).
Figure 9 shows the emission spectra in the infrared range of the SiO2-Ta2O5 nanocomposites doped with several Er3+ concentrations. The broadbands are assigned to the Er3+:4I13/2→4I15/2 transition, with maximum emission centered around 1534 nm and bandwidths between 77 and 93 nm (Table 4). These bandwidth values were larger compared to other Er3+-doped matrixes reported in the literature:Er3+-doped silica-hafnia, with bandwidth of 48 nm (Gonçalves et al., 2002); Er3+:SiO2-Al2O3, with bandwidth of 47 nm (Benatsou et al., 1997), Er3+-doped niobic tellurite glass (Lin et al., 2003); Er3+, Yb3+:Bi2ZnB2O7 glass-ceramic, with bandwidth of 84 nm (Li et al., 2019); and Er3+:SiO2-Ta2O5 nanocomposite films, with bandwidth of 64 nm (Ferrari et al., 2010), among others.

FIGURE 9. Emission spectra in the infrared region of the 0.03, 0.1, 0.3, 0.5, 1, 2, and 4 mol% Er3+-doped SiO2-Ta2O5 nanocomposites calcined at 1100°C for 8 h, under excitation at 980 nm with 100-mW power pump.
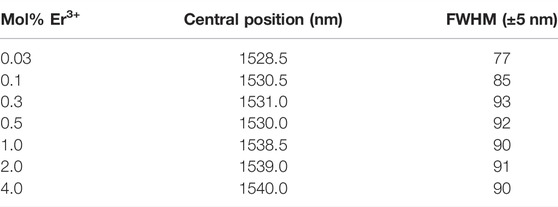
TABLE 4. Values of central positions and bandwidths of the 4I13/2 → 4I15/2 Er3+ transition for Er3+-doped SiO2-Ta2O5 nanocomposites doped with different Er3+ concentrations, annealed at 1100°C for 8 h.
The nanocomposite 0.3 mol% Er3+-doped SiO2-Ta2O5 have the broadest NIR emission, with FWHM of 93 (±3 nm). Table 4 depicts the central position and inhomogeneous broadening values of the nanocomposites doped with different Er3+ concentrations. Inhomogeneous broadening of the 0.03 and 0.1 mol% Er3+-doped SiO2-Ta2O5 nanocomposites was relatively narrower compared to the other nanocomposites. It was clearly observed that for higher concentrations there was an FWHM values increase to 90 nm (±3 nm).
The 4.0 mol% Er3+-doped SiO2-Ta2O5 nanocomposite had an intermediate relative intensity due to luminescence quenching, which can be associated with non-radiative processes, such as energy migration and up-conversion. This observation will be confirmed by the lifetime values.
The high RE3+ doping level can promote cluster formation, which contributes to energy losses via non-radiative processes (Auzel and Goldner, 2001). Therefore, this type of energy transfer mechanism via a non-radiative process can be controlled according to the ion concentration and its distribution into the host.
As previously reported for Er3+-doped SiO2-Ta2O5 systems, RE3+ ions are preferentially distributed in a rich Ta2O5 environment. Such inhomogeneous broadenings can be attributed to the particular orthorhombic L-Ta2O5 crystalline phase, which presents many different symmetry sites, more precisely 12 sites where Er3+ ions can substitute the Ta5+ ions and/or occupy interstitial spaces of the Ta2O5 structure (Ferrari et al., 2011b). To study the presence of clusters and non-radiative luminescence-suppressing processes, luminescence decay curves were collected and the lifetime of the 4I13/2 excited state of the Er3+ ions was calculated as a function of the concentration of the dopant ions. NIR photoluminescence decay curves are displayed in Figure 10.
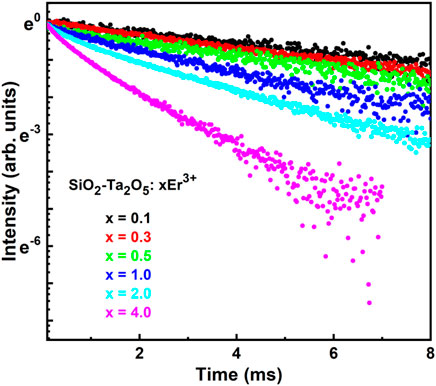
FIGURE 10. Photoluminescence decay curves of the 4I13/2 → 4I15/2 transition of Er3+ ions in the 0.1, 0.3, 0.5, 1.0, 2.0, and 4.0 mol% Er3+-doped SiO2-Ta2O5-based waveguides, obtained by using 100 mW excitation power at 980 nm.
Figure 10 shows that the NIR photoluminescence decay curves of the planar waveguides with Er3+ doping level up to 0.5 mol% could be well fitted by a single exponential function. Above 0.5 mol%, luminescence quenching occurred due to non-radiative process competition. This deviation from the mono-exponential decay could be related to the presence of RE clusters, which indicates to be increased for higher Er3+ concentration. The value of 1/e to estimate the 4I13/2 excited state measured lifetime values were here used as displayed in Table 5.
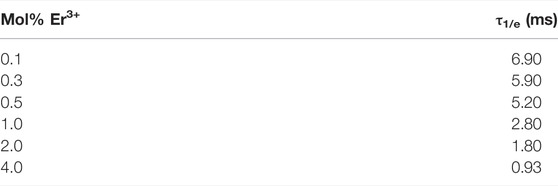
TABLE 5. 4I13/2 emitting level lifetimes of Er3+-doped SiO2-Ta2O5 planar waveguides for different Er3+ concentrations.
The lifetime values decreased as Er3+ doping level increases, as it can be seen in Figure 11. The high Er3+ concentration shortened the distance between the dopant ions distributed in the matrix, forming a cluster and promoting a non-radiative process involving energy migration. The presence of defects in the host structure caused the phonons and the dopant ions to interact, promoting electron-hole pair recombination with deactivation of the Er3+ excited state. Similar curve of 4I13/2 Er3+ lifetime values versus dopant concentration has been reported for Er3+-doped SiO2-HfO2 planar waveguides as a function of Er3+ concentration from 0.01 to 4.0 mol%, in which the lifetime decreased from 6.7 to 1.1 ms (Gonçalves et al., 2004). These 4I13/2 emitting level lifetime behaviors as a function of the Er3+ concentration, the so-called quenching concentration, are described by the following empirical equation (Orignac et al., 1999; Gonçalves et al., 2004):
where τobs is the observed emitting level lifetime, τ0 is the ideal emitting level lifetime in the limit of zero concentration, r is the Er3+ concentration, Q is the quenching concentration, and p is a phenomenological parameter characterizing the steepness of the corresponding quenching curve.
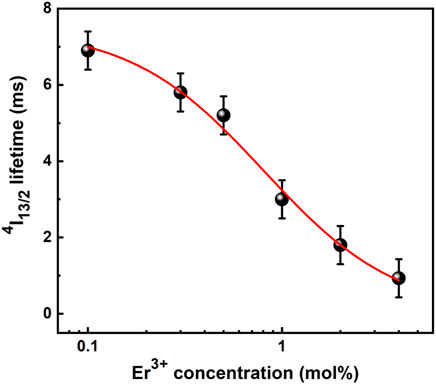
FIGURE 11. Lifetime values of the 4I13/2 → 4I15/2 transition of Er3+-doped SiO2-Ta2O5 based waveguides as a function of Er3+ doping concentrations (from 0.1 to 4.0 mol%). The best fit is represented by the red line.
Figure 11 shows the measured luminescence lifetime of the 4I13/2 Er3+ metastable state for the Er3+-doped SiO2-Ta2O5 films as a function of Er3+ concentration. Fitting the experimental data to the empirical Eq. 1, we obtained the following parameters for the best fit represented by the red line: τ0= 7.49 ms, Q= 0.81 mol%, and p = 1.26. The Er3+-doped SiO2-Ta2O5 films exhibited higher quenching concentration compared to other materials. In particular, the quenching concentration of 0.81 mol% was relatively higher than the value of 0.62 mol% reported for the Er3+/Yb3+-codoped 80SiO2–20TiO2–zAl2O3 (Orignac et al., 1999) and equal to the value of 0.81 mol% described for Er3+-doped 70SiO2-30HfO2 (Gonçalves et al., 2004), proving that tantalum oxide is a promising host for RE ions for NIR broadband emission.
In this work, the potential for obtaining broad and super broadband NIR emission from silicate systems containing tantalum oxide nanocrystals doped with rare earth ions was proved, showing a set of optimal features making them promising candidates for active planar waveguides operating in wide range of telecom band.
RE3+- doped SiO2-Ta2O5 nanocomposites and planar waveguides were prepared by the sol–gel method and the dip-coating technique, for film deposition. XRD analysis revealed the presence of L-Ta2O5 nanocrystals dispersed in the SiO2 amorphous host. High RE3+ concentrations can reduce the crystallinity and the crystallite sizes of the Ta2O5 in SiO2-Ta2O5 nanocomposites and waveguides. AFM revealed uniform surface with roughness in the order of 0.2 nm, attesting to the excellent quality of these waveguides for optical applications give those optical losses by light scattering are avoided. All the SiO2-Ta2O5 nanocomposites display broadband emission, with maximum at 1534 nm and bandwidths ranging from 77 to 93 nm for Er3+-doped and up to 173 nm for Er3+/Tm3+/Nd3+-doped. The Er3+ 4I13/2 lifetimes of the Er3+-doped SiO2-Ta2O5 waveguides diminish as a function of the Er3+ content. Emission quenching of the Er3+-doped SiO2-Ta2O5 based waveguides due to the Er3+ doping level is negligible up to 0.81 mol%. Such properties make the present materials interesting systems for applications in photonics.
The original contributions presented in the study are included in the article, further inquiries can be directed to the corresponding author.
KD prepared, organized and conducted the Er3+-doped SiO2-Ta2O5 sample experiments, analyzed the data, and wrote and revised the manuscript. FC organized and conducted the triply doped SiO2-Ta2O5 sample experiments, analyzed the data, and wrote and revised the manuscript. VvS, CC, VsS, and LR prepared the triply doped samples and conducted the sample experiments. JF participated in the discussion of the results and revised the manuscript. IB performed and analyzed the AFM data experiments, participated in the discussion of the film AFM results. RG coordinated the project and revised the manuscript. All the authors contributed to the article and approved the submitted version.
This work was supported by Conselho Nacional de Desenvolvimento Científico e Tecnológico (CNPq), Coordenação de Aperfeiçoamento de Pessoal de Nível Superior (CAPES), Fundação de Amparo à Pesquisa do Estado de São Paulo (FAPESP, Projects n° 2018/18213-4, 2020/05319-9, 2017/10423-7).
The authors declare that the research was conducted in the absence of any commercial or financial relationships that could be construed as a potential conflict of interest.
The handling editor LR declared a shared affiliation with the authors at the time of review.
All claims expressed in this article are solely those of the authors and do not necessarily represent those of their affiliated organizations, or those of the publisher, the editors and the reviewers. Any product that may be evaluated in this article, or claim that may be made by its manufacturer, is not guaranteed or endorsed by the publisher.
The authors would like to thank Lourivaldo dos Santos Pereira, who performed the XRD measurements; Cynthia Maria de Campos Prado Manso, who reviewed the text; and the Department of Chemistry- FFCLRP, University of São Paulo for the opportunity of using its facilities. KD acknowledges FAPESP (grant number 2018/18213-4) for the scholarship. FC acknowledges CNPq for financial support, FAPESP (grant numbers 2017/10423-7 and 2019/25991-6) and CAPES (grant number 88881.188839/2018-01-PDSE) for the scholarships. RG acknowledges CNPq (grant number 303110/2019–8) and FAPESP (grant number 2020/05319-9) for financial support.
Aquino, F. T., Caixeta, F. J., de Oliveira Lima, K., Kochanowicz, M., Dorosz, D., and Gonçalves, R. R. (2018). Broadband NIR Emission from Rare Earth Doped-SiO2-Nb2O5 and SiO2-Ta2O5 Nanocomposites. J. Luminescence 199, 138–142. doi:10.1016/j.jlumin.2018.03.018
Auzel, F., and Goldner, P. (2001). Towards Rare-Earth Clustering Control in Doped Glasses. Opt. Mater. 16, 93–103. doi:10.1016/S0925-3467(00)00064-1
Benatsou, M., Capoen, B., Bouazaoui, M., Tchana, W., and Vilcot, J. P. (1997). Preparation and Characterization of Sol-Gel Derived Er3+: Al2O3-SiO2 Planar Waveguides. Appl. Phys. Lett. 71, 428–430. doi:10.1063/1.119569
Cisco (2020). Annual Internet Report (2018–2023). Available online: https://www.cisco.com/c/en/us/solutions/collateral/ executive-perspectives/annual-internet-report/white-paper-c11-741490.html (Accessed on February 14, 2022).
Dan, H. K., Le, D.-N., Nguyen-Truong, H. T., Tap, T. D., Vinh, H. X., Ty, N. M., et al. (2020). Effects of Y3+on the Enhancement NIR Emission of Bi+-Er3+ Co-doped in Transparent Silicate Glass-Ceramics for Erbium-Doped Fiber Amplifier (EDFA). J. Luminescence 219, 116942. doi:10.1016/j.jlumin.2019.116942
Ferrari, J. L., Lima, K. D. O., and Gonçalves, R. R. (2021). Refractive Indexes and Spectroscopic Properties to Design Er3+-Doped SiO2-Ta2O5 Films as Multifunctional Planar Waveguide Platforms for Optical Sensors and Amplifiers. ACS OMEGA 6, 8784–8796. doi:10.1021/acsomega.0c05351
Desurvire, E., Simpson, J. R., and Becker, P. C. (1987). High-Gain Erbium-Doped Traveling-Wave Fiber Amplifier. Opt. Lett. 12, 888. doi:10.1364/ol.12.000888
Ferrari, J. L., Lima, K. O., Maia, L. J. Q., and Gonçalves, R. R. (2010). Sol-gel Preparation of Near-Infrared Broadband Emitting Er3+-Doped SiO2-Ta2O5 Nanocomposite Films. Thin Solid Films 519, 1319–1324. doi:10.1016/j.tsf.2010.09.035
Ferrari, J. L., Lima, K. O., Maia, L. J. Q., Ribeiro, S. J. L., Gomes, A. S. L., and Gonçalves, R. R. (2011a). Broadband NIR Emission in Sol-Gel Er3+-Activated SiO2-Ta2O5 Glass Ceramic Planar and Channel Waveguides for Optical Application. J. Nanosci. Nanotech. 11, 2540–2544. doi:10.1166/jnn.2011.3565
Ferrari, J. L., Lima, K. O., Maia, L. J. Q., Ribeiro, S. J. L., and Gonçalves, R. R. (2011b). Structural and Spectroscopic Properties of Luminescent Er3+-Doped SiO2-Ta2O5 Nanocomposites. J. Am. Ceram. Soc. 94, 1230–1237. doi:10.1111/j.1551-2916.2010.04191.x
Gonçalves, R. R., Carturan, G., Montagna, M., Ferrari, M., Zampedri, L., Pelli, S., et al. (2004). Erbium-activated HfO2-Based Waveguides for Photonics. Opt. Mat. (Amst). 25, 131–139. doi:10.1016/S0925-3467(03)00261-1
Gonçalves, R. R., Carturan, G., Zampedri, L., Ferrari, M., Montagna, M., Chiasera, A., et al. (2002). Sol-gel Er-Doped SiO2-HfO2 Planar Waveguides: A Viable System for 1.5 μm Application. Appl. Phys. Lett. 81, 28–30. doi:10.1063/1.1489477
Han, X., Shen, L., Pun, E. Y. B., Ma, T., and Lin, H. (2014). Pr3+-doped Phosphate Glasses for Fiber Amplifiers Operating at 1.38-1.53μm of the Fifth Optical Telecommunication Window. Opt. Mater. 36, 1203–1208. doi:10.1016/j.optmat.2014.02.032
He, H. Y., Fei, J., and Lu, J. (2015). Sm-doping Effect on Optical and Electrical Properties of ZnO Films. J. Nanostruct Chem. 5, 169–175. doi:10.1007/s40097-015-0147-0
Herrera, A., Londoño, F., and Balzaretti, N. M. (2021). Structural and Optical Properties of Nd3+ Doped GeO2-PbO Glass Modified by TiO2 for Applications in Laser and Fiber Amplifier. Opt. Mater. 113, 110884–110889. doi:10.1016/j.optmat.2021.110884
Hou, G., Cao, L., Zhang, C., Yu, X., Fu, W., Li, G., et al. (2021). Improvement of Ultra-broadband Near-Infrared Emission in Nd3+-Er3+-Pr3+ Tri-doped Tellurite Glasses. Opt. Mater. 111, 110547. doi:10.1016/j.optmat.2020.110547
Huang, L., Shen, S., and Jha, A. (2004). Near Infrared Spectroscopic Investigation of Tm3+-Yb3+ Co-doped Tellurite Glasses. J. Non-Crystalline Solids 345-346, 349–353. doi:10.1016/j.jnoncrysol.2004.08.042
Kayani, Z. N., Sahar, M., Riaz, S., Naseem, S., and Saddiqe, Z. (2020). Enhanced Magnetic, Antibacterial and Optical Properties of Sm Doped ZnO Thin Films: Role of Sm Doping. Opt. Mater. 108, 110457. doi:10.1016/j.optmat.2020.110457
Khamis, M. A., and Ennser, K. (2018). “Comparative Studies of Thulium and Erbium-Doped Fiber Amplifiers for Dynamic Optical WDM Networks,” in 2018 IEEE British and Irish Conference on Optics and Photonics (BICOP), London, UK, 12-14 December 2018, 1–4. doi:10.1109/BICOP.2018.8658309
Li, G. S., Zhang, C. M., Zhu, P. F., Jiang, C., Song, P., and Zhu, K. (2016). Broadband Near-Infrared Emission in Pr3+-Er3+ Codoped Phosphate Glasses for Optical Amplifiers. Ceram. Int. 42, 5558–5561. doi:10.1016/j.ceramint.2015.12.026
Li, M., Luan, J., Zhang, Y., Jiang, F., Zhou, X., Tang, J., et al. (2019). Spectroscopic Properties of Er/Yb Co-doped Glass Ceramics Containing Nanocrystalline Bi2ZnB2O7 for Broadband Near-Infrared Emission. Ceram. Int. 45, 18831–18837. doi:10.1016/j.ceramint.2019.06.116
Lin, H., Meredith, G., Jiang, S., Peng, X., Luo, T., Peyghambarian, N., et al. (2003). Optical Transitions and Visible Upconversion in Er3+ Doped Niobic Tellurite Glass. J. Appl. Phys. 93, 186–191. doi:10.1063/1.1527209
Martins, M. M., Kassab, L. R. P., da Silva, D. M., and de Araújo, C. B. (2019). Tm3+ Doped Bi2O3-GeO2 Glasses with Silver Nanoparticles for Optical Amplifiers in the Short-Wave-Infrared-Region. J. Alloys Compd. 772, 58–63. doi:10.1016/j.jallcom.2018.08.146
Mears, R. J., Reekie, L., Jauncey, I. M., and Payne, D. N. (1987). Low-Noise Erbium-Doped Fibre Amplifier Operating at 1.54 μm. Electron. Lett. 23, 1026. doi:10.1049/el:19870719
Meng, X.-g., Qiu, J.-r., Peng, M.-y., Chen, D.-p., Zhao, Q.-z., Jiang, X.-w., et al. (2005). Near Infrared Broadband Emission of Bismuth-Doped Aluminophosphate Glass. Opt. Express 13, 1628–1634. doi:10.1364/OPEX.13.001628
Muscelli, W. C., Lima, K. d. O., Thomaz Aquino, F., and Gonçalves, R. R. (2016). Blue and NIR Emission from Nanostructured Tm3+/ Yb3+co-Doped SiO2-Ta2O5for Photonic Applications. J. Phys. D. Appl. Phys. 49, 175107–175111. doi:10.1088/0022-3727/49/17/175107
Orignac, X., Barbier, D., Min, X., Almeida, R. M., Mccarthy, O., and Yeatman, E. (1999). Sol–gel Silica/titania-On-Silicon Er/Yb-Doped Waveguides for Optical Amplification at 1.5 μm. Opt. Mater. 12, 1–18. doi:10.1016/S0925-3467(98)00076-7
Pang, G. K. H., Baba-Kishi, K. Z., and Patel, A. (2000). Topographic and Phase-Contrast Imaging in Atomic Force Microscopy. Ultramicroscopy 81, 35–40. doi:10.1016/S0304-3991(99)00164-3
Patterson, A. L. (1939). The Scherrer Formula for X-Ray Particle Size Determination. Phys. Rev. 56, 978–982. doi:10.1103/PhysRev.56.978
PCH (2021). Packet Clearing House, Internet Exchange Point Directory Reports. Available online: http://www.pch.net/ixp/summary (accessed on February 14, 2022).
Perrella, R. V., Dos Santos, D. P., Poirier, G. Y., Góes, M. S., Ribeiro, S. J. L., Schiavon, M. A., et al. (2014). Er3+-doped Y2O3 Obtained by Polymeric Precursor: Synthesis, Structure and Upconversion Emission Properties. J. Luminescence 149, 333–340. doi:10.1016/j.jlumin.2014.01.052
Rivera, V. A. G., El-Amraoui, M., Ledemi, Y., Messaddeq, Y., and Marega, E. (2014). Expanding Broadband Emission in the Near-IR via Energy Transfer between Er3+-Tm3+ Co-doped Tellurite-Glasses. J. Luminescence 145, 787–792. doi:10.1016/j.jlumin.2013.08.071
Shen, X., Zhang, Y., Xia, L., Li, J., Yang, G., and Zhou, Y. (2020a). Broadband Flat Near-Infrared Emission from Tellurite Glass Doped with Tm3+, Er3+ and Ag NPs. Opt. Laser Technol. 129, 106264. doi:10.1016/j.optlastec.2020.106264
Shen, X., Zhang, Y., Xia, L., Li, J., Yang, G., and Zhou, Y. (2020b). Dual Super-broadband NIR Emissions in Pr3+-Er3+-Nd3+ Tri-doped Tellurite Glass. Ceram. Int. 46, 14284–14286. doi:10.1016/j.ceramint.2020.02.196
Shkir, M. (2020). Noticeable Impact of Er Doping on Structural, Vibrational, Optical, Dielectric and Electrical Parameters of Flash Combustion Synthesized NiO NPs for Optoelectronic Applications. Inorg. Chem. Commun. 121, 108229. doi:10.1016/j.inoche.2020.108229
Stephenson, N. C., and Roth, R. S. (1971). Structural Systematics in the Binary System Ta2O5–WO3. V. The Structure of the Low-Temperature Form of Tantalum Oxide L-Ta2O5. Acta Crystallogr. Sect. B Struct. Crystallogr. Cryst. Chem. 27, 1037–1044. doi:10.1107/s056774087100342x
Sun, H.-T., Zhou, J., and Qiu, J. (2014). Recent Advances in Bismuth Activated Photonic Materials. Prog. Mater. Sci. 64, 1–72. doi:10.1016/j.pmatsci.2014.02.002
Terui, H., and Kobayashi, M. (1978). Refractive‐index‐adjustable SiO2‐Ta2O5films for Integrated Optical Circuits. Appl. Phys. Lett. 32, 666–668. doi:10.1063/1.89848
Thipparapu, N. K., Wang, Y., Wang, S., Umnikov, A. A., Barua, P., and Sahu, J. K. (2019). Bi-doped Fiber Amplifiers and Lasers [Invited]. Opt. Mat. Express 9, 2446. doi:10.1364/ome.9.002446
Xia, L., Zhang, Y., Ding, J., Li, C., Shen, X., and Zhou, Y. (2021). Er3+/Tm3+/Nd3+ Tri-doping Tellurite Glass with Ultra-wide NIR Emission. J. Alloys Compd. 863, 158626. doi:10.1016/j.jallcom.2021.158626
Keywords: NIR emission, broad band, waveguide, glass ceramic, rare earth
Citation: De Oliveira Lima K, Caixeta FJ, Souza VDSD, Rosa LS, Soares VDV, Crumo CA, Borin IA, Ferrari JL and Gonçalves RR (2022) Super Broadband at Telecom Wavelengths From RE3+-Doped SiO2-Ta2O5 Glass Ceramics Planar Waveguides. Front. Chem. 10:915335. doi: 10.3389/fchem.2022.915335
Received: 07 April 2022; Accepted: 02 June 2022;
Published: 04 July 2022.
Edited by:
Lucas Rodrigues, University of São Paulo, BrazilReviewed by:
Sabari Girisun T. C., Bharathidasan University, IndiaCopyright © 2022 De Oliveira Lima, Caixeta, Souza, Rosa, Soares, Crumo, Borin, Ferrari and Gonçalves. This is an open-access article distributed under the terms of the Creative Commons Attribution License (CC BY). The use, distribution or reproduction in other forums is permitted, provided the original author(s) and the copyright owner(s) are credited and that the original publication in this journal is cited, in accordance with accepted academic practice. No use, distribution or reproduction is permitted which does not comply with these terms.
*Correspondence: Rogéria Rocha Gonçalves, cnJnb25jYWx2ZXNAZmZjbHJwLnVzcC5icg==
Disclaimer: All claims expressed in this article are solely those of the authors and do not necessarily represent those of their affiliated organizations, or those of the publisher, the editors and the reviewers. Any product that may be evaluated in this article or claim that may be made by its manufacturer is not guaranteed or endorsed by the publisher.
Research integrity at Frontiers
Learn more about the work of our research integrity team to safeguard the quality of each article we publish.