Corrigendum: Modifying SnS2 with carbon quantum dots to improve photocatalytic performance for Cr(VI) reduction
 Weidong Li1,2†*
 Jianping Qiu1†*Haihong Jin3Yuanyuan Wang4Dandan Ma5Xinxiang Zhang4Huayun Yang2Fangyuan Wang6*
- 1Zhejiang Normal University Xingzhi College, Jinhua, China
- 2Hangzhou Normal University Qianjiang College, Hangzhou, China
- 3Zhejiang Hongyi Environmental Protection Technology Co., Ltd., Hangzhou, China
- 4Environmental Engineering Corporation of Zhejiang Province, Hangzhou, China
- 5Zhejiang Tianchuan Environmental Science and Technology Co., Ltd., Hangzhou, China
- 6Zhejiang Normal University, Jinhua, China
The photoreduction for hazardous Cr(VI) in industrial wastewater has been considered a “green” approach with low-cost and easy-to-go operation. SnS2 is a promising narrow bandgap photocatalyst, but its low charge carrier separation efficiency should be solved first. In this work, N-doped carbon quantum dots (CQDs) were prepared and loaded onto SnS2 nanoparticles via an in situ method. The resulting composite samples (NC@SnS2) were characterized, and their photocatalytic performance was discussed. SnS2 nanoparticles were obtained as hexagonal ones with a bandgap of 2.19 eV. The optimal doping level for NC@SnS2 was citric acid: urea:SnS2 = 1.2 mmol:1.8 mmol:3.0 mmol. It showed an average diameter of 40 nm and improved photocatalytic performance, compared to pure SnS2, following a pseudo-first-order reaction with a kinetic rate constant of 0.1144 min−1. Over 97% of Cr(VI) was photo-reduced after 30 min. It was confirmed that modification of SnS2 with CQDs can not only improve the light-harvesting ability but also stimulate the charge separation, which therefore can enhance the photoreactivity of SnS2 toward Cr(VI) reduction. The excellent stability of NC@SnS2 indicates that it is promising to be practically used in industrial wastewater purification.
Introduction
Due to the increasing industrial activities, more and more wastewater needs to be treated since it contains heavy metal ions, toxic matters, and hazardous compounds (Lofrano et al., 2013). Among the highly concerned metal ions in industrial wastewater, Cr(VI) attracts public attention since it is easily assimilated by the human body with accumulation effect, exerting harmful effects to the liver. Liver cancer has been related to the excess uptake of Cr(VI). As a consequence, Cr(VI) total amount is listed as one of the quality control quotas for industrial wastewater (Al Nafiey et al., 2017). Among the multiple treatment approaches for industrial wastewater, such as water splitting, CO2 reduction, N2 fixation, and full adsorption/removal, photoreduction seems like an economic approach with easy-to-go operation and acceptable performance (Santosa et al., 2008; Ji et al., 2015; Shi et al., 2018; Tasbihi et al., 2018; Wang et al., 2018). For example, Sun and coworkers reported the adsorption and removal performance of the yttrium-based metal-organic framework, which allows efficient removal of Sb(VI) in water (Li Q. et al., 2022). Liu and Yang reported a carnation flower-like Bi2O2CO3 photocatalyst for the photoreduction of Cr(VI) (Li L. et al., 2022). Here, with the help of photocatalysts, Cr(VI) is reduced to Cr(III) which is considered less harmful to the human body.
For most reported photocatalysts, high excitation energy in the UV region is required since they are wide bandgap semiconductors. As a consequence, the application of these wide bandgap photocatalysts needs to be assisted by UV-radiation when processing wastewater. To explore narrow bandgap photocatalysts which are expected to be excited by natural solar spectrum, metal sulfide semiconductors have been intensively explored (Azimi and Nezamzadeh-Ejhieh, 2015; Xiao and Jiang, 2017; Yan et al., 2017; Li et al., 2018). For example, Lv and coworkers have reported a series of photocatalysts based on Bi2O2CO3 and Bi2WO6@Bi2S3 with visible photoreactivity for NO oxidation and brilliant red X-3B dye (X3B) (Huang et al., 2018; Yang et al., 2019). These works spark the exploration for narrow bandgap photocatalysts. Among these metal sulfide candidates, tin disulfide (SnS2) seems attractive due to its perfect spectral matching with solar spectrum, low cost, and more importantly, low bio-toxicity (Cheng et al., 2017). A problem faced by SnS2-based semiconductors is their low photocatalytic efficiency. To solve this problem, co-catalysts are doped into SnS2, aiming at a higher separation/transportation efficiency of photogenerated charge carriers, so that the photocatalytic efficiency of SnS2 can be improved (Guo et al., 2016; Jing et al., 2018).
Among the various proposed photosensitizers for photocatalysis, carbon quantum dots (CQDs) have drawn much research attention owing to their virtues of chemical stability, bio-compatibility, economic synthesis, and excellent photoactivity, along with their promising photoelectronic and photocatalytic performance (Zhang et al., 2012; Jiang et al., 2015; Yu et al., 2016). For CQDs smaller than 10 nm, they are composed of sp2/sp3-hybridized C atoms, with a narrow bandgap covering the whole visible region and even the near-infrared region. In addition, their optoelectronic property, including their bandgap, can be conveniently modified by chemical modifications, offering various kinds of CQDs to meet the requirement for photocatalytic application (Yu et al., 2016).
Guided by the aforementioned consideration, in this work, we intend to prepare N-doped CQDs and modify SnS2 with these N-doped CQDs. Here, the doped N atoms in CQDs are supposed to offer a midgap for the photogenerated charge carriers in SnS2 semiconductors, so that the electron mobility can be improved, which promotes the separation and transportation of photogenerated charge carriers. As a consequence, improved photocatalytic efficiency from the resulting composite structure (denoted as NC@SnS2) is expected. A schematic presentation for the synthetic strategy of NC@SnS2 is shown in Scheme 1. A full characterization on NC@SnS2 is performed, and corresponding photocatalytic performance for Cr(VI) photoreduction is discussed as well.
SCHEME 1
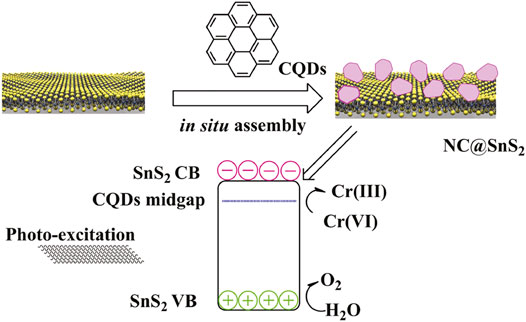
SCHEME 1. Synthetic and working strategy of NC@SnS2.
Experimental Details
Equipment and Reagents
All chemical reagents used in this work were AR-grade ones, including SnCl4, thioacetamide (TAA), citric acid (CA), urea (UA), and Nafion. Micromorphology analysis was performed using a Hitachi S4800 (SEM) microscope (Hitachi, Japan), an Oxford X-Max80 field emission scanning electron microscope (JSM-7800, JEOL), a Tecnai F20 (HRTEM), and a Talos F200X (FEI). IR, Raman, and XPS spectra were recorded on a Nicolet iS50 spectrophotometer (KBr method), a Renishaw inVia Raman microscope (excitation = 532 nm), and an ESCALAB250 X-ray Photoelectron spectrometer, respectively. Zeta potentials were determined by electrophoretic light scattering with a zeta sizer (nano series, Malvern, UK). XRD diffraction data were collected on a Rigaku MiniFlex Ultima IV diffractometer (Cu Kα source, λ = 1.5418 Å) with an operating voltage of 40 kV and a current of 15 mA. UV-Vis diffuse reflectance spectra (DRS) were recorded using a Hitachi U-4100 spectrophotometer equipped with an integrating sphere. UV-Vis absorption spectra were obtained using a Hitachi UV-2450 UV-Vis spectrophotometer. Electrochemical parameters were determined by a lock-in-based surface photovoltage (SPV) and an electrochemical workstation (CHI 760E).
Synthesis of SnS2 Nanoparticles
SnS2 nanoparticles were synthesized as follows: a homogeneous solution was prepared by mixing SnCl4 and TAA with deionized water (molar ratio = 1:3 in 70 ml). This solution was sealed in a Teflon autoclave and heated at 190oC for 6 h. The solid product was separated by centrifugation (×4,000 rpm) and washed by H2O/EtOH (1:1). Before usage, the as-synthesized SnS2 nanoparticles were activated at 60oC for 12 h.
Synthesis of NC@SnS2 samples
NC@SnS2 was synthesized by an in situ assembly method described as follows. A homogeneous solution was prepared by mixing CA and UA with deionized water (in 25 ml). The previously obtained SnS2 nanoparticles (3 mmol) were added and stirred for 30 min (×600 rpm). This suspension was sealed in a Teflon autoclave and heated at 160oC for 4 h. After natural cooling, EtOH (50 ml) was added. The solid product was separated by centrifugation (×4,000 rpm) and washed by H2O/EtOH (1:1). The obtained solid powder was dried at 80oC for 12 h and denoted as NC2-1@SnS2 (CA:UA = 0.30 mmol:0.45 mmol), NC2-2@SnS2 (CA:UA = 0.50 mmol:0.75 mmol), NC2-3@SnS2 (CA:UA = 0.90 mmol:1.35 mmol), NC2-4@SnS2 (CA:UA = 1.2 mmol:1.8 mmol), and NC2-5@SnS2 (CA:UA = 1.50 mmol:2.25 mmol).
By varying CA:UA ratio, two more NC@SnS2 samples were synthesized for performance comparison and denoted as NC1@SnS2 (CA:UA = 1.2 mmol:3.6 mmol) and NC3@SnS2 (CA:UA = 1.2 mmol:1.2 mmol).
As mentioned in Section 2.2 and Section 2.3, SnS2 nanoparticles were first prepared as the supporting host; then, a one-step in situ assembly method was used to synthesize NC@SnS2 samples by directly synthesizing/depositing CQDs on SnS2 surface, as shown in Scheme 1, instead of a two-step procedure: preparing CQDs and incorporating them onto SnS2 nanoparticles. This in situ assembly method simplified synthetic operation. In addition, the ratio of CA:UA was changed to modify the N-doping level in NC@SnS2 (corresponding to NC1@SnS2, NC2-4@SnS2, and NC3@SnS2). By fixing the ratio of CA:UA but changing the total amount of CA and UA, the CQD account in NC@SnS2 was modified as well (corresponding to the NC2@SnS2 series). For discussion convenience, CQDs (denoted as NC2 CQDs) were prepared as well, following a similar operation. It can be noticed from the following Section 2.4 that NC2 CQDs were N-doped ones, aiming at the desired performance.
Synthesis of Reference Sample: NC2 CQDs
For performance comparison, reference CQDs were synthesized. A homogeneous solution was prepared by mixing CA and UA with deionized water (1.2 mmol:1.8 mmol in 25 ml). This solution was sealed in a Teflon autoclave and heated at 160oC for 4 h. After natural cooling, EtOH (50 ml) was added. The solid product was separated by centrifugation (×4,000 rpm) and washed by H2O/EtOH (1:1). The obtained solid powder was dried in a freeze dryer for 2 days and denoted as NC2 CQDs.
Photocatalytic Performance Evaluation
The photocatalytic performance of NC@SnS2 samples was performed in a quartz reactor equipped with a cooling accessory via a water bath. The solar spectrum (excitation source) was simulated using a Xe lamp (PLS-SXE 300, 300 W) and a light filter (400 nm cutoff). The reaction temperature was set at 20oC (±2oC). NC@SnS2 (30 mg) was added into K2Cr2O7 aqueous solution (50 mg/L) and treated with an ultrasonic bath for 10 min. Then, this suspension was placed in dark for 2 h to allow full adsorption for photocatalyst. Finally, this mixture was exposed to the solar spectrum. For photoreaction monitoring, 0.3 ml of suspension was extracted each time (time interval = 300 s) and filtered off using a cellulose acetate membrane filter (pore size = 0.22 nm). The resulting solution was treated with diphenylcarbazide (as a chromogenic agent, λabs = 540 nm) and sent for UV-Vis absorption titration (Qu et al., 2013). Cr(VI) amount was proportional to the absorbance at 540 nm, so its photoreduction percentage was calculated by A/A0. Here, A0 was the initial absorbance value. It was noted that the adsorption of Cr(VI) on the surface of the photocatalyst is negligible (less than 2%), and modification of SnS2 with CODs has little effect on Cr(VI) adsorption.
The recycling performance of NC@SnS2 samples was evaluated as follows: after photoreaction, NC@SnS2 samples were filtered off and washed with plenty of freshwater. After being dried at 80oC for 12 h, the recycled NC@SnS2 samples were obtained.
Electrochemical Performance Evaluation
Photo-generated charge transfer behavior was evaluated using an electrochemical workstation (CHI 760E). A three-electrode system was selected, with a Pt wire as the counter electrode, Ag/AgCl (saturated KCl) as the reference electrode, and NC@SnS2 as the working electrode (surface area = 0.17 cm2), using the electrolyte of Na2SO4, 0.2 M. The working electrode was prepared as follows: A mixture of NC@SnS2 (50 mg), deionized water (450 μL), EtOH (500 μL), and Nafion (5 μL) was treated with an ultrasonic bath for 10 min. Then, this mixture was spin-coated onto an FTO glass electrode (1.5 cm2 × 2.0 cm2) and heated at 400oC for 60 min under a pure N2 atmosphere. Mott–Schottky plots were sampled at 1,000 Hz, 2000 and 3,000 Hz. Electrochemical impedance spectra (EIS) were recorded at −1.4 V (vs. Ag/AgCl) within 0.1 Hz–10 kHz, using an AC sinusoidal perturbation (10 mV).
Results and Discussion
Morphology and Composition of NC@SnS2 Samples
As previously mentioned, NC@SnS2 was prepared by a one-step in situ assembly method, where the N atoms in CQDs are supposed to offer a midgap for the photogenerated charge carriers in SnS2. This midgap is supposed to improve electron mobility and thus promote the separation and transportation of photogenerated charge carriers. Simply speaking, here, the active site of NC@SnS2 should be the N-doped CQDs which capture excited electrons. The successful synthesis and assembly of NC2 CQDs, SnS2 nanoparticles, and NC@SnS2 samples are first discussed by comparing their XRD patterns. It is observed from Figure 1 that the primary diffraction peaks of NC@SnS2 samples are rather similar to those of as-synthesized SnS2 nanoparticles. Sharp diffraction peaks are observed, which confirms the high crystallinity of SnS2. All these diffraction peaks shall be indexed to a hexagonal SnS2 structure (JCPDS Card No. 23-0677). As for NC2 CQDs, a broad diffraction peak with 2θ = ∼27o is observed, coming from the highly disordered C atoms (Xia et al., 2016). This broad diffraction peak, however, is not obvious in NC@SnS2 samples, owing to the low CQDs loading level in them. There is a notable difference in the relative intensity of (001) peak (vs. other diffraction peaks) between NC@SnS2 and as-synthesized SnS2 nanoparticles, which means an interaction between NC2 CQDs and SnS2 that causes variations in crystal size and preferred orientation. It appears that NC@SnS2 samples tend to grow along the c-axis direction, owing to below two reasons. First, there are enough functional groups on the CQD surface, which allows further nucleation. In addition, SnS2 nanoparticles tend to aggregate in the presence of NC2 CQDs, which will be confirmed by the following morphology analysis.
FIGURE 1
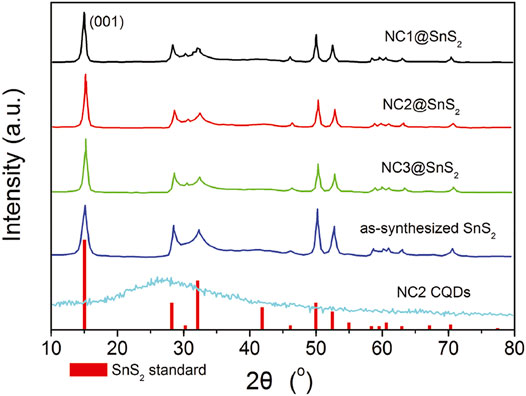
FIGURE 1. XRD patterns of SnS2 (standard JCPDS Card No. 23-0677), as-synthesized SnS2 in this work, and NC@SnS2.
The synthesis of NC@SnS2 was finished by a controllable in situ assembly method. Here, NC2 CQDs were synthesized and directly loaded onto SnS2 nanoparticles under hydrothermal conditions through an electrostatic effect. To confirm the successful in situ assembly between SnS2 host and N-doped CQDs, their zeta potential values are determined as +4.30 mV for the SnS2 nanoparticles and −9.40 mV for NC2 CQDs (both dispersed in deionized water). There shall be strong electrostatic attraction between SnS2 host and N-doped CQDs, which leads to an assembly between them. The zeta potential value of a representative NC@SnS2 sample, NC2-4@SnS2, is determined as −4.50 mV, which is close to that of NC2 CQDs (−9.40 mV), compared to that of SnS2 nanoparticles (+4.30 mV). This is because SnS2 nanoparticles are covered by NC2 CQDs whose surface has negative groups such as -COO-. As a consequence, it is concluded that SnS2 nanoparticles have been successfully covered by NC2 CQDs.
The successful in situ assembly is further analyzed via morphological analysis, which gives a visual understanding of NC@SnS2 samples. Here, the morphology of a representative NC@SnS2 sample, NC2-4@SnS2, is shown in Figures 2A–C, including its SEM, TEM, and HRTEM images. The TEM image of NC2 CQDs is shown for comparison (Figure 2D). As for NC2-4@SnS2, its SEM image suggests that the hexagonal morphology has been well preserved after loading NC2 CQDs. The average diameter of these NC2-4@SnS2 particles is 40 nm. As depicted by their TEM and HRTEM images, there are obvious lattice fringes in NC2-4@SnS2, with lattice spacing distances of 0.589 and 0.3 nm, respectively. The former one is attributed to the plane (001) from the SnS2 host. After comparing with the TEM details of NC2 CQDs shown in Figure 2D, the latter one is attributed to the plane (002) of graphic carbon from NC2 CQDs (Di et al., 2016; Li et al., 2016). The observation of these lattice fringes on NC2-4@SnS2 tentatively confirms the successful loading of CQDs on SnS2 nanoparticles. It is still observed that NC2 CQDs tend to stack on the SnS2 surface, showing a growth along the c-axis (surface vertical direction); this is because the abundant functional groups of NC2 CQDs endow themselves with high affinity for SnS2 nanoparticles, leading to the stacking along c-axis. This morphological analysis is consistent with the above XRD analysis. The in-situ assembly of NC2 CQDs on SnS2 nanoparticles is thus confirmed.
FIGURE 2
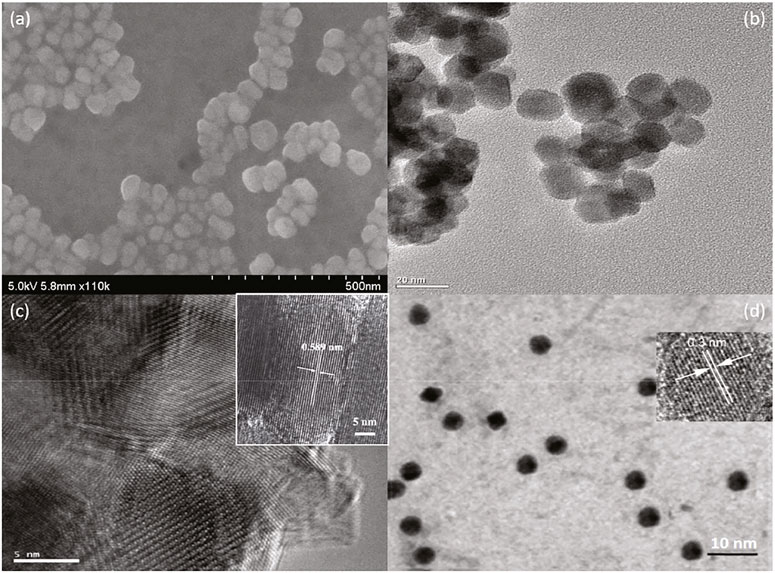
FIGURE 2. SEM (A), TEM (B), and HRTEM (C) of NC2-4@SnS2; TEM of NC2 CQDs (D).
IR technique shall provide more details when analyzing the loading status of CQDs on SnS2 nanoparticles. IR spectra of NC2 CQDs, SnS2 nanoparticles, and NC@SnS2 samples are recorded and compared in Figure 3, so that the aforementioned hypothesis about CQDs stacking on SnS2 can be confirmed. The SnS2 IR spectrum is a simple one with only several peaks. The broad one around 3,414 cm−1 is attributed to the vibration of the –OH group (adsorbed water), while the sharp one at 1,657 cm−1 is attributed to the absorption of unsaturated bonds on the SnS2 surface (Tan et al., 2016). As for NC2 CQDs, there are several characteristic bands at 3,432 cm−1, 3,030 cm−1, 1,604 cm−1, and 1,500 cm−1, which are attributed to the vibrations from –OH (adsorbed water), N-H, C=N, and COO− groups (Sun et al., 2013; Tan et al., 2016). After observing the IR spectra of NC@SnS2 samples, the IR bands from adsorbed water (3,420 cm−1) and C=N (1,575 cm−1) are still traced. More obviously, the IR band from unsaturated bonds on the SnS2 surface is blue-shifted to 1715 cm−1, compared to that of SnS2 nanoparticles (1,657 cm−1). This spectral shift suggests that the SnS2 surface has been covered by CQDs, which affects SnS2 unsaturated bonds and CQDs C=N bonds. Additionally, the IR absorption from CQDs COO− groups is not observed in NC@SnS2 samples, suggesting that these COO− groups have been grafted onto the SnS2 surface.
FIGURE 3
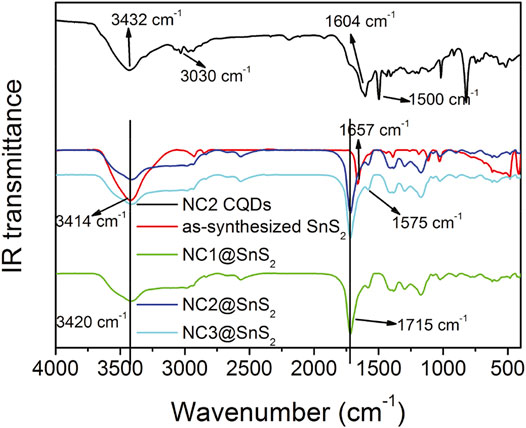
FIGURE 3. IR spectra of NC2 CQDs, SnS2 nanoparticles, and NC@SnS2 samples.
Raman spectrum is a powerful tool to reveal sample surface chemistry. The Raman spectrum of NC2-4@SnS2 is shown in Figure 4A to get further information about NC@SnS2 samples. There are intense vibrational peaks of 215 cm−1, 309 cm−1, and 587 cm−1, which are attributed to first-order Eg, A1g, and second-order Eg of SnS2, while those of 1,347 cm−1 and 1,600 cm−1 are assigned as the Raman-active graphic (G) and defect (D) bands from CQDs (Muthulingam et al., 2015). In addition, the XPS survey spectra of NC2 CQDs and NC2-4@SnS2 are shown in Figure 4B. As for NC2 CQDs, characteristic peaks from carbon (1s), nitrogen (1s), and O (1s) atoms are clearly observed, which is consistent with the desired elemental composition of NC2 CQDs. After being loaded onto SnS2 nanoparticles, these peaks are all retrieved from the NC2-4@SnS2 XPS survey spectrum. In addition, characteristic peaks from Sn (3p1, 3p3, 3d, 4d) and S (2s, 2p) atoms are observed, confirming the elemental composition of NC2-4@SnS2.
FIGURE 4
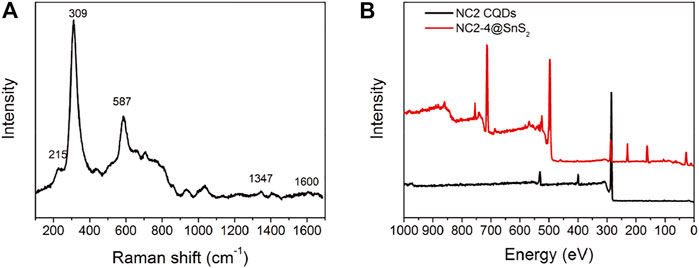
FIGURE 4. Raman (A) and XPS (B) spectra of NC2-4@SnS2.
Due to the higher electronegativity of nitrogen (3.0) than carbon (2.5), the doped N atoms shall serve as an electron acceptor. This hypothesis is approved by the following analysis on XPS binding energy. As shown by Supplementary Figures S1A–E (Supporting Information), the binding energy values of S 2p1/2 and S 2p3/2 (162.65 and 161.45 eV) in NC2-4@SnS2 are decreased by ∼0.4 eV, compared to those in SnS2 nanoparticles. Similarly, the N 1 s binding energy values of C-N (400.98 eV) and C=N (401.97 eV) in NC2-4@SnS2 are smaller than those in NC2 CQDs. The XPS peaks from C=O, C-OH, and C-O-O groups have been weakened or minimized in NC2-4@SnS2, compared to those in NC2 CQDs (Supplementary Figures S1B,C, Supporting Information), suggesting that these oxygen-containing groups are bonded with Sn. This statement is supported by the Sn binding energy analysis (Supplementary Figures S1E, Supporting Information). The binding energy values of Sn 3d5/2 and 3d3/2 in SnS2 nanoparticles are 487.1 and 495.5 eV. In NC2-4@SnS2, these values are decreased to 486.7 and 495.2 eV, indicating an interaction between NC2 CQDs and SnS2. The composite structure of NC@SnS2 is thus finally confirmed, where N-doped CQDs and hexagonal SnS2 crystals have been both identified. With the inserted midgap from CQDs, electron mobility is supposed to be improved, which promotes the separation and transportation of photogenerated charge carriers. Improved photocatalytic performance is thus expected from NC@SnS2.
Photoreduction Performance of NC@SnS2 Samples
Based on the above analysis and discussion, the successful synthesis of NC@SnS2 photocatalyst was confirmed. An improved photocatalytic performance was expected from NC@SnS2. Here, the photoreduction performance of NC@SnS2 samples was evaluated via Cr(VI) photoreaction. Photocatalytic performance comparison between NC@SnS2 samples, having different CQD amounts and different N doping levels was performed, with NC2 CQDs and as-synthesized SnS2 nanoparticles as reference groups. Here, diphenylcarbazide was used as a chromogenic agent, forming a purple-red compound in an acidic solution with absorption at 540 nm. Cr(VI) amount was proportional to the absorbance at 540 nm, so its photoreduction percentage (C/C0) was calculated by A/A0, where A0 was the initial absorbance value (Qu et al., 2013). It is observed from Figures 5A,B that the C/C0 value of pure Cr(VI) solution remains nearly constant (around 1.0) within the reaction time region 0-30 min, which means that Cr(VI) self-reduction is slim and neglectable. The existence of NC2 CQDs leads to a rather slim decrease (C/C0 = 0.97 at 30 min). Although NC2 CQDs have intense and broad absorption in the visible region (400–800 nm), the absorbed photons and their energy are wasted by thermal vibration, instead of participating in Cr(VI) photoreduction, which may be caused by the low efficiency of charge separation and transfer. An obvious Cr(VI) photoreduction is observed for as-synthesized SnS2 nanoparticles (C/C0 = 0.46 at 30 min). As for NC@SnS2 samples, their Cr(VI) photoreduction percentage is further increased, with C/C0 = 0.03 at 30 min for NC2-4@SnS2, for example. It is assumed that the conjugation planes in CQDs may accept the excited electrons from SnS2, which limits the recombination of photo-induced electron-hole pairs and thus improves the charge transfer separation efficiency of SnS2.
FIGURE 5
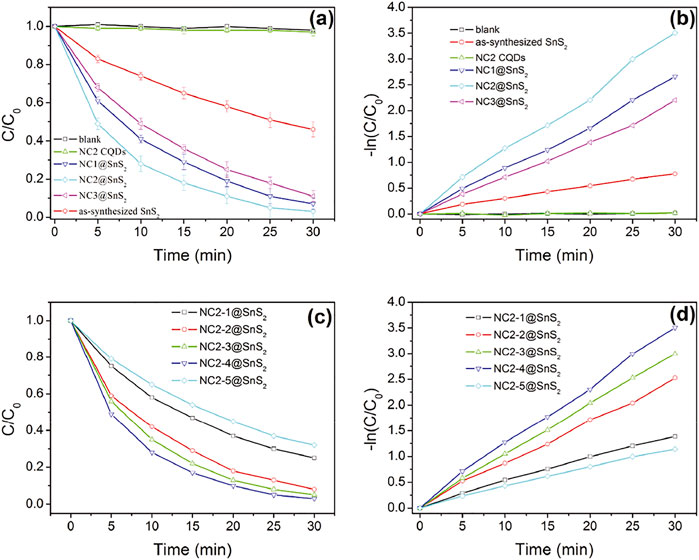
FIGURE 5. C/C0 and –ln (C/C0) values of Cr(VI) solution upon the presence of following photocatalysts: blank, NC2 CQDs, as-synthesized SnS2 nanoparticles, and NC@SnS2 samples.
Based on the previoushypothesis, it is assumed that a suitable amount of CQDs with an optimal N doping level, which ensures an efficient electron capture, is required for optimal photocatalytic performance. This statement is supported by the photocatalytic performance comparison between NC@SnS2 samples with different CQD amounts and different N doping levels, as shown in Figures 5C,D. With more (NC1@SNS2) or less (NC1@SNS2) N-doping level in NC@SnS2, compared to NC2@SNS2, the photocatalytic performance is simultaneously weakened. This is because N atoms in CQDs help the electron capture procedure and accelerate charge carrier separation. On the other hand, the excess N atoms in CQDs may affect the CQDs conjugation plane and compromise charge carrier separation. As a consequence, there will be an optimal N-doping level, with strong enough electron capture and limited influence on the integrality of the CQD conjugation plane.
Even with the same N-doping level in NC2@SnS2 samples (NC2-1@SnS2, NC2-2@SnS2, NC2-3@SnS2, NC2-4@SnS2, and NC2-5@SnS2), their photocatalytic performance is different from each other, which means that the CQD amount plays an important role as well. Generally speaking, the photocatalytic performance of NC2@SnS2 is improved with increasing CQD amount. This observation is consistent with the aforementioned statement that CQDs help the electron capture procedure and accelerate charge carrier separation. Yet, NC2-5@SnS2 shows the worst photocatalytic performance among NC2@SnS2 samples, although its CQD amount is the highest. This observation is explained by the weakened light harvest since the excess CQDs may worsen SnS2 light absorption and thus compromise the generation of photo-induced electron-hole pairs. Apparently, the generation of photo-induced electron–hole pairs is controlled by SnS2 light harvest, not CQD light harvest. Excitation light shall first penetrate CQDs before reaching SnS2 and being absorbed by SnS2. In other words, SnS2 light harvest is limited by the outer CQDs, which denies a further photocatalytic efficiency improvement. This is a defect for the NC@SnS2 composite structure.
For a better understanding of the photoreduction dynamics of NC@SnS2 samples, C/C0 against reaction time is analyzed by a pseudo-first-order reaction, as described by Eq. 1, where k is the kinetic rate constant and t is reaction time:
The detailed fitting parameters are listed in Table 1. Good linear fitting is observed. The k-value of NC2-4@SnS2 is the highest one among NC@SnS2 samples.
TABLE 1
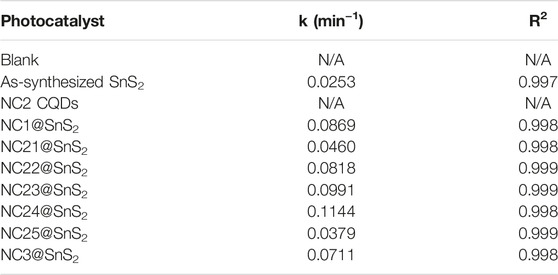
TABLE 1. Fitting parameters of the following photocatalysts: blank, NC2 CQDs, as-synthesized SnS2 nanoparticles, and NC@SnS2 samples.
Photoreduction Mechanism of NC@SnS2 Samples
After demonstrating the photoreduction performance of NC@SnS2 samples, their mechanism is discussed via their UV-Vis diffuse reflectance spectra (DRS), as shown in Figure 6A. As for NC2 CQDs, a broad and intense absorption band covering UV and visible region from 200 to 800 nm is observed, with no vibronic progressions or secondary peaks, corresponding to p-p* transitions of aromatic C=C bonds, admixed with n-p* transitions of C=O bonds (Liang et al., 2013; Di et al., 2015). Regardless of the strong absorption of NC2 CQDs, their photocatalytic performance is neglectable, as mentioned previously, since there are numerous quenching centers in CQDs (-COO-, for example). As for the as-synthesized SnS2, a broad but weak absorption band covering the whole UV-Vis region (200-1,000 nm) is observed, which shall be attributed to the intrinsic band-to-band transitions in SnS2. After loading CQDs, NC@SnS2 DRS shows basically the DRS character of NC2 CQDs, with an obvious red shift of ∼25 nm. The close contact between NC2 CQDs and SnS2, as confirmed previously, shall neutralize the quenching centers in CQDs, which makes CQDs a photosensitizer with a midgap for SnS2, showing the aforementioned absorption redshift (Ran et al., 2015; Zhou et al., 2018). Upon photoexcitation of SnS2, the excited electrons can be trapped by this midgap level, which facilitates charge carrier transportation and depresses their recombination. As a consequence, an improved photocatalytic performance is observed for CQD-modified SnS2.
FIGURE 6
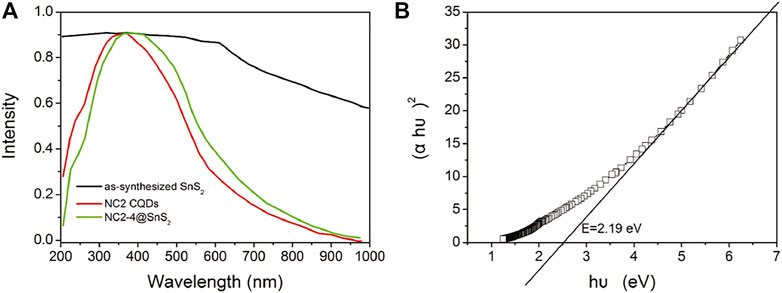
FIGURE 6. DSR spectra (A) of NC2 CQDs, as-synthesized SnS2 nanoparticles, and NC2-4@SnS2 and Tauc plots (B) of as-synthesized SnS2.
It has been reported that SnS2 has a direct bandgap structure; thus, its bandgap (E) is calculated by Tauc plots (Kubelk–Munk method), as described in Eq. 2 (Niu et al., 2014; Zhang et al., 2017):
Here, α is the absorption coefficient, h is the Planck constant, υ is frequency, and B is the fitting constant. With the DRS data on hand, the E value of SnS2 is calculated as 2.19 eV, as shown in Figure 6B. Since the conduction band (CB) level of SnS2 has been determined as −0.19 eV (against RHE), the valence band (VB) level can be calculated as 2.00 eV (Guo et al., 2018). When SnS2 is excited, its electron is transferred from VB to CB, resulting in a hole in VB and an excited electron in CB. The excited electron shall be captured by CQDs and then transferred to Cr(VI) to finish the photoreduction. As for the hole in VB, it shall be quenched by H2O, with molecular oxygen generated. This proposed mechanism is presented in Supplementary Figure S2 (Supporting Information).
To strengthen the previousstatement, surface photovoltage (SPV) and electrochemical impedance spectra (EIS) of NC2-4@SnS2, NC2 CQDs, and as-synthesized SnS2 nanoparticles are compared in Figure 7A. It is obvious that the onset energy of NC2-4@SnS2 (1.85 eV) is lower than those of NC2 CQDs (2.30 eV) and as-synthesized SnS2 nanoparticles (2.05 eV), indicating that NC2 CQDs decrease NC2-4@SnS2 excitation energy, which is consistent with the finding of their DRS comparison. Higher SPV values are observed for NC2-4@SnS2 (maximum = 161 μV) within photon energy region 2.25-3.75 eV, compared to those of NC2 CQDs (maximum = 21 μV) and as-synthesized SnS2 nanoparticles (maximum = 128 μV), which means that NC2 CQDs facilitate the charge carrier separation in NC2-4@SnS2. Meanwhile, the smallest radius is observed for the NC2-4@SnS2 EIS Nynquist plot, among the radii of NC2 CQDs and as-synthesized SnS2 nanoparticles, as shown in Figure 7B. It is thus confirmed that NC2 CQDs show the highest charge carrier separation efficiency, owing to the incorporation of CQDs, which favors Cr(VI) photoreduction. The positive effect of N-doped CQDs on improving the photocatalytic performance of NC@SnS2 is thus finally confirmed here.
FIGURE 7
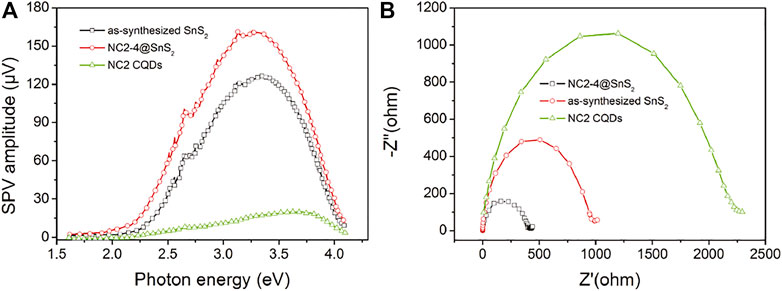
FIGURE 7. SPV (A) and EIS Nynquist plots (B) of NC2-4@SnS2, NC2 CQDs, and as-synthesized SnS2 nanoparticles.
Recyclability and Durability Performance
The recyclability and durability performance of NC2-4@SnS2 is then discussed as follows: Figure 8 shows the photocatalytic performance of recycled NC2-4@SnS2. It is observed that the photocatalytic performance has been well preserved after the first five cycles, and then the photoreduction efficiency tends to decrease. Nevertheless, as shown in Figure 9, the XRD peaks of recycled NC2-4@SnS2 (after 6 cycles) are nearly identical to those of fresh NC2-4@SnS2, with no obvious shifts or intensity variations. As a consequence, the decreased photoreduction efficiency may be explained by the desorption of CQDs from NC2-4@SnS2. Considering that there is only Van der Waals' force, instead of strong chemical bonds, between CQDs and SnS2, it is highly possible that the CQDs are extracted and removed from the SnS2 surface, leading to decreased photoreduction efficiency. A down-bending tendency is observed for the recycled NC2-4@SnS2, especially for the sixth-recycled NC2-4@SnS2, which tentatively confirms the desorption of CQDs from NC2-4@SnS2.
FIGURE 8
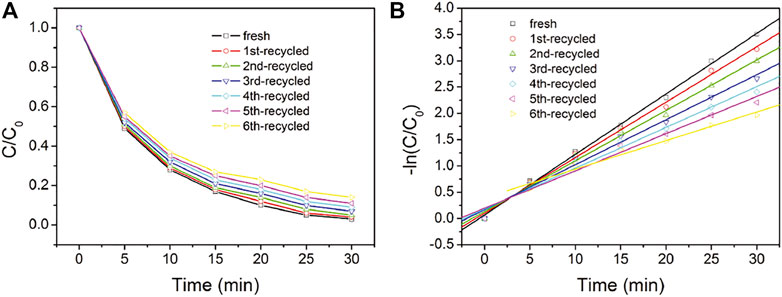
FIGURE 8. C/C0 (A) and –ln (C/C0) (B) values of Cr(VI) solution upon the presence of fresh and recycled NC2-4@SnS2.
FIGURE 9
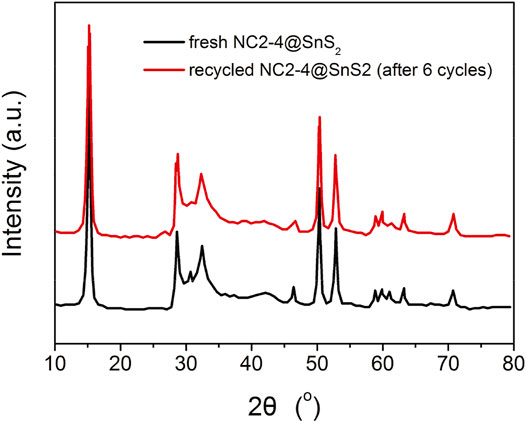
FIGURE 9. XRD patterns of fresh NC2-4@SnS2 and recycled NC2-4@SnS2 (after sixcycles).
Conclusion
In conclusion, N-doped carbon quantum dots (CQDs) were prepared and loaded onto SnS2 nanoparticles via an in situ method. The resulting composite samples (NC@SnS2) were characterized by means of XRD, zeta potential, SEM/TEM, IR, Raman, and XPS to confirm their composite structure. Various N-doping levels and doping amounts were tried to optimize photocatalytic performance. The optimal NC@SnS2 showed improved photocatalytic performance, compared to pure SnS2, following a pseudo-first-order reaction with a kinetic rate constant of 0.1144 min−1. It was confirmed by diffuse reflectance spectra, surface photovoltage, and electrochemical impedance spectra that the loaded CQDs increased the charge carrier separation efficiency of SnS2. Good durability was observed for NC@SnS2, with at least five full cycles. On the other hand, the charge carrier separation efficiency of NC2-4@SnS2 is still yet to be satisfied. For further efforts, the holes in SnS2 VB shall be neutralized quickly to improve charge carrier separation efficiency. In addition, the loaded CQDs served only as a midgap for SnS2 but showed no contribution to SnS2 absorption. The intrinsic absorption of SnS2 should be enhanced to improve its absorption of excitation light. Finally, the durability of NC@SnS2 should be improved as well. Our primitive suggestion is to replace N-doped CQDs (carbon quantum dots) with N/P-codoped CQDs (Pan et al., 2022). It has been reported that P atoms have a conjugation interaction with SnS2 (forming
Data Availability Statement
The original contributions presented in the study are included in the article/Supplementary Material; further inquiries can be directed to the corresponding authors.
Author Contributions
WL: supervision and writing and reviewing; JQ: supervision and writing and reviewing; HJ: data acquisition; YW: data acquisition; DM: data acquisition; XZ: data acquisition; HY: data acquisition; FW: supervision.
Funding
The research is supported by the Public Welfare Technology Application Research Project of Zhejiang Province, China (No. LGF22B070001), the Zhejiang Province Natural Science Foundation of China (No. LQ15E080007), the Emerging Talent Program of Zhejiang Province, China (No. 2021R426059), the Jinhua Science and Technology Plan Project (Nos. 2020-4-195 and 2019-4-168), the Competitive Projects in Science and Technology Programmes of Quzhou City (No. 2020K08), the Science Foundation of Qianjiang College (No. 2022QJJL06), and the Science Foundation of Qianjiang College and Meiya Company’s Project.
Conflict of Interest
Author HJ was employed by Zhejiang Hongyi Environmental Protection Technology Co., Ltd. Authors YW and XZ were employed by Environmental Engineering Corporation of Zhejiang Province. Author DM was employed by Zhejiang Tianchuan Environmental Science and Technology Co., Ltd.
The remaining authors declare that the research was conducted in the absence of any commercial or financial relationships that could be construed as a potential conflict of interest.
Publisher’s Note
All claims expressed in this article are solely those of the authors and do not necessarily represent those of their affiliated organizations, or those of the publisher, the editors, and the reviewers. Any product that may be evaluated in this article, or claim that may be made by its manufacturer, is not guaranteed or endorsed by the publisher.
Supplementary Material
The Supplementary Material for this article can be found online at: https://www.frontiersin.org/articles/10.3389/fchem.2022.911291/full#supplementary-material
References
Al Nafiey, A., Addad, A., Sieber, B., Chastanet, G., Barras, A., Szunerits, S., et al. (2017). Reduced Graphene Oxide Decorated with Co3 O4 Nanoparticles (rGO-Co3 O4 ) Nanocomposite: A Reusable Catalyst for Highly Efficient Reduction of 4-nitrophenol, and Cr(VI) and Dye Removal from Aqueous Solutions. Chem. Eng. J. 322, 375–384. doi:10.1016/j.cej.2017.04.039
Azimi, S., and Nezamzadeh-Ejhieh, A. (2015). Enhanced Activity of Clinoptilolite-Supported Hybridized PbS-CdS Semiconductors for the Photocatalytic Degradation of a Mixture of Tetracycline and Cephalexin Aqueous Solution. J. Mol. Catal. A Chem. 408, 152–160. doi:10.1016/j.molcata.2015.07.017
Cheng, Z., Wang, F., Shifa, T. A., Jiang, C., Liu, Q., and He, J. (2017). Efficient Photocatalytic Hydrogen Evolution via Band Alignment Tailoring: Controllable Transition from Type-I to Type-II. Small 13, 1702163. doi:10.1002/smll.201702163
Di, J., Xia, J., Ge, Y., Li, H., Ji, H., Xu, H., et al. (2015). Novel Visible-Light-Driven CQDs/Bi2 WO6 Hybrid Materials with Enhanced Photocatalytic Activity toward Organic Pollutants Degradation and Mechanism Insight. Appl. Catal. B Environ. 168-169, 51–61. doi:10.1016/j.apcatb.2014.11.057
Di, J., Xia, J., Ji, M., Wang, B., Yin, S., Xu, H., et al. (2016). Carbon Quantum Dots Induced Ultrasmall BiOI Nanosheets with Assembled Hollow Structures for Broad Spectrum Photocatalytic Activity and Mechanism Insight. Langmuir 32, 2075–2084. doi:10.1021/acs.langmuir.5b04308
Guo, Q., Li, H., Zhang, Q., and Zhang, Y. (2018). Fabrication, Characterization and Mechanism of a Novel Z-Scheme Ag3PO4/NG/polyimide Composite Photocatalyst for Microcystin-LR Degradation. Appl. Catal. B Environ. 229, 192–203. doi:10.1016/j.apcatb.2018.02.023
Guo, S., Li, X., Zhu, J., Tong, T., and Wei, B. (2016). Au NPs@MoS2Sub-Micrometer Sphere-ZnO Nanorod Hybrid Structures for Efficient Photocatalytic Hydrogen Evolution with Excellent Stability. Small 12, 5692–5701. doi:10.1002/smll.201602122
Huang, T., Li, Y., Wu, X., Lv, K., Li, Q., Li, M., et al. (2018). In-Situ Transformation of Bi2WO6 to Highly Photoreactive Bi2WO6@Bi2S3 Nanoplate via Ion Exchange. Chin. J. Catal. 39, 718–727. doi:10.1016/s1872-2067(17)62913-9
Ji, M., Su, X., Zhao, Y., Qi, W., Wang, Y., Chen, G., et al. (2015). Effective Adsorption of Cr(VI) on Mesoporous Fe-Functionalized Akadama Clay: Optimization, Selectivity, and Mechanism. Appl. Surf. Sci. 344, 128–136. doi:10.1016/j.apsusc.2015.03.006
Jiang, K., Sun, S., Zhang, L., Lu, Y., Wu, A., Cai, C., et al. (2015). Red, Green, and Blue Luminescence by Carbon Dots: Full-Color Emission Tuning and Multicolor Cellular Imaging. Angew. Chem. Int. Ed. 54, 5360–5363. doi:10.1002/anie.201501193
Jing, L., Xu, Y., Chen, Z., He, M., Xie, M., Liu, J., et al. (2018). Different Morphologies of SnS2 Supported on 2D g-C3N4 for Excellent and Stable Visible Light Photocatalytic Hydrogen Generation. ACS Sustain. Chem. Eng. 6, 5132–5141. doi:10.1021/acssuschemeng.7b04792
Li, D., Yu, S.-H., and Jiang, H.-L. (2018). From UV to Near-Infrared Light-Responsive Metal-Organic Framework Composites: Plasmon and Upconversion Enhanced Photocatalysis. Adv. Mat. 30, 1707377. doi:10.1002/adma.201707377
Li, G., Su, R., Rao, J., Wu, J., Rudolf, P., Blake, G. R., et al. (2016). Band Gap Narrowing of SnS2 Superstructures with Improved Hydrogen Production. J. Mat. Chem. A 4, 209–216. doi:10.1039/c5ta07283b
Li, L., Gao, H., Liu, G., Wang, S., Yi, Z., Wu, X., et al. (2022). Synthesis of Carnation Flower-Like Bi2O2CO3 Photocatalyst and its Promising Application for Photoreduction of Cr(VI). Adv. Powder Technol. 33, 103481. doi:10.1016/j.apt.2022.103481
Li, N. (2001). Synthesis and Characterization of Surface Modified SnS2 Nanoparticles. J. Jilin Inst. Chem. Technol. 18, 7. doi:10.3969/j.issn.1007-2853.2001.02.003
Li, Q., Li, R., Ma, X., Zhang, W., Sarkar, B., Sun, X., et al. (2022). Efficient Removal of Antimonate from Water by Yttrium-Based Metal-Organic Framework: Adsorbent Stability and Adsorption Mechanism Investigation. Colloids Surfaces A Physicochem. Eng. Aspects 633, 127877. doi:10.1016/j.colsurfa.2021.127877
Liang, Q., Ma, W., Shi, Y., Li, Z., and Yang, X. (2013). Easy Synthesis of Highly Fluorescent Carbon Quantum Dots from Gelatin and Their Luminescent Properties and Applications. Carbon 60, 421–428. doi:10.1016/j.carbon.2013.04.055
Lofrano, G., Meriç, S., Zengin, G. E., and Orhon, D. (2013). Chemical and Biological Treatment Technologies for Leather Tannery Chemicals and Wastewaters: A Review. Sci. Total Environ. 461-462, 265–281. doi:10.1016/j.scitotenv.2013.05.004
Muthulingam, S., Bae, K. B., Khan, R., Lee, I.-H., and Uthirakumar, P. (2015). Improved Daylight-Induced Photocatalytic Performance and Suppressed Photocorrosion of N-Doped ZnO Decorated with Carbon Quantum Dots. RSC Adv. 5, 46247–46251. doi:10.1039/c5ra07811c
Niu, P., Yang, Y., Yu, J. C., Liu, G., and Cheng, H.-M. (2014). Switching the Selectivity of the Photoreduction Reaction of Carbon Dioxide by Controlling the Band Structure of a g-C3N4 Photocatalyst. Chem. Commun. 50, 10837. doi:10.1039/c4cc03060e
Pan, Y., Wei, Z., Ma, M., Zhang, X., Chi, Z., He, Y., et al. (2022). Broadened Optical Absorption, Enhanced Photoelectric Conversion and Ultrafast Carrier Dynamics of N, P Co-Doped Carbon Dots. Nanoscale 14, 5794–5803. doi:10.1039/d2nr00211f
Qu, D., Zheng, M., Du, P., Zhou, Y., Zhang, L., Li, D., et al. (2013). Highly Luminescent S, N Co-Doped Graphene Quantum Dots with Broad Visible Absorption Bands for Visible Light Photocatalysts. Nanoscale 5, 12272. doi:10.1039/c3nr04402e
Ran, J., Ma, T. Y., Gao, G., Du, X.-W., and Qiao, S. Z. (2015). Porous P-Doped Graphitic Carbon Nitride Nanosheets for Synergistically Enhanced Visible-Light Photocatalytic H2 Production. Energy Environ. Sci. 8, 3708–3717. doi:10.1039/c5ee02650d
Santosa, S. J., Siswanta, D., Sudiono, S., and Utarianingrum, R. (2008). Chitin-Humic Acid Hybrid as Adsorbent for Cr(III) in Effluent of Tannery Wastewater Treatment. Appl. Surf. Sci. 254, 7846–7850. doi:10.1016/j.apsusc.2008.02.102
Shi, A., Li, H., Yin, S., Hou, Z., Rong, J., Zhang, J., et al. (2018). Photocatalytic NH3 Versus H2 Evolution Over g-C3 N4/Csx WO3: O2 and Methanol Tipping the Scale. Appl. Catal. B Environ. 235, 197–206. doi:10.1016/j.apcatb.2018.04.081
Sun, D., Ban, R., Zhang, P.-H., Wu, G.-H., Zhang, J.-R., and Zhu, J.-J. (2013). Hair Fiber as a Precursor for Synthesizing of Sulfur- and Nitrogen-Co-Doped Carbon Dots with Tunable Luminescence Properties. Carbon 64, 424–434. doi:10.1016/j.carbon.2013.07.095
Tan, J., Zou, R., Zhang, J., Li, W., Zhang, L., and Yue, D. (2016). Large-Scale Synthesis of N-Doped Carbon Quantum Dots and Their Phosphorescence Properties in a Polyurethane Matrix. Nanoscale 8, 4742–4747. doi:10.1039/c5nr08516k
Tasbihi, M., Fresno, F., Simon, U., Villar-García, I. J., Pérez-Dieste, V., Escudero, C., et al. (2018). On the Selectivity of CO2 Photoreduction towards CH4 Using Pt/TiO2 Catalysts Supported on Mesoporous Silica. Appl. Catal. B Environ. 239, 68–76. doi:10.1016/j.apcatb.2018.08.003
Wang, P., Yi, X., Lu, Y., Yu, H., and Yu, J. (2018). In-Situ Synthesis of Amorphous H2TiO3-Modified TiO2 and its Improved Photocatalytic H2-Evolution Performance. J. Colloid Interface Sci. 532, 272–279. doi:10.1016/j.jcis.2018.07.139
Xia, J., Di, J., Li, H., Xu, H., Li, H., and Guo, S. (2016). Ionic Liquid-Induced Strategy for Carbon Quantum dots/BiOX (X = Br, Cl) Hybrid Nanosheets with Superior Visible Light-Driven Photocatalysis. Appl. Catal. B Environ. 181, 260–269. doi:10.1016/j.apcatb.2015.07.035
Xiao, J.-D., and Jiang, H.-L. (2017). Thermally Stable Metal-Organic Framework-Templated Synthesis of Hierarchically Porous Metal Sulfides: Enhanced Photocatalytic Hydrogen Production. Small 13, 1700632. doi:10.1002/smll.201700632
Yan, T., Tian, J., Guan, W., Qiao, Z., Li, W., You, J., et al. (2017). Ultra-Low Loading of Ag3PO4 on Hierarchical In2S3 Microspheres to Improve the Photocatalytic Performance: The Cocatalytic Effect of Ag and Ag3PO4. Appl. Catal. B Environ. 202, 84–94. doi:10.1016/j.apcatb.2016.09.017
Yang, B., Lv, K., Li, Q., Fan, J., and Li, M. (2019). Photosensitization of Bi2O2CO3 Nanoplates with Amorphous Bi2S3 to Improve the Visible Photoreactivity towards NO Oxidation. Appl. Surf. Sci. 495, 143561. doi:10.1016/j.apsusc.2019.143561
Yang, F., Liao, C., Wang, M., Zheng, B., Xiao, D., Wu, L., et al. (2018). One-Step Synthesis of N/P-Doped Carbon Dots and Their Fluorescence Properties. Chem. Res. Appl. 30, 313. doi:10.3969/j.issn.1004-1656.2018.03.001
Yu, H., Shi, R., Zhao, Y., Waterhouse, G. I. N., Wu, L.-Z., Tung, C.-H., et al. (2016). Smart Utilization of Carbon Dots in Semiconductor Photocatalysis. Adv. Mat. 28, 9454–9477. doi:10.1002/adma.201602581
Zhang, H., Huang, H., Ming, H., Li, H., Zhang, L., Liu, Y., et al. (2012). Carbon Quantum dots/Ag3PO4 Complex Photocatalysts with Enhanced Photocatalytic Activity and Stability under Visible Light. J. Mat. Chem. 22, 10501. doi:10.1039/c2jm30703k
Zhang, N., Li, L., and Li, G. (2017). Nanosized Amorphous Tantalum Oxide: A Highly Efficient Photocatalyst for Hydrogen Evolution. Res. Chem. Intermed. 43, 5011–5024. doi:10.1007/s11164-017-3052-y
Keywords: photocatalyst, SnS2, Cr(VI), carbon quantum dots, photoreduction
Citation: Li W, Qiu J, Jin H, Wang Y, Ma D, Zhang X, Yang H and Wang F (2022) Modifying SnS2 With Carbon Quantum Dots to Improve Photocatalytic Performance for Cr(VI) Reduction. Front. Chem. 10:911291. doi: 10.3389/fchem.2022.911291
Received: 04 April 2022; Accepted: 12 May 2022;
Published: 22 June 2022.
Edited by:
Kangle Lv, South-Central University for Nationalities, ChinaReviewed by:
Hua Yang, Lanzhou University of Technology, ChinaZafar Hussain Ibupoto, University of Sindh, Pakistan
Copyright © 2022 Li, Qiu, Jin, Wang, Ma, Zhang, Yang and Wang. This is an open-access article distributed under the terms of the Creative Commons Attribution License (CC BY). The use, distribution or reproduction in other forums is permitted, provided the original author(s) and the copyright owner(s) are credited and that the original publication in this journal is cited, in accordance with accepted academic practice. No use, distribution or reproduction is permitted which does not comply with these terms.
*Correspondence: Weidong Li, lwd@hznu.edu.cn; Jianping Qiu, jianpingqiu@zjnu.edu.cn; Fangyuan Wang, jhwfy1188@zjnu.edu.cn
†These authors have contributed equally to this work