
94% of researchers rate our articles as excellent or good
Learn more about the work of our research integrity team to safeguard the quality of each article we publish.
Find out more
ORIGINAL RESEARCH article
Front. Chem. , 23 March 2022
Sec. Nanoscience
Volume 10 - 2022 | https://doi.org/10.3389/fchem.2022.880081
This article is part of the Research Topic Advances in Nano-Scale Systems with Optics (Nano-Chemical, Nanomaterial, and Nano-Biomedicine) View all 17 articles
A correction has been applied to this article in:
Corrigendum: A self-reference interference sensor based on coherence multiplexing
Interferometry has been widely used in biosensing due to its ability to acquire molecular affinity and kinetics in real-time. However, interferometric-based sensors are susceptible to environmental disturbances, including temperature and non-specific binding of target molecules, which reduces their detection robustness. To address this shortcoming, this paper proposes a self-referencing interference sensor based on coherence multiplexing to resist environmental disturbances. The proposed sensor can address temperature and non-specific binding, but it is not limited only to these types of disturbances. In the proposed sensor design, each sensor signal is encoded using a specific optical path difference determined by the optical thickness of a sensor chip. In addition, two sensor signals for disturbances tracking and biomolecule detection are detected simultaneously without additional cost to the second spectrometer and then differenced to achieve real-time self-reference. The temperature fluctuations experiments and specific binding experiments of protein A to IgG are performed to verify the performance of the proposed sensor. The results demonstrate that the proposed sensor can eliminate non-specific binding and temperature disturbances in real-time during biomolecule detection, achieving higher detection robustness. The proposed sensor is suitable for applications that require large-scale testing of biomolecular interactions, such as drug screening.
The development of simple, sensitive, and rapid molecular detection methods is of great importance to many fields, including medical evaluation, drug screening, and environmental applications. Molecular detection methods can provide accurate and fast drug sensitivity results, providing new tools for better understanding of drug-resistant tuberculosis (Rubin, 2018), and can also identify bacteria (Tardif et al., 2016) and detect specific micro-molecules in areas of water contamination (Dandapat et al., 2016). Hence, the molecular detection and identification methods have high application importance.
The molecular detection and identification methods can be roughly categorized into labeled methods and label-free methods. Due to high sensitivity, labeled methods, e.g., fluorescence (Sun et al., 2018; Burg et al., 2019), chemiluminescence (Jin et al., 2017; Li et al., 2017), enzyme-linked immunosorbent assay (ELISA) (Engvall and Perlmann, 1971), have been used in many sensing measurements. However, due to the complex structure and reactivity of proteins, an approach of adding additional reagents to improve the accessibility of observation could cause changes in the properties of a target molecule (MacBeath, 2002). In addition, for labeled methods, it is difficult to provide real-time insight into the molecular binding process and allow visualization of the molecular binding kinetics. Due to these disadvantages of the labeled methods, an increasing number of label-free methods have been used in biosensing applications, including optical waveguide lightmode spectroscopy (OWLS) (Orgovan et al., 2014), surface plasmon resonance (SPR) (He et al., 2016; Liu et al., 2017), ellipsometry (Demircioglu et al., 2017), and biolayer interferometry (BLI) (Sztain et al., 2021). However, these methods not only require customized and expensive substrates but also can difficultly achieve in-situ detection. For instance, SPR substrates need to be coated with an expensive gold film (Hobbs et al., 2016), whose thickness has to be precisely controlled at the nm level.
Recently, phase-sensitive interferometry (Joo et al., 2009; Chirvi et al., 2012; Ryu et al., 2014; Merryweather et al., 2021) has attracted great attention as a phase image technique. Spectral-domain phase-sensitive interferometry (SD-PSI) has been used as a quantitative phase imaging method in biosensing applications. The SD-PSI can acquire the molecular layer thickness changes caused by binding the target molecules to the probe surface in real-time. A fiber optic molecular sensor based on the SD-PSI can be used to monitor biomolecules in situ (Guo et al., 2018). Unlike other label-free detection methods, the SD-PSI does not require custom and expensive sensor substrates, such as gold-plated trigonal prisms, which are used in the SPR (Wu et al., 2010). The previous studies (Joo et al., 2009; Chirvi et al., 2012; Ryu et al., 2014) have demonstrated that laboratory-grade or off-the-shelf glass of a suitable thickness can be used as a sensor chip, and such a design is low-cost and simple to prepare. However, this technique is susceptible to disturbances induced by the temperature response of a sensor chip, non-specific binding of target molecules, and sample background. The previous experiments have required keeping the sensor and buffer solution at a constant temperature as much as possible (Chirvi et al., 2012), which increased experimental complexity and reduced experimental robustness.
The previous solutions are easily affected by different disturbances in biosensing, including temperature response and non-specific binding of target molecules. To overcome this shortcoming, this paper proposes a self-reference interference sensor based on coherence multiplexing, which can provide a differential measurement result with the phase change caused by binding of target molecules. The proposed sensor establishes referential and measuring paths with different optical path differences (OPDs) for disturbance tracking and biomolecule detection, thus realizing a self-reference measurement. The advantage of coherence multiplexing is that it allows simultaneous detection of two OPD-coded sensing signals without adding an expensive additional detection element. In addition, compared to the time-coded sequential measurement self-reference methods, the coherence multiplexing coding methods allow simultaneous biomolecule detection and disturbance dynamics tracking in both paths, thus improving detection robustness. The proposed sensor can be used as a label-free sensor with the advantages of weak temperature sensitivity, low non-specific binding, and picometer-level thickness sensitivity. In addition, the proposed sensor requires using only an ordinary optical glass as a detection substrate, which is low-cost and simple to manufacture.
The self-reference setup of the biomolecule detection method proposed in this study is presented in Figure 1. The setup is based on the SD-PSI. A super-luminescent diode provides the incident light with a central wavelength of 1,310 nm and a bandwidth of 75 nm. The two detection paths are prepared by a single-mode fiber-based 2 × 2 coupler and two sensor chips with different thicknesses. Each path can be considered as a low-coherence interferometer with a common path, where the reference light is reflected from the upper surface of a sensing chip, and the sample light is reflected from the contact surface between the sensor chip and solution. The interference signal of each path is encoded with a specific OPD, which is equal to the optical thickness of the corresponding sensor chip, i.e., the product of refractive index and thickness. The two signals were recorded by a homemade transmission grating structure-based spectrometer with a spectral resolution of 0.07 nm and a spectral measurement range of 1,240–1,380 nm, which was then decomposed from the superimposed interferometric spectra according to the difference in OPD values. The OPD between the two paths needs to be greater than the measuring range of the SD-PSI so that to avoid interference between the two paths’ beams. Sample channels are constructed by using epoxy glue to combine two different initial thicknesses of sensing chips (0.17-mm and 0.2-mm glass flakes) with a fluid chip (built-in flow channel and reaction chamber).
The binding of a molecule to be detected to the probe molecule on the sensing chip surface changes the sensing chip thickness, which causes a phase shift of the interference signal. Disturbances of a sensing chip, including non-specific binding and temperature response, can also induce changes in the interference signal phase. The two detection paths in the self-reference system, denoted as path 1 (P1) and path 2 (P2), are used to detect phase variations induced by the biomolecule detection and disturbances during the biomolecule detection process, respectively. Finally, the self-reference molecule detection is achieved by performing the difference operation between the phases of the two OPD-encoded signals. The basic principle of the self-reference interference sensor based on coherence multiplexing is shown in Figure 2.
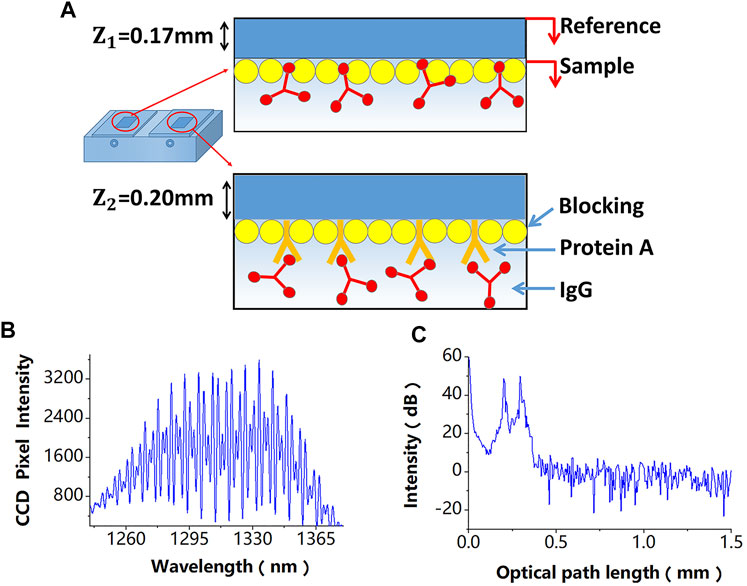
Figure 2. (A) A differential-path modification method of sensing chips, the difference of these modification processes is that the referential path does not modify the probe molecule. (B) Superimposed interferometric spectra obtained by the SD-PSI. (C) Signal peaks corresponding to different OPDs obtained after performing the fast Fourier transform algorithm on the two superimposed interferometric spectra.
In the proposed sensor design, a differential-path modification method for sensing chips is shown in Figure 2A, which is described in detail in the next section, is used. The two superimposed interferometric spectra signals detected by a spectrometer are shown in Figure 2B, which can be expressed as follows:
where k is the wavenumber, β is the beam splitting ratio of the fiber coupler, and S(k) is the spectral density of the Gaussian-type light source;
Since paths P1 and P2 have different OPDs, their signal peaks can be obtained, as shown in Figure 2C, after performing the fast Fourier transform algorithm on the two superimposed interferometric spectra. The phases of the space-domain interference signals at these two peaks, which also include phase variations induced by biomolecule detection and disturbances, can be calculated by:
where
Thus, the temperature response of the molecular detection path P1 can be calculated by linearly fitting the temperature response of the disturbances tracking path P2, which can be expressed as follows:
where
Different modification processes are used in different thickness chips of the proposed sensor; the difference of these processes is that the referential path does not modify the probe molecule. The proposed design allows tracking the total phase change
where
In the experiment,
It is well known that using glass as a sensing chip has a low cost and is simple to prepare. The process of glass surface modification has been established and widely used in the preparation of molecular-level sensors (Joo et al., 2009). However, such sensing chips are sensitive to the ambient temperature. Depending on the composition, the thermal expansion coefficient is roughly equal to
To confirm that the sensing chip made of glass is sensitive to temperature, the heat transfer process was simulated by COMSOL software. The effect of the ambient temperature change of room temperature (298 ± 10 K) on the glass chip was simulated by changing the fluid’s initial temperature. The simulation results are presented in Figure 3, where Figures 3A,B show the sensor temperature distribution at different moments during the temperature rise and fall, and Figure 3C shows the thickness variation of the sensing chip with different initial thicknesses, which is generated by the increase or decrease of the ambient temperature. In the simulation experiment, we measure the temperature variation
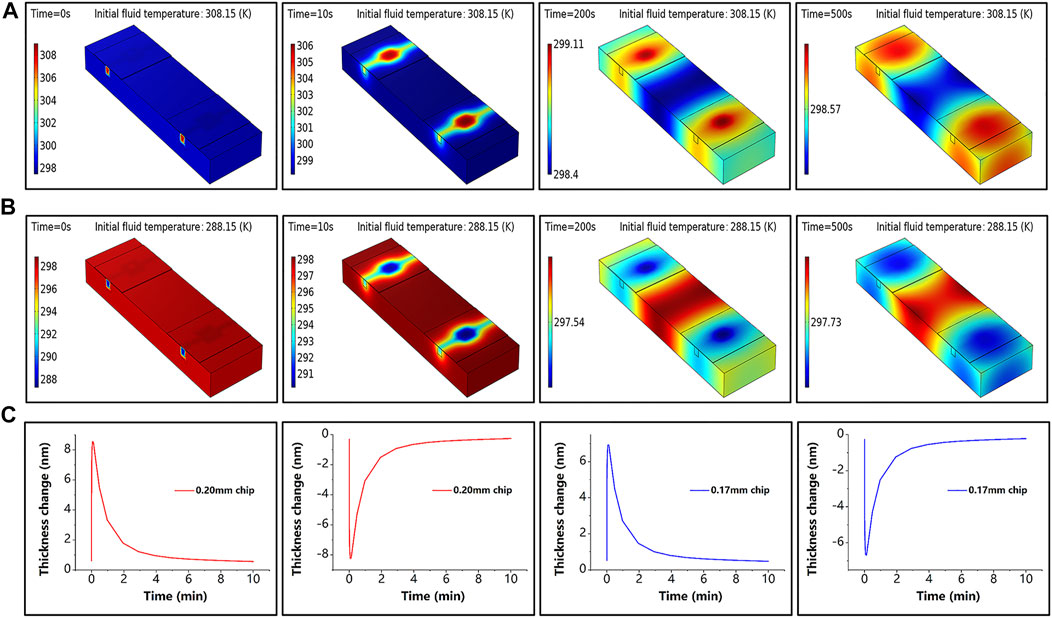
Figure 3. Simulation results. (A) Sensor temperature at different moments under the initial temperature of fluid of 308.15 K when the simulated ambient temperature increases. (B) Sensor temperature at different moments under the initial temperature of fluid of 288.15 K when the simulated ambient temperature decreases. (C) Thickness variation at the center point of the sensing chip for different initial thicknesses during simulated temperature rise and fall; the red line corresponds to a thickness of 0.20 mm and the blue line to a thickness of 0.17 mm.
In addition, the robustness of the proposed sensor against temperature fluctuations was experimentally evaluated. The experiments followed the control principle and took full advantage of a dual-channel sensor. For a clearer demonstration, the temperature change in the experiment was deliberately magnified. The change in ambient temperature was simulated by simultaneously and repeatedly passing the deionized water at the ambient temperature that was 10 K above (or below) room temperature into the reaction chamber. The thickness variation curves of the sensing chip of the single-chamber sensor and the proposed dual-chamber sensor are presented in Figure 4, where it can be seen that compared to the proposed sensor, the sensing chip of the conventional sensor was more sensitive to temperature changes, and its thickness change curve was very consistent with that in Figure 3C, indicating that the glass chip was sensitive to temperature; the thickness change curves of the two chips were different due to the difference in their initial thicknesses. It is worth mentioning that the results of the proposed sensor were obtained by linearly fitting the results of single-chambers, which was an improvement of the traditional method. The standard deviation of the phase changes obtained from the experimental results was used to evaluate the temperature sensitivity of the self-reference-type sensor. The experimental results showed that the average value of the conventional sensor was about
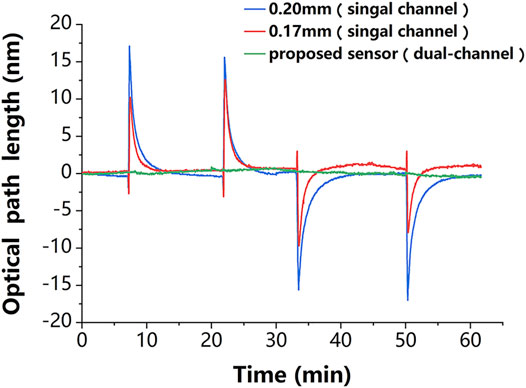
Figure 4. Experimental results. The thickness variation of the chips in the single-channel sensor (red and blue lines) is very consistent with temperature variation in Figure 3C, which proves that this sensing chip is sensitive to the temperature disturbance. The phase change of the proposed dual-channel sensor (green line) is about one-tenth of that of the single-channel sensor, which proves that it is less sensitive to temperature disturbance.
The non-specific binding affects detection results of molecular measurements, and conventional blocking methods cannot completely eliminate non-specific binding. However, the proposed sensor monitors the non-specific binding process using a differential-path detection method and has the ability to correct for specific binding.
To verify the non-specific binding suppression performance of the proposed sensor, first, the stability of phase characterization was examined by injecting only a phosphate-buffered saline (PBS) buffer for 20 min at room temperature. The total phase variation of
Next, one of the glass chips with a 0.20-mm thickness was modified. First, a dopamine-Tris solution of 2 mg/ml was used to form a thin adhesion layer by self-polymerization on the binding surface to improve the biocompatibility of the binding surface. Then, the dopamine layer was non-specifically modified with the protein A (0.5 mg/ml), which acted as probe molecules to capture the target analyte. Finally, the non-specific binding site on the dopamine layer was blocked by passing through the protein-free blocking solution. To reduce the non-specific binding of the target analyte to the dopamine layer, smaller blocking molecules filled the dopamine layer between the protein A molecules. The PBS was introduced to the fluid chip to flush the unbound molecules before passing through a new solution. In addition, an almost identical method was used to modify another glass chip; the only differences were that no protein A solution was passed through, and the dopamine layer directly adhered with the protein-free blocking solution.
The modification processes of the two sensing chips were then exchanged to obtain the second proposed sensor. Due to the modification processes were exchanged, the probe molecules were present on different thickness chips in the two sensors. This difference between the two sensors was used to verify channel uniformity of the proposed sensor, which is a prerequisite for achieving undifferentiated sensor detection. As shown in Figures 5A,B, the phase changes of the two sensors under the same reaction were almost identical during specific modifications monitored by different sensing chips (0.17 mm for the blue and 0.20 mm for the red), except for the growth of dopamine. The same results were achieved for non-specific modifications. This shows that the chip thickness does not affect the molecular reaction, thus proving the channel uniformity of the proposed sensor. The results also demonstrated that the total increase in phase caused by blocking molecules under the specific modification was less than that under the non-specific modification. This could be because protein A preoccupied most of the binding sites.

Figure 5. The modification results of the two sensors, where the blue line corresponds to the 0.17-mm chip and the red line corresponds to the 0.20-mm chip. (A) The modification result of sensor #1, where a 0.20-mm chip is used for specific binding and a 0.17-mm chip for non-specific binding. (B) The modification result of sensor #2, where a 0.17-mm chip is used for specific binding and a 0.20-mm chip for non-specific binding.
After modification, 20 μg/ml of mouse IgG solution was used to demonstrate the detection capability of the proposed sensor. To reduce the effect of phase noise further, the average phase of 1,000 neighboring measurement points was calculated and used as a phase at that moment in the experiment, and the response time of the system was 27.8 ms, which satisfied the real-time requirement. The results in Figures 6A,B show that the binding detected under different initial thicknesses of the sensing chip was almost the same, which further demonstrates good channel uniformity of the proposed sensor. This uniformity makes the proposed sensor more flexible and easier to prepare. The phase change of about
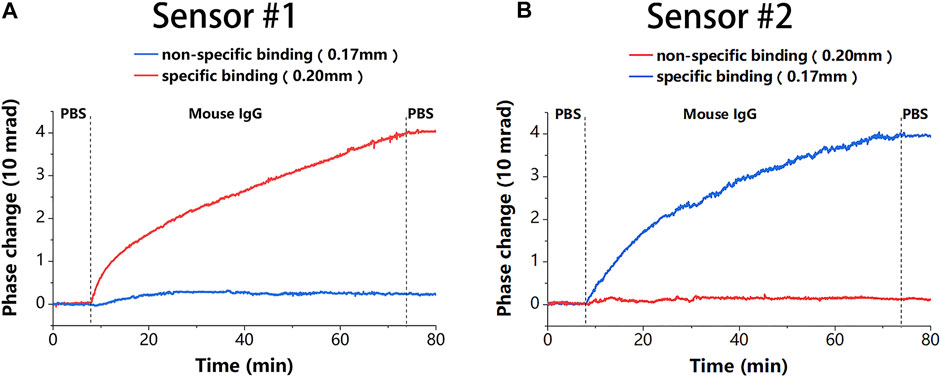
Figure 6. The binding results of the two sensors. (A) Binding results corresponding to Figure 5A in sensor #1. (B) Binding results corresponding to Figure 5B in sensor #2.
We calculated the average value of the peak phase
In addition to verifying that the sensor has the described capabilities, we estimated the sensitivity of the described sensor. As shown in Figure 8A, we set a concentration gradient to verify that the specific binding of IgG to protein A causes a proportional variation in thickness. The thickness variations caused by 10, 20, 30, and 50 μg/ml concentrations of IgG molecules are 1.86, 3.76, 5.45, and 10.06 nm, respectively. Each plotted data point in Figure 8B is averaged from three measurements. The results of the linear fit are shown in Figure 8B with a slope of 0.205 nm/(μg/ml). This slope can be used to estimate the minimum detectable concentration, which indicates the sensitivity of the described sensor. The minimum detectable concentration is calculated by
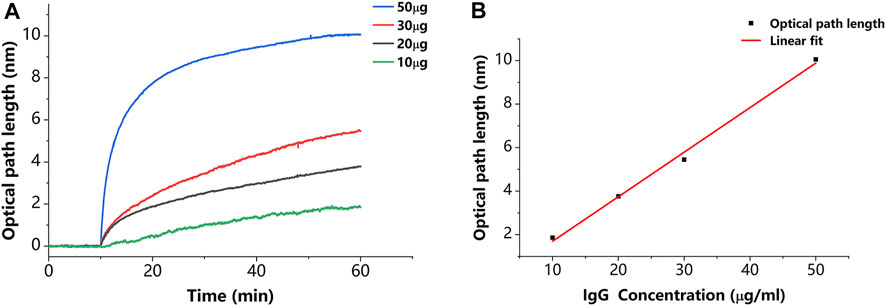
Figure 8. (A) Results of binding of IgG to protein A in different concentrations. (B) Relationship between thickness variation and IgG concentration. Each plotted data point in Figure 8B is averaged from three measurements.
This paper presents a sensor based on coherence multiplexing, which can be used to resist different disturbances in biosensing applications, including temperature and non-specific binding disturbances. The proposed sensor has two reaction chambers and sensing chips of different thicknesses, which define two interferometric paths with different OPDs. This allows the proposed sensor to achieve self-reference based on coherent multiplexing. The proposed sensor is suitable for applications that require large-scale testing of biomolecular interactions, such as drug screening. Using fiber optic-based glass as a sensor chip reduces the cost of the proposed sensor. This technology can also be used in other sensing applications, such as multi-channel pressure sensing systems.
The raw data supporting the conclusion of this article will be made available by the authors, without undue reservation.
CG and YS conceived of the presented idea. ZH carried out the experimental work and wrote the article. FH provided the suggestions. YS and CG revised this paper. YH, ZY, and HZ provide experimental help to ZH.
This work was financially supported by the National Natural Science Foundation of China (62105068), Ministry of Education Science and Technology Industry-University Cooperative Education Program (202102153072), Educational Research Project for Young and Middle-aged Teachers of Fujian Provincial Education Department (JAT200009), and Fuzhou University Research Start-up funding (GXRC-21019).
The authors declare that the research was conducted in the absence of any commercial or financial relationships that could be construed as a potential conflict of interest.
All claims expressed in this article are solely those of the authors and do not necessarily represent those of their affiliated organizations, or those of the publisher, the editors and the reviewers. Any product that may be evaluated in this article, or claim that may be made by its manufacturer, is not guaranteed or endorsed by the publisher.
Burg, S., Cohen, M., Margulis, M., Roth, S., and Danielli, A. (2019). Magnetically Aggregated Biosensors for Sensitive Detection of Biomarkers at Low Concentrations. Appl. Phys. Lett. 115 (10), 103702. doi:10.1063/1.5108891
Chirvi, S., Qiang, Z., and Davé, D. P. (2012). Coherence-multiplexed, Label-free Biomolecular Interaction Analysis. Opt. Lett. 37 (14), 2952–2954. doi:10.1364/ol.37.002952
Dandapat, K., Tripathi, S. M., Chinifooroshan, Y., Bock, W. J., and Mikulic, P. (2016). Compact and Cost-Effective Temperature-Insensitive Bio-Sensor Based on Long-Period Fiber Gratings for Accurate Detection of E Coli Bacteria in Water. Opt. Lett. 41 (18), 4198–4201. doi:10.1364/OL.41.004198
Demircioğlu, Ö., Salas, J. F. L., Rey, G., Weiss, T., Mousel, M., Redinger, A., et al. (2017). Optical Properties of Cu_2ZnSnSe_4 Thin Films and Identification of Secondary Phases by Spectroscopic Ellipsometry. Opt. Express 25 (5), 5327–5340. doi:10.1364/OE.25.005327
Engvall, E., and Perlmann, P. (1971). Enzyme-linked Immunosorbent Assay (ELISA) Quantitative Assay of Immunoglobulin G. Immunochemistry (1965) 8 (9), 871–874. doi:10.1016/0019-2791(71)90454-x
Guo, C., Yang, X., Shen, Z., Wu, J.-P., Zhong, S., He, Y., et al. (2018). A Fluidic Biosensor Based on a Phase-Sensitive Low-Coherence Spectral-Domain Interferometer. Sensors 18 (11), 3757. doi:10.3390/s18113757
He, X., Yi, H., Long, J., Zhou, X., Yang, J., and Yang, T. (2016). Plasmonic crystal Cavity on Single-Mode Optical Fiber End Facet for Label-free Biosensing. Appl. Phys. Lett. 108 (23), 231105. doi:10.1063/1.4953413
Hobbs, K., Cathcart, N., and Kitaev, V. (2016). Gold-plated Silver Nanoparticles Engineered for Sensitive Plasmonic Detection Amplified by Morphological Changes. Chem. Commun. 52 (63), 9785–9788. doi:10.1039/c6cc05260f
Jin, Y., Song, Y., Qu, X., Li, Z., Ji, Y., and He, A. (2017). Three-dimensional Dynamic Measurements of CH* and C2* Concentrations in Flame Using Simultaneous Chemiluminescence Tomography. Opt. Express 25 (5), 4640–4654. doi:10.1364/OE.25.004640
Joo, C., Özkumur, E., Ünlü, M. S., and Boer, J. F. d. (2009). Spectral-domain Optical Coherence Phase Microscopy for Label-free Multiplexed Protein Microarray Assay. Biosens. Bioelectron. 25 (2), 275–281. doi:10.1016/j.bios.2009.06.028
Li, S., Liu, C., Yin, G., Zhang, Q., Luo, J., and Wu, N. (2017). Aptamer-molecularly Imprinted Sensor Base on Electrogenerated Chemiluminescence Energy Transfer for Detection of Lincomycin. Biosens. Bioelectron. 91, 687–691. doi:10.1016/j.bios.2017.01.038
Liu, Y., Chen, S., Liu, Q., Liu, Z., and Wei, P. (2017). Simple Method for Self-Referenced and Lable-free Biosensing by Using a Capillary Sensing Element. Opt. Express 25 (10), 11750–11759. doi:10.1364/OE.25.011750
MacBeath, G. (2002). Protein Microarrays and Proteomics. Nat. Genet. 32 (Suppl. l), 526–532. doi:10.1038/ng1037
Merryweather, A. J., Schnedermann, C., Jacquet, Q., Grey, C. P., and Rao, A. (2021). Operando Optical Tracking of Single-Particle Ion Dynamics in Batteries. Nature 594 (7864), 522–528. doi:10.1038/s41586-021-03584-2
Orgovan, N., Kovacs, B., Farkas, E., Szabó, B., Zaytseva, N., Fang, Y., et al. (2014). Bulk and Surface Sensitivity of a Resonant Waveguide Grating Imager. Appl. Phys. Lett. 104 (8), 083506. doi:10.1063/1.4866460
Rubin, E. J. (2018). TB Diagnosis from the Dark Ages to Fluorescence. Nat. Microbiol. 3 (3), 268–269. doi:10.1038/s41564-018-0118-6
Ryu, S., Hyun, K.-A., Heo, J., Jung, H.-I., and Joo, C. (2014). Label-free Cell-Based Assay with Spectral-Domain Optical Coherence Phase Microscopy. J. Biomed. Opt. 19 (4), 046003. doi:10.1117/1.jbo.19.4.046003
Sun, F., Zeng, J., Jing, M., Zhou, J., Feng, J., Owen, S. F., et al. (2018). A Genetically Encoded Fluorescent Sensor Enables Rapid and Specific Detection of Dopamine in Flies, Fish, and Mice. Cell 174 (2), 481–496. doi:10.1016/j.cell.2018.06.042
Sztain, T., Ahn, S.-H., Bogetti, A. T., Casalino, L., Goldsmith, J. A., Seitz, E., et al. (2021). A Glycan Gate Controls Opening of the SARS-CoV-2 Spike Protein. Nat. Chem. 13 (10), 963–968. doi:10.1038/s41557-021-00758-3
Tardif, M., Jager, J.-B., Marcoux, P. R., Uchiyamada, K., Picard, E., Hadji, E., et al. (2016). Single-cell Bacterium Identification with a SOI Optical Microcavity. Appl. Phys. Lett. 109 (13), 133510. doi:10.1063/1.4963070
Keywords: phase-sensitive interferometry, biosensing, differential measurement, biomolecular interaction, label-free detection
Citation: Shen Y, Huang Z, Huang F, He Y, Ye Z, Zhang H and Guo C (2022) A Self-Reference Interference Sensor Based on Coherence Multiplexing. Front. Chem. 10:880081. doi: 10.3389/fchem.2022.880081
Received: 21 February 2022; Accepted: 08 March 2022;
Published: 23 March 2022.
Edited by:
Honghui He, Tsinghua University, ChinaReviewed by:
Dongmei Li, Zhejiang University of Technology, ChinaCopyright © 2022 Shen, Huang, Huang, He, Ye, Zhang and Guo. This is an open-access article distributed under the terms of the Creative Commons Attribution License (CC BY). The use, distribution or reproduction in other forums is permitted, provided the original author(s) and the copyright owner(s) are credited and that the original publication in this journal is cited, in accordance with accepted academic practice. No use, distribution or reproduction is permitted which does not comply with these terms.
*Correspondence: Cuixia Guo, Z3VvY3hAZnp1LmVkdS5jbg==
Disclaimer: All claims expressed in this article are solely those of the authors and do not necessarily represent those of their affiliated organizations, or those of the publisher, the editors and the reviewers. Any product that may be evaluated in this article or claim that may be made by its manufacturer is not guaranteed or endorsed by the publisher.
Research integrity at Frontiers

Learn more about the work of our research integrity team to safeguard the quality of each article we publish.