- School of Public Health, Hubei University of Medicine, Shiyan, China
Using CALYPSO crystal search software, the structural growth mechanism, relative stability, charge transfer, chemical bonding and optical properties of AuMgn (n = 2–12) nanoclusters were extensively investigated based on DFT. The shape development uncovers two interesting properties of AuMgn nanoclusters contrasted with other doped Mg-based clusters, in particular, the planar design of AuMg3 and the highly symmetrical cage-like of AuMg9. The relative stability study shows that AuMg10 has the robust local stability, followed by AuMg9. In all nanoclusters, the charge is transferred from the Mg atoms to the Au atoms. Chemical bonding properties were confirmed by ELF analysis that Mg-Mg formed covalent bonds in nanoclusters larger than AuMg3. Static polarizability and hyperpolarizability calculations strongly suggest that AuMg9 nanocluster possesses interesting nonlinear optical properties. Boltzmann distribution weighted average IR and Raman spectroscopy studies at room temperature verify that these nanoclusters are identifiable by spectroscopic experiments. Finally, the average bond distance and average nearest neighbor distance were fully investigated.
Introduction
Metal nanoclusters have attracted increasing interest from academics in recent years due to their appealing micro patterns and interesting features (Jin et al., 2016; Peng et al., 2018; Tew et al., 2018). For example, Aun clusters tend to exhibit 2-dimensional structures at small sizes, while medium sizes (n < 15) will transition to 3-dimension (Idrobo et al., 2007; Assadollahzadeh and Schwerdtfeger, 2009; Huang and Wang, 2009). For larger size, the study of Au144 cluster is highly worth explaining. It was first reported in 1997 as a critical size for the transformation of Au nanoclusters into nanocrystals and worthy of being researched, but its structure could not be determined at that time (Alvarez et al., 1997), then in 2009 it was precisely predicted by theoretical studies to have a multishell structure (Qian and Jin, 2009), and finally, in 2018 it was experimentally confirmed to have a three-layer metallic core of Au12-Au42-Au60 from the inside out (Yan et al., 2018). Researchers have been so persistent in studying them because the physical size of these clusters is comparable to the electron Fermi wavelength and therefore tends to show interesting electronic (Yau et al., 2013), optical properties (Ramakrishna et al., 2008; Jin, 2015) and have important application prospects in the field of medicine and biology (Shang et al., 2011). Because the physical and chemical characteristics of nanoclusters alter with size throughout the transition to nanocrystals or nanoparticles, nanocluster research will anticipate, at least theoretically, a slew of new materials for the field of nanomaterials science.
A lot of studies on alkaline Earth metal magnesium clusters have been reported, in addition to usual studies of metal nanoclusters like gold, silver, and copper (Köhn et al., 2001; Xia et al., 2016; Zhang et al., 2020; Zhao et al., 2021). This is partly because magnesium-based nanomaterials have an exceptional hydrogen storage capacity compared to ordinary materials (Shao et al., 2012), and therefore, various kinds of Mg-based nanocluster materials, such as CoMgn (Trivedi and Bandyopadhyay, 2015), RhMgn (Trivedi and Bandyopadhyay, 2016), ScMg nanocluster (Chen et al., 2020; Lyon, 2021), are worthy of systematic study. Most of these studies were carried out theoretically and gave interesting results by predicting the hydrogen storage properties of nanocluster materials based on Mg. For example, it is shown that MgScH13 and MgScH15 nanoclusters have, theoretically, ultra-high hydrogen storage capacities of 15.9 wt% (Lyon, 2021) and 17.8 wt% (Chen et al., 2020), respectively. On the other hand, the optical properties of Mg and Mg-based nanoclusters are also very attractive (Belyaev et al., 2016; Shinde, 2016; Shinde and Shukla, 2017). The IR spectra of Mgn (n = 2–31) nanoclusters were studied using DFT, and the results showed that their most intense peaks were distributed in the low-frequency band of 40–270 cm−1 (Belyaev et al., 2016). The linear absorption spectroscopy studies of very small size Mgn (n = 2–5) nanoclusters confirm that their low-lying structures, although small, can be experimentally distinguished, while the optical excitation spectra are confirmed to be of plasmonic collective type (Shinde, 2016).
In short, nanocluster materials, like Au and Mg, are a field of materials science full of unknown “surprises” where many interesting optical and electronic excitation properties can be “discovered”. However, surprisingly, the study of gold-doped Mg nanoclusters has not been reported so far. This work aims to perform a systematic theoretical computational study of the structural and optical properties of gold-doped small-size magnesium nanoclusters. Specifically, the geometric growth mechanism, relative stability, charge transfer properties, chemical bonding properties, nonlinear optical properties, and theoretical calculations of infrared and Raman-weighted average spectra of AuMgn (n = 2–12) nanoclusters will be investigated. These studies will not only enrich the research data on AuMgn nanoclusters, but also provide the opportunity to gain insight into potential nanomaterials with interesting optical properties.
Computational Method Details
CALYPSO software (Wang et al., 2010, 2012) was utilized to search the initial geometries of AuMgn (n = 2–12) nanoclusters. CALYPSO can perform predictions of the energetically low-lying isomers structures at given chemical compositions and pressure for nanoclusters (Lv et al., 2012; Zhao et al., 2019; Lu et al., 2020) in gas-phase and crystals (Lu and Chen, 2020a, 2020b, 2021; Sun et al., 2020; Chen et al., 2021) via particle swarm optimization (PSO) algorithm. To search for as many low-lying energy isomers of AuMgn (n = 2–12) nanoclusters as possible, the following strategy will be employed. First, each size of AuMgn nanocluster will be searched for 50 generations, where each generation contains 20 structures. Further, 80% of these 1,000 heterogeneous structures are generated by the PSO algorithm for the initial structure, and the rest are generated randomly. These structures are then interfaced via CALYPSO to Gaussian 09 software (Frisch et al., 2016) for low-level HF energy calculations, and finally ranked by energy level. It is necessary to explain that many of the 1,000 isomers obtained have the same or extremely close energies, and their geometrical structures do not differ much and therefore need to be removed. Finally, isomers with significantly different energies and structures were again subjected to high-level DFT for structural optimization and frequency calculations by Gaussian 09 software. The structure optimization calculation employs the classical B3LYP functional, where the mixed basis set is considered due to the presence of Au atom. Concretely, 6–311 g (d) is applied to Mg atoms, while the pseudopotential basis set lanl2dz is used for Au atoms. The adoption of such functional and basis set is based on the following two aspects, firstly, the existing studies have shown that Mgn nanoclusters do not have any metallic properties at the size of n < 20 (Köhn et al., 2001; Jellinek and Acioli, 2003; Xia et al., 2016), and secondly, all-electron basis set and lanl2dz basis set have been proved to be reliable for Mg and Au nanoclusters by numerous studies (Xia et al., 2016; Zeng et al., 2020; Zhu et al., 2021). To ensure a more comprehensive structural optimization, each isomer was calculated under 2, 4, 6, and 8 spin multiplicities, respectively. In addition, to verify that the isomer is not a transition or excited state, imaginary frequencies must be excluded from any result. Once the imaginary frequency appears in the calculation result, they need to be optimized again until all frequencies are positive.
Charge transfer property of the lowest energy AuMgn (n = 2–12) nanoclusters was analyzed by natural bond orbital (NBO) calculation (Reed et al., 1988). Chemical bonding properties were computed through the electron localization function (ELF) (Becke and Edgecombe, 1990). The nonlinear optical properties of the ground state AuMgn nanoclusters were investigated at the aug-cc-pVTZ level. Infrared and Raman spectra are the results of vibration frequency calculations. In particular, Multiwfn software (Lu and Chen, 2012) is a powerful tool to draw 2D map of ELF, spherical plots of static and super-static polarizabilities, Boltzmann distribution probabilities of different isomers and weighted average IR and Raman spectral data.
Results
The Geometrical Growth Mechanism of AuMgn Nanoclusters
The growth mechanism of nanoclusters can be studied by their geometric structures. Three low-lying energy isomers of each size AuMgn (n = 2–12) nanoclusters are presented in Figure 1 and Figure 2. Under each structure, the “i” in AuMgn-i is their energy order, with “1” indicating the lowest and “2” the second-lowest ones. The energy difference (eV) between the AuMgn-i and AuMgn-1 at each size can also be found. In addition to the symmetry, and the electronic structure information is also shown in Figures 1, 2. All information about the lowest energy state of AuMgn (n = 2–12) nanoclusters is summarized in Table 1, where the results of the frequency calculations show the lowest and highest vibrational frequencies satisfying the requirements that the results of the frequency calculations cannot contain any imaginary frequency. As can be seen from Figure 1, isomers AuMg2-1 (D∞h symmetry with 2Σg electronic state) and AuMg2-2 (C2v symmetry with 2Σg electronic state) have a similar linear structure, the difference being that the Au atom is in the center of the former and on the side of the latter. Isomers AuMg2-3 (C2v symmetry with 2B2 electronic state) show a 2D planar isosceles triangle structure. Relative to the lowest energy state AuMg2-1 isomer energy, AuMg2-2 and AuMg2-3 isomers have 0.24 and 0.39 eV higher energy than it, respectively. The isomer AuMg3-1 (D3h symmetry with 2Aʹ1 electronic state) has an equilateral triangular geometry, while the isomer AuMg3-3 (C2v symmetry with 6A2 electronic state) has an isosceles triangular structure, and interestingly the Au atoms are located at the center of their triangular structures, respectively. The structure of the isomer AuMg3-2 (C2v symmetry with 2A1 electronic state) is a planar combination of Au-Mg-Mg isosceles triangle and Mg-Mg-Mg isosceles triangle. Calculations show nanoclusters of 2 Mg atoms doped with one Au atom, where the second and third lowest isomers are 0.03 and 4.20 eV higher than the lowest energy isomer, respectively. The structures of the isomers AuMg4-1 (C3v symmetry with 2A1 electronic state) and AuMg4-2 (C2v symmetry with 2A1 electronic state) can be considered as formed based on the tetrahedral (pyramid-like) structure of Au-Mg-Mg-Mg adsorbing an Mg atom in different directions. The isomer AuMg4-3 (C2v symmetry with 2B3g electronic state) shows a rectangular structure in which the 4 Mg atoms are at the vertices while Au atom is at the geometric center. For the isomer AuMg4-1, AuMg4-2 and AuMg4-3 are higher in energy by 0.01 and 0.49 eV, respectively. The structure of the isomer AuMg5-1 (C2v symmetry with 2A1 electronic state) is based on the formation of AuMg4-2 by adsorbing an Mg atom on its top. The isomers AuMg4-3 and AuMg4-1 form the isomers AuMg5-2 (Cs symmetry with 2Aʹ electronic state) and AuMg5-3 (C3 symmetry with 2A electronic state) after pulling up the Au atom into the interior of the polyhedral while adsorbing an Mg atom on their tops. The second- and third-lowest energy isomers of the AuMg5 nanocluster are 0.08 and 0.16 eV higher than that of the lowest-energy isomer. The isomers AuMg6-1 (C2 symmetry with 2B electronic state) and AuMg6-2 (C2h symmetry with 2Ag electronic state) have extremely close energies and structures, which exhibit rotational symmetry with Au atom. The isomer AuMg6-3 (2B2g electronic state), which is higher 0.04 eV in energy than AuMg6-1, possesses a high symmetry (D2h) octahedron in which the Au atom is located at its center. The structures of the isomers AuMg7-1 (C1 symmetry with 2A electronic state), AuMg7-2 (Cs symmetry with 2Aʹ electronic state) and AuMg7-3 (Cs symmetry with 2Aʹ electronic state) are all grown based on the diversity of Au-Mg-Mg-Mg tetrahedra-like geometries. In addition, the energy shift of the isomers AuMg7-2 and AuMg7-3 relative to the lowest energy state are 0.03 and 0.10 eV, respectively.
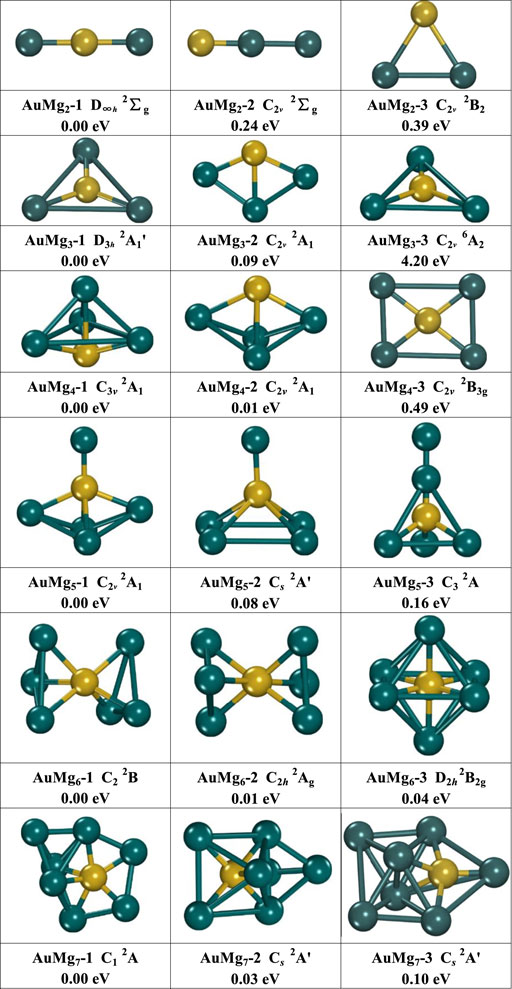
FIGURE 1. The geometry of the three lowest energy isomers of AuMgn (n = 2–7) nanoclusters, energy difference in eV from the lowest energy isomer at the same size.
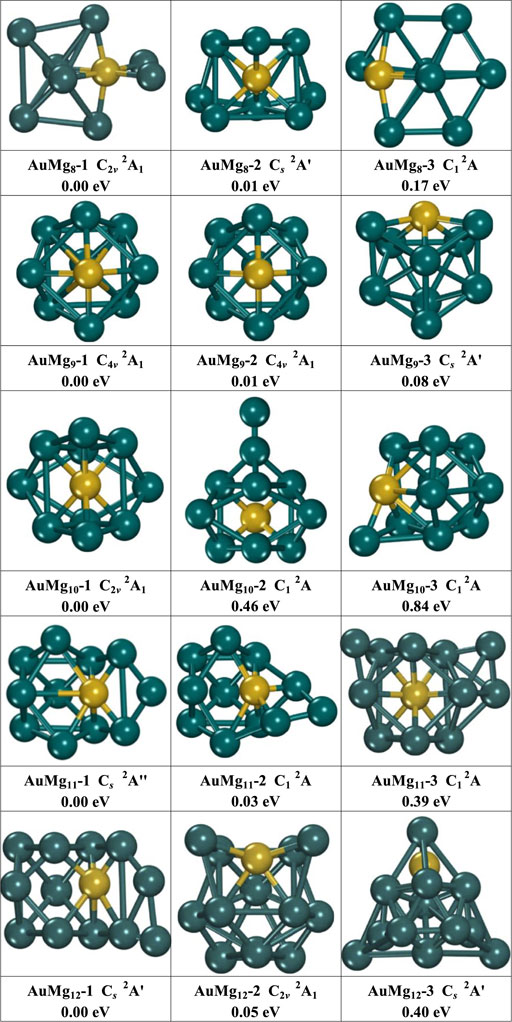
FIGURE 2. The geometry of the three lowest energy isomers of AuMgn (n = 8–12) nanoclusters, energy difference in eV from the lowest energy isomer at the same size.

TABLE 1. State, symmetry, Eb, ∆2E, Egap for α- and β-electrons, frequency and NCP on Au atom in the ground state of AuMgn (n = 2–12) nanoclusters.
As Figure 2 displayed, the medium-sized AuMgn (8–12) nanoclusters exhibit a diversity of structures. The structures of the isomers AuMg8-1 (C2v symmetry with 2A1 electronic state) and AuMg8-3 (C1 symmetry with 2A electronic state) are generated based on the deformation of AuMg7-3 after adsorption of an Mg atom, while the structure of the isomer AuMg8-2 (Cs symmetry with 2Aʹ electronic state) can be obtained from the deformation of AuMg7-2 by adsorption of an Mg atom. The second and third lowest energy isomers of AuMg8 nanoclusters are higher in energy than the ground state by 0.01 and 0.17 eV. The isomers AuMg9-1 and AuMg9-2 have the same symmetry (C4v), electronic structure (2A1), energy and “fascinating cage-like” structures. The isomer AuMg9-3 (2Aʹ electronic state), which is 0.08 eV higher in energy than AuMg9-1, has a cage-like structure with Cs symmetry. The structures of the isomers AuMg10-1 (C2v symmetry with 2A1 electronic state), AuMg10-2 (C1 symmetry with 2A electronic state) and AuMg10-3 (C1 symmetry with 2A electronic state) are generated based on the deformation of AuMg9-1 by adsorption of Mg atoms in different directions. The second and third lowest energy isomers of AuMg10 nanoclusters are higher in energy than the first lowest energy by 0.46 and 0.84 eV, respectively. Interestingly, the isomers AuMg11-1 (Cs symmetry with 2Aʹ electronic state) and AuMg11-2 (C1 symmetry with 2A electronic state) are easily obtained by the deformation of AuMg10-2 by adsorption of an Mg atom. On the other hand, AuMg11-3 (C1 symmetry with 2A electronic state) is formed by the deformation of AuMg10-1 after the adsorption of an Mg atom. AuMg11-2 and AuMg11-3 have higher energies than AuMg11-1 at 0.03 and 0.39 eV. The isomer AuMg12-1 (Cs symmetry with 2Aʹ electronic state) is generated by the adsorption of an Mg atom by AuMg11-1. The isomer AuMg12-2 (C2v symmetry with 2A1 electronic state), on the other hand, exhibits a deformed tubular-like structure, while the isomer AuMg12-3 (Cs symmetry with 2Aʹ electronic state) has a pyramid-like structure. Furthermore, compared to the energy of AuMg12-1, AuMg12-2 and AuMg12-3 are 0.05 and 0.40 eV higher, respectively. Because the lowest energy state isomers of nanoclusters often require more comprehensive studies to explore their various physical and chemical properties, the atomic coordinates of the AuMgn-1 (n = 2–20) nanoclusters are shown in Supplementary Table S1 in the Supplemental Material.
In conclusion, based on the small size of AuMgn-1 or smaller, AuMgn (n = 2–12) nanoclusters can usually be formed by adsorption of Mg atoms in different directions, and the interesting point is that the direction of adsorption does not have a fixed pattern. Such result is consistent with many existed Mg-based nanoclusters reported (Li et al., 2017; Zeng et al., 2020, 2021; Zhu et al., 2020). However, despite the many similarities, the structures of gold-doped Mg nanoclusters have unique properties compared to other Mg-based nanoclusters studies. For example, the structure of AuMg3 nanoclusters is 2D planar, while the lowest energy heterostructures of Be (Zeng et al., 2020), Si (Zhu et al., 2020), C, Ge, Sn (Zeng et al., 2021), Zn-doped (Li et al., 2017) Mg nanoclusters of corresponding sizes are all ortho-tetrahedral in shape. Interestingly, although the ground-state structures of AuMg9 and BeMg9 (Zeng et al., 2020) look similar, the significant difference between them is that the Au atom locates on the surface of AuMg9 while the Be atom is absorbed into the inside of BeMg9.
The Relative Stabilities
Since clusters exhibit different physical and chemical properties at different sizes, their relative stability is well worth studying. The relative stability of cluster can be calculated through the following three quantities, that is the binding energy per atom (Eb in eV), the second-order energy difference (Δ2E in eV) and the HOMO-LUMO energy gap (Egap in eV). Equations 1–3 display the above three energies for AuMgn-1 (n = 2–20) nanoclusters in Figure 1.
E (Au) and E (Mg) denote the energies of free Au and Mg atoms, E (AuMgn) means the energy of the corresponding nanocluster. The lowest unoccupied molecular orbital (LUMO) and highest occupied molecular orbital (HOMO) energies are ELUMO and EHOMO.
The theoretically calculated values of these quantities for AuMgn-1 (n = 2–20) nanoclusters are presented in Table 1 and their curves with size are showed in Figure 3. As Figure 3A displayed, overall, the Eb curve becomes larger as the size of the nanoclusters increases, implying that the atoms within the AuMgn nanoclusters bind more stably as the Au atoms are doped. Locally, the maximum value of Eb appears at AuMg10 (1.90 eV), indicating that this nanocluster has the robust stability. Secondly, a small local peak (1.84 eV) appears at AuMg4, indicating that it is slightly more stable than its neighbors. Figure 3B shows the curve of the Δ2E, which can be detected experimentally by mass spectrometry. Interestingly, as in the case of the local peaks of the Eb curve, AuMg4 and AuMg10 have local maximum Δ2E values of 0.29 and 0.28 eV, respectively. This conclusion suggests that they are both the most stable and have a high probability of being observed in mass spectrometry experiments. The thermodynamic stability of nanoclusters can be characterized by the value of their Egap. Since AuMgn nanoclusters are open-shell systems, they have both α and β-electrons, and the Egap of α and β-electrons are illustrated in Figure 3C and Figure 3D. For α-electrons Egap curve of AuMgn nanoclusters, the local peaks appear at n = 5, 9 and 11, while AuMg10 has the largest local β-electron Egap, indicating that the thermal stability of these clusters is relatively high.
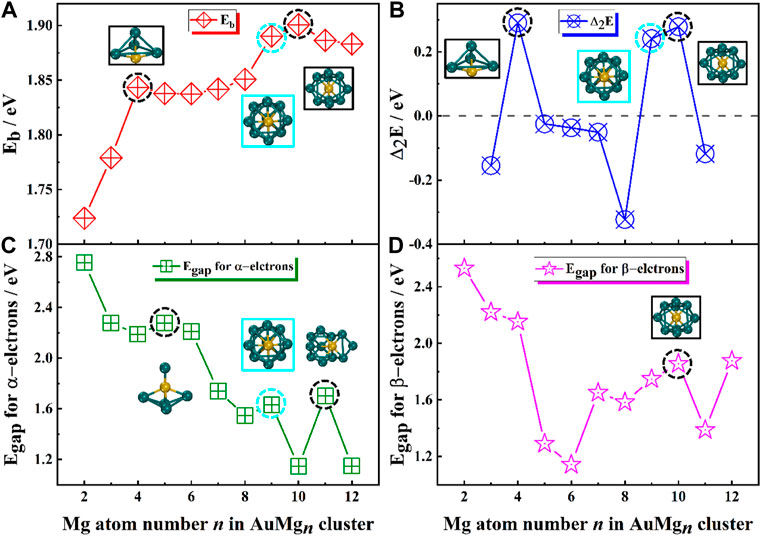
FIGURE 3. (A) Average binding energy Eb, (B) The second order difference energy Δ2E, (C) The HOMO-LUMO energy gap Egap for α-electrons, (D) The HOMO-LUMO energy gap Egap for β-electrons in the ground state of AuMgn (n = 2–12) nanoclusters.
In conclusion, AuMg4 and AuMg10 nanoclusters show the robust stability. However, it is noteworthy that the AuMg9 nanocluster is always the second largest value in both Eb and Δ2E curves, although they are not the maximum values. Therefore, combined with the Egap maximum for α-electrons, AuMg9 nanocluster also has considerable robust stability and be worthy studying.
Charge Transfer Property and Chemical Bond Analysis
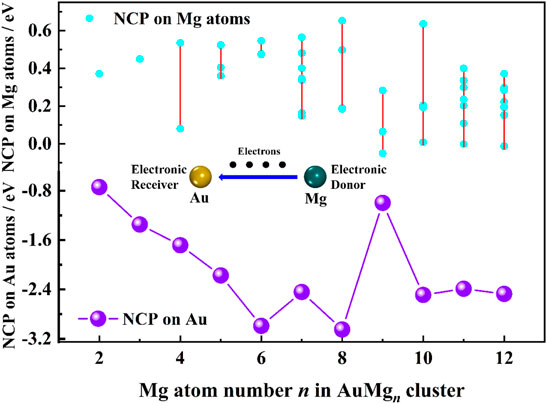
The natural charge population (NCP) results from the NBO calculations can reveal the charge transfer properties in the nanoclusters. The NCP values of Au atoms in Table 1 are in the range of [−2.99, −0.74] e, indicating that Au atoms play the role of electron receiver in all nanoclusters. The curve of NCP on Au atom with the size is ploted in Figure 4. The AuMg9 nanocluster appears to be very special, which is probably originated from its high symmetry structure. Supplementary Table S2 in the Supplementary Material shows the NCP values on the Mg atoms. Except for 4 Mg atoms in AuMg9 with a charge of −0.05 e and 1 Mg atom in AuMg12 with an NCP value of −0.01 e, all other Mg atoms have positive NCP values, distributed from 0.65 to 0.01 e, suggesting that they are losing electrons. In other words, Mg atoms are electron donors in the AnMgn nanoclusters. The charge transfer property depends on the electronegativity of the atom, the greater the electronegativity, the easier it is to get electrons. The electronegativity value of Mg atom is 1.31, while that of Au atom is 2.54, so the charge transfer is mostly from Mg atom to Au atom.
The ELF values of atomic bonding regions and their 2D maps are useful tools for analyzing the chemical bonding properties of nanoclusters. ELF is a value greater than 0 and less than 1, which characterizes the degree of electron localization and thus can determine the bonding properties. A region with ELF > 0.5 implies high electron localization and covalent bonding in the bonding region, while a region with ELF < 0.5 has low electron localization and non-covalent bonding in the bonding region. Figure 5 and Supplementary Figure S1 in the Supplementary Material display the 2D distribution of the EFL value for the ground state AuMgn (n = 2–12) nanoclusters. The calculations show that Mg-Mg in AuMgn nanoclusters is covalently bonded, while Au-Mg bond is non-covalent. The relatively large value of ELF around Au atom and low in bonding region indicates that the valence layer of Au atom is solidified around it, so it does not form covalent bonds with Mg. Furthermore, considering that the Au atom always gains electrons and the Mg atom around it loses electrons to be positively charged, it can be concluded that Au-Mg is ionic bonding. Another noteworthy point is that the critical size for Mg-Mg bonding is AuMg4. ELF distribution map shows that Mg-Mg does not covalently bond in AuMg2 and AuMg3 nanoclusters.
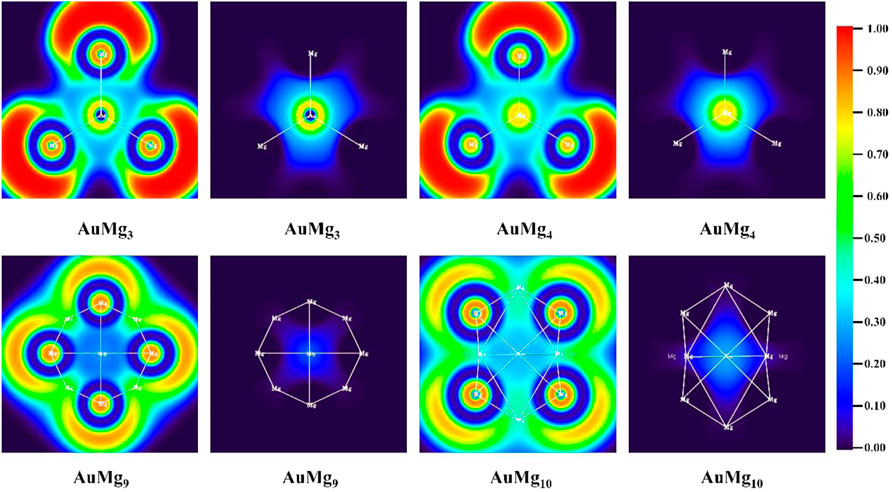
FIGURE 5. The ELF analysis for Mg-Mg and Au-Mg chemical bonds for AuMgn (n = 3, 4, 9, 10) nanoclusters.
The Nonlinear Optical Property
Static polarizabilities α (∞) and hyperpolarizabilities β (∞) for the ground state AuMgn (n = 2–20) nanoclusters were calculated to analyze their nonlinear optical property. Specifically, the coupled-perturbed Kohn-Sham (CPKS) method (Jensen, 2017) was adopted for the AuMgn nanoclusters to compute the polarizabilities and hyperpolarizabilities in the zero-frequency limit (λ→∞). The results of α(∞) and β(∞) calculations are presented in Supplementary Table S3 in the Supplementary Material and are shown in Figure 6. From Figure 6A, it can be seen that the polarization anisotropy αaniso (∞) and isotropy αiso (∞) of AuMgn nanoclusters do not change consistently with the size. The αiso (∞) shows an overall upward trend, except for AuMg9, while the αaniso (∞) oscillates with increasing size. In addition, αxx (∞), αyy (∞), αzz (∞) of each nanocluster are also shown in Figure 6A. Due to the diversity of the nanoclusters structures, these quantities display irregular oscillations in different directions. However, AuMg9 nanocluster with high structural symmetry exhibits synchronous local minimum anisotropic and isotropic polarization, suggesting that it has special nonlinear optical properties compared to other nanoclusters. In order to study the polarization of AuMg9 more intuitively, the unit sphere representation of its polarization tensor is plotted in Figure 6C. One can find the anisotropic polarization of AuMg9, more specifically, the small polarization rate in the x-y plane and the maximum polarization rate in the z-direction (i.e., the direction of the line connecting the leftmost Au and the rightmost Mg in the figure).
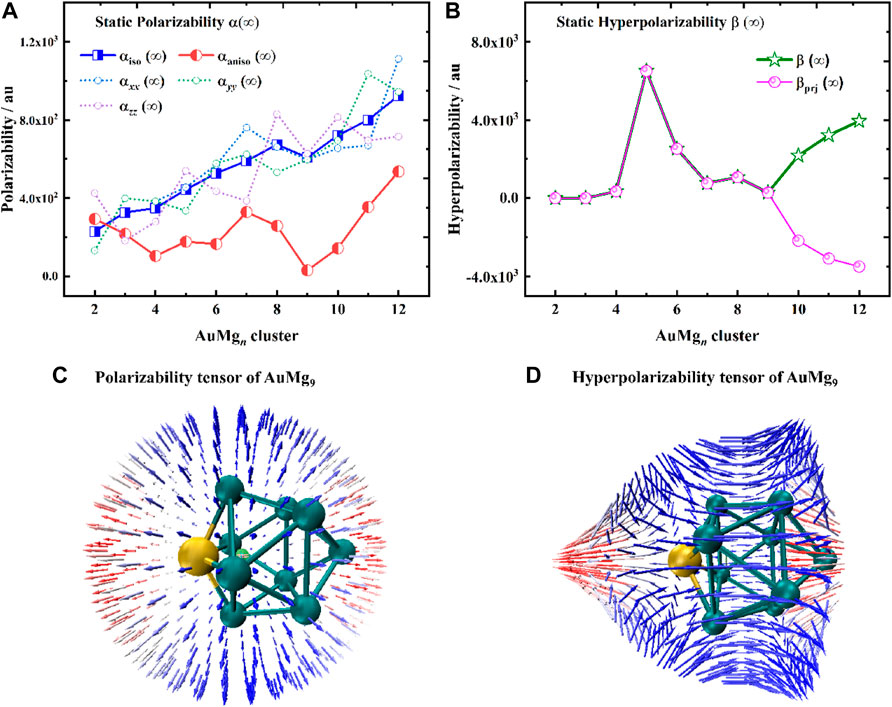
FIGURE 6. (A) Static polarizabilities α(∞), (B) Static hyperpolarizabilities β(∞) for the ground state of AuMgn (n = 2–12) nanoclusters, (C) The unit sphere representation of static polarizability tensor α, (D) The unit sphere representation of static hyperpolarizability tensor β of AuMg9 nanocluster.
Figure 6B exhibits the static hyperpolarizability β (∞) of the AuMgn nanoclusters and their projection values in the dipole moment direction βprj (∞). Since βprj (∞) can be measured by the electric field-induced second harmonic generation experiment (EFISH), it serves as a guide for experiments. Specifically, β increases from AuMg2 to a maximum value of AuMg5, then gradually decreases to a minimum value of AuMg9, and increases again afterward. Interestingly, the β and βprj of AuMg9 and the nanoclusters smaller than it are exactly equal, indicating that its β is isotropic with the dipole moment. However, starting from AuMg10 nanocluster, the two curves are reversed, forming a mirror-symmetric trend. Figure 6D shows the unit sphere representation of static hyperpolarizability tensor β of AuMg9, it is found that β is also anisotropic, with a maximum in the z-direction, and changes in the x-y plane as the Mg atoms surround it. In conclusion, relative to other nanoclusters, AuMg9 exhibits distinctive nonlinear optical properties.
Boltzmann Distribution Weighted Average Spectra of IR and Raman
For the ground state AuMgn nanoclusters, the infrared and Raman spectra with weighted average of the Boltzmann distribution were calculated for guidance experiments. The motivation for considering the Boltzmann distribution is due to the difficulty of observing only the ground state nanoclusters in experiments, especially in the gas-phase nanoclusters. Figure 7 display the IR and Raman spectra of the weighted average of the Boltzmann distribution at room temperature. The Boltzmann distribution probabilities of each isomer at different temperatures were also calculated by the relevant equations in the Supplementary Material. The small 3D plots in each map are the corresponding weighted average spectra at 100 k, 300 k and 1000 k temperatures. As shown in Figures 7–9, the strongest absorption peaks of IR spectra are distributed in the 40–350 cm−1 frequency band, while the strongest peaks of Raman spectra are distributed in a narrower band of 20–220 cm−1. However, the most intense peaks of both IR and Raman weighted average spectra appear around 200 cm−1 as the size increases. In addition, as can be seen from the small 3D plots in each figure and Supplementary Figure S2 in the Supplementary Material, the location of the most intense peak of the weighted average spectrum does not shift as the temperature increases, but the intensity changes.
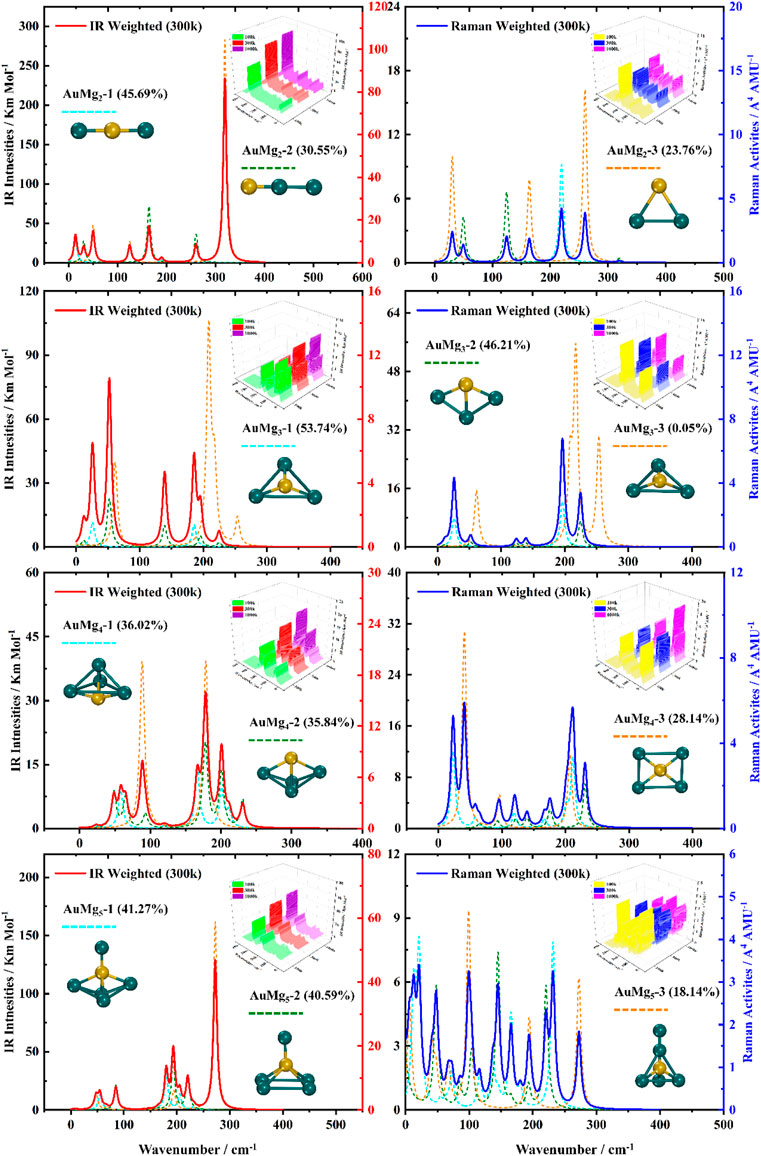
FIGURE 7. Boltzmann distribution weighted average spectra of the three lowest energy isomers of AuMgn (n = 2–5) nanoclusters at room temperature (IR on the left side, Raman on the right side).
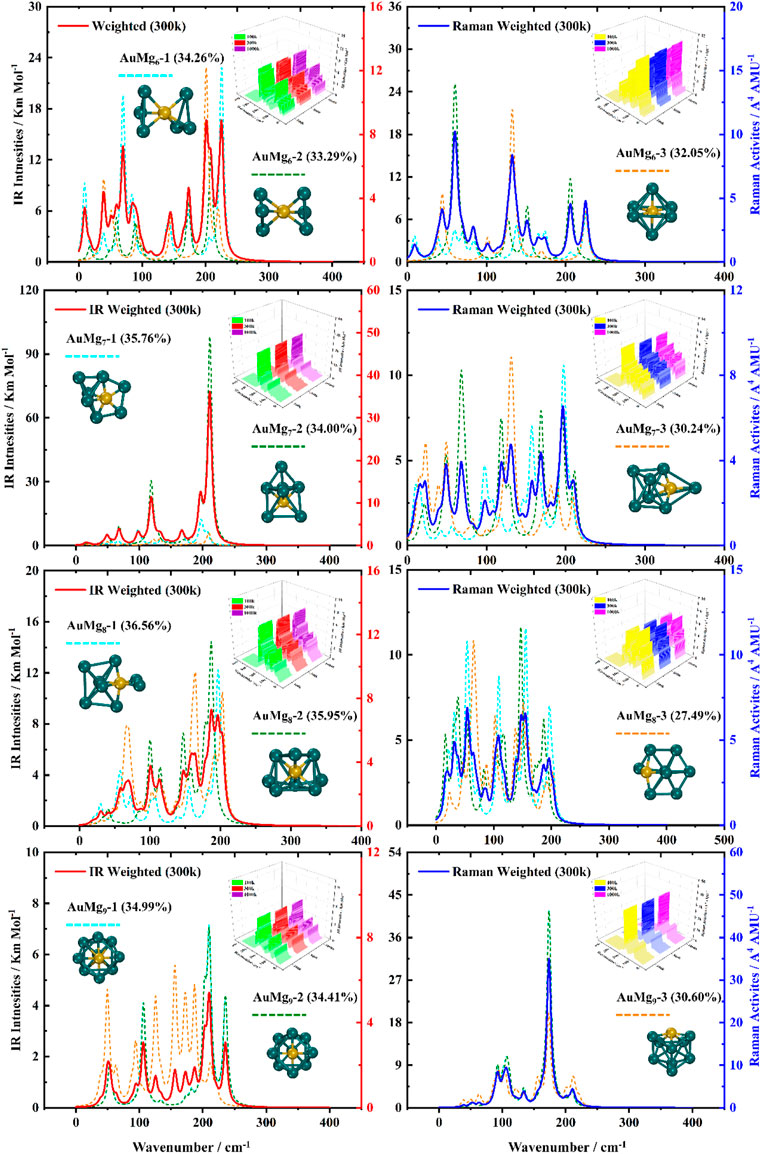
FIGURE 8. Boltzmann distribution weighted average spectra of the three lowest energy isomers of AuMgn (n = 6–9) nanoclusters at room temperature (IR on the left side, Raman on the right side).
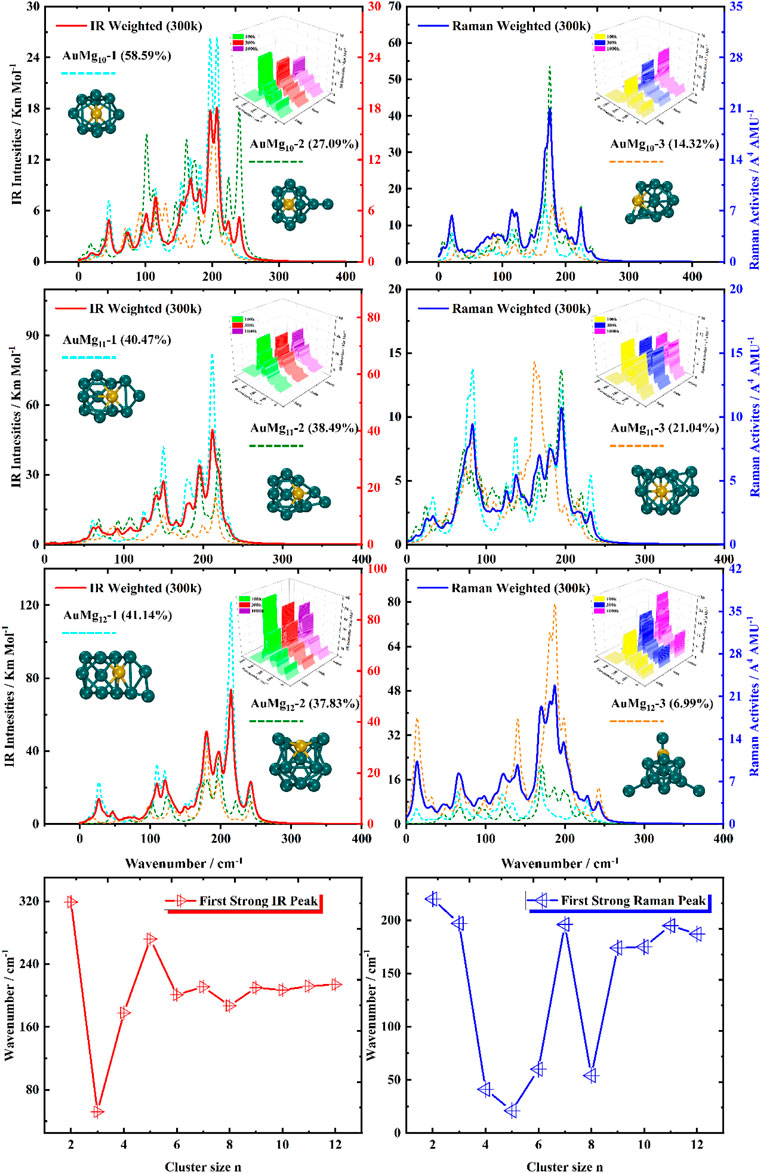
FIGURE 9. Boltzmann distribution weighted average spectra of the three lowest energy isomers of AuMgn (n = 10–12) nanoclusters at room temperature (IR on the left side, Raman on the right side), and the first strong IR and Raman peaks in AuMgn (n = 2–12) nanoclusters.
Specifically, for the weighted average IR spectra at room temperature, the nanoclusters of AuMgn (n = 4–12) are easily distinguished as separate strong bands in the 200 cm−1 regions of the spectra, except for the AuMg2 and AuMg3 nanoclusters. This result is in good agreement with the results of infrared spectroscopy of pure Mg nanoclusters studied by Belyaev et al. (Belyaev et al., 2016). For the Raman weighted average spectrum at room temperature, although the strongest Raman activity peaks of AuMg4, AuMg5 and AuMg6 nanoclusters appear in the low-frequency band (20–50 cm−1), they still have many strong peaks in the 200 cm−1 regions. Therefore, for all the Raman spectra of the AuMgn (n = 2–12) nanoclusters, the 200 cm−1 regions can be more easily distinguished as individual strong bands. In conclusion, it was computationally shown that the formation of AuMgn (n = 2–12) nanoclusters at room temperature is possible to identify these nanoclusters by IR and Raman spectroscopy.
The Average Bond Distance and Average Nearest Neighbor Distance
In order to provide more data support for future possible experiments, the average bond distance and average nearest neighbor distance were calculated. As shown in Figure 10, the average nearest neighbor distance and bond distance for Au-Mg and Mg-Mg in the ground state of AuMgn (n = 2–12) clusters display some interesting conclusions. Figures 10A,B show that, overall, the nearest neighbor distance for Au-Mg becomes larger as the cluster size increases (except for n = 8 and 12), while Mg-Mg is overall decreasing. The average nearest neighbor distance of Au-Mg is 2.68 Å, and that of Mg-Mg is 3.44 Å. Figure 10C gives the average bond distance of Au-Mg with cluster size dependence similar to the nearest neighbor distance of Au-Mg, i.e., increasing overall. However, Figure 10D demonstrates that the average Mg-Mg bond distance decreases and then increases with cluster size. Another interesting conclusion is that the local turning points of the average bond and nearest-neighbor distances for Mg-Mg and the average bond distance curves for Au-Mg occur at AuMg9, suggesting that they influence the local stability of the clusters.
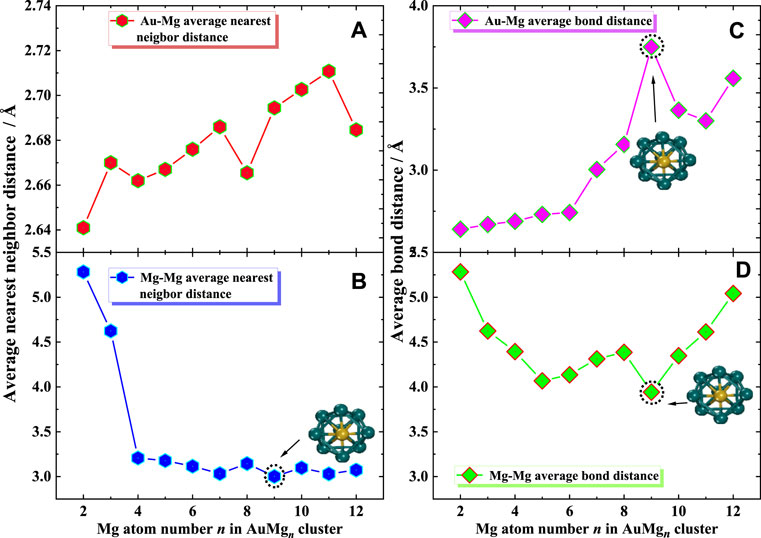
FIGURE 10. (A,B) Average nearest neighbor distance for Au-Mg and Mg-Mg, (C,D) Average bond distance for Au-Mg and Mg-Mg.
Conclusion
In this work, the structure of Au-doped Mgn (n = 2–12) nanoclusters was investigated by CALYPSO crystal search software. It is shown that the geometric growth mechanism of this nanocluster has similarities to other atom-doped Mgn clusters but also has unique features, such as the planar structure of AuMg3 and the high symmetry cage-like structure of AuMg9. Stability calculations show that AuMg4 and AuMg10 have high local stability, while AuMg9 nanoclusters are the second most stable nanoclusters. The charge transfer study reveals that Au atoms are electron receivers and Mg atoms are electron donors in AuMgn nanoclusters. ELF analysis showed that Mg-Mg formed a covalent chemical bond while Au-Mg was an ionic bond, and the critical size for the appearance of the Mg-Mg covalent bond was found to be AuMg3. The nonlinear optical properties of AuMgn nanoclusters were probed by calculating the static polarizability and hyperpolarizability, and the results indicate that AuMg9 is a special one of interest. Boltzmann distribution weighted average IR and Raman spectroscopy studies at room temperature confirm that these nanoclusters can be identified by spectroscopic experiments. Finally, the average bond distance and average nearest neighbor distance were fully investigated.
Data Availability Statement
The original contributions presented in the study are included in the article/Supplementary Material, further inquiries can be directed to the corresponding authors.
Author Contributions
B-CZ: Software, Investigation, Writing Original draft preparation. P-JD: Methodology, Investigation, Data curation, Visualization. JG: Data curation, Visualization. W-BK: Conceptualization, Methodology, Formal analysis, Investigation, Writing review and editing.
Funding
This work is supported partly by National Natural Science Foundation of China (No. 11947006), and partly by the Cultivating Project for Young Scholar at Hubei University of Medicine (No. 2019QDJZR12).
Conflict of Interest
The authors declare that the research was conducted in the absence of any commercial or financial relationships that could be construed as a potential conflict of interest.
Publisher’s Note
All claims expressed in this article are solely those of the authors and do not necessarily represent those of their affiliated organizations, or those of the publisher, the editors and the reviewers. Any product that may be evaluated in this article, or claim that may be made by its manufacturer, is not guaranteed or endorsed by the publisher.
Supplementary Material
The Supplementary Material for this article can be found online at: https://www.frontiersin.org/articles/10.3389/fchem.2022.870985/full#supplementary-material
References
Alvarez, M. M., Khoury, J. T., Schaaff, T. G., Shafigullin, M., Vezmar, I., and Whetten, R. L. (1997). Critical Sizes in the Growth of Au Clusters. Chem. Phys. Lett. 266, 91–98. doi:10.1016/S0009-2614(96)01535-7
Assadollahzadeh, B., and Schwerdtfeger, P. (2009). A Systematic Search for Minimum Structures of Small Gold Clusters Au[sub N] (N=2-20) and Their Electronic Properties. J. Chem. Phys. 131, 064306. doi:10.1063/1.3204488
Becke, A. D., and Edgecombe, K. E. (1990). A Simple Measure of Electron Localization in Atomic and Molecular Systems. J. Chem. Phys. 92, 5397–5403. doi:10.1063/1.458517
Belyaev, S. N., Panteleev, S. V., Ignatov, S. K., and Razuvaev, A. G. (2016). Structural, Electronic, Thermodynamic and Spectral Properties of Mgn (N=2-31) Clusters. A DFT Study. Comput. Theor. Chem. 1079, 34–46. doi:10.1016/j.comptc.2016.01.011
Chen, B., Conway, L. J., Sun, W., Kuang, X., Lu, C., and Hermann, A. (2021). Phase Stability and Superconductivity of lead Hydrides at High Pressure. Phys. Rev. B 103, 035131. doi:10.1103/PhysRevB.103.035131
Chen, H., Liang, H., Dai, W., Lu, C., Ding, K., Bi, J., et al. (2020). MgScH15: A Highly Stable Cluster for Hydrogen Storage. Int. J. Hydrogen Energ. 45, 32260–32268. doi:10.1016/j.ijhydene.2020.08.229
Frisch, M. J., Trucks, G. W., Schlegel, H. B., Scuseria, G. E., Robb, M. A., Cheeseman, J. R., et al. (2016). Gaussian 09, Revision A.02. Wallingford, CT: Gaussian, Inc. Available at: https://gaussian.com/g09citation/.
Huang, W., and Wang, L.-S. (2009). Probing the 2D to 3D Structural Transition in Gold Cluster Anions Using Argon Tagging. Phys. Rev. Lett. 102, 153401. doi:10.1103/PhysRevLett.102.153401
Idrobo, J. C., Walkosz, W., Yip, S. F., Öğüt, S., Wang, J., and Jellinek, J. (2007). Static Polarizabilities and Optical Absorption Spectra of Gold Clusters (Aun,n=2-14and 20) from First Principles. Phys. Rev. B 76, 205422. doi:10.1103/PhysRevB.76.205422
Jellinek, J., and Acioli, P. H. (2003). Magnesium Clusters: Structural and Electronic Properties and the Size-Induced Nonmetal-To-Metal Transition. J. Phys. Chem. A. 107, 1670. doi:10.1021/jp0301655
Jensen, F. (2017). Introduction to Computational Chemistry. West Sussex: John Wiley & Sons. Available at: https://xs.dailyheadlines.cc/books/about/Introduction_to_Computational_Chemistry.html?hl=zh-CN&id=UZOVDQAAQBAJ (Accessed October 14, 2021).
Jin, R. (2015). Atomically Precise Metal Nanoclusters: Stable Sizes and Optical Properties. Nanoscale 7, 1549–1565. doi:10.1039/C4NR05794E
Jin, R., Zeng, C., Zhou, M., and Chen, Y. (2016). Atomically Precise Colloidal Metal Nanoclusters and Nanoparticles: Fundamentals and Opportunities. Chem. Rev. 116, 10346–10413. doi:10.1021/acs.chemrev.5b00703
Köhn, A., Weigend, F., and Ahlrichs, R. (2001). Theoretical Study on Clusters of Magnesium. Phys. Chem. Chem. Phys. 3, 711–719. doi:10.1039/B007869G
Li, Z., Zhao, Z., Zhou, Z., Wang, H., and Li, S. (2017). First-principles Calculations on Small MgnZn and Mgn-1Zn2 Clusters: Structures, Stability, Electronic Properties. Mater. Chem. Phys. 199, 585–590. doi:10.1016/j.matchemphys.2017.07.049
Lu, C., and Chen, C. (2021). Indentation Strengths of Zirconium Diboride: Intrinsic versus Extrinsic Mechanisms. J. Phys. Chem. Lett. 12, 2848–2853. doi:10.1021/acs.jpclett.1c00434
Lu, C., and Chen, C. (2020a). Indentation-strain Stiffening in Tungsten Nitrides: Mechanisms and Implications. Phys. Rev. Mater. 4, 043402. doi:10.1103/PhysRevMaterials.4.043402
Lu, C., and Chen, C. (2020b). Structure-strength Relations of Distinct Mon Phases from First-Principles Calculations. Phys. Rev. Mater. 4, 044002. doi:10.1103/PhysRevMaterials.4.044002
Lu, C., Gong, W., Li, Q., and Chen, C. (2020). Elucidating Stress-Strain Relations of ZrB12 from First-Principles Studies. J. Phys. Chem. Lett. 11, 9165–9170. doi:10.1021/acs.jpclett.0c02656
Lu, T., and Chen, F. (2012). Multiwfn: A Multifunctional Wavefunction Analyzer. J. Comput. Chem. 33, 580–592. doi:10.1002/jcc.22885
Lv, J., Wang, Y., Zhu, L., and Ma, Y. (2012). Particle-swarm Structure Prediction on Clusters. J. Chem. Phys. 137, 084104. doi:10.1063/1.4746757
Lyon, J. T. (2021). Hydrogen Binding and Dissociation in MgScH Clusters (N ≤ 20). Int. J. Hydrogen Energ. 46, 36872–36877. doi:10.1016/j.ijhydene.2021.08.228
Peng, Y., Wang, P., Luo, L., Liu, L., and Wang, F. (2018). Green Synthesis of Fluorescent Palladium Nanoclusters. Materials 11, 191. doi:10.3390/ma11020191
Qian, H., and Jin, R. (2009). Controlling Nanoparticles with Atomic Precision: The Case of Au144(SCH2CH2Ph)60. Nano Lett. 9, 4083–4087. doi:10.1021/nl902300y
Ramakrishna, G., Varnavski, O., Kim, J., Lee, D., and Goodson, T. (2008). Quantum-Sized Gold Clusters as Efficient Two-Photon Absorbers. J. Am. Chem. Soc. 130, 5032–5033. doi:10.1021/ja800341v
Reed, A. E., Curtiss, L. A., and Weinhold, F. (1988). Intermolecular Interactions from a Natural Bond Orbital, Donor-Acceptor Viewpoint. Chem. Rev. 88, 899–926. doi:10.1021/cr00088a005
Shang, L., Dong, S., and Nienhaus, G. U. (2011). Ultra-small Fluorescent Metal Nanoclusters: Synthesis and Biological Applications. Nano Today 6, 401–418. doi:10.1016/j.nantod.2011.06.004
Shao, H., Xin, G., Zheng, J., Li, X., and Akiba, E. (2012). Nanotechnology in Mg-Based Materials for Hydrogen Storage. Nano Energy 1, 590–601. doi:10.1016/j.nanoen.2012.05.005
Shinde, R. (2016). Ab Initio Calculations of Optical Properties of Clusters. ArXiv160706928 Phys Available at: http://arxiv.org/abs/1607.06928 (Accessed October 11, 2021).
Shinde, R., and Shukla, A. (2017). First Principles Electron-Correlated Calculations of Optical Absorption in Magnesium Clusters. Eur. Phys. J. D 71, 301. doi:10.1140/epjd/e2017-80356-6
Sun, W., Kuang, X., Keen, H. D. J., Lu, C., and Hermann, A. (2020). Second Group of High-Pressure High-Temperature Lanthanide Polyhydride Superconductors. Phys. Rev. B 102, 144524. doi:10.1103/PhysRevB.102.144524
Tew, L., Cai, M.-T., Lo, L.-W., Khung, Y., and Chen, N.-T. (2018). Pollen-Structured Gold Nanoclusters for X-ray Induced Photodynamic Therapy. Materials 11, 1170. doi:10.3390/ma11071170
Trivedi, R., and Bandyopadhyay, D. (2015). Hydrogen Storage in Small Size MgnCo Clusters: A Density Functional Study. Int. J. Hydrogen Energ. 40, 12727–12735. doi:10.1016/j.ijhydene.2015.07.122
Trivedi, R., and Bandyopadhyay, D. (2016). Study of Adsorption and Dissociation Pathway of H 2 Molecule on Mg N Rh (N = 1-10) Clusters: A First Principle Investigation. Int. J. Hydrogen Energ. 41, 20113–20121. doi:10.1016/j.ijhydene.2016.09.007
Wang, Y., Lv, J., Zhu, L., and Ma, Y. (2012). CALYPSO: A Method for crystal Structure Prediction. Comput. Phys. Commun. 183, 2063–2070. doi:10.1016/j.cpc.2012.05.008
Wang, Y., Lv, J., Zhu, L., and Ma, Y. (2010). Crystal Structure Prediction via Particle-Swarm Optimization. Phys. Rev. B 82, 094116. doi:10.1103/PhysRevB.82.094116
Xia, X., Kuang, X., Lu, C., Jin, Y., Xing, X., Merino, G., et al. (2016). Deciphering the Structural Evolution and Electronic Properties of Magnesium Clusters: An Aromatic Homonuclear Metal Mg17 Cluster. J. Phys. Chem. A. 120, 7947–7954. doi:10.1021/acs.jpca.6b07322
Yan, N., Xia, N., Liao, L., Zhu, M., Jin, F., Jin, R., et al. (2018). Unraveling the Long-Pursued Au 144 Structure by X-ray Crystallography. Sci. Adv. 4, eaat7259. doi:10.1126/sciadv.aat7259
Yau, S. H., Varnavski, O., and Goodson, T. (2013). An Ultrafast Look at Au Nanoclusters. Acc. Chem. Res. 46, 1506–1516. doi:10.1021/ar300280w
Zeng, L., Liang, M.-K., Wei, X.-F., Guo, J., Dai, W., and Zhu, B.-C. (2021). New Potential Stable Structures of XMg N (X = Ge, C, Sn; N = 2-12) Clusters: XMg8 with High Stability. J. Phys. Condens. Matter 33, 065302. doi:10.1088/1361-648X/abc401
Zeng, L., Wei, X.-F., Liang, M.-K., Deng, P.-J., Bi, J., and Zhu, B.-C. (2020). BeMg9: A tower-like Type Doped Magnesium Clusters with High Stability. Comput. Mater. Sci. 182, 109795. doi:10.1016/j.commatsci.2020.109795
Zhang, F., Zhang, H., Xin, W., Chen, P., Hu, Y., Zhang, X., et al. (2020). Probing the Structural Evolution and Electronic Properties of Divalent Metal Be2Mgn Clusters from Small to Medium-Size. Sci. Rep. 10, 6052. doi:10.1038/s41598-020-63237-8
Zhao, Y. R., Bai, T. T., Jia, L. N., Xin, W., Hu, Y. F., Zheng, X. S., et al. (2019). Probing the Structural and Electronic Properties of Neutral and Anionic Lanthanum-Doped Silicon Clusters. J. Phys. Chem. C 123, 28561–28568. doi:10.1021/acs.jpcc.9b07184
Zhao, Y., Xu, Y., Chen, P., Yuan, Y., Qian, Y., and Li, Q. (2021). Structural and Electronic Properties of Medium-Sized Beryllium Doped Magnesium BeMg Clusters and Their Anions. Results Phys. 26, 104341. doi:10.1016/j.rinp.2021.104341
Zhu, B.-C., Deng, P.-J., Xiong, S.-Y., Dai, W., Zeng, L., and Guo, J. (2021). Au5Br: A New Member of Highly Stable 2D-type Doped Gold Nanomaterial. Comput. Mater. Sci. 194, 110446. doi:10.1016/j.commatsci.2021.110446
Keywords: calypso, DFT, AuMgn nanoclusters, optical properties, structural property
Citation: Zhu B-C, Deng P-J, Guo J and Kang W-B (2022) Computational Exploration on the Structural and Optical Properties of Gold-Doped Alkaline-Earth Magnesium AuMgn (n = 2–12) Nanoclusters: DFT Study. Front. Chem. 10:870985. doi: 10.3389/fchem.2022.870985
Received: 07 February 2022; Accepted: 04 March 2022;
Published: 29 March 2022.
Edited by:
Ambrish Kumar Srivastava, Deen Dayal Upadhyay Gorakhpur University, IndiaReviewed by:
Ruby Srivastava, Centre for Cellular and Molecular Biology (CCMB), IndiaShamoon Ahmad Siddiqui, Najran University, Saudi Arabia
Copyright © 2022 Zhu, Deng, Guo and Kang. This is an open-access article distributed under the terms of the Creative Commons Attribution License (CC BY). The use, distribution or reproduction in other forums is permitted, provided the original author(s) and the copyright owner(s) are credited and that the original publication in this journal is cited, in accordance with accepted academic practice. No use, distribution or reproduction is permitted which does not comply with these terms.
*Correspondence: Ben-Chao Zhu, YmVuY2hhb196aHVAMTI2LmNvbQ==; Wen-Bin Kang, d2JrYW5nQGhibXUuZWR1LmNu
 Ben-Chao Zhu
 Ping-Ji Deng