 Chunyuan Pian1Weichao Peng2Haoyu Ren3Chao Ma4Yun Su1Ruixia Ti1Xiuyu Chen1Lixia Zhu1Jingjing Liu1Xinzhi Sun1Bin Wang1*Bingxuan Niu5*
 Dapeng Wu3,6*
- 1School of Physics and Electronic Engineering, Xinxiang University, Xinxiang, China
- 2Key Laboratory for Biomedical Effects of Nanomaterials and Nanosafety, Institute of High Energy Physics, Chinese Academy of Sciences, Beijing, China
- 3Collaborative Innovation Centre of Henan Province for Green Manufacturing of Fine Chemicals, Key Laboratory of Green Chemical Media and Reactions, Ministry of Education, School of Chemistry and Chemical Engineering, Henan Normal University, Xinxiang, China
- 4School of Mechanical and Electrical Engineering, Xinxiang University, Xinxiang, China
- 5Collage of Pharmacy, College of Biomedical Engineering, Xinxiang Medical University, Xinxiang, China
- 6School of Environment, Henan Normal University, Xinxiang, China
α-Fe2O3 has high potential energy storage capacity and can serve as a green and low-cost anode material for lithium-ion batteries. However, α-Fe2O3 suffers large volume expansion and pulverization. Based on DFT calculations, TiO2 can effectively maintain the integrity of the crystal structure during the discharge/charge process. Well-defined cubic α-Fe2O3 is coated with a TiO2 layer using the hydrothermal method with the assistance of oxalic acid surface treatment, and then α-Fe2O3@TiO2 with tunable buffer chambers is obtained by altering the hydrochloric acid etching time. With the joint efforts of the buffer chamber and the robust structure of the TiO2 layer, α-Fe2O3@TiO2 alleviates the expansion of α-Fe2O3 during the discharge/charge process. The optimized sample (FT-1h) achieves good cycling performance. The reversible specific capacity remains at 893.7 mA h g-1, and the Coulombic efficiency still reaches up to 98.47% after 150 cycles at a current density of 100 mA g−1. Furthermore, the reversible specific capacity can return to 555.5 mA h g−1 at 100 mA g−1 after cycling at a high current density. Hence, the buffer chamber and the robust TiO2 layer can effectively improve the cycling stability and rate performance of α-Fe2O3.
Introduction
With the rapid development of portable electronic devices and electric vehicles, the demand for batteries with higher energy densities, greater safety, and longer cycling lifetimes has become extremely urgent (Duffner et al., 2021; Wang et al., 2022). Lithium-ion batteries (LIBs) have been widely used over the past few years and have been increasingly studied (Kim et al., 2019; Guo and Li, 2021). The ideal anode material should have a much higher cycle life and a moderate potential plateau (Jin et al., 2021). Transition metal oxides (MOx, where M represents Fe, Co, Mn, Ni, etc.) are usually used as anode materials in lithium-ion batteries due to their high theoretical specific capacity (Li et al., 2021a; Li Q. et al., 2021). α-Fe2O3 has become a promising anode material for Li-ion batteries due to its high theoretical capacity (1,007 mAh g−1) and low cost (Kong et al., 2016). However, the poor conductivity and violent volume expansion of α-Fe2O3 during the discharge/charge progress result in its poor rate and cycling performance as an anode material in Li-ion batteries. To overcome these problems, many researchers have expended considerable efforts to test potential solutions, such as various morphologies [porous quasi-clusters (Li Z. et al., 2019), porous nanotubes (Wang Z. et al., 2018), and one-dimensional mesoporous nanowires (Li et al., 2020)] and conductive carbon material coatings [graphene oxide (Zhang et al., 2019), carbon cloth (Narsimulu et al., 2019), N-doped carbon hybrids (Li et al., 2018), and spherical graphite (Yan et al., 2020)]. Although the rate and cycling performance of α-Fe2O3 have been improved, they have still not reached satisfactory levels.
TiO2 is an essential member of the family of transition metal oxides, which are widely used in photocatalysis (Xu et al., 2017; Wang L. et al., 2018; Shi et al., 2018; Wang et al., 2019a; Wang et al., 2019b), solar cells (Wu et al., 2017), and lithium-ion batteries (Huo et al., 2021). As an anode of lithium-ion batteries, TiO2 has good cycling stability and a low volume expansion ratio (less than 4%) (Liang et al., 2020). However, the reversible capacity of TiO2 as an anode material in lithium-ion batteries is low, and its theoretical capacity is only 335 mA h g−1 (Liang et al., 2020). To improve the specific capacity of TiO2, a large number of scientific researchers investigated different structures of TiO2, such as porous (Nong et al., 2020), hollow nanosphere (Fan et al., 2021), branch-like (Gao et al., 2019), heterogeneous mesoporous hollow nanocage-in-nanocage, and sandwich structures (Yuan et al., 2019). Additionally, many attempts to combine carbon with TiO2 have been made (Ni et al., 2019; Yuan et al., 2021). However, the specific capacity of TiO2 has still not been significantly improved.
The combination of α-Fe2O3 and TiO2 may form a new kind of Li-ion battery anode material. α-Fe2O3 grains grafted onto TiO2/carbon nanofibers (CNFs) have been successfully fabricated by electrospinning and vapor–solid reaction (VSR), with the resulting material demonstrating greatly enhanced diffusion kinetics and structural stability for use in lithium-ion batteries (Yang et al., 2019). Robust Fe2O3 nanoplates have been coated with small TiO2 nanoplates, forming a slice-on-slice structure with large voids, with the resulting material exhibiting good Li storage properties (Zhao et al., 2018). A bio-inspired nanotubular TiO2/Fe2O3 composite has been fabricated by using a natural cellulose substance (laboratory filter paper) as the structural scaffold, showing good cycling stability and excellent rate capability (Li S. et al., 2019). Notably, a core–shell structure is an effective means to improve cycling performance (Li et al., 2021). Thus, α-Fe2O3@TiO2 composed of a hollow inner core and an outer shell with massive mesopores has been prepared, thus exhibiting outstanding electrochemical properties (Fu et al., 2015).
Different from the aforementioned materials, a tunable buffer chamber is fabricated in this study. Cubic α-Fe2O3 is used as the core, and a TiO2 layer is coated on this core using the hydrothermal method. With an increasing etching time, α-Fe2O3@TiO2 becomes more hollowed out. Thus, a buffer chamber is formed between α-Fe2O3 and TiO2. With the help of this structure, the volume expansion of α-Fe2O3 during the discharge/charge process is alleviated when applied as the anode material in lithium-ion batteries, which is also proven by theoretical calculations.
Theoretical and Experimental Method
Calculation Method
With the density functional theory (DFT) (Hohenberg, 1964; Kohn and Sham, 1965), the process of Li-ion de/insertion in α-Fe2O3 and TiO2 is studied. Ultrasoft pseudopotentials were used to calculate the interaction of the ionic core and valence electrons for Fe 3d64s2, Ti 3s23p63d24s2, Li 1s22s1, and O 2s2p4. The exchange and correlation terms were described with the generalized gradient approximation (GGA) of Perdew–Burke–Ernzerhof (PBE) (Perdew et al., 1996; Perdew et al., 1998). Monkhorst–Pack k-point meshes were conducted to address the Brillouin-zone integrations (Monkhorst and Pack, 1976). Convergence criteria were set as follows: the maximum force, the maximum stress, and the maximum displacement on the atom were below 0.1 eV nm−1, 0.02 GPa, and 5.0 × 10⁻⁵ nm, respectively.
A periodic structure was adopted in the calculation. The unit cells of α-Fe2O3 and anatase TiO2 (space group of R-3C and 141/AMD) contained 12 iron atoms, 18 oxygen atoms, four titanium atoms, and eight oxygen atoms (Supplementary Figure S1). Moreover, 380 eV was set as the cutoff energy for both. The number of k-points was set as 6 × 6×2 and 7 × 7×3. The calculated lattices agreed well with the theoretical and experimental data (Finger and Hazen, 1980; Arlt et al., 2000; Zhang et al., 2017; Jenness et al., 2018) (Supplementary Table S1).
Synthesis of α-Fe2O3
With vigorous stirring in an oil bath at 75°C, 50 ml of 2.0 mol/L FeCl3·6H2O solution was added to a round-bottom flask containing 50 ml of 5.4 mol/L NaOH. After stirring for 5 min, a red-brown Fe(OH)3 colloid formed in the flask, which was then transferred to a high-temperature and high-pressure PTFE reactor. The hydrothermal reaction was conducted at 100°C for 4 h. After cooling to room temperature, the obtained red precipitate was centrifuged, successively rinsed with deionized water and ethanol three times, and then dried overnight to obtain α-Fe2O3.
The synthesized α-Fe2O3 was treated with oxalic acid, for which 8 ml of deionized water was added to a beaker containing 0.2 g of α-Fe2O3, and then 0.1 g of oxalic acid was added. After shaking at room temperature for 6 h, the red precipitate was obtained by centrifugation and then successively rinsed with deionized water and ethanol three times. After drying overnight, oxalic acid-treated α-Fe2O3 was obtained.
Synthesis of Core–Shell α-Fe2O3@TiO2
The core–shell α-Fe2O3@TiO2 synthesis process is illustrated in Figure 1. In a beaker containing 33 ml of absolute ethanol, 0.1 g of oxalic acid-treated α-Fe2O3 was added, and then, 0.1 ml of concentrated ammonia water was added with stirring and stirred for 5 min. Next, 0.25 ml of tetrabutyl titanate (TBOT) was added with vigorous stirring, and ultrasonication was performed for 40 min. The solution in the beaker was transferred to the PTFE reactor. After hydrothermal reaction at 45°C for 24 h, the solution was cooled to room temperature and then centrifuged. The red precipitate was rinsed with deionized water and ethanol three times and then dried overnight. In an air environment, the product was calcined at 450°C for 2 h to obtain α-Fe2O3@TiO2, and then, 0.1 g α-Fe2O3@TiO2 was added to 25 ml of 10 mol/L HCl and oscillated for 0.5, 1, 2, 4, and 12 h. Then, they were successively rinsed with deionized water and ethanol three times and dried overnight to obtain α-Fe2O3@TiO2 at different etching degrees. The samples were denoted as FT-0.5h, FT-1h, FT-2h, FT-4h, and FT-12h (pure TiO2).
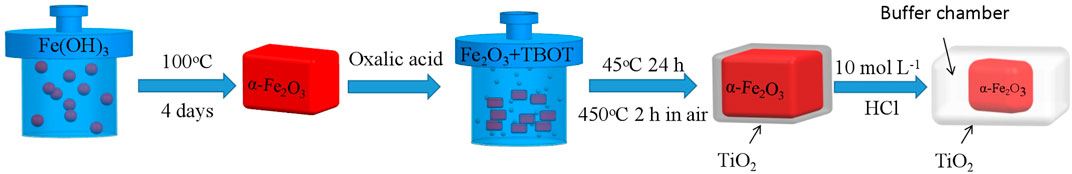
FIGURE 1. Schematic showing the synthesis of core–shell α-Fe2O3@TiO2.
Material Characterization
X-ray diffraction (XRD, Bruker D8, Germany) was used to characterize the synthesized powder samples. The morphology of each sample was observed by field emission scanning electron microscopy (FESEM) and high-resolution transmission electron microscopy (HRTEM, JEOL, JSM-2100, Japan). The component and valence analysis of the synthesized samples were carried out by X-ray photoelectron spectroscopy (XPS, ESCALAB 250, an Al K excitation source, United States). Additionally, HRTEM (TF20, JOEL, 2100F, Japan) was used to map the elemental distribution of the samples. The specific surface area and pore size analyzer (BET, ASiQ Mini QUANTACHROME) was used to determine the porosity of the samples.
Electrochemical Characterization
The prepared samples were mixed with acetylene black and polyvinylidene fluoride (PVDF) at a weight ratio of 7:2:1 in N-methyl-2 pyrrolidone (NMP). The obtained slurry was uniformly smeared on a 9-μm-thick copper foil and dried in a vacuum oven at 80°C for 10 h, and then a 12-mm-diameter negative plate was cut, and 1 M LiPF6, in a mixture of 1:1:1 vol.% ethylene carbonate (EC), diethyl carbonate (DEC), and dimethyl carbonate (DC) was used as the electrolyte (ternary electrolyte LBC305-1, Shenzhen Kejinzida Technology Co., Ltd.). With a 15.6-mm × 0.45-mm lithium sheet as the positive electrode and a Celgard 2325 diaphragm as the battery separator, the prepared negative electrode was assembled into a CR2025 battery in a glove box (Super, Germany Mikrouna) that was filled with argon gas (water concentration <0.1 ppm and oxygen concentration <0.1 ppm). The cycling and rate performance were tested with a Blue Power instrument (Wuhan Blue Electronics Co., Ltd.). An electrochemical workstation (Shanghai Chenhua Instrument Co., Ltd.) was used to obtain cyclic voltammetry (CV) curves, and a different electrochemical workstation (ZAHNER Company, Germany) was used to conduct electrochemical impedance spectroscopy (EIS).
Results and Discussion
Calculation Analysis
According to the symmetry of α-Fe2O3 and anatase TiO2, there are one and two symmetrical positions for Li ions to be inserted into α-Fe2O3 (6b) and TiO2 (16 h, 8 days), respectively (Figure 2). One unit cell of α-Fe2O3 can accommodate six Li ions, but one unit cell of TiO2 can only accommodate four Li ions. Thus, the reaction equation of Li ions and Fe2O3 is as follows:
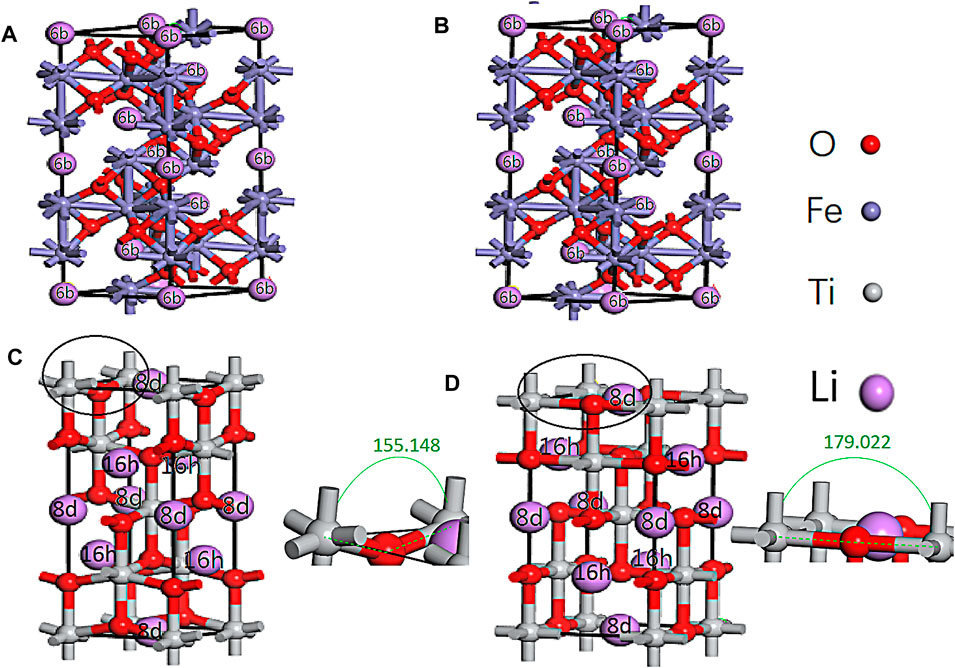
FIGURE 2. Li inserted in the symmetrical sites of α-Fe2O3 (6b) and TiO2 (16 h, 8 days) before the geometry optimization (A,B) and after the geometry optimization (B,D).
Eq (1) is consistent with Yang et al. (2019). The reaction process of Li ions and TiO2 is given in Eq. 2:
From Eq. 2, the theoretical capacity of TiO2 can be calculated (335 mA h g−1), which is consistent with Liang et al. (2020). After six Li ions were inserted into the α-Fe2O3 unit cell, the volume expanded by 9.64%. The volume of TiO2 expanded by 1.15% after four Li ions were inserted. Moreover, the one, two, three, four, and five and one, two, and three Li ions inserted in the cells at the different sites of α-Fe2O3 and TiO2 were also calculated (Supplementary Table S2). With an increasing number of Li ions inserted in the α-Fe2O3 cell, the volume continued to expand. However, it was amazing to find that the expansion rate of TiO2 always remained below 2.2%. With the same number of Li ions inserted in the cell, the volume expansion of α-Fe2O3 was larger than that of TiO2. There are two reasons for this result: one is that the interstitial vacancy (8 days and 16 h) of TiO2 is larger than that of α-Fe2O3 (6b) and the other is that with Li ions insertion, the angle of Ti-O-Ti (Figures 2C,D) changes from 155.148° to 179.022°, which acts as a buffer. Hence, TiO2 can effectively maintain its cell structure. Furthermore, it is believed that with an increasing number of Li ions inserted in α-Fe2O3 and the combination of O ions, the cell will continue to expand. This mechanism is the reason to coat α-Fe2O3 with TiO2. Moreover, it is not found that the bonds of Ti-O and Fe-O are broken, which can be verified from Figure 2, the population analysis (Supplementary Table S3), and the density of states (DOS) (Figure 3).
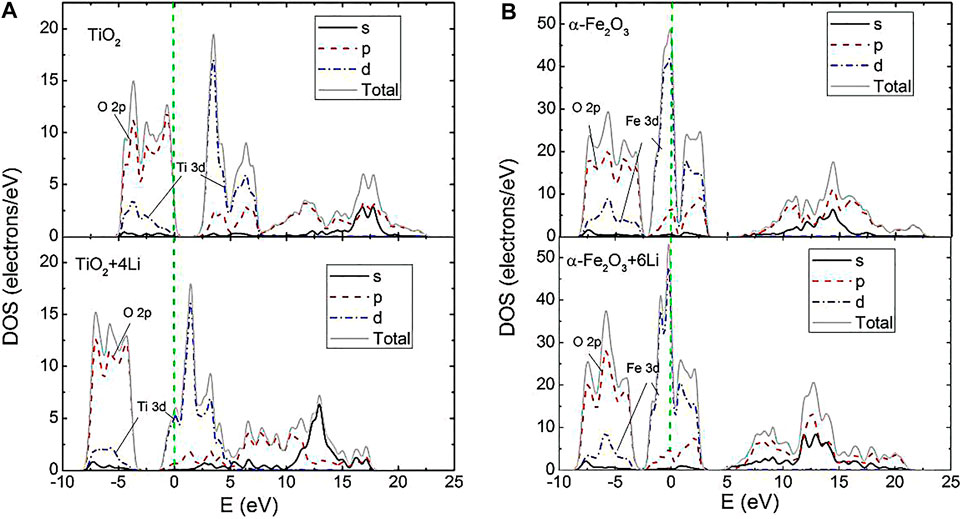
FIGURE 3. Density of states of TiO2 (A) and α-Fe2O3 (B) with and without Li inserted at the symmetrical sites. The green dashed line represents a Fermi energy of 0.
The electronic population is usually used to assess the covalent or ionic nature of a bond. A high value of the bond population expresses a strong covalent bond (Aouadi, 2006). Both α-Fe2O3 and TiO2 have two types of bonds, which are marked I and II in Supplementary Figure S1. From Supplementary Table S3, it can be found that the electronic populations of Fe-O I were little larger than those of Fe-O II. Meanwhile, the bond length of Fe-O I was shorter than that of Fe-O II. Nevertheless, the electronic population of Ti-O I was larger than that of Ti-O II, which means Ti-O I had stronger covalent bonds. When Li ions were inserted in α-Fe2O3 and TiO2, the electronic population and bond length increased. Bond length increase can be attributed to volume expansion. Among them, the electronic population of Ti-O I increased the most, which means Ti-O I was enhanced. Instead of breaking, Ti-O I was strengthened.
The DOS of α-Fe2O3 and TiO2 express two main regions near the Fermi level (Figure 3). The more important part is the first region, which is predominantly formed by non-metal O 2p states and Ti 3d (Fe 3d) states located between −10 and 0 eV. This part forms a strong p-d covalent bonding. With the Ti (Fe) and O atoms getting squeezed, it is found that the DOS below the Fermi level move to the low-energy part (the DOS of TiO2+4 Li and Fe2O3+6 Li), which shows that Ti-O and Fe-O are enhanced. Furthermore, the TiO2+4 Li DOS move more than the Fe2O3+6 Li DOS. This result indicates that Ti-O is more enhanced, which agrees well with the electronic population analysis.
Morphological and Structural Characterization
The SEM images of α-Fe2O3 without coating TiO2 are shown in Figures 4A,B. α-Fe2O3 is successfully synthesized during the experiment. The XRD result is consistent with the diffraction peak of α-Fe2O3 (Haematite, syn) in PDF#33-0664 (Supplementary Figure S2). α-Fe2O3 has a cubic morphology with relatively smooth surfaces and a size of approximately 400–500 nm. In order to compare the effect of oxalic acid-treated and untreated α-Fe2O3 coating with TiO2, untreated α-Fe2O3 is used for TiO2 layer cladding. According to Figures 4C,D, when untreated α-Fe2O3 is coated with TiO2, it is more prone to heterogeneous nucleation, and agglomeration is easy to occur. After cladding, the homogeneous Fe2O3 particles become inhomogeneous α-Fe2O3@TiO2 particles.
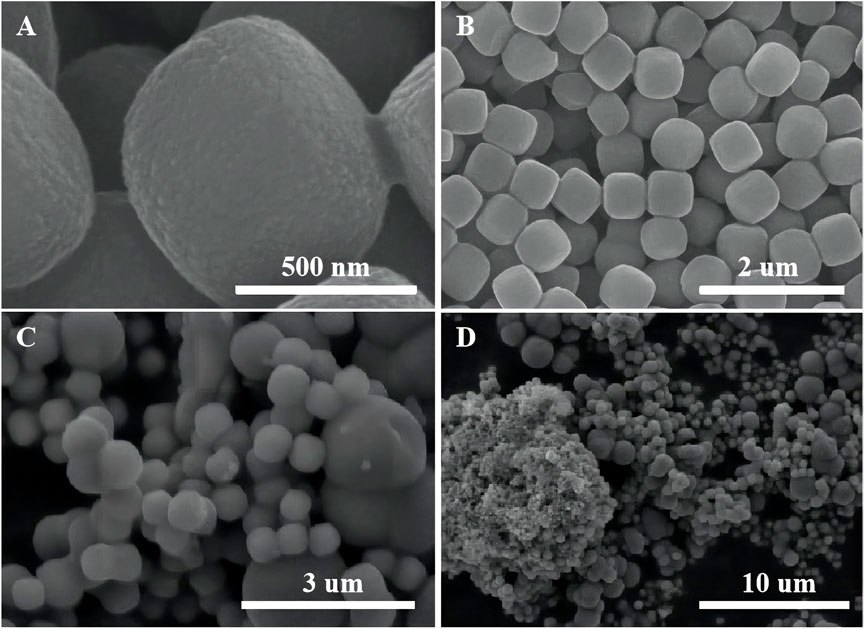
FIGURE 4. SEM images of α-Fe2O3 (A) and (B) and unprocessed α-Fe2O3 coated with TiO2 (C) and (D).
Figure 5 shows the samples of oxalic acid-treated α-Fe2O3 coated with TiO2 and etched for different periods of time. Clearly, with an increasing etching time, α-Fe2O3@TiO2 gradually changes from a core–shell structure to a completely hollowed out TiO2 structure. The average core–shell sizes of different samples are listed in Supplementary Table S4. With hydrochloric acid etching, the thickness of shell changes a little, reducing from 58 to 45 nm, and maintains at 53 nm during the etching time of 1–4 h, while the core size changes greatly. The vertical diagonal (diagonal 1) changes from 560 to 100 nm. The horizontal diagonal (diagonal 2) changes from 568 to 419 nm. Thus, hydrochloric acid etching mainly aims to Fe2O3.
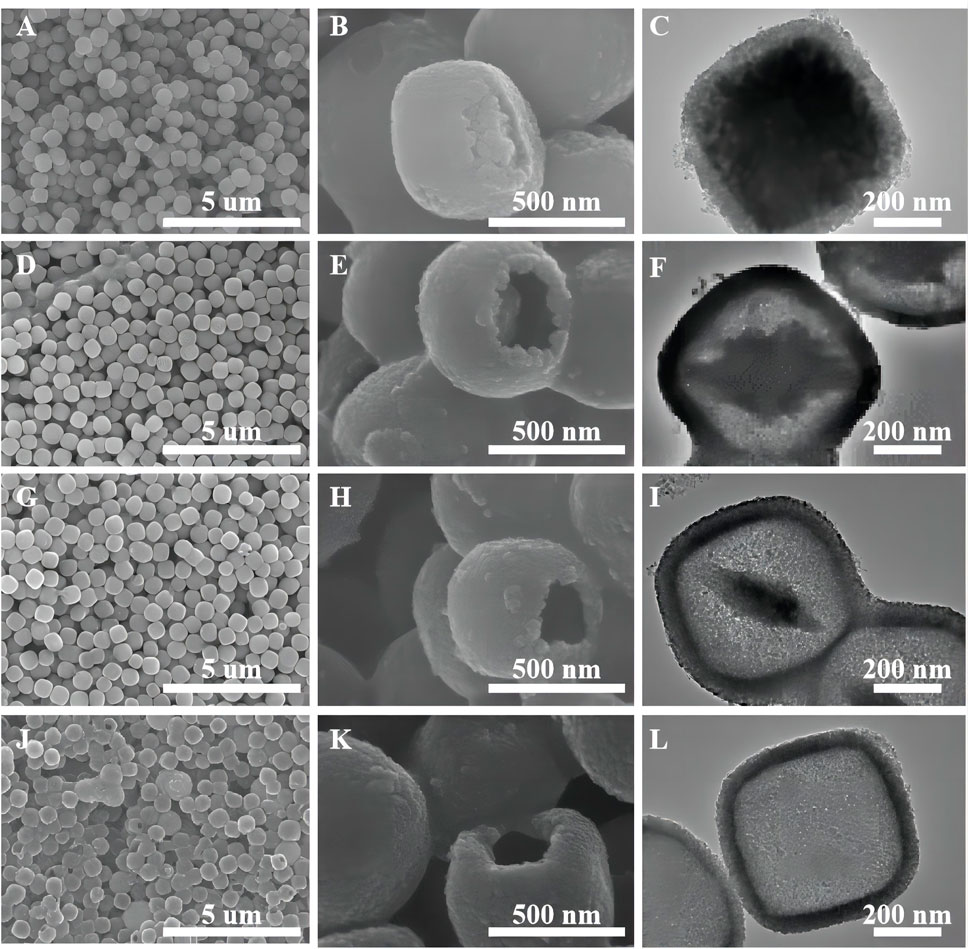
FIGURE 5. SEM images of oxalic acid-treated α-Fe2O3 coated with TiO2 and etched for different periods of time [FT-0.5h (A,B), FT-2h (D,E), FT-4h (G,H), and FT-12h (J,K) (pure TiO2)]. TEM images of oxalic acid-treated α-Fe2O3 coated with TiO2 and etched for different periods of time [FT-0.5h (C), FT-2h (F), FT-4h and (I), FT-12h (L) (pure TiO2)].
As shown in Figure 6, the sample etched for 1 h (FT-1h) possesses a well-defined core–shell structure with a buffer chamber between the α-Fe2O3 core and the TiO2 shell. From Figure 6A, it can be clearly observed that TiO2 is successfully coated on α-Fe2O3. Furthermore, the TiO2 coating layers are very uniform with few ruptures (Figure 6B). In addition, Figure 6C shows that there is a chamber between the α-Fe2O3 core and the TiO2 shell whose thickness is about 80 nm. According to the EDS mapping of a single α-Fe2O3@TiO2 core–shell structure (Figure 6D), Fe, Ti, and O are evenly distributed. The red section in Figure 6E shows that the TiO2 layer covers the surface of α-Fe2O3@TiO2, and the yellow part in Figure 6F represents the α-Fe2O3 core structure. The green section illustrated in Figure 6G refers to O that is jointly contained by α-Fe2O3 and the TiO2 covering layer in a single α-Fe2O3@TiO2 core–shell structure. The composition of composite is further demonstrated by energy-dispersive spectroscopy (EDS), shown in Figure 6H. From the illustration, it shows that the compound is mainly composed of Fe2O3 and TiO2, and Fe2O3 is the main part. Figure 7 displays the HRTEM image of FT-1h α-Fe2O3@TiO2. The stripes and grids on dark and light are different, which demonstrated that they were assembled by small crystals with measured lattice d-spacings of 0.35 and 0.37 nm, corresponding to the (101) plane of anatase TiO2 and the (012) plane of Fe2O3, respectively. So, it can be proven that TiO2 is uniformly dispersed on the surface of Fe2O3.
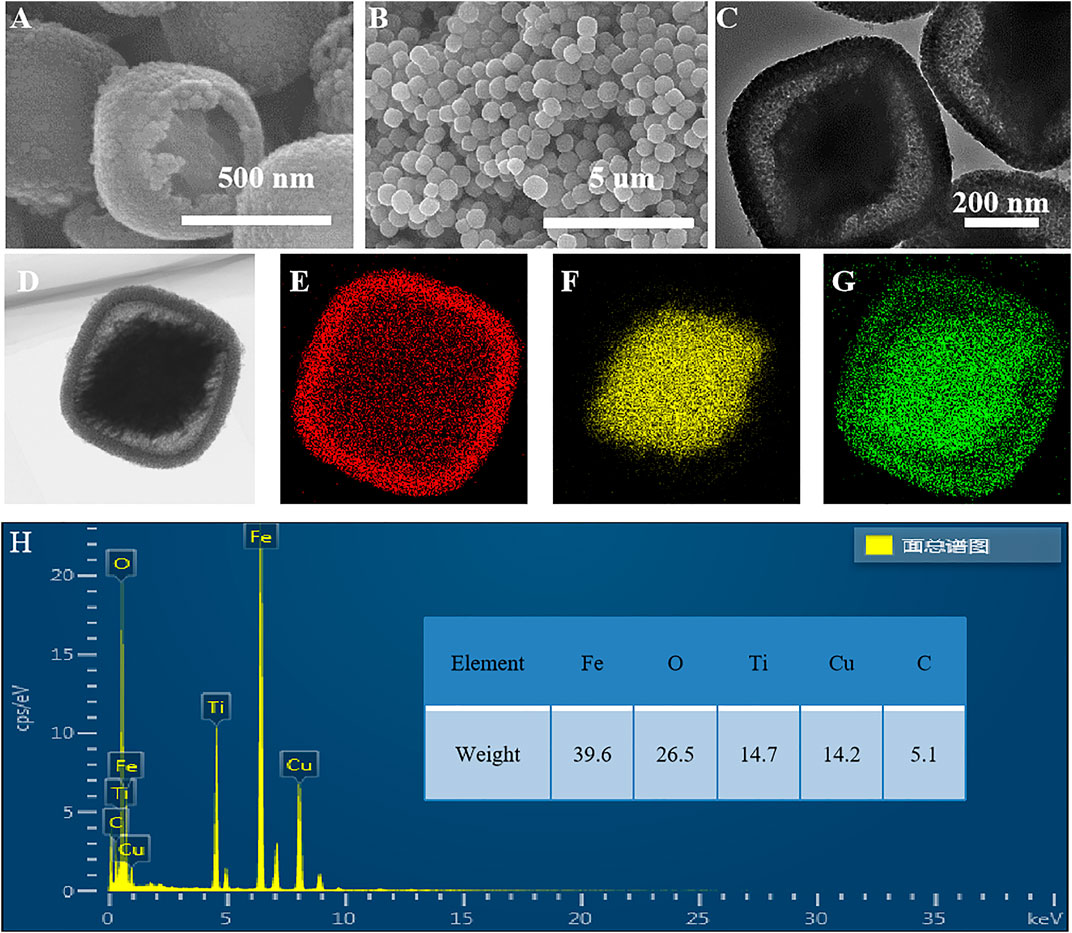
FIGURE 6. SEM (A,B) and TEM-EDS of a single FT-1h α-Fe2O3@TiO2 core–shell structure (C–H).
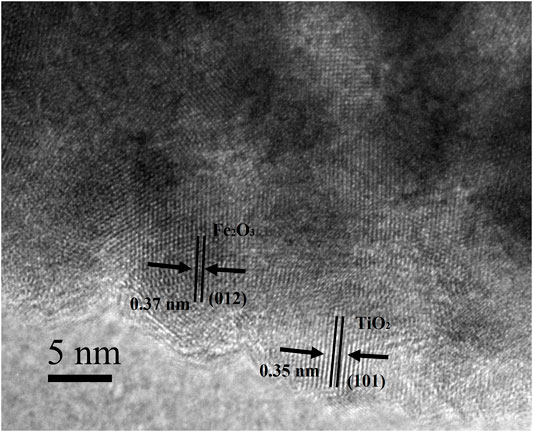
FIGURE 7. HRTEM image of FT-1h α-Fe2O3@TiO2.
The chemical composition and crystal phase of the samples were investigated by XRD analysis. Figure 8 shows that the diffraction peak 2θ = 25.28°, 37.8°, 48.05°, 55.06°, and 62.69° corresponds to the (101), (004), (200), (211), and (204) planes of TiO2, which is consistent with PDF#21-1272 (the diffraction peak of anatase). Samples FT-0.5h, FT-1h, FT-2h, and FT-4h present the characteristic peaks of Fe2O3 and TiO2, which expressed that TiO2 coating is successfully combined with α-Fe2O3. Furthermore, it can be observed that the intensity of the characteristic peak at 24.1° of α-Fe2O3 decreases, and the characteristic peak at 25.3° of TiO2 increases with an increasing etching time. In addition, no additional peaks were observed, suggesting high purity of the samples, which shows good agreement with the results of XPS spectra (Figure 9).
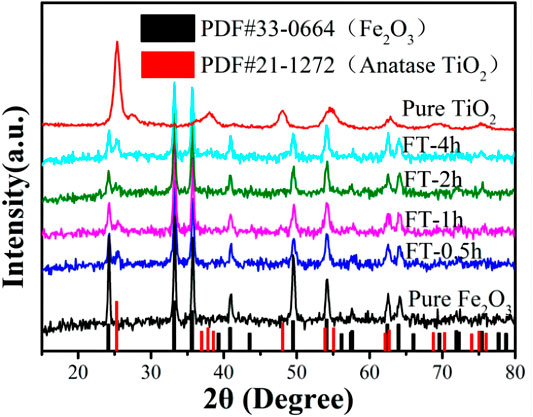
FIGURE 8. XRD patterns of pure Fe2O3, FT-0.5h, FT-1h, FT-2h, FT-4h, and FT-12h (pure TiO2).
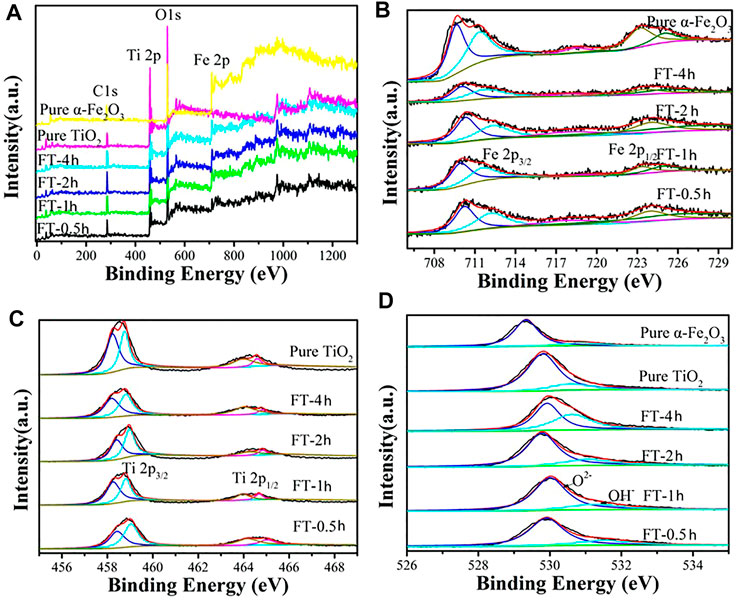
FIGURE 9. XPS spectra of oxalic acid-treated α-Fe2O3 coated with TiO2 and etched for different periods of time [FT-0.5h, FT-1h, FT-2h, FT-4h, and FT-12h (pure TiO2)]: (A) survey, (B) Fe2p, (C) Ti2p, and (D) O1s.
The XPS characterization was conducted to examine the chemical composition of samples (FT-0.5h, FT-1h, FT-2h, FT-4h, and FT-12h (pure TiO2)). The complete survey spectrum (Figure 9A) of α-Fe2O3@TiO2 samples (FT-0.5h, FT-1h, FT-2h, and FT-4h) reveal the existence of Ti, Fe, and O elements. For the C 1s XPS spectrum, the peak at 285.00 eV is attributed to adventitious carbon (Zhong et al., 2017; Yang et al., 2019). The high-resolution XPS spectrum of Fe 2p was composed of two distinct peaks at 710.90 and 724.40 eV (Figure 9B), which correspond to Fe 2p2/3 and 2p1/2 with satellite lines. The spectrum is consistent with the characteristic of Fe3+ α-Fe2O3 (Zhong et al., 2017; Yang et al., 2019). In the spectrum of Ti 2p (Figure 9C), the Ti 2p3/2 and Ti 2p1/2 peaks were located at binding energies of 458.70 and 464.65 eV, respectively, which is in agreement with the value of Ti4+ in the TiO2 lattice (Zhong et al., 2017; Zhao et al., 2018). The spectrum of the O1s core level is shown in Figure 9D, where binding energy peaks at 531.80 eV originate from bonded hydroxyl groups (Yang et al., 2019). For the broad peak centered at 530.00 eV, it is attributed to metal-bonding in both oxides (Zhao et al., 2018; Yang et al., 2019).
The texture characteristic of α-Fe2O3@TiO2 was further confirmed by N2 adsorption/desorption isotherm, as shown in Figure 10. It can be observed from Figure 10A that the specific surface area of pure α-Fe2O3 was very small, only 2.07 m3 g−1. After coating with TiO2, the specific surface area increased to approximately 30 m3 g−1, and that is because pure α-Fe2O3 is smoother and denser than TiO2, which can be seen from Figure 4. The surface bulge of TiO2 was more obvious than that of pure α-Fe2O3. After etching for 0.5, 1, 2, 4, and 12 h (pure TiO2), more pores formed. The specific surface area increased to 32.1, 34.39, 36.96, 43.845, and 131.91 m3 g−1. The isotherms were identified as IUPAC type IV, which is characteristic of mesoporous materials. The pore size distribution obtained from the isotherm indicates a number of pores 4–8 nm in the samples (Figure 10B). With increasing etching time, the pore volume increases. A structure with abundant mesopores is likely to buffer the volume expansion and allow the penetration of electrolyte for complete contact with the active material, thus playing an important role in improving the electrochemical properties of α-Fe2O3@TiO2.
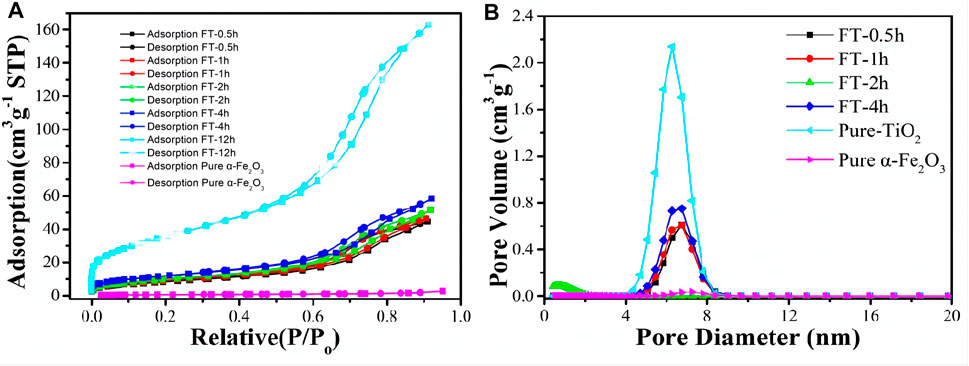
FIGURE 10. BET figures (A) and pore size distribution (B) of oxalic acid-treated α-Fe2O3 coated with TiO2 and etched for different periods of time [pure α-Fe2O3, FT-0.5h, FT-1h, FT-2h, FT-4h, and FT-12h (pure TiO2)].
Cyclic Voltammetry and Galvanostatic Cycling
Electrochemical performances of α-Fe2O3@TiO2 (FT-1h) were investigated as anode materials for LIBs to demonstrate the effectiveness in improving lithium storage. Figure 11A shows the first four CV curves of the FT-1h sample between 0.01 and 3 V at a scan rate of 0.1 mV−1. It can be observed that the sample has a reduction peak and an oxidation peak at a potential of 1.73/2.13 V, which may be attributed to the de/insertion of lithium ions from TiO2, as shown in Eq. 2. There are two oxidation peaks at potentials of 0.92 and 1.12 V, which correspond to the lithium reaction of Fe2O3, respectively, as shown in Eq. 3 (Fu et al., 2015).
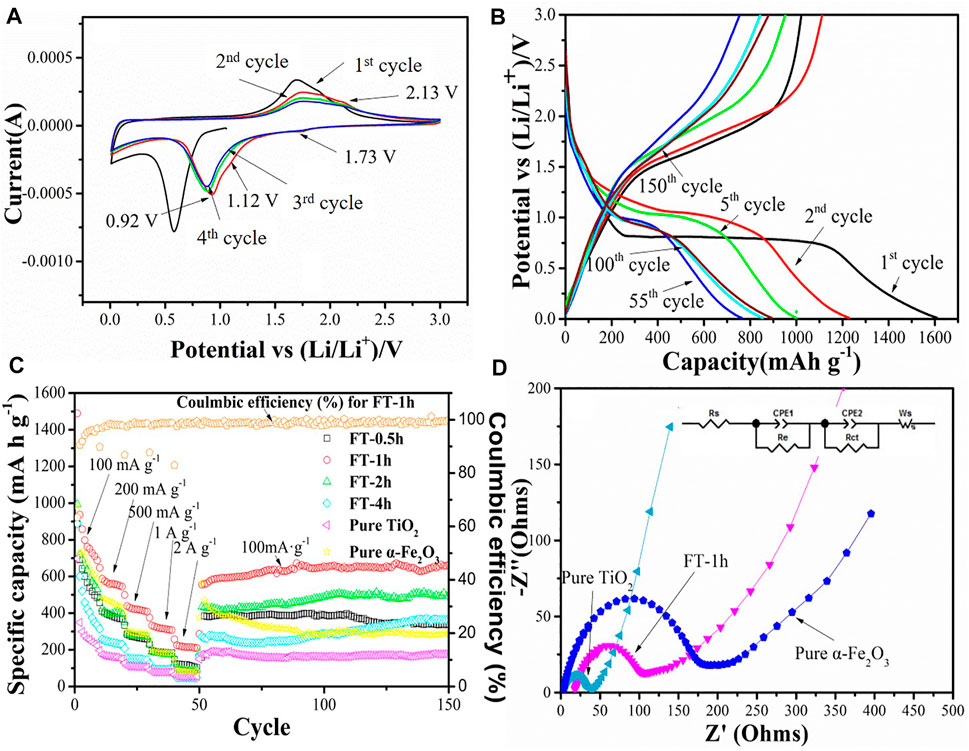
FIGURE 11. Electrochemical performance test diagram of different samples: (A) Cyclic voltammetry curve of the FT-1h sample in the voltage range of 0.01–3 V and a sweep rate of 0.1 mV s−1. (B) Charge–discharge test diagram of the FT-1h sample at a current density of 100 mA g−1. (C) Rate performance of oxalic acid-treated α-Fe2O3 coated with TiO2 and etched for different periods of time [FT-0.5h, FT-1h, FT-2h, FT-4h, and FT-12h (pure TiO2)], and the charge–discharge tests at a current density of 100 mA g−1 for each cell after the rate performance test. (D) EIS resistance test drawings of pure α-Fe2O3, pure TiO2, and FT-1h.
In addition, the oxidation peak between 1.5 and 2.0 V may correspond to Fe0 being reoxidized to Fe2O3, as shown in Eq. 4 (Fu et al., 2015).
After the second charge–discharge cycle, the peak position slightly shifts, and the peak strength slightly weakens, which may be attributed to the polarization of the anode material and the formation of an SEI film during the charge–discharge process (Fu et al., 2015). It can be clearly observed that the curves of the fourth charge–discharge cycle and the third charge–discharge cycle coincide well, indicating that the FT-1h sample has good cycling stability.
Charge and discharge curves of the sample FT-1h with a voltage of 0.01–3 V are shown in Figure 11B. According to the previous analysis, a wide slope from 1.75 to 0.8 V is attributed to the Li+ intercalation into the crystal structure of α-Fe2O3 and the phase transformation from hexagonal to cubic Li2Fe2O3 (Qin et al., 2018). Last, an obvious plateau at 0.8 V is ascribed to the reduction from Fe2+ into Fe0, and the formation of amorphous Li2O and an SEI layer (Zhu et al., 2020). After the first charge and discharge cycle, the discharge/charge specific capacities of the FT-1h sample are 1,609.3 mA h g−1 and 1,021.6 mA h g−1, respectively. In the second process, a plateau at 1.0 V is observed, which agrees well with Eq. 3. Furthermore, the discharge specific capacity is reduced to 1,228.6 mA h g−1, and the Coulombic efficiency is 99.1%. The fifth circle is similar to the second, except the length of the plateau, which is shorter than the one in the first circle, and this is due to the irreversible capacity loss derived from the formation amorphous Li2O (Yang et al., 2019). The discharge specific capacity is 999.4 mA h g−1 after the fifth cycle. The 55th, 100th, and 150th curves express the similar circle curves, whose plateau is at 0.9 V, which is consistent with Eq. 3. After 150 charge–discharge cycles at a current density of 100 mA g−1, the reversible capacity remains at 893.7 mA h g−1, and the Coulombic efficiency is 98.4%.
Rate measurements of pure α-Fe2O3, oxalic acid-treated α-Fe2O3 coated with TiO2 and etched for different periods of time (FT-0.5h, FT-1h, FT-2h, FT-4h, and FT-12h (pure TiO2), and the charge–discharge tests at a current density of 100 mA g−1 for each cell after the rate performance test are shown in Figure 11C. The reversible capacities of FT-1h at current densities of 100 mA g−1, 200 mA g−1, 500 mA g−1, 1 A g−1, and 2 A g−1 reach 1,489.3, 586.8, 438.7, 332.7, and 224.5 mA h g−1, respectively. When the current density is returned to 100 mA g−1, the reversible capacity is still maintained at 555.5 mA h g−1. After 100 charge–discharge cycles at a current density of 100 mA g−1, the reversible capacity remains at 682.0 mA h g−1, and the Coulombic efficiency is 99.7%. During the long cycle, the Coulombic efficiency is maintained above 98%. The capacity decreases at the beginning and continuously increases during the latter long term cycle test. It is supposed to be the grain boundaries of iron metal and Li2O formed in the electrochemical process (Eq. 4), which contributes to the extra energy storage of the composite (Li S. et al., 2019). This phenomenon is common for most MOx (M = Fe, Co, and Ni) attributed to the activation of the materials (Kaprans et al., 2018). Comparing the different etching times, it can be found that the battery performances of the etched samples are higher than that of pure α-Fe2O3 and TiO2, indicating that the different degrees of buffer chambers can relieve, to a certain extent, the volume expansion of α-Fe2O3 during the discharge/charge process. Furthermore, the SEM images of pure Fe2O3 and FT-1h after 100 charge–discharge cycles are shown in Supplementary Figure S3. Fe2O3 morphology gets damaged severely if TiO2 is not protected. On the contrary, sample FT-1h maintained the original morphology, which proved again that TiO2 can effectively inhibit the volume expansion. Among the etched samples, FT-1h possesses the best performance. Figure 11C shows that FT-1h still has good cycling performance after the large rate performance test, while the reversible capacities of pure α-Fe2O3 and pure TiO2 are low. The as-prepared α-Fe2O3@TiO2 in this work shows superior cyclability and capacity compared with others summarized in Table 1.
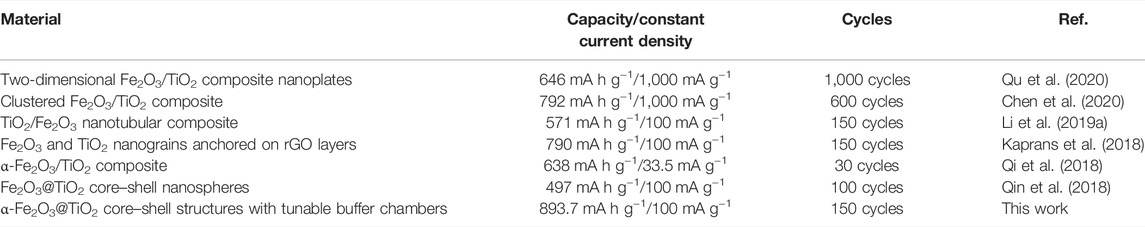
TABLE 1. List of the reported works on Fe2O3@TiO2 as anodes for lithium-ion batteries.
EIS resistance tests are conducted for pure α-Fe2O3, pure TiO2, and FT-1h, and the Nyquist plots of FT-1h, pure α-Fe2O3, and pure TiO2 are shown in Figure 11D. All of them exhibit a similar profile. There is a depressed semicircle in the high-frequency region and an inclined line in the low-frequency region. The diameter of the semicircle in the high-frequency region of each cell is related to the tenable resistance of the electrolyte (Re), SEI layer (Rs), and charge transfer resistance (Rct) (Wang et al., 2020). Rct is associated with the transfer of electrons and Li+. The inclined line in the low-frequency region represents the Warburg impedance (Zw), which is derived from lithium-ion diffusion in electrode materials. A semicircle with a larger diameter in the high-frequency region represents a larger Rct (Yang et al., 2019). From Figure 11D, it can be found that the impedance of α-Fe2O3 alone is relatively large, and the impedance decreases after coating with TiO2, indicating that the electrical conductivity of the electrode is improved by forming a composite material. In addition, the higher slope of FT-1h compared with pure α-Fe2O3 in the low-frequency region is evidence of a stronger interaction between Li ions and FT-1h.
Conclusion
In summary, the volume expansion rates of α-Fe2O3 and TiO2 during Li-ion insertion were estimated through DFT calculations. The expansion rate of α-Fe2O3 with Li-ion insertion is clearly higher than that of TiO2, indicating that TiO2 could effectively alleviate crystal expansion when used in Li-ion batteries. Hence, to buffer the bulk expansion of α-Fe2O3 that occurs during the discharge/charge process, cubic α-Fe2O3 was coated with a TiO2 layer (α-Fe2O3@TiO2) using the hydrothermal method, and then a buffer chamber was deliberately designed by immersing in hydrochloric acid for etching. It is found that α-Fe2O3@TiO2 with a buffer chamber structure could effectively relieve the volume expansion. Due to these structural advantages, the optimized FT-1h sample exhibits high reversible capacities of 1,489.3, 586.8, 438.7, 332.7, and 224.5 mA h g−1 at 100 mA g−1, 200 mA g−1, 500 mA g−1, 1 A g−1, and 2 A g−1, respectively. When the current density is returned to 100 mA g−1, the reversible capacity remains unchanged at 555.5 mA h g−1. Thanks to the buffer chambers, FT-1h demonstrates good cycling performance. After 150 charge–discharge cycles at a current density of 100 mA g−1, the reversible capacity is 893.7 mA h g−1, the Coulombic efficiency is 98.4%, and the morphology is in a good condition. Furthermore, the results obtained in this study provide new insights into the synthesis of metal oxide-based LIB anode materials with well-designed structures.
Data Availability Statement
The original contributions presented in the study are included in the article/Supplementary Material, and further inquiries can be directed to the corresponding authors.
Author Contributions
BW, BN, and DW designed the calculations and experiments. HR and CM performed the material synthesis, characterization, and battery tests. CP and WP analyzed the data and drafted the manuscript. XC, LZ, JL, and XS conducted the calculation. YS and RT made the major revision. All authors participated in discussions.
Funding
This work was financially supported by the National Nature Science Foundation of China (No. U1904198), the Science and Technology Department of Henan Province (No. 202102210001), the Natural Science Foundation of Henan Province (No. 202300410015), the Key Scientific Research Project of Higher Education of Henan Province (No. 20B140012), and the Ninth Group of Key Disciplines in Henan Province (No. 2018119).
Conflict of Interest
The authors declare that the research was conducted in the absence of any commercial or financial relationships that could be construed as a potential conflict of interest.
Publisher’s Note
All claims expressed in this article are solely those of the authors and do not necessarily represent those of their affiliated organizations, or those of the publisher, the editors, and the reviewers. Any product that may be evaluated in this article, or claim that may be made by its manufacturer, is not guaranteed or endorsed by the publisher.
Supplementary Material
The Supplementary Material for this article can be found online at: https://www.frontiersin.org/articles/10.3389/fchem.2022.866369/full#supplementary-material
Supplementary Figure S1 | Unit cells of α-Fe2O3 (A) and TiO2 (B).
Supplementary Figure S2 | XRD of α-Fe2O3.
Supplementary Figure S3 | SEM images of pure Fe2O3 (A,B) and FT-1h (C,D) after 100 charge–discharge cycles.
Supplementary Table S1 | Data compared with other theoretical and experimental data for α-Fe2O3 and TiO2.
Supplementary Table S2 | Volume (V) and expansion rate (Er) of the one, two, three, four, and five and one, second, and three Li ions inserted in the cell at different sites of α-Fe2O3 and TiO2.,
Supplementary Table S3 | Electronic population of Fe-O and Ti-O bonds for α-Fe2O3 and TiO2 with and without Li inserted at symmetrical sites.
Supplementary Table S4 | Average core–shell size of oxalic acid-treated α-Fe2O3 coated with TiO2 and etched for different periods of time (FT-0.5h (A-C), FT-2h (D-F), FT-4h (G-I), and FT-12h (J-L) (pure TiO2).
References
Aouadi, S. M. (2006). Structural and Mechanical Properties of TaZrN Films: Experimental and Ab Initio Studies. J. Appl. Phys. 99, 053507. doi:10.1063/1.2178394
Arlt, T., Bermejo, M., Blanco, M. A., Gerward, L., Jiang, J. Z., Staun Olsen, J., et al. (2000). High-pressure Polymorphs of anataseTiO2. Phys. Rev. B 61, 14414–14419. doi:10.1103/physrevb.61.14414
Chen, Y., Liang, J., Tian, Q., Zhang, W., and Sui, Z. (2020). Facile Construction of Clustered Fe2O3/TiO2 Composite for Improved Lithium Storage Performance. Synth. Met. 263, 116353. doi:10.1016/j.synthmet.2020.116353
Duffner, F., Kronemeyer, N., Tübke, J., Leker, J., Winter, M., and Schmuch, R. (2021). Post-lithium-ion Battery Cell Production and its Compatibility with Lithium-Ion Cell Production Infrastructure. Nat. Energ. 6, 123–134. doi:10.1038/s41560-020-00748-8
Fan, Y., Chen, X., Zhang, K., Rong, J., and Yu, X. (2021). A Coordinated Regulation Strategy to Improve Electronic Conductivity and Li-Ion Transport for TiO2 Lithium Battery Anode Materials. J. Alloys Compd. 860, 158282. doi:10.1016/j.jallcom.2020.158282
Finger, L. W., and Hazen, R. M. (1980). Crystal Structure and Isothermal Compression of Fe2O3, Cr2O3, and V2O3 to 50 Kbars. J. Appl. Phys. 51, 5362. doi:10.1063/1.327451
Fu, Y., Wei, Q., Wang, X., Shu, H., Yang, X., and Sun, S. (2015). Porous Hollow α-Fe2O3@TiO2 Core-Shell Nanospheres for superior Lithium/sodium Storage Capability. J. Mater. Chem. A. 3, 13807–13818. doi:10.1039/c5ta02994e
Gao, Y., Wang, C., Hu, P., He, F., Wu, M., and Zhang, H. (2019). Carbon-incorporated, Nitrogen-Doped branch-like TiO2 Nanostructure towards superior Lithium Storage Performance. J. Alloys Compd. 787, 944–951. doi:10.1016/j.jallcom.2019.02.169
Guo, M., and Li, H. (2021). The Hydrolyzed Mil-88B(Fe) with Improved Surface Area for High-Capacity Lithium Ion Battery. Front. Energ. Res. 9, 781008. doi:10.3389/fenrg.2021.781008
Hohenberg, P. (1964). Inhomogeneous Electron Gas. Phys. Rev. 136, B864–B871. doi:10.1103/physrev.136.b864
Huo, J., Ren, Y., Xue, Y., Liu, Y., and Guo, S. (2021). Sulfur/nitrogen Dual-Doped Three-Dimensional Reduced Graphene Oxide Modified with Mesoporous TiO2 Nanoparticles for Promising Lithium-Ion Battery Anodes. J. Alloys Compd. 868, 159183. doi:10.1016/j.jallcom.2021.159183
Jenness, G. R., Seiter, J., and Shukla, M. K. (2018). DFT Investigation on the Adsorption of Munition Compounds on α-Fe2O3: Similarity and Differences with α-Al2O3. Phys. Chem. Chem. Phys. 20, 18850–18861. doi:10.1039/c8cp02590h
Jin, L., Yuan, J., Shellikeri, A., Naderi, R., Qin, N., Lu, Y., et al. (2021). An Overview on Design Parameters of Practical Lithium‐Ion Capacitors. Batteries & Supercaps 4, 749–757. doi:10.1002/batt.202000296
Kaprans, K., Mateuss, J., Dorondo, A., Bajars, G., Kucinskis, G., Lesnicenoks, P., et al. (2018). Electrophoretically Deposited α-Fe2O3 and TiO2 Composite Anchored on rGO with Excellent Cycle Performance as Anode for Lithium Ion Batteries. Solid State Ionics 319, 1–6. doi:10.1016/j.ssi.2018.01.042
Kim, T., Song, W., Son, D.-Y., Ono, L. K., and Qi, Y. (2019). Lithium-ion Batteries: Outlook on Present, Future, and Hybridized Technologies. J. Mater. Chem. A. 7, 2942–2964. doi:10.1039/c8ta10513h
Kohn, W., and Sham, L. J. (1965). Self-Consistent Equations Including Exchange and Correlation Effects. Phys. Rev. 140, A1133–A1138. doi:10.1103/physrev.140.a1133
Kong, D., Cheng, C., Wang, Y., Liu, B., Huang, Z., and Yang, H. Y. (2016). Seed-assisted Growth of α-Fe2O3 Nanorod Arrays on Reduced Graphene Oxide: a superior Anode for High-Performance Li-Ion and Na-Ion Batteries. J. Mater. Chem. A. 4, 11800–11811. doi:10.1039/c6ta04370d
Li, H., Hu, Z., Xia, Q., Zhang, H., Li, Z., Wang, H., et al. (2021a). Operando Magnetometry Probing the Charge Storage Mechanism of CoO Lithium‐Ion Batteries. Adv. Mater. 33, 2006629. doi:10.1002/adma.202006629
Li, H., Wang, Y., Chen, H., Niu, B., Zhang, W., and Wu, D. (2021). Synergistic Mediation of Polysulfide Immobilization and Conversion by a Catalytic and Dual-Adsorptive System for High Performance Lithium-Sulfur Batteries. Chem. Eng. J. 406, 126802. doi:10.1016/j.cej.2020.126802
Li, H., Wu, L.-J., Zhang, S.-G., Yao, C., Chao, C.-Y., Yue, H.-W., et al. (2020). Facile Synthesis of Mesoporous One-Dimensional Fe2O3 Nanowires as Anode for Lithium Ion Batteries. J. Alloys Compd. 832, 155008. doi:10.1016/j.jallcom.2020.155008
Li, J., Wang, N., Deng, J., Qian, W., and Chu, W. (2018). Flexible Metal-Templated Fabrication of Mesoporous Onion-like Carbon and Fe2O3@N-Doped Carbon Foam for Electrochemical Energy Storage. J. Mater. Chem. A. 6, 13012–13020. doi:10.1039/c8ta02417k
Li, Q., Li, H., Xia, Q., Hu, Z., Zhu, Y., Yan, S., et al. (2021b). Extra Storage Capacity in Transition Metal Oxide Lithium-Ion Batteries Revealed by In Situ Magnetometry. Nat. Mater. 20, 76–83. doi:10.1038/s41563-020-0756-y
Li, S., Zhang, Y., and Huang, J. (2019a). Three-dimensional TiO2 Nanotubes Immobilized with Fe2O3 Nanoparticles as an Anode Material for Lithium-Ion Batteries. J. Alloys Compd. 783, 793–800. doi:10.1016/j.jallcom.2018.12.371
Li, Z., Mao, Y., Tian, Q., Zhang, W., and Yang, L. (2019b). Extremely Facile Preparation of High-Performance Fe2O3 Anode for Lithium-Ion Batteries. J. Alloys Compd. 784, 125–133. doi:10.1016/j.jallcom.2018.12.392
Liang, Y., Xiong, X., Xu, Z., Xia, Q., Wan, L., Liu, R., et al. (2020). Ultrathin 2D Mesoporous TiO2/rGO Heterostructure for High-Performance Lithium Storage. Small 16, e2000030. doi:10.1002/smll.202000030
Monkhorst, H. J., and Pack, J. D. (1976). Special Points for Brillouin-Zone Integrations. Phys. Rev. B 13, 5188–5192. doi:10.1103/physrevb.13.5188
Narsimulu, D., Nagaraju, G., Sekhar, S. C., Ramulu, B., and Yu, J. S. (2019). Designed Lamination of Binder-free Flexible Iron Oxide/carbon Cloth as High Capacity and Stable Anode Material for Lithium-Ion Batteries. Appl. Surf. Sci. 497, 143795. doi:10.1016/j.apsusc.2019.143795
Ni, L., Wang, R., Fu, Y., Wang, H., Liu, W., Zhu, L., et al. (2019). Nanoengineering Mesoporous Graphene-Based Anatase/bronze TiO2 Heterostructures for Pseudocapacitance-Enhanced Lithium-Ion Batteries. J. Alloys Compd. 790, 683–692. doi:10.1016/j.jallcom.2019.03.237
Nong, S., Dong, C., Wang, Y., and Huang, F. (2020). Constructing Porous TiO2 Crystals by an Etching Process for Long-Life Lithium Ion Batteries. Nanoscale 12, 18429–18436. doi:10.1039/d0nr04861e
Perdew, J. P., Burke, K., and Ernzerhof, M. (1996). Generalized Gradient Approximation Made Simple. Phys. Rev. Lett. 77, 3865–3868. doi:10.1103/physrevlett.77.3865
Perdew, J. P., Burke, K., and Ernzerhof, M. (1998). Perdew, Burke, and Ernzerhof Reply: Phys. Rev. Lett. 80, 891. doi:10.1103/physrevlett.80.891
Qi, C., Liu, C., Meng, K., Yu, X., Zhang, Y., Liu, J., et al. (2018). Enhanced Performance of TiO2/α-Fe2O3 Nanostructure as Anode Material for Lithium-Ion Batteries. Int. J. Electrochem. Sci. 13, 265–274. doi:10.20964/2018.01.34
Qin, G., Zeng, M., Wu, X., Wen, J., and Li, J. (2018). Fabrication of Fe2O3@TiO2 Core-Shell Nanospheres as Anode Materials for Lithium-Ion Batteries. J. Mater. Sci. Mater. Electron. 29, 12944–12950. doi:10.1007/s10854-018-9414-4
Qu, D., Sun, Z., Gan, S., Gao, L., Song, Z., Kong, H., et al. (2020). Two‐dimensional Fe 2 O 3/TiO 2 Composite Nanoplates with Improved Lithium Storage Properties as Anodic Materials for Lithium‐Ion Full Cells. ChemElectroChem 7, 4963–4970. doi:10.1002/celc.202001143
Shi, T., Duan, Y., Lv, K., Hu, Z., Li, Q., Li, M., et al. (2018). Photocatalytic Oxidation of Acetone over High Thermally Stable TiO2 Nanosheets with Exposed (001) Facets. Front. Chem. 6, 175. doi:10.3389/fchem.2018.00175
Wang, H., Wu, D., Wu, W., Wang, D., Gao, Z., Xu, F., et al. (2019a). Preparation of TiO2 Microspheres with Tunable Pore and Chamber Size for Fast Gaseous Diffusion in Photoreduction of CO2 under Simulated Sunlight. J. Colloid Interf. Sci. 539, 194–202. doi:10.1016/j.jcis.2018.12.022
Wang, H., Wu, D., Yang, C., Lu, H., Gao, Z., Xu, F., et al. (2019b). Multi-functional Amorphous TiO2 Layer on ZIF-67 for Enhanced CO2 Photoreduction Performances under Visible Light. J. CO2 Utilization 34, 411–421. doi:10.1016/j.jcou.2019.07.011
Wang, H., Zhao, L., Zhang, H., Liu, Y., Yang, L., Li, F., et al. (2022). Revealing the Multiple Cathodic and Anodic Involved Charge Storage Mechanism in an FeSe2 Cathode for Aluminium-Ion Batteries by In Situ Magnetometry. Energy Environ. Sci. 15, 311–319. doi:10.1039/d1ee03070a
Wang, L., Wu, D., Guo, Z., Yan, J., Hu, Y., Chang, Z., et al. (2018a). Ultra-thin TiO2 Sheets with Rich Surface Disorders for Enhanced Photocatalytic Performance under Simulated Sunlight. J. Alloys Compd. 745, 26–32. doi:10.1016/j.jallcom.2018.02.070
Wang, T., Guo, W., Wang, G., Wang, H., Bai, J., and Wang, B. (2020). Highly Dispersed FeSe2 Nanoparticles in Porous Carbon Nanofibers as Advanced Anodes for Sodium and Potassium Ion Batteries. J. Alloys Compd. 834, 155265. doi:10.1016/j.jallcom.2020.155265
Wang, Z., Zhang, Z., Xia, J., Wang, W., Sun, S., Liu, L., et al. (2018b). Fe2O3@C Core@shell Nanotubes: Porous Fe2O3 Nanotubes Derived from MIL-88A as Cores and Carbon as Shells for High Power Lithium Ion Batteries. J. Alloys Compd. 769, 969–976. doi:10.1016/j.jallcom.2018.08.081
Wu, D., Wang, X., An, Y., Song, X., Liu, N., Wang, H., et al. (2017). Hierarchical TiO2 Structures Derived from F− Mediated Oriented Assembly as Triple-Functional Photoanode Material for Improved Performances in CdS/CdSe Sensitized Solar Cells. Electrochimica Acta 248, 79–89. doi:10.1016/j.electacta.2017.06.150
Xu, F., Mei, J., Zheng, M., Bai, D., Wu, D., Gao, Z., et al. (2017). Au Nanoparticles Modified Branched TiO2 Nanorod Array Arranged with Ultrathin Nanorods for Enhanced Photoelectrochemical Water Splitting. J. Alloys Compd. 693, 1124–1132. doi:10.1016/j.jallcom.2016.09.273
Yan, X., Jiang, F., Sun, X., Du, R., Zhang, M., Kang, L., et al. (2020). A Simple, Low-Cost and Scale-Up Synthesis Strategy of Spherical-graphite/Fe2O3 Composites as High-Performance Anode Materials for Half/full Lithium Ion Batteries. J. Alloys Compd. 822, 153719. doi:10.1016/j.jallcom.2020.153719
Yang, Y., Liu, Q., Cao, M., Ju, Q., Wang, H., Fu, R., et al. (2019). Enhanced Electrochemical Performance of α-Fe2O3 Grains Grafted onto TiO2-Carbon Nanofibers via a Vapor-Solid Reaction as Anode Materials for Li-Ion Batteries. Appl. Surf. Sci. 463, 322–330. doi:10.1016/j.apsusc.2018.08.171
Yuan, Y. F., Chen, F., Ye, L. W., Cai, G. S., Zhu, M., Yin, S. M., et al. (2019). Construction of Co3O4@TiO2 Heterogeneous Mesoporous Hollow Nanocage-In-Nanocage from Metal-Organic Frameworks with Enhanced Lithium Storage Properties. J. Alloys Compd. 790, 814–821. doi:10.1016/j.jallcom.2019.03.255
Yuan, Y. F., Chen, Q., Zhu, M., Cai, G. S., and Guo, S. Y. (2021). Nano Tube-In-Tube CNT@void@TiO2@C with Excellent Ultrahigh Rate Capability and Long Cycling Stability for Lithium Ion Storage. J. Alloys Compd. 851, 156795. doi:10.1016/j.jallcom.2020.156795
Zhang, G., Shi, Y., Wang, H., Jiang, L., Yu, X., Jing, S., et al. (2019). A Facile Route to Achieve Ultrafine Fe2O3 Nanorods Anchored on Graphene Oxide for Application in Lithium-Ion Battery. J. Power Sourc. 416, 118–124. doi:10.1016/j.jpowsour.2019.01.091
Zhang, H.-X., Zhu, Y. F., and Zhao, M. (2017). Interface Charge Transfer and Enhanced Visible Light Response of Graphene/anatase TiO 2 (110) Systems with and without Oxygen Vacancy: A DFT+U Calculation. Appl. Surf. Sci. 420, 105–109. doi:10.1016/j.apsusc.2017.05.142
Zhao, W., Fei, P., Zhang, X., Zhang, Y., Qin, C., and Wang, Z. (2018). Porous TiO2/Fe2O3 Nanoplate Composites Prepared by De-alloying Method for Li-Ion Batteries. Mater. Lett. 211, 254–257. doi:10.1016/j.matlet.2017.10.019
Zhong, Y., Ma, Y., Guo, Q., Liu, J., Wang, Y., Yang, M., et al. (2017). Controllable Synthesis of TiO2@Fe2O3 Core-Shell Nanotube Arrays with Double-Wall Coating as Superb Lithium-Ion Battery Anodes. Sci. Rep. 7, 40927. doi:10.1038/srep40927
Keywords: α-Fe2O3@TiO2, core-shell structures, tunable buffer chambers, cycle stability, lithium storage
Citation: Pian C, Peng W, Ren H, Ma C, Su Y, Ti R, Chen X, Zhu L, Liu J, Sun X, Wang B, Niu B and Wu D (2022) Robust α-Fe2O3@TiO2 Core–Shell Structures With Tunable Buffer Chambers for High-Performance Lithium Storage. Front. Chem. 10:866369. doi: 10.3389/fchem.2022.866369
Received: 31 January 2022; Accepted: 23 February 2022;
Published: 07 April 2022.
Edited by:
Kewei Shu, Shaanxi University of Science and Technology, ChinaReviewed by:
Hongsen Li, Qingdao University, ChinaYuxiang Hu, The University of Queensland, Australia
Copyright © 2022 Pian, Peng, Ren, Ma, Su, Ti, Chen, Zhu, Liu, Sun, Wang, Niu and Wu. This is an open-access article distributed under the terms of the Creative Commons Attribution License (CC BY). The use, distribution or reproduction in other forums is permitted, provided the original author(s) and the copyright owner(s) are credited and that the original publication in this journal is cited, in accordance with accepted academic practice. No use, distribution or reproduction is permitted which does not comply with these terms.
*Correspondence: Bin Wang, d2FuZ2JpbjIwMTNAeHh1LmVkdS5jbg==; Bingxuan Niu, bmJ4QHh4bXUuZWR1LmNu; Dapeng Wu, ZHBlbmd3dUAxMjYuY29t