 Sıdıka Çetinkaya
 Gofur Khamidov1
 Leonardo Palmisano
 Sedat Yurdakal
- 1Kimya Bölümü, Fen-Edebiyat Fakültesi, Afyon Kocatepe Üniversitesi, Ahmet Necdet Sezer Kampüsü, Afyonkarahisar, Turkey
- 2Biyomedikal Mühendisliği Bölümü, Mühendislik Fakültesi, Afyon Kocatepe Üniversitesi, Ahmet Necdet Sezer Kampüsü, Afyonkarahisar, Turkey
- 3Schiavello-Grillone Photocatalysis Group, Università degli Studi di Palermo, Dipartimento di Ingegneria (DI), Palermo, Italy
Nanotube/nanowire-structured TiO2 was formed on the Ti surface by an anodic oxidation method performed at different potential values (50 or 60 V) and for different times (3 or 5 h). The TiO2 photocatalysts were taken in powder form using the ultrasonic treatment from the Ti electrodes, calcined at different temperatures, and characterized by XRD and SEM techniques, and BET surface area analyses. Both the crystallinity and the size of the primary TiO2 particles increased by increasing the heat treatment temperature. While all the photocatalysts heat treated up to 500°C were only in the anatase phase, the particles heat-treated at 700°C consisted of both anatase and rutile phases. The BET specific surface area of the samples decreased drastically after heat treatment of 700°C because of partial sinterization. SEM analyses indicated that the prepared materials were structured in both nanotubes and nanowires. They were tested as photocatalysts for the selective oxidation of glycerol and 3-pyridinemethanol under UVA irradiation in water at room temperature and ambient pressure. Glyceraldehyde, 1,3-dihydroxyacetone, and formic acid were determined as products in glycerol oxidation, while the products of 3-pyridinemethanol oxidation were 3-pyridinemethanal and vitamin B3. Non-nanotube/nanowire-structured commercial (Degussa P25 and Merck TiO2) photocatalysts were used for the sake of comparison. Low selectivity values towards the products obtained by partial oxidation were determined for glycerol. On the contrary, higher selectivity values towards the products were obtained (total 3-pyridinemethanal and vitamin B3 selectivity up to ca. 90%) for the photocatalytic oxidation of 3-pyridinemethanol. TiO2 photocatalysts must be highly crystalline (calcined at 700°C) for effective oxidation of glycerol, while for the selective oxidation of 3-pyridinemethanol it was not necessary to obtain a high crystallinity, and the optimal heat treatment temperature was 250°C. Glycerol and its oxidation products could more easily desorb from highly crystalline and less hydroxylated surfaces, which would justifies their higher activity. The prepared photocatalysts showed lower activity than Degussa P25, but a greater selectivity towards the products found.
Introduction
Biodiesel is produced by the acid- or base-catalyzed transesterification of triglycerides. In biodiesel production, approximately 110 kg of crude glycerol is formed as an intermediate product from 1 ton of biodiesel (Behr et al., 2008). However, as biodiesel production increases, so does the production of its main by-product, glycerol (1,2,3-propantriol) (Yang et al., 2012).
The significant increase in biodiesel production in recent years has led to a large surplus of glycerol in the market. Therefore, it is essential to develop active catalysts to convert glycerol into various high added value products (Dodekatos et al., 2018a; Dodekatos et al., 2018b). According to the statistical estimates made by the United Nations Food and Agriculture Organization (OECD-FAO), until 2025, biodiesel production will continue to increase, and this means that there will be always an excess of glycerol in the coming years (Dodekatos et al., 2018a). Furthermore, due to its low price and low demand, glycerol is sometimes disposed of as waste, thus, posing a serious threat to the environment (Gholami et al., 2014).
Selective photocatalytic oxidation reactions that are conducted under environmentally friendly conditions and with acceptable costs, appear promising to produce valuable chemicals for use in the chemical and pharmaceutical industries (Colmenares and Luque 2014). Some research groups have published studies on the oxidation of glycerol with photocatalytic methods (Augugliaro et al., 2010; Maldotti and Molinari 2011; Dodekatos et al., 2018a). Compounds of commercial importance can be obtained due to partial oxidation of glycerol (Dodekatos et al., 2018a; Dodekatos et al., 2018b). 1,3-Dihydroxyacetone is one of them and it is used mainly as a tanning agent in the cosmetic industry (Criminna et al., 2006; Behr et al., 2008; Bagheri et al., 2015) and as starting material for the synthesis of many compounds in organic chemistry. Another important molecule is glyceraldehyde (GAD), an intermediate of the carbohydrate metabolism and a standard for chiral molecules (D- or L-) (Behr et al., 2008). Formic acid is also obtained from glycerol and is used in the leather industry in Asia, in agriculture in Europe (Dodekatos et al., 2018a) and its salts in fuel cells.
Photocatalytic oxidation of 3-pyridinemethanol was also carried out in this work. Vitamin B3 (pyridine-3-carboxylic acid), one of its main oxidation products, is actively used to prevent alcoholism and pellagra disease, and it is produced in high amounts worldwide (Alfe et al., 2014). Only a few research papers have been published on the partial photocatalytic oxidation of 3-pyridinemethanol. All these studies have been carried out in water without the addition of organic solvents. Some authors (Alfe et al., 2014; Spasiano et al., 2015a, 2015b, 2016) carried out this reaction under acidic conditions (pH 1–4) and using commercial TiO2 and TiO2-graphene composite photocatalysts. These reactions took place in the presence of Cu2+ in the absence of oxygen. By increasing pH from 1 to 4, both aldehyde and vitamin B3 yields and Cu2+ ions conversion decreased, and the reactions almost did not occur at pH higher than 4, under the experimental conditions used (Alfe et al., 2014; Spasiano et al., 2015a, 2015b, 2016).
Yurdakal et al. (2017) investigated the selective oxidation of pyridinemethanols (o-, m-, p-) under UVA, UV-Vis, and visible light sources with Pt-loaded TiO2 photocatalysts at pH’s 2–12. High selectivity towards vitamin B3 was obtained in a basic medium using low crystalline (mainly amorphous) rutile TiO2 samples prepared at room temperature. The mainly amorphous TiO2 photocatalysts which have hydrophilic surface, allows the desorption of the products before their further oxidation up to their complete mineralization. This behavior is opposite to that of glycerol (Augugliaro et al., 2010) and its partial oxidation products which, having more hydrophilic OH groups, desorb with difficulty from a highly hydroxylated surface (Augugliaro et al., 2008).
Another recent photocatalytic oxidation study on 3-pyridinemethanol was carried out by Çetinkaya and Yurdakal (2021). Home-prepared TiO2 photocatalysts were prepared from TiCl4 precursor at room temperature, 60 and 100°C in the presence of HCl, HNO3, or H2SO4.
The industrial synthesis of vitamin B3 is performed at high temperature and pressure by oxidizing picolinic isomers with nitric acid, permanganate or chromic acid in the presence of vanadia-titania-zirconia oxide supported catalysts (Yurdakal et al., 2017).
The present study describes the formation of nanotube-structured TiO2 samples on the metal Ti surface by the anodic oxidation method by applying different voltage values for various times. These materials were removed in the form of powder from the surface of the Ti plate by ultrasonic method, subjected to heat treatments at different temperatures and characterized. The photocatalysts were tested for the selective photocatalytic oxidation of glycerol and 3-pyridinemethanol in water and under UVA irradiation. TiO2-structured nanotubes on the Ti plates are interesting because of their high surface area (i.e., ca. 90 m2/g in this work) with respect to thin films, strong ion-exchange ability, effective photocatalytic activities, and easy production by electrochemical oxidation methods (Cui et al., 2009; Roy et al., 2011; Fraoucene et al., 2019). The anodic oxidation technique is one of the most used techniques due to its easy application and low cost (Huang et al., 2016). To obtain metal oxide tube arrays or pore arrays on the metal surface it is essential to carry out the anodization process in the presence of a suitable electrolyte medium (Roy et al., 2011). Anodization parameters (such as applied potential, electrolyte composition/concentration and time) can be easily changed to control some morphologic parameters (Gong et al., 2001).
Experimental Section
Preparation of Ti Plates
Ti plates of 1 mm thickness were cut by guillotine to be 5.0 cm × 8.0 cm. To smooth the surface of the plates, they were sanded with 800, 1,000, 1,200, and 1,500 grit sandpapers, respectively. Then, they were cleaned in an ultrasonic bath for 10 min in acetone, ethanol and distilled water, respectively.
The Ti plates were then chemically cleaned in a solution medium containing 4% HF, 31% HNO3, and 65% water for 30 s (Özcan et al., 2018). Afterward, the Ti plates were again cleaned in an ultrasonic bath in water for 10 min and dried at room temperature to remove all contaminating ions coming from the use of HF and HNO3.
Preparation of TiO2 Photocatalysts
The two-electrode system in which the anodic oxidation process is applied to form nano-structured TiO2 samples on the Ti plate surface is shown in Supplementary Figure S1. The solution in which anodic oxidation will be carried out was prepared by dissolving 0.3% by mass of NH4F in a solution containing 2% water and 98% ethylene glycol by volume (Özcan et al., 2018). Anodic oxidation was carried out in this prepared electrolyte solution by applying a definite constant voltage (50 or 60 V) to the electrodes for a certain time (3 or 5 h) and washed with pure water. These chosen values are similar to those used in the literature (Özcan et al., 2018). Then, the anode was placed in a beaker containing pure water and subjected to an ultrasonic bath, which allowed TiO2 in nanotube/nanowire structure to break and separate from the plate (Ali and Hannula 2017; Ali et al., 2018; Yang et al., 2019).
A sufficient amount of TiO2 nanoparticles were obtained by applying this process repeatedly. The crystallinity of the obtained TiO2 nanoparticles was very low. In order to obtain photocatalysts of different crystallinity, the partitioned TiO2 photocatalyst was kept in an air atmosphere for 3 h (Protherm, PLF-110/10 model) (temperature rise rate: 3°C/min) in a muffle furnace at different temperatures (100–700°C).
The resulting photocatalysts were named TiO2-xV-yh-z. Here, x: voltage value applied while preparing photocatalyst by anodic oxidation, y: time (h) during which the voltage was applied, and z: thermal treatment temperature of the anode. For example, the powdered photocatalyst TiO2-60V-3h-250 was prepared at 60 V for 3 h, separated from the titanium plate by means of an ultrasonic bath, and calcined at 250°C. The photoanode used without thermal treatment for the sake of comparison was named TiO2-xV-yh-25 because it was prepared at room temperature (ca. 25°C).
The potential value applied in the production of all nano-structured electrodes produced by anodic oxidation was reached by increasing ∼0.2 V per second from a voltage of 0.0 V.
Characterization Experiments
The produced nano-structured TiO2 samples were characterized by X-ray diffraction (XRD) which was performed with a Bruker D8 Advance diffractometer using the Cu Kα radiation (1.544 Å) and a 2θ scan rate of 1.281°/min, while scanning electron microscope observations (SEM) were performed with an FEI microscope (NanoSEM 650 model, FEI Company). The samples on the stab were covered with a thin gold film before SEM observations. XRD analyses were performed to establish the crystal phase(s) and the primary particle sizes of the photocatalysts, while SEM analyses to determine their morphological properties.
BET specific surface area values of the prepared samples were determined by the multi-point BET method using a Micromeritics (Gemini VII model) apparatus. The nano-structured TiO2 photocatalysts were degassed at 200°C for 5 h before the measurement. The crystalline and morphologic properties of the samples could be changed only slightly by the used degassing temperature, however we could not perform degassing process at low temperatures because the pores would not be completely free and the measurement would be wrong (i.e., room temperature).
Photocatalytic Test System
A 250 mL Pyrex beaker was used as a photoreactor for experiments performed under UVA light (Supplementary Figure S2). UVA rays reaching the suspension were provided by four fluorescent lamps (Philips, each lamp is 8 W) emitting mainly at 365 nm. The spectrum of the lamp is shown in Supplementary Figure S3. The distance to the suspension of these lamps was 6.8 cm, and the lamps were placed parallel to each other. The average value of the radiation energy reaching the suspensions, determined using a radiometer (Delta Ohm, DO9721), was 21 W m−2 in the range 315–400 nm.
The initial substrate concentration for glycerol was 2 or 10 mM while for 3-pyridinemethanol was 0.50 mM. The amount of used photocatalyst was 0.20 g L−1. Before the lamps were turned on, the suspension was stirred in the dark for 30 min to reach thermodynamic and adsorption-desorption equilibrium. Moreover, the suspension was continuously stirred magnetically at 500 rpm during the photocatalytic experiments that were carried out at pH 7 and at room temperature (ca. 25°C). The aqueous suspension was in contact with the atmosphere which provided the necessary oxygen. Samples withdrawn at certain time intervals were filtered through a hydrophilic membrane (0.45 µm, HA, Millipore) before being injected in the high performance liquid chromatography (HPLC) and total organic carbon (TOC) analyzers. All the photocatalytic experiments were carried out twice or three times to check their reproducibility.
Analytical Techniques
Qualitative and quantitative analyses of the samples withdrawn from the experimental system at certain times during the photocatalytic experiments of glycerol and 3-pyridinemethanol were performed with HPLC (Shimadzu Prominence LC-20A model and SPD-M20A photodiode array detector). Two consecutive C-18 columns were used (Phenomenex and Syncronis, respectively), and the column temperature was kept at 30°C. Retention times of analyzed substrates and intermediates and UVA spectra of compounds were compared with known standards (Sigma-Aldrich, purity ≥ 98%). For glycerol and its intermediates, the mobile phase was a 5 mM aqueous solution of sulfuric acid, and the flow rate was 0.3 cm3 min−1. For 3-pyridinemethanol and its intermediates, the mobile phase was 40% methanol and 60% deionized water, and the flow rate was 0.2 cm3 min−1.
Total organic carbon (TOC) analyses were performed with a Shimadzu (TOC-LCPN model) device to determine the amount of mineralized carbon dioxide during the oxidation of the substrates studied. The selectivity towards the main products (%) and the substrate conversion (%) have been calculated according to the formula below:
Results and Discussion
Characterization of Photocatalysts
Figures 1–3 show XRD patterns of nanotube/nanowire-structured TiO2 photocatalysts calcined at different temperatures (up to 700°C). Since the behaviors of all three sample types (TiO2-60V-5h, TiO2-60V-3h, and TiO2-50V-3h) with respect to heat treatment were similar, TiO2-60V-5h was calcined at several different temperatures, while TiO2-60V-3h and TiO2-50V-3h samples were calcined only at 250, 500, and 700°C. The peak values at 2θ = 27.5°, 36.5°, 41.0°, 54.1°, and 56.5° refer to the rutile phase, while those at 2θ = 25.58°, 38.08°, 48.08°, 54.58° belong to the anatase phase (Yurdakal et al., 2012; Fiorenza et al., 2020). Low and broad XRD peaks are indicative of a low crystallinity, consequently, uncalcined TiO2 samples showed to have a low crystallinity (high amorphous content) and a small amount of anatase phase content (Yurdakal et al., 2012; Çetinkaya and Yurdakal 2021). For all samples, as the calcination temperature increased up to 500°C, the intensity and the sharpness of the anatase phase peak increased also. Consequently, TiO2 crystallinity increased by increasing the thermal treatment temperature. At 700°C, a sharp peak belonging to the rutile phase was also formed. The XRD peak intensity of the anatase phase decreased at 700°C with respect to the sample calcined at 500°C, because the transformation from anatase phases to rutile occurred.
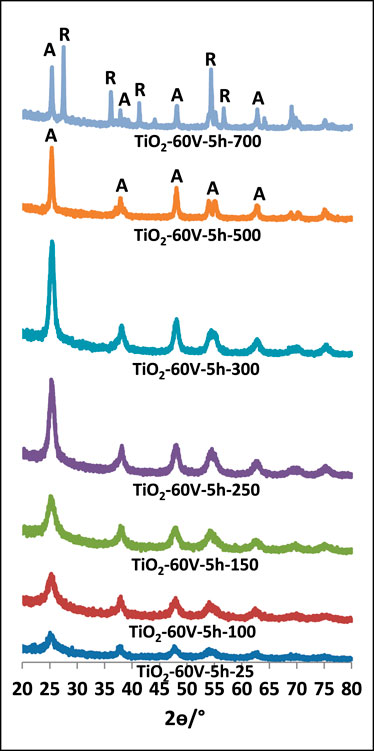
FIGURE 1. XRD patterns of TiO2-60V-5h samples calcined at different temperatures.
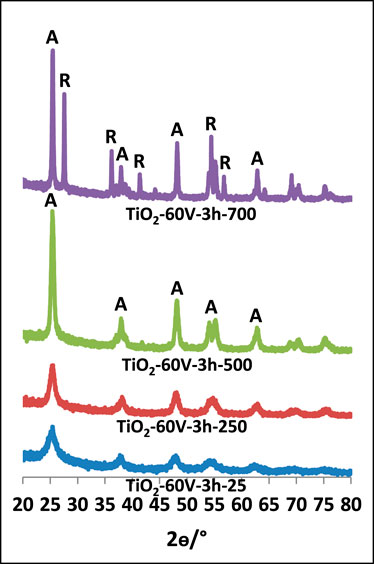
FIGURE 2. XRD patterns of TiO2-60V-3h samples calcined at different temperatures.
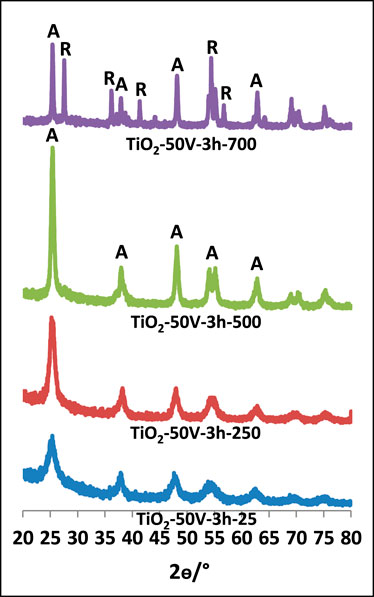
FIGURE 3. XRD patterns of TiO2-50V-3h samples calcined at different temperatures.
Supplementary Figure S4 shows the XRD patterns of commercial TiO2 (Merck and Degussa P25) photocatalysts. These photocatalysts, which are not in nanotube/nanowire structure, are in powder form and have been used to compare the investigated home prepared photocatalysts. Merck TiO2 photocatalyst is entirely in the anatase phase, while Degussa P25 is in the anatase and rutile phases (ca. 82% A, 18% R).
In Table 1, phases of TiO2 samples, percentage of each crystal phase, and primary particle size values of each phase calculated from the Scherrer equation are reported. As the calcination temperature of the photocatalysts raised, the primary particle sizes increased due to the sintering of the particles. When the TiO2-60V-5h samples were examined, although the primary particle size raised slightly up to 300°C, it showed a significant increase at 500°C and especially at 700°C. The primary particle size value was only 10 nm at 300°C, while it increased at 18 and 34 nm at 500 and 700°C, respectively. Both anatase and rutile phases were formed for all samples calcined at 700°C. Anatase and rutile percentages of these samples are different. The rutile phase was dominant in TiO2-60V-5h-700, while anatase phase was present in other samples (especially TiO2-60V-3h-700). The primary particle size of the anatase phase for all samples was about 33 nm, while that of the rutile phase 52 nm. In Degussa P25, the most common commercial photocatalyst, the primary particle size values of both phases are close to each other and are approximately 20 nm.
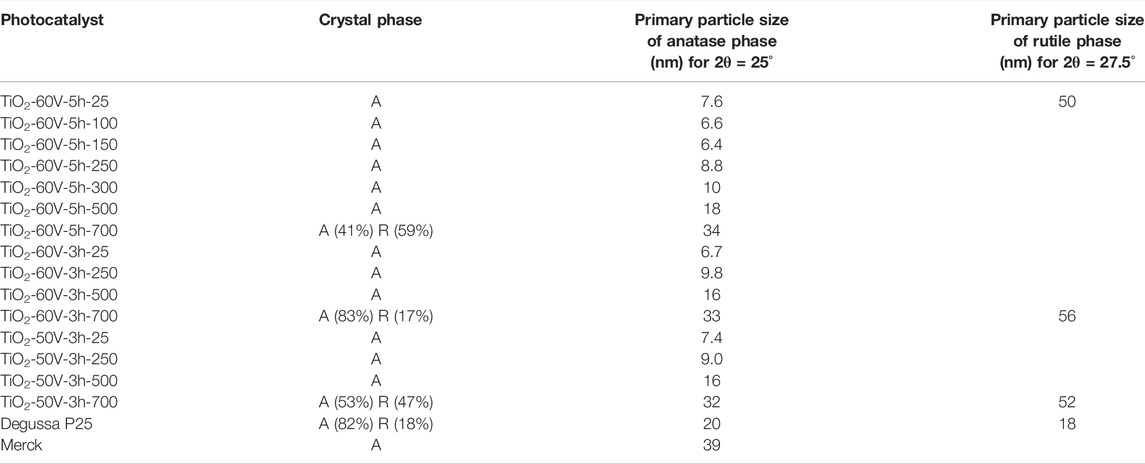
TABLE 1. Crystal phases, phase percentages and primary particle sizes of photocatalysts.
Figure 4 shows the nitrogen adsorption-desorption isotherms of the prepared TiO2 samples, and the results derived from these isotherms are reported in Table 2. All the prepared TiO2 photocatalysts showed the type IV isotherm characteristic with an H3-type loop according to the IUPAC classification, indicating the irregular structure of the inner surface of the pores (Sing et al., 1985; Yurdakal et al., 2019; Zhang et al., 2022). The samples prepared without thermal treatment showed values of specific surface area in the range ca. 78–89 m2/g; however, their surface area decreased to ca. 47–54 m2/g after calcination at 500°C. A drastic reduction of the surface area up to 7.4 m2/g occurred after the treatment at 700°C. This finding is due to the sinterization of the nanotubes at a very high temperature (see SEM results). The BET isotherms of the three different samples (TiO2-60V-5h, TiO2-60V-3h and TiO2-50V-3h) showed the same behavior if the thermal treatment temperature was the same, 25, 500, or 700°C (see Figure 4).
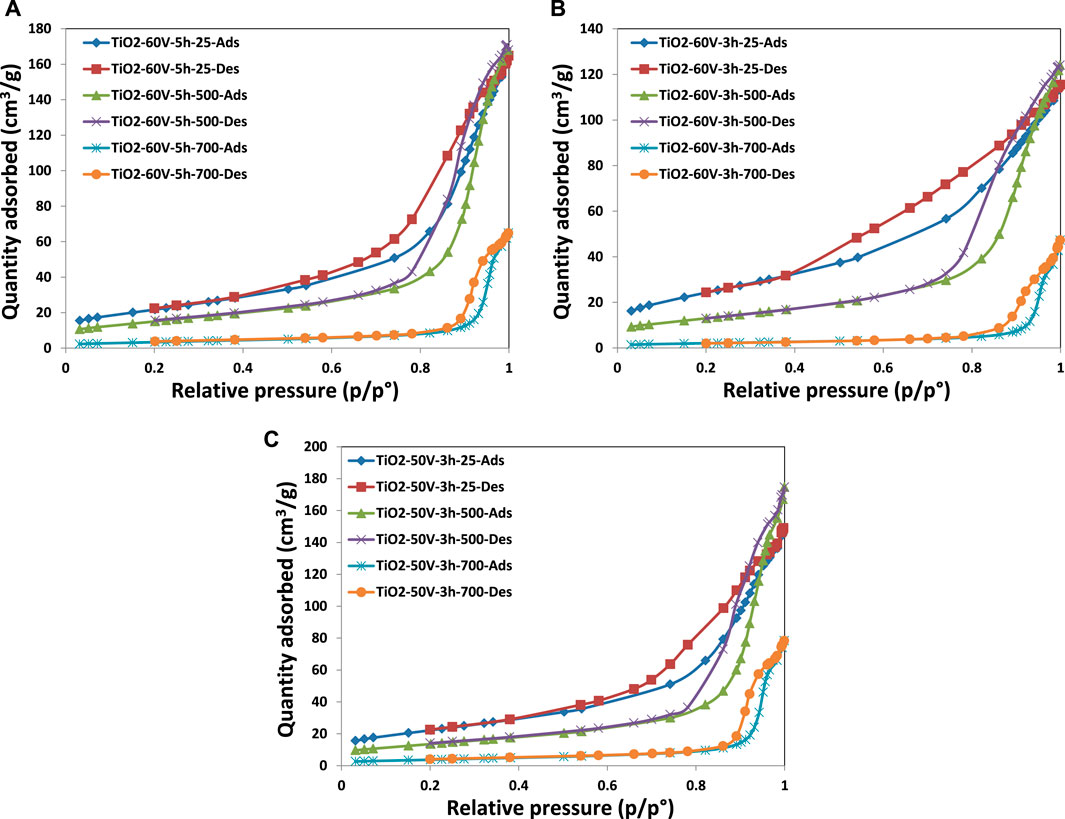
FIGURE 4. BET isotherms of the TiO2 samples: (A) TiO2-60V-5h, (B) TiO2-60V-3h, and (C) TiO2-50V-3h.
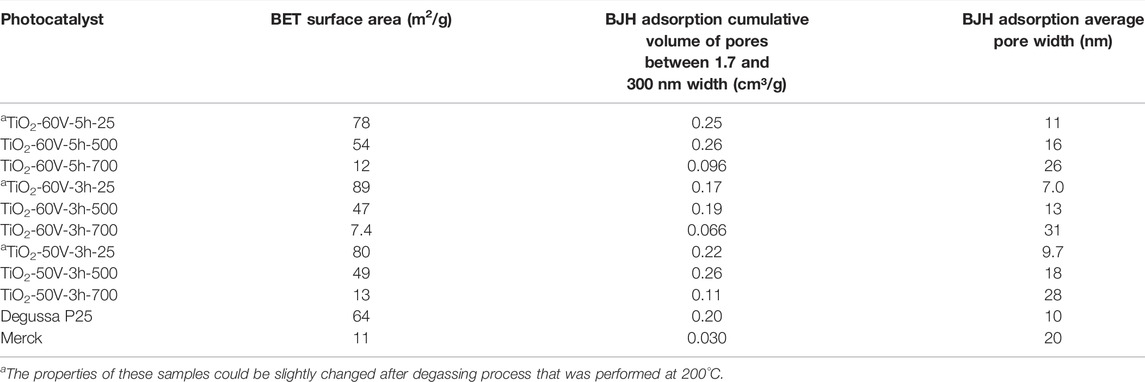
TABLE 2. BET specific surface area, pore volume and pore width values of the TiO2 samples.
BJH Adsorption cumulative volume values (between 1.7 and 300 nm width) of pores of the samples, treated thermally at room temperature and 500°C, are similar. In contrast, that of the treated ones at 700°C decreased significantly. For instance, the pore volume of TiO2-60V-5h-500 was 0.261 cm³/g, while TiO2-60V-5h-700 was only 0.0957 cm³/g because of the sinterization of the TiO2 nanotubes. Indeed, the BET adsorption-desorption isotherm of TiO2-60V-5h-700 is very different from those of TiO2-60V-5h-25 and TiO2-60V-5h-500; it has a tiny hysteresis loop compared with the other two. In addition, BJH adsorption mean pore width values of the samples increased with the heat treatment temperature as there is an opposite trend between pore volume and width. Consequently, as seen in Figures 5, 6, pore size distribution curves were shifted to larger values by increasing the temperature of thermal treatment. For instance, peak maximum of the pore width vs. pore volume curves of TiO2-60V-3h-25, TiO2-60V-3h-500, and TiO2-60V-3h-700 are ca. 13, 22, and 44 nm, respectively (see Figure 6B).
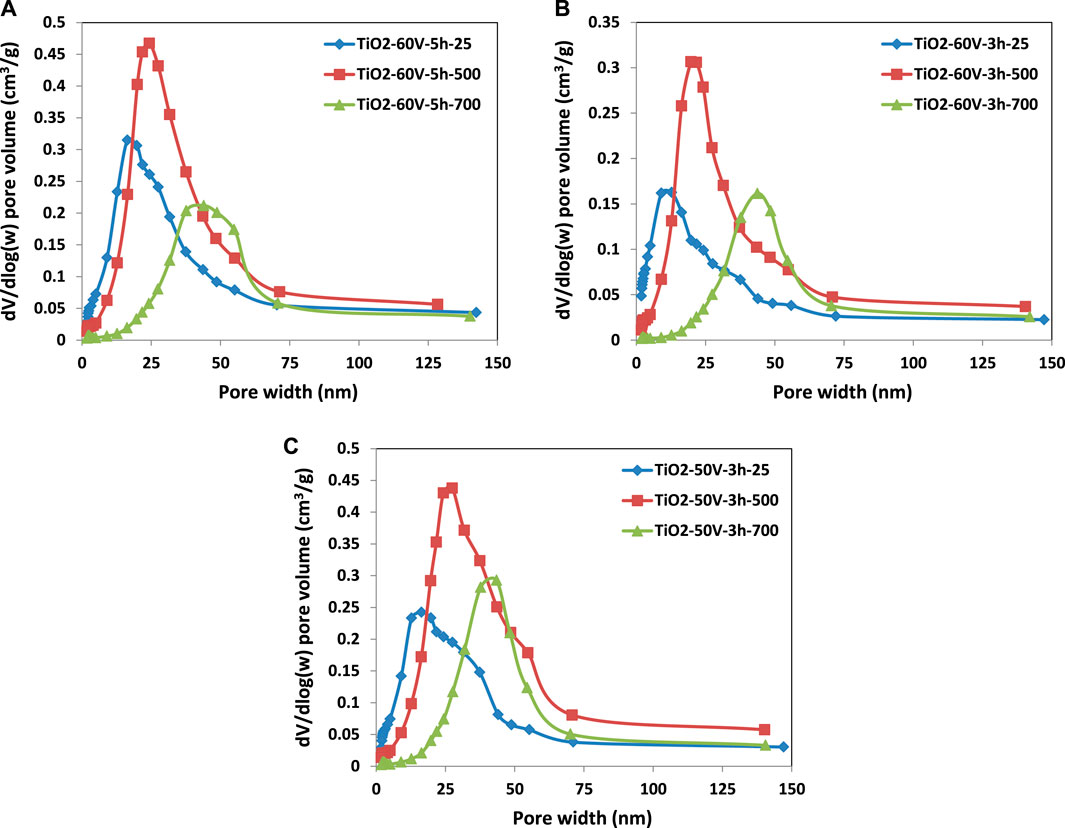
FIGURE 5. Pore size distribution versus pore volume of the TiO2 samples: (A) TiO2-60V-5h, (B) TiO2-60V-3h, and (C) TiO2-50V-3h.
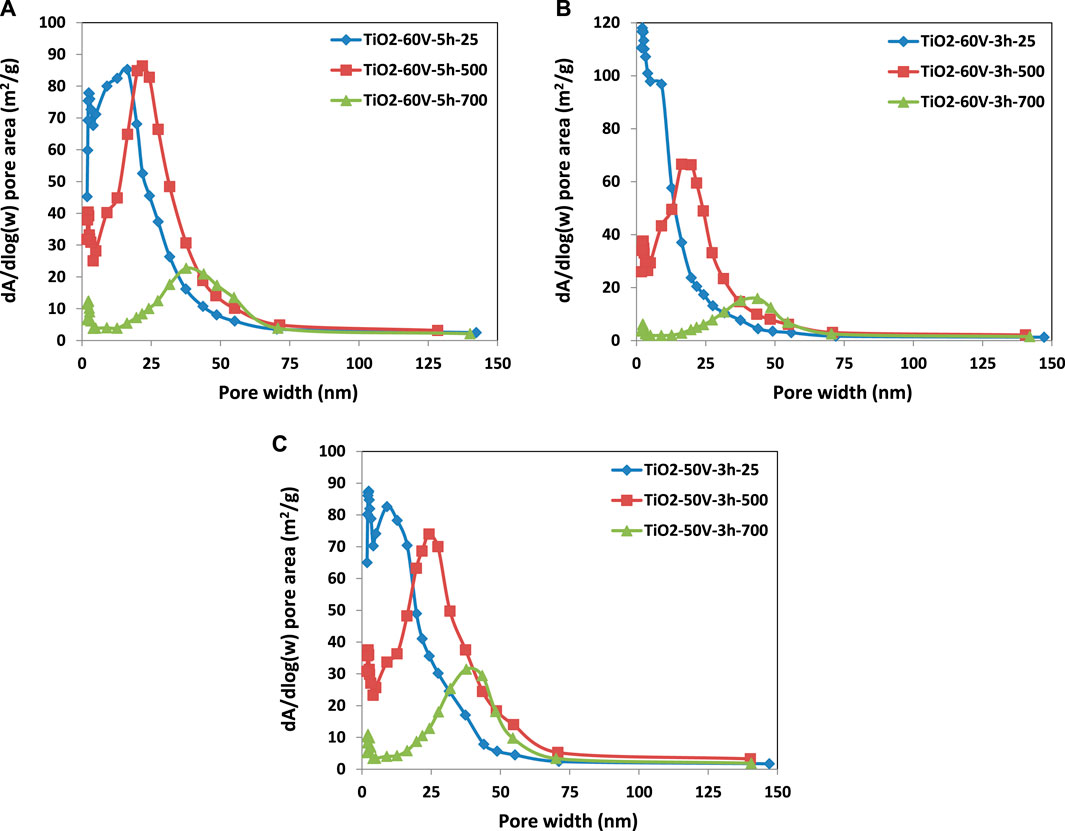
FIGURE 6. Pore size distribution versus pore area of the TiO2 samples: (A) TiO2-60V-5h, (B) TiO2-60V-3h, and (C) TiO2-50V-3h.
In this section, also some SEM images of nanotube/nanowire-structured TiO2 samples prepared using the anodic oxidation method on the Ti surface at different potential values and different times are discussed. In order to obtain a sufficient amount of photocatalyst, TiO2 structures were formed on the Ti surface many times by the anodic oxidation method and removed from the surface by ultrasonic treatment.
Figure 7; Supplementary Figure S5 show SEM images of TiO2-60V-5h-25 nanoparticles taken at different magnifications. The TiO2 particles show a heterogeneous distribution of their size from a few microns to 400 μm, but the size of most of them ranges between 50 and 100 µm. Figure 7 reports SEM images taken from the top of the nanomaterial. These pictures show that the structure is porous and in a nanotube structure. However, there are also nanotube structures with closed mouths on the surface. Supplementary Figures S5B–D are cross-sectional views of TiO2-60V-5h-25 material. From these images, the diameter of the TiO2 nanotube is between 100 and 150 nm, and according to the picture in Supplementary Figure S5C, the nanotube length is about 8 µm.

FIGURE 7. SEM images of the prepared photocatalysts.
In Figure 7 the SEM images of the same material (TiO2-60V-5h) calcined in the air at 250°C (TiO2-60V-5h-250) can be observed. Figure 7 is top images of the material, with a clear nanotube structure. Supplementary Figures S6A,B are filled nanotube/nanowire photos. In the picture of Supplementary Figure S6B, it can be noticed that some nanowire structures are separated from each other. The diameters of these nanowires are between about 60 and 90 nm. These SEM images indicate that some nanowire structures formed together with the nanotube structure. The separation of some of the nanowire structures from each other also increases the effective surface area of the material. Supplementary Figure S6C is a cross-sectional view of this material, which shows that the section thickness of the nanostructure is approximately 18 µm.
SEM images of TiO2-60V-5h-700 are provided in Figure 7. Figure 7; Supplementary Figure S7A are images of the upper part of the material that appears to be in nanotube structures. Due to the high calcination temperature of 700°C, its crystallinity is quite high and some sintering can be observed in Figure 7. Indeed, the BET surface area of this sample was very low with respect to the uncalcined ones because of the partial sintering of the nanostructures; 12.2 vs. 78.3 m2/g. Supplementary Figure S7B is a side sectional view of the same material.
SEM images of the TiO2-50V-3h-25 nanomaterial are given in Figure 7. Supplementary Figure S8A shows the overall particle distribution. This photocatalyst has smaller particles (up to about 100 µm) than the “TiO2-60V-3h” materials. Figure 7; Supplementary Figure S8B show the nanotube structures in the cross-sectional view. These photos were taken from the upper part of the material, and nanotube structures with a homogeneous distribution are evident. Supplementary Figure S8D reports an image of the bottom of the material. According to the cross-sectional view, the length of the nanotubes is approximately 9 µm (Supplementary Figure S8E). In some places, the nanotubes were separated from the main structure, individually or combined (Figure 7). The diameter of these nanotubes is approximately 140–160 nm.
SEM photos of TiO2-60V-3h-25 sample are given in Supplementary Figure S9. Large nanoparticles up to about 180 µm are present (Supplementary Figure S9A). There are also smaller particles of the order of nanometers in size. Supplementary Figure S9B indicates that the material is mostly in nanowire structure. The diameter of the nanostructures is about 100–135 nm (Supplementary Figures S9E,F). Supplementary Figure S9C shows the traces left by the broken nanowires on the surface. According to Supplementary Figure S9D, the layer length of the nanomaterial is approximately 8 µm. Supplementary Figure S10 gives an SEM picture of the same material calcined at 500°C. The nanostructures in Supplementary Figure S10B appear to consist of tiny crystals with a 20–30 nm diameter.
Photocatalytic Activity
Photocatalytic glycerol oxidation experiments were carried out under UVA irradiation at pH 7 to work under environmentally friendly conditions (Yurdakal et al., 2017). No activity was detected in the presence of light but in the absence of photocatalyst or in the dark in the presence of photocatalyst (Augugliaro et al., 2012). Light, photocatalyst and oxygen were essential for the occurrence of the photocatalytic reaction.
Table 3 shows the results of photocatalytic experiments performed with 10 mM initial concentration of glycerol. The conversion values are low for our prepared samples due to the high initial concentration. From the qualitative and quantitative analyses of the samples during the reaction, glyceraldehyde (GAD), 1,3-dihydroxyacetone (DHA), and formic acid (FA) were determined as the main intermediates (see Scheme 1A). The low carbon balance is due to the formation of undetected aliphatic species. We could not detect the other intermediates, because of their trace amounts. In addition, CO2 was formed as a mineralization product. In the tables of the photocatalytic experiments conversion, selectivity (vs. the formation of GAD, DHA and FA), TOC decrease (%), and the pH values of the suspension at the end of the experiment after 8 h are reported. TOC analyses were carried out only for some experiments. In general, the pH value decreased due to the formation of FA and other acidic species. While the photocatalysts prepared on the Ti plate surface showed low glycerol conversion (up to 10%), the commercial Degussa P25 photocatalyst gave rise to a 27% conversion that was the highest value among the photocatalysts tested, and consequently the highest TOC decrease was achieved with this photocatalyst. First of all, the experiments were carried out with the TiO2-60V-5h photocatalyst at different temperatures. TiO2-60V-5h-500 photocatalyst gave the highest conversion with 9%. Therefore, other photocatalysts were calcined at 500°C (TiO2-50V-3h-500 and TiO2-60V-3h-500) and were also used for comparison purposes. Among them, TiO2-50V-3h-500 showed 10% conversion. This photocatalyst is in the anatase crystalline phase. Photocatalysts with low heat treatment showed to have scarce activities. Since the selectivity values were calculated at different reaction times, there is an inverse relationship between the selectivity values and the conversion values. In fact, as the reaction progresses, the intermediate products formed are more likely to reoxidize several times.
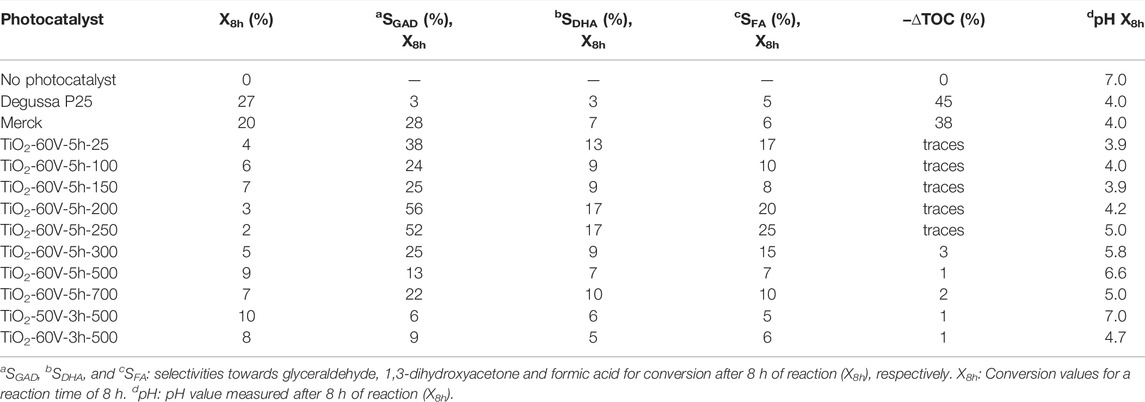
TABLE 3. The results of photocatalytic glycerol (10 mM) oxidation under UVA light with TiO2 photocatalysts.
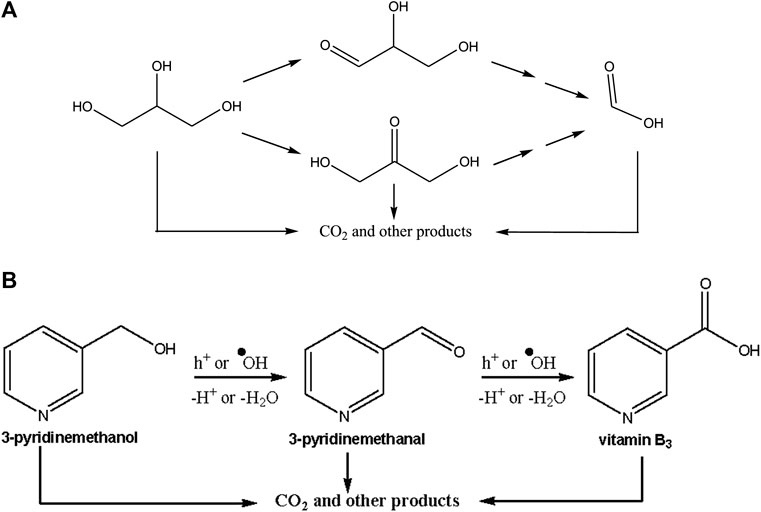
SCHEME 1. The proposed mechanism for photocatalytic oxidations of glycerol (A) and 3-pyridinemethanol (B) to their photocatalytic oxidation products (Yurdakal et al., 2020).
Therefore, the TiO2-60V-5h-200 photocatalyst with the lowest activity showed the highest GAD and DHA selectivity, i.e., 56% and 17%, respectively. Although the photocatalysts have a porous structure, as they detached from the Ti surface in large pieces (in microns), their effective surface is less than those in powder and showed a lower activity than the commercial ones. Furthermore, the selectivity values towards GAD are higher than those towards DHA. This is due to the fact that to obtain DHA it is necessary to oxidize the carbon in position two of glycerol, while for the formation of GAD it is necessary to oxidize one of the carbons in position 1 or 3. Consequently, the probability of obtaining GAD is greater (Augugliaro et al., 2010).
Since the conversion observed during photocatalytic experiments carried out with an initial concentration of 10 mM glycerol was low, a set of photocatalytic experiments were also performed starting from an initial concentration of 2 mM glycerol (see Table 4). Due to the low initial glycerol concentration, the amount of GAD in some experiments was too low to be analysed, and it was not reported in table. As the calcination temperature of each type of nanomaterial increased, the glycerol conversion values increased, and the highest conversions were obtained with samples calcined at 700°C. The most significant result was found for the TiO2-50V-3h photocatalyst, with glycerol conversions of 5, 14 and 25% for TiO2-50V-3h-25, TiO2-50V-3h-500 and TiO2-50V-3h-700, respectively. In particular, the TiO2-50V-3h-700 sample proved to be much more photoactive per surface unit than the corresponding samples treated at lower temperatures. This finding indicates that crystallinity, higher at higher temperatures, is the most important factor for the photocatalytic oxidation of glycerol. Glycerol, a highly hydrophilic molecule, could interact very strongly with the surface of uncalcined TiO2 samples which are mainly in the amorphous phase (Augugliaro et al., 2008). Furthermore, its oxidation products (i.e., DHA and GAD) could remain on the surface blocking the active sites for a longer time than what happens on hydrophobic surfaces. Conversely, glycerol and its oxidation products could more easily desorb from crystalline and probably less hydroxylated surfaces, which would justify greater activity of the latter (Augugliaro et al., 2010). For this reason the Merck TiO2 sample was shown to possess the highest activity despite its specific surface area being quite small (approx. 11 m2/g).
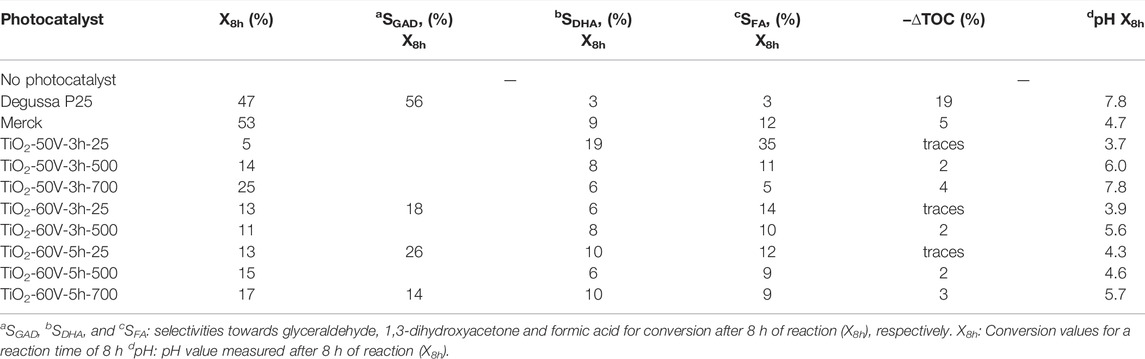
TABLE 4. The results of photocatalytic glycerol (2 mM) oxidation under UVA light with TiO2 photocatalysts.
Some works were published on the partial photocatalytic oxidation of glycerol (Augugliaro et al., 2010; Imbault et al., 2020; Payormhorm and Idem 2020; Rangarajan et al., 2021). Previously, we performed photocatalytic oxidation of glycerol in aqueous suspensions containing home-prepared TiO2 photocatalysts (Augugliaro et al., 2010). The initial glycerol concentration (50–180 mM) and the reaction time were higher than in the present work. Moreover, the photocatalysts were bulk anatase, rutile, or anatase–rutile polymorphic phases. In that work, Merck and Degussa P25 TiO2 photocatalysts showed higher activity/selectivity than the home-prepared ones, like in the present study. The fact that a high crystallinity of the photocatalysts is beneficial for the activity is confirmed by the present investigation. In addition, we also detected the same intermediates. Consequently, the TiO2 morphology, whether nanotube/nanowire or bulk structure, does not play a significant role in the product nature and distribution.
Payormhorm and Idem (2020) used C-doped TiO2 prepared by a sol-microwave method for photocatalytic glycerol oxidation under visible light irradiation. Mainly DHA, GAD, and FA products and trace amounts of acetic acid were obtained. Unlike Payormhorm and Idem (2020), in our work, we used UVA irradiation and did not detect acetic acid.
Imbault et al. (2020) investigated photocatalytic oxidation of glycerol to DHA, GAD, glyceric acid, and several other chemicals using TiO2 photocatalysts under simulated solar irradiation and in acetonitrile as solvent. Reaction rate and selectivity towards the products were higher in acetonitrile compared with an aqueous suspension. For instance, after 6 h of reaction, glycerol conversion and selectivity towards DHA were 96.8% and 17.8% in acetonitrile compared to 36.1% and 14.7% in water, respectively.
Rangarajan et al. (2021) prepared Ag-AgBr/TiO2 ternary nanocomposites for selective photocatalytic glycerol oxidation into GAD and DHA in a non-aqueous solvent under visible light and aerobic conditions. Although a lower glycerol conversion was obtained in acetonitrile than in water after 4 h, a significantly higher yield of DHA (13%) and GAD (19%) was obtained due to the less significant formation of non-selective ˙OH radicals in the organic solvent.
Oxidation of 3-pyridinemethanol, an aromatic primary alcohol, was also carried out with the same photocatalysts used for glycerol oxidation. 3-Pyridinemethanal and vitamin B3 were determined as main products. Scheme 1B shows a proposed mechanism for photocatalytic oxidation starting from 3-pyridinemethanol. The first step can be considered the interaction of h+ or hydroxyl radicals with formation of 3-pyridinemethanal subsequently oxidized to vitamin B3. The over-oxidation products of these substrates and their corresponding molecules were mainly aliphatic species and CO2 (Yurdakal et al., 2020).
Table 5 shows the results of the photocatalytic oxidation tests of 3-pyridinemethanol oxidation under UVA light in the presence of TiO2-50V-3h photocatalysts obtained at different thermal treatment temperatures. Initial reaction rates, pseudo-first-order rate constants, substrate conversion values for one and 3 h reaction times, selectivity towards 3-pyridinemethanal and vitamin B3 after 15% and 30% conversion, and pH values of the suspension at the end of the reaction are given in the table. Only 15% conversion was achieved after 3 h with the TiO2-50V-3h-25 photocatalyst. This photocatalyst appeared to be in the anatase phase, but its crystallinity was low. Although crystalline samples showed higher activity, it can be noted that TiO2-50V-3h-250 photocatalyst was both the most active and the most selective towards 3-pyridinemethanal and vitamin B3 formation. In fact, the k-value for the 3-pyridinemethanol oxidation of this photocatalyst was about 3 times that of the TiO2-50V-3h-25 photocatalyst (0.156 h−1 vs. about 0.052 h−1). In addition, 87% 3-pyridinemethanal and 11% vitamin B3 selectivities were obtained after 30% conversion.
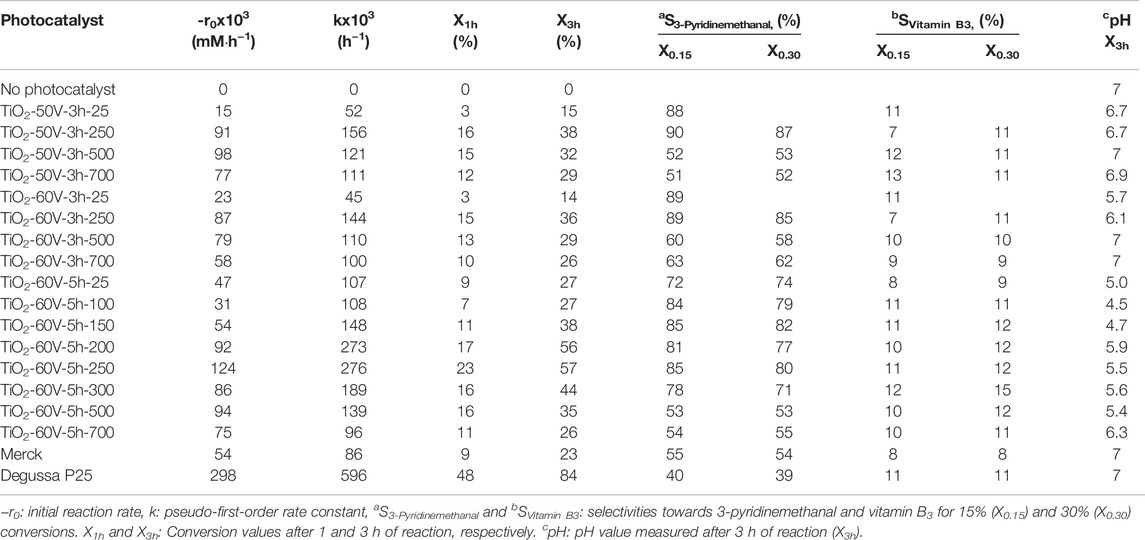
TABLE 5. Photocatalytic results of 3-pyridinemethanol (0.5 mM) oxidation under UVA light with TiO2-50V-3h, TiO2-60V-3h, TiO2-60V-5h, and the commercial photocatalysts prepared at different calcination treatment temperatures.
In this work seems that the temperature of 250°C, at least for the samples prepared as above described, is the optimum choice both for the conversion of the substrates studied and for production of 3-pyridinemethanal and vitamin B3 (see Table 5). It should be noted that the significantly higher selectivity values towards 3-pyridinemethanal compared to vitamin B3 may be due to the relatively short reaction times and consequently to the low conversion values. In fact, the first oxidation product deriving from 3-pyridinemethanol is aldehyde (3-pyridinemethanal), while acid vitamin B3 is subsequently formed. The amount of vitamin B3, therefore, increased with the reaction time, while the amount of 3-pyridinemethanal decreased. The carbon balance values were quite good, indicating that the CO2 formation resulting from complete mineralization of the substrate was negligible; consequently, TOC values were not inserted in the following tables. Finally, there was no significant change in the pH values measured at the end of the experiment, and this finding confirms that vitamin B3 was formed in small quantities.
In Table 5, the results of the photocatalytic oxidation of 3-pyridinemethanol under UVA light with TiO2-60V-3h photocatalysts obtained at different thermal treatment temperatures are given. TiO2-60V-3h-250 photocatalyst gave the highest activity (k = 0.144 h−1) with 36% conversion. This photocatalyst, which is thermally treated at 250°C, still has the highest activity and product selectivity values. It showed 85% 3-pyridinemethanal and 11% vitamin B3 selectivity (96% total) for 30% conversion.
Photocatalytic results under UVA light of 3-pyridinemethanol oxidation with TiO2-60V-5h photocatalysts calcined at different temperatures are given in Table 5. It can be noted that 250°C was the optimum temperature. The values of the rate constant with respect to the calcination temperature of the photocatalysts can be arranged almost like a Gaussian curve. The optimum calcination temperature depends on the type of substrate. The highly crystalline TiO2 samples were found to be the most effective both in terms of conversion and selectivity for the oxidation of glycerol (best results in the presence of calcined TiO2 at 700°C), while a medium/low crystallinity of TiO2 was required for the oxidation of 3-pyridinemethanol (best results in the presence of calcined TiO2 at 250°C).
Table 5 also shows the results of two commercial TiO2 photocatalysts (Degussa P25, Merck) for the sake of comparison. The commercial TiO2 catalysts were prepared at high temperatures, and their high crystallinity was evidenced by their sharp and intense XRD peaks (Yurdakal et al., 2020). TiO2-60V-5h-250 showed the highest activity among the home prepared photocatalysts, and in particular the k-value was about 3 times higher than that found for the Merck commercial photocatalyst (0.276 vs. 0.0856 h−1). Conversely, Degussa P25 showed greater photocatalytic activity (k = 0.596 h−1). However, while the total selectivity value of aromatic aldehyde and vitamin B3 after the 30% substrate conversion was only 50% in the case of Degussa P25, this value was 92% for the TiO2-60V-5h-250 sample. The photocatalytic oxidation results of 3-pyridinemethanol versus time in the presence of Degussa P25 and TiO2-60V-5h-250 are shown in Figure 8A. It was evidenced in Figure 8B that the reaction rate fits the pseudo-first-order kinetics.
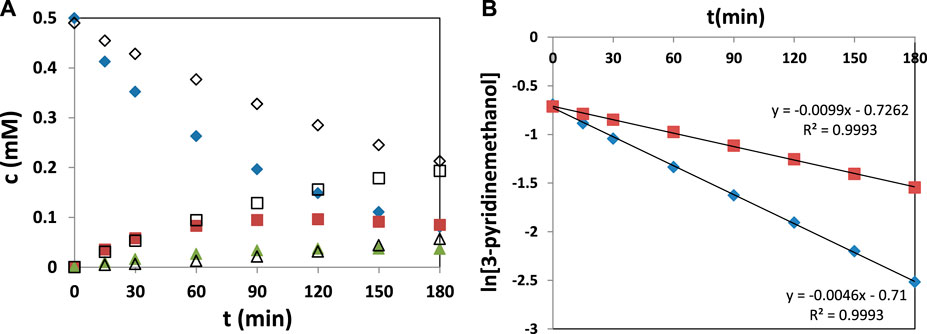
FIGURE 8. (A) The results of photocatalytic oxidation of 3-pyridinemethanol (♦,◊) to 3-pyridinemethanal (■,□) and vitamin B3 (▲,Δ) versus time in the presence of Degussa P25 (full symbols) and TiO2-60V-5h-250 (empty symbols) under UVA light at pH 7, (B) the pseudo-first-order kinetic values of Degussa P25 (♦) and TiO2-60V-5h-250 (■).
Although the conversion rate of alcohol was lower in the presence of TiO2-60V-5h-250 than in Degussa P25, the TiO2-60V-5h-250 photocatalyst produced more products. This finding indicates that the latter photocatalyst (TiO2-60V-5h-250) can potentially be used for fast and selective photocatalytic synthetic reactions under environmentally friendly conditions, although a handicap is the laborious preparation process.
Some authors (Alfe et al., 2014; Spasiano et al., 2015a, 2015b, 2016) performed this reaction under acidic conditions (pH 1–4) using commercial TiO2 and also TiO2-graphene composite photocatalysts. The reaction took place in the presence of Cu2+ in the absence of oxygen, but at pH >4 the reaction almost did not occur (Alfe et al., 2014; Spasiano et al., 2015a, 2015b, 2016). Our group investigated the selective oxidation of pyridinemethanols (o-, m-, p-) under UVA, UV-Vis, and visible light sources in the presence of Pt-loaded TiO2 photocatalysts at pH 2–12 (Yurdakal et al., 2017). High selectivity towards vitamin B3 was obtained only in basic conditions. Another recent study on photocatalytic oxidation of 3-pyridinemethanol was carried out by Çetinkaya and Yurdakal (2021). In that case, samples prepared at low temperature showed high product selectivity with respect to Degussa P25. However, in the present work we investigated the thermal treatment temperature in detail and found that the optimum thermal treatment is 250°C. Low crystalline TiO2 photocatalysts have a hydrophilic surface, but allowed the desorption of the products before their further oxidation up to a complete mineralization, and this is the reason for the high product selectivity (Augugliaro et al., 2008).
Conclusion
In this study, nanotube-structured TiO2 samples were prepared by anodic oxidation method at different potential values (50 or 60 V) applied for different times (3 or 5 h) on a Ti metal surface. Moreover the obtained samples after they were taken by ultrasonic treatment from the TiO2 plate, were subjected to heat treatment at different temperatures. As the temperature of the heat treatment increased, the crystallization of TiO2 and the size of the primary particles of the materials increased. All the photocatalysts were found to be only in the anatase phase until the calcination temperature was not greater than 500°C. At 700°C, however, significant quantities of both the anatase and rutile phases were obtained. SEM analyses showed that the prepared materials were in nanotube structure, but also porous structures and nanowires were noted.
The TiO2 photocatalysts were tested for photocatalytic selective oxidation of glycerol and 3-pyridinemethanol under UVA light under environmentally friendly conditions. Two non-nanotube/nanowire structured commercial TiO2 photocatalysts (Degussa P25 and Merck) were used for the sake of comparison. The home-prepared TiO2-60V-5h-250 photocatalyst showed both a high activity and a high selectivity towards the main products of the oxidation of 3-pyridinemethanol (over 90% total selectivity towards 3-pyridinemethanal and vitamin B3). For glycerol oxidation the best photocatalysts were those more crystalline calcined at 700°C even if their specific surface areas are the smallest with respect to others.
Data Availability Statement
The original contributions presented in the study are included in the article/Supplementary Material, further inquiries can be directed to the corresponding author.
Author Contributions
SÇ and GK performed the experiments. SY planned the project and designed the experiments. LÖ and LP assisted in the analysis and interpretation of the data. SY wrote the manuscript. SY and LP reviewed and edited the manuscript.
Conflict of Interest
The authors declare that the research was conducted in the absence of any commercial or financial relationships that could be construed as a potential conflict of interest.
Publisher’s Note
All claims expressed in this article are solely those of the authors and do not necessarily represent those of their affiliated organizations, or those of the publisher, the editors and the reviewers. Any product that may be evaluated in this article, or claim that may be made by its manufacturer, is not guaranteed or endorsed by the publisher.
Acknowledgments
The Authors thank the Scientific Research Project Council of Afyon Kocatepe University (BAP project no: 20.Fen.Bil.07) for financial support, Engineer Mehmet Akkaş [Kütahya Dumlupınar Üniversitesi, İleri Teknolojiler Merkezi (İLTEM), Turkey] for the SEM, Physicist Serhat Tıkız and Engineer Hakan Şahin [Afyon Kocatepe Üniversitesi, Teknoloji Uygulama ve Araştırma Merkezi (TUAM), Turkey] for the BET and XRD analyses, respectively.
Supplementary Material
The Supplementary Material for this article can be found online at: https://www.frontiersin.org/articles/10.3389/fchem.2022.856947/full#supplementary-material
References
Alfè, M., Spasiano, D., Gargiulo, V., Vitiello, G., Di Capua, R., and Marotta, R. (2014). TiO2/graphene-like Photocatalysts for Selective Oxidation of 3-Pyridine-Methanol to Vitamin B3 under UV/solar Simulated Radiation in Aqueous Solution at Room Conditions: The Effect of Morphology on Catalyst Performances. Appl. Catal. A: Gen. 487, 91–99. doi:10.1016/j.apcata.2014.09.002
Ali, S., Granbohm, H., Lahtinen, J., and Hannula, S. P. (2018). Titania Nanotubes Prepared by Rapid Breakdown Anodization for Photocatalytic Decolorization of Organic Dyes under UV and Natural Solar Light. Nanoscale Res. Lett. 13, 179. doi:10.1186/s11671-018-2591-5
Ali, S., and Hannula, S. P. (2017). Titania Nanotube Powders Obtained by Rapid Breakdown Anodization in Perchloric Acid Electrolytes. J. Solid State. Chem. 249, 189–198. doi:10.1016/j.jssc.2017.03.007
Augugliaro, V., Bellardita, M., Loddo, V., Palmisano, G., Palmisano, L., and Yurdakal, S. (2012). Overview on Oxidation Mechanisms of Organic Compounds by TiO2 in Heterogeneous Photocatalysis. J. Photochem. Photobiol. C: Photochem. Rev. 13, 224–245. doi:10.1016/j.jphotochemrev.2012.04.003
Augugliaro, V., El Nazer, H. A. H., Loddo, V., Mele, A., Palmisano, G., Palmisano, L., et al. (2010). Partial Photocatalytic Oxidation of Glycerol in TiO2 Water Suspensions. Catal. Today 151, 21–28. doi:10.1016/j.cattod.2010.01.022
Augugliaro, V., Kisch, H., Loddo, V., López-Muñoz, M. J., Márquez-Álvarez, C., Palmisano, G., et al. (2008). Photocatalytic Oxidation of Aromatic Alcohols to Aldehydes in Aqueous Suspension of Home Prepared Titanium Dioxide: 2. Intrinsic and Surface Features of Catalysts. Appl. Catal. A: Gen. 349, 189–197. doi:10.1016/j.apcata.2008.07.038
Bagheri, S., Julkapli, N. M., and Yehye, W. A. (2015). Catalytic Conversion of Biodiesel Derived Raw Glycerol to Value Added Products. Renew. Sust. Energ. Rev. 41, 113–127. doi:10.1016/j.rser.2014.08.031
Behr, A., Eilting, J., Irawadi, K., Leschinski, J., and Lindner, F. (2008). Improved Utilisation of Renewable Resources: New Important Derivatives of Glycerol. Green. Chem. 10, 13–30. doi:10.1039/B710561D
Çetinkaya, S., and Yurdakal, S. (2021). Partial Photocatalytic Oxidations of 3-Pyridinemethanol and 3-Picoline by TiO2 Prepared in HCl, HNO3 and H2SO4 at Different Temperatures. Catal. Today 380, 237–247. doi:10.1016/j.cattod.2020.11.004
Colmenares, J. C., and Luque, R. (2014). Heterogeneous Photocatalytic Nanomaterials: Prospects and Challenges in Selective Transformations of Biomass-Derived Compounds. Chem. Soc. Rev. 43, 765–778. doi:10.1039/C3CS60262A
Criminna, R., Palmisano, G., Della Pina, C., Rossi, and. M., and Pagliaro, M. (2006). One-pot Electrocatalytic Oxidation of Glycerol to DHA. Tetrahedron Lett. 47, 6993–6995. doi:10.1016/j.tetlet.2006.07.123
Cui, X., Kim, H. M., Kawashita, M., Wang, L., Xiong, T., Kokubo, T., et al. (2009). Preparation of Bioactive Titania Films on Titanium Metal via Anodic Oxidation. Dent Mater. 25, 80. doi:10.1016/j.dental.2008.04.012
Dodekatos, G., Abis, L., Freakley, S. J., Tüysüz, H., and Hutchings, G. J. (2018b). Glycerol Oxidation Using MgO- and Al2O3 -supported Gold and Gold-Palladium Nanoparticles Prepared in the Absence of Polymer Stabilizers. ChemCatChem 10, 1351–1359. doi:10.1002/cctc.201800074
Dodekatos, G., Schünemann, S., and Tüysüz, H. (2018a). Recent Advances in Thermo-, Photo-, and Electrocatalytic Glycerol Oxidation. ACS Catal. 8, 6301–6333. doi:10.1021/acscatal.8b01317
Fiorenza, R., Condorelli, M., D’Urso, L., Compagnini, G., Bellardita, M., Palmisano, L., et al. (2020). Catalytic and Photothermo-Catalytic Applications of TiO2-CoOx Composites. Photocat 1 (1), 3–15. doi:10.2174/2665976X01666200219113505
Fraoucene, H., Sugiawati, V. A., Hatem, D., Belkaid, M. S., Vacandio, F., Eyraud, M., et al. (2019). Optical and Electrochemical Properties of Self-Organized TiO2 Nanotube Arrays from Anodized Ti−6Al−4V Alloy. Front. Chem. 7. Article 66. doi:10.3389/fchem.2019.00066
Gholami, Z., Abdullah, A. Z., and Lee, K.-T. (2014). Dealing with the Surplus of Glycerol Production from Biodiesel Industry through Catalytic Upgrading to Polyglycerols and Other Value-Added Products. Renew. Sust. Energ. Rev. 39, 327–341. doi:10.1016/j.rser.2014.07.092
Gong, D., Grimes, C. A., Varghese, O. K., Hu, W., Singh, R. S., Chen, Z., et al. (2001). Titanium Oxide Nanotube Arrays Prepared by Anodic Oxidation. J. Mater. Res. 16, 3331–3334. doi:10.1557/jmr.2001.0457
Huang, J., Zhang, K., and Lai, Y. (2016). Recent Advances in Synthesis, Modification, and Applications of TiO2 Nanotube Arrays by Electrochemical Anodization. Editors M. Aliofkhazraei, and A. S. H. Makhlouf (USA: Springer), 1379–1416. doi:10.1007/978-3-319-15266-0_17
Imbault, A. L., Gong, J., and Farnood, R. (2020). Photocatalytic Production of Dihydroxyacetone from Glycerol on TiO2 in Acetonitrile. RSC Adv. 10, 4956–4968. doi:10.1039/c9ra09434b
Maldotti, A., and Molinari, A. (2011). Design of Heterogeneous Photocatalysts Based on Metal Oxides to Control the Selectivity of Chemical Reactions. Top. Curr. Chem. 303, 185–216. doi:10.1007/128_2011_140
Özcan, L., Mutlu, T., and Yurdakal, S. (2018). Photoelectrocatalytic Degradation of Paraquat by Pt Loaded TiO2 Nanotubes on Ti Anodes. Materials 11, 1715–1733. doi:10.3390/ma11091715
Payormhorm, J., and Idem, R. (2020). Synthesis of C-Doped TiO2 by Sol-Microwave Method for Photocatalytic Conversion of Glycerol to Value-Added Chemicals under Visible Light. Appl. Catal. A: Gen. 590, 117362. doi:10.1016/j.apcata.2019.117362
Rangarajan, G., Pal, R., and Farnood, R. (2021). Visible Light Driven Selective Photocatalytic Synthesis of High-Value Carbonyl Compounds from Glycerol over Ag-AgBr/TiO2 Nanocomposites in Acetonitrile. Mater. Lett. 292, 129535. doi:10.1016/j.matlet.2021.129535
Roy, P., Berger, S., and Schmuki, P. (2011). TiO2 Nanotubes: Synthesis and Applications. Angew. Chem. Int. Ed. Engl. 50, 2904–2939. doi:10.1002/anie.201001374
Sing, K. S. W., Everett, D. H., Haul, R. A. W., Moscou, L., Pierotti, R. A., Rouquerol, J., et al. (1985). Reporting Physisorpting Data for Gas/solid Systems with Special Reference to the Determination of Surface Area and Porosity. Pure Appl. Chem. 57, 603–619. doi:10.1351/pac198557040603
Spasiano, D., Marotta, R., Di Somma, I., and Mancini, G. (2015a). Production of Pyridinecarboxy Aldehydes, Nicotinic and Isonicotinic and Picolinic Acids by TiO2-Sacrificial Photocatalysis at Ambient Conditions and in Aqueous Solution through Artificial Solar Radiation. Appl. Catal. B: Environ. 163, 248–257. doi:10.1016/j.apcatb.2014.08.002
Spasiano, D., Marotta, R., Malato, S., Fernandez-Ibañez, P., and Di Somma, I. (2015b). Solar Photocatalysis: Materials, Reactors, Some Commercial, and Pre-industrialized Applications. A Comprehensive Approach. Appl. Catal. B: Environ. 170-171, 90–123. doi:10.1016/j.apcatb.2014.12.050
Spasiano, D., Raspolini, L., Satyro, S., Mancini, G., Pirozzi, F., and Marotta, R. (2016). The Role of Superficial Radicals in the Kinetic Modeling of 3-pyridinemethanol and 3-pyridinecarboxyaldehyde Selective Oxidation to Vitamin B3 in Water by Means of a TiO2/Cu(II)/UV-solar Photocatalytic System. Chem. Eng. J. 283, 1176–1186. doi:10.1016/j.cej.2015.08.026
Yang, F., Feng, X., Ge, F., Zhang, T., Qi, J., Li, D., et al. (2019). Rapid Growth of Titanium Oxide Nanotubes under the Critical Breakdown Voltage: Evidence against the Dissolution Reaction of Fluoride Ions. Electrochemistry Commun. 103, 17–21. doi:10.1016/j.elecom.2019.04.010
Yang, F., Hanna, M. A., and Sun, R. (2012). Value-added Uses for Crude Glycerol a Byproduct of Biodiesel Production. Biotechnol. Biofuels. 5, 13. doi:10.1186/1754-6834-5-13
Yurdakal, S., Augugliaro, V., Loddo, V., Palmisano, G., and Palmisano, L. (2012). Enhancing Selectivity in Photocatalytic Formation of p‐Anisaldehyde in Aqueous Suspension under Solar Light Irradiation via TiO2 N-Doping. New J. Chem. 36, 1762. doi:10.1039/C2NJ40394C
Yurdakal, S., Çetinkaya, S., Şarlak, M. B., Özcan, L., Loddo, V., and Palmisano, L. (2020). Photoelectrocatalytic Oxidation of 3-Pyridinemethanol to 3-Pyridinemethanal and Vitamin B3 by TiO2 Nanotubes. Catal. Sci. Technol. 10, 124–137. doi:10.1039/c9cy01583c
Yurdakal, S., Garlisi, C., Özcan, L., Bellardita, M., and Palmisano, G. (2019). (Photo)catalyst Characterization Techniques: Adsorption Isotherms and BET, SEM, FTIR, UV-Vis, Photoluminescence, and Electrochemical Characterizations, Heterogeneous Photocatalysis: Relationships with Heterogeneous Catalysis and Perspectives. Editors G. Marci, and L. Palmisano (Netherlands: Elsevier), 87–152. doi:10.1016/B978-0-444-64015-4.00004-3
Yurdakal, S., Yanar, Ş. Ö., Çetinkaya, S., Alagöz, O., Yalçın, P., and Özcan, L. (2017). Green Photocatalytic Synthesis of Vitamin B3 by Pt Loaded TiO2 Photocatalysts. Appl. Catal. B: Environ. 202, 500–508. doi:10.1016/j.apcatb.2016.09.063
Keywords: glycerol, 3-pyridinemethanol, nanotube structured TiO2, heterogeneous photocatalysis, selective oxidation, vitamin B3, green synthesis
Citation: Çetinkaya S, Khamidov G, Özcan L, Palmisano L and Yurdakal S (2022) Selective Photocatalytic Oxidation of Glycerol and 3-Pyridinemethanol by Nanotube/Nanowire-Structured TiO2 Powders Obtained by Breakdown Anodization. Front. Chem. 10:856947. doi: 10.3389/fchem.2022.856947
Received: 17 January 2022; Accepted: 14 March 2022;
Published: 12 May 2022.
Edited by:
Kamila Kočí, VŠB-Technical University of Ostrava, CzechiaReviewed by:
Libor Čapek, University of Pardubice, CzechiaEwelina Kusiak-Nejman, West Pomeranian University of Technology, Poland
Copyright © 2022 Çetinkaya, Khamidov, Özcan, Palmisano and Yurdakal. This is an open-access article distributed under the terms of the Creative Commons Attribution License (CC BY). The use, distribution or reproduction in other forums is permitted, provided the original author(s) and the copyright owner(s) are credited and that the original publication in this journal is cited, in accordance with accepted academic practice. No use, distribution or reproduction is permitted which does not comply with these terms.
*Correspondence: Sedat Yurdakal, c2VkYXR5dXJkYWthbEBnbWFpbC5jb20=