 Yuanzhong Lin
 Jian Chen1
 Jiawei Yan
 Chenyang Zhao
95% of researchers rate our articles as excellent or good
Learn more about the work of our research integrity team to safeguard the quality of each article we publish.
Find out more
ORIGINAL RESEARCH article
Front. Chem. , 22 March 2022
Sec. Electrochemistry
Volume 10 - 2022 | https://doi.org/10.3389/fchem.2022.851264
This article is part of the Research Topic Material and Structural Designs for Metal Ion Energy Storage Devices View all 14 articles
Solid-state electrolyte (SSE), as the core component of solid-state batteries, plays a critical role in the performance of the batteries. Currently, the development of SSE is still hindered by its high price, low ionic conductivity, and poor interface stability. In this work, we report the tailored synthesis of a high ionic conductive and low cost sulfide SSE for all-solid-state lithium batteries. The Li10.35Si1.35P1.65S12 with favorable tetragonal structure was synthesis by increasing the concentration of Si4+, which shows an ionic conductivity of 4.28 × 10⁻³ S cm−1 and a wide electrochemical stability window of up to 5 V. By further modifying the composition of the electrolyte via ionic doping, the ionic conductivity of Li10.35Si1.35P1.65S12 can be further enhanced. Among them, the 1% Co4+-doped Li10.35Si1.35P1.65S12 shows the highest ionic conductivity of 6.91 × 10⁻³ S cm−1, 40% higher than the undoped one. This can be attributed to the broadened MS4− tetrahedrons and increased Li+ concentration. As a demonstration, an all-solid-state Li metal battery was assembled using TiS2 as the cathode and 1% Co4+-doped Li10.35Si1.35P1.65S12 as the electrolyte, showing capacity retention of 72% at the 110th cycle. This strategy is simple and can be easily extended for the construction of other high-performance sulfide SSEs.
With the gradual popularity of electric vehicles, the safety issues of lithium-ion batteries and mileage anxiety have become the biggest obstacles that hinder their further development (Chen et al., 2021). Regarding these, solid-state batteries are considered as one of the most promising solutions. On the one hand, by using solid-state electrolyte (SSE), batteries can reduce or even completely avoid the use of flammable organic liquid electrolyte, which can effectively avoid the spontaneous combustion of batteries in special circumstances (Bates et al., 1992; Dudney et al., 1992; Manthiram et al., 2017); on the other hand, solid-state batteries can use lithium metal and high-voltage cathode materials as electrode materials, which increases the energy density of batteries and reduces mileage anxiety (De Luna et al., 2021). At present, the SSE still cannot meet the requirements of commercial applications. The major problems are low ion conductivity, high production cost, and poor stability with electrodes (Porz et al., 2017; Kim et al., 2021).
Since the discovery of 2011, Li10GeP2S12 (LGPS) SSE has attracted increasing attention due to its extremely high ionic conductivity, which is comparable to commercial liquid electrolyte (Kanno and Murayama, 2001; Kamaya et al., 2011). However, its high production cost and poor stability with lithium metal restrict its large-scale applications (Wenzel et al., 2016; Chen et al., 2017; Madsen et al., 2020). As the same main group of Ge, Si is the second rich element in the Earth’s crust. The replacement of Si to Ge will significantly reduce the cost of the electrolyte. More importantly, it is predicted that Si-substituted electrolyte (LiSiPS) has the same body-centered cubic-like anion framework as LGPS, which allows fast Li+ hops along the c-axis (Wang et al., 2015; Harm et al., 2019). However, the preparation of phase-pure LGPS-type Li10SiP2S12 was not successful due to the small ionic radius of Si4+ (Ong et al., 2013; Kuhn et al., 2014; Zhang et al., 2019). The ionic conductivity of LiSiPS is far lower than expected and needs to be further enhanced for battery applications (Kato et al., 2014; Kuhn et al., 2014; Kato et al., 2016; Sun et al., 2017; Chen et al., 2018; Wu et al., 2018).
In the LGPS-type electrolyte, the MS4 tetrahedron center is occupied by metal cations and P5+ (De Luna et al., 2021). The radii of cations directly affect the size of the tetrahedron and the crystal structure stability. Because of the smaller radius of Si4+ (0.026 nm) compared to Ge4+ (0.039 nm), the structure of Li10SiP2S12 changes to orthorhombic, which is less favorable for Li+ transport (Shannon, 1976). On one hand, increasing the concentration of Si4+ can partially compensate the volume loss [P5+ (0.017 nm) is replaced by Si4+ (0.026 nm)] and is believed to enhance the stability of LiSiPS (Kondo et al., 1992; Murayama et al., 2002; Whiteley et al., 2014). The non-equivalent substitution can also increase the concentration of Li+ due to charge compensation, which is beneficial for Li+ transport. On the other, the introduction of other metal ions with ionic radius close to Ge4+ will largely expand the size of the tetrahedrons and reduce the Li+ transport resistance. By further modifying the composition of the ionic framework, the interaction between Li+ and the host may be even weakened (Adams and Rao, 2012; Bron et al., 2016; Kim and Martin, 2019).
On the basis of the above assumption, in this work, a low-cost and high ionic conductive LGPS-type LiSiPS was prepared through composition regulation and doping. The Li10.35Si1.35P1.65S12 obtained shows high ionic conductivity of 4.28 × 10⁻³ S cm−1 at room temperature and good electrochemical stability up to 5 V. Doping Li10.35Si1.35P1.65S12 with Co4+, which is equivalent to Si4+ but has a larger radius than Si4+, broadens the MS4 tetrahedrons and reduces the Li+ transmission resistance. The 1% Co4+-doped Li10.35Si1.35P1.65S12 shows the best electrochemical performances. It has an ionic conductivity of 6.91 × 10⁻³ S cm−1 and a Li+ migration number as high as 0.97. The ion conductivity is about 40% higher than that of undoped sample. The assembled Li/SSE/TiS2 all-solid-state lithium battery shows stable lifespan of more than 100 cycles with a specific discharge capacity of 70 mAh g−1 (Li et al., 2016). Finally, to verify the effect of anion doping on the performance of the SSE, Se2−, which has a larger radius than S2−, was introduced and a CoSe2-doped LiSiPS sulfide SSE was prepared. The enhanced ionic conductivity can be attributed to the large ion radius of Se2−, which widens the migration channel for Li+, and the larger polarization characteristics of Se2− that effectively reduce the affinity to Li+.
The LiSiPS SSEs were synthesized by high-energy ball milling process followed by thermal annealing. Stoichiometric proportion of Li2S, SiS2 and P2S5 and 10 zirconia balls (10 mm in diameter) were added to the ball mill tank in an Ar-filled glove box. The mixture was ball milled for 40 h at 500 rpm. A 15-min rest was set after 15-min ball milling to avoid overheat of the machine. The ground powder was put into a quartz tube and sealed under vacuum. The LiSiPS SSEs were finally obtained by heat treatment at 400°C–500°C for 3 days and naturally cooled to room temperature. The modification of the LiSiPS SSEs was carried out under the same conditions except the addition of a certain amount of CoS2, TiS2, and CoSe2. The doping ratio (0%, 0.5%, 1%, 2%, and 3%) refers to the proportion of M4+:Si4+ (M = Si4+, Ti4+).
The crystal structure was characterized by X-ray diffraction (XRD; D8ADVANCE) with a Cu Kα source between 10° and 80°. The morphology and microstructure of the samples were characterized by scanning electron microscope (SEM; JSM-7800F) with acceleration voltage of 30 kV. The molecular vibrations and rotations were characterized by Raman spectra with a wavelength of 532 nm in range of 200–4,000 cm−1. The surface elements and chemical states of the samples were characterized by X-ray photoelectron spectroscopy (XPS; K-Alpha+).
The ionic conductivity was measured by sandwiching the electrolyte pellets between two stainless steel sheets after hot-pressed at 380 MPa at 250°C. Electrochemical impedance spectroscopy (EIS) at frequencies from 1 MHz to 10 Hz was performed on the blocking cells with amplitude of 10 mV. The Li+ migration number (tLi+) was measured by Li/SSE/Li symmetric cell based on the following equation:
where V is the voltage applied; I0 is the initial current; Rb0 is the initial bulk resistance of SSE; Ri0 is the initial resistance of the passivation layer; and Iss, Rbss, and Riss are the current, bulk resistance of SSE, and the resistance of the passivation layer at steady state, respectively. The chemical stability to Li metal was measured using the same symmetric cell. The current density and duration time were set as 0.05 mA cm−2 and 1 h, respectively. The electrochemical window of electrolyte was estimated by Cyclic Voltammetry (CV) with stainless steel sheet and Li foil as the electrodes. The sample was scanned between −0.5 and 5 V with a scan rate of 1 mV s−1.
To avoid the direct contact between the sulfide SSE and lithium metal, a fluorination of lithium metal was conducted (Fan et al., 2018). A certain amount of Lithiumbis (fluorosulfonyl)imide was added to anhydrous DME to get a 6 mol L−1 LiFSI-DME solution. The solution was then dropped on both sides of the lithium metal. The 10-mm lithium foil was then placed on the surface of the SSE pellets and dried overnight in a vacuum oven at 120°C. The cathode was prepared by mixing TiS2, acetylene black, and SSE with a mass ratio of 5:1:4. They were first manually mixed in a mortar for 10 min and then ball-milled for 6 h at 500 rpm. The powder sample after ball milling was used as composite cathode material for all-solid-state lithium battery.
For the battery assembly, 60-mg SSE was added into a custom mold and pressed into pellets at 250 MPa. Then, the composite cathode material was added to the upper side of the electrolyte and pressed under a pressure of 375 MPa for 5 min. The areal density of TiS2 was ca. 4 mg cm−2. After compaction, the fluorinated lithium metal was put onto the other side of the SSE. The battery was cycled between 1.5 and 3 V at 0.1 C.
The structure of the synthesized Li10.35Si1.35P1.65S12 SSE was first analyzed by XRD and Raman. The normalized XRD patterns are shown in Figure 1A. All the diffraction peaks are in good consistent with LGPS, indicating the successful synthesis of phase-pure tetragonal Li10.35Si1.35P1.65S12 with a space group of P42/nmc (137). Compared to LGPS, the Li10.35Si1.35P1.65S12 has higher content of tetravalent center ions, which enhances the stability of the body-centered cubic-like anion framework (Kuhn et al., 2014). The sample synthesized between 400°C and 500°C exhibits identical XRD patterns. Among them, the sample at 470°C shows the highest crystallinity. The Raman spectrum of the Li10.35Si1.35P1.65S12 (470°C) is shown in Figure 1B. The peaks at 275, 420, 550, and 575 cm−1 are attributed to the characteristic signals of PS43−, whereas the peak at 390 cm−1 comes from the stretching vibration of Si-S− bond in SiS44-(Pradel and Ribes, 1989). The above results confirmed the successful synthesis of the desirable LGPS-type Li10.35Si1.35P1.65S12 SSE.
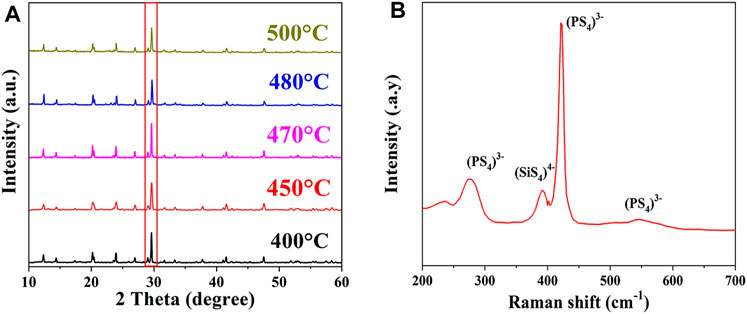
FIGURE 1. XRD patterns of Li10.35Si1.35P1.65S12 synthesized at different temperatures (A) and typical Raman spectrum of the Li10.35Si1.35P1.65S12 (B).
The morphologies of Li10.35Si1.35P1.65S12 synthesized at different temperatures are shown in Figure 2. All the electrolyte powders are composed of micron-sized granules with irregular shape. From the high-resolution view, it can be seen that the electrolyte synthesized at 470°C has higher degree of particle agglomerations. This is beneficial to reduce the interface impedance of the electrolyte and promote Li+ transfer across the grain boundaries. The ionic conductivity of Li10.35Si1.35P1.65S12 was then measured by EIS. To lower the interface impedance inside the electrolyte, the samples were hot presses to make the power more compact and denser. The impedances of Li10.35Si1.35P1.65S12 synthesized at 470°C were tested under different temperature and pressure, and the results are shown in Supplementary Figure S8. As shown in Supplementary Figure S8, the sample treated at 375 MPa and 250°C shows the lowest resistance. Therefore, they are chosen as the optimized hot pressing parameters unless otherwise specified. Figure 3A shows the Nyquist plots of the samples.
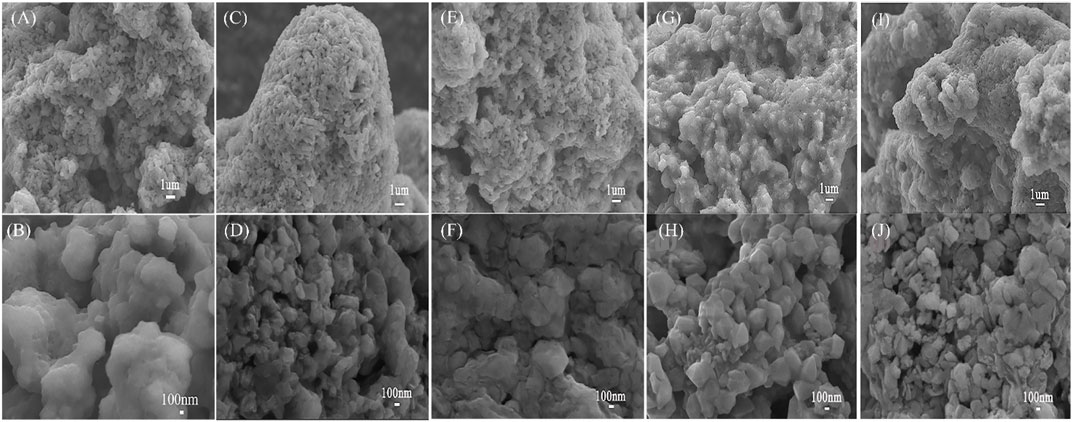
FIGURE 2. SEM images of Li10.35Si1.35P1.65S12 synthesized at 400°C (A,B), 450°C (C,D), 470°C (E,F), 480°C (G,H), and 500°C (I,J).
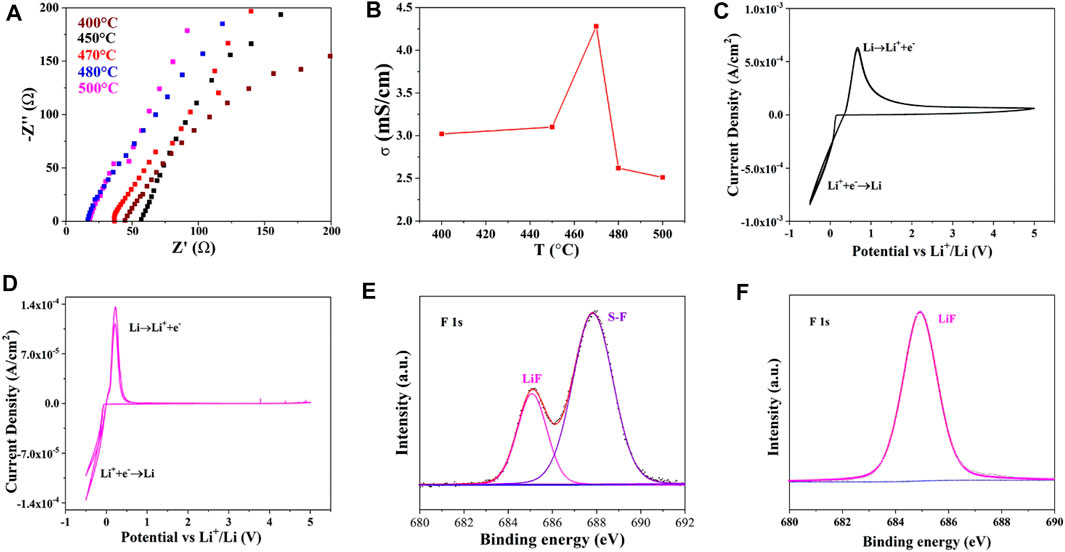
FIGURE 3. Nyquist plots of Li10.35Si1.35P1.65S12 synthesized at different temperatures (A), the corresponding ionic conductivities (B), CV test of Li10.35Si1.35P1.65S12 with pristine lithium metal (C) and modified lithium metal (D) as electrodes, XPS of lithium metal before (E) and after (F) polarization test.
The detailed information is shown in Supplementary Table S1. As shown in Figure 3A, all the plots show the diagonal characteristics, indicating the ionic conductor nature of the electrolytes. The negligible semicircles at high-frequency region signify small grain boundary impedance of the electrolytes. The ionic conductivity of Li10.35Si1.35P1.65S12 increases first with the annealing temperature due to the enhanced crystallinity and reaches 4.28 × 10⁻³ S cm−1 at 470°C (Figure 3B). However, the ionic conductivity decreases with the further increase of the temperature. This may be attributed to the slight decomposition of Li10.35Si1.35P1.65S12, as indicated by the reduced peak intensity in XRD.
The electrochemical window of Li10.35Si1.35P1.65S12 (470°C) was investigated by CV. An asymmetric configuration was adopted using stainless steel and lithium metal as electrodes. As shown in Figure 3C, the sharp peak started at 0 V can be attributed to the Li+ deposition on the lithium metal surface. Its dissolution is found at 0.5 V during the anodic scan. However, the anodic current lasts throughout the test window, indicating a continuous interface reaction between Li and Li10.35Si1.35P1.65S12. To avoid this, a thin layer of LiF was in situ deposited to prevent the direct contact between them (details seen in the experimental section) (Porz et al., 2017). The XPS spectrum of the modified lithium is shown in Figure 3E. The characteristic peak at 685 eV is assigned to LiF, confirming the successful formation of LiF protection layer. The peak that appears at 687.8 eV corresponds to S-F bonds of LiFSI precursor, which further reacts with Li and converts to LiF during the following electrochemical reaction (Figure 3F). As a result, the interface side reaction is largely suppressed. As shown in Figure 3D, only one pair of redox peaks corresponding to
The ionic migration number of Li10.35Si1.35P1.65S12 (470°C) was then measured to confirm the proportion of Li+ transport in the electrolyte. As shown in Figures 4A,B, the total impedance increases from 363.4 to 384.2 Ω due to the space charge separation at the interface. The polarization current decreases from initial 1.69 × 10⁻⁵ A to steady state 1.42 × 10⁻⁵ A. The ionic migration number was calculated to be 0.83 according to Eq. 1. The high ionic migration number explains the high ionic conductivity of Li10.35Si1.35P1.65S12, especially compared with polymer and oxide SSEs. The ability of Li10.35Si1.35P1.65S12 to inhibit the growth of Li dendrites was evaluated using Li/SSE/Li symmetrical cell. As shown in Figure 4C, with the increase of current density from 0.1 mA cm−2 to 2 mA cm−2, the overpotential increases from 0.3 to 13.3 mV without short circuit. This result indicates that the limiting current density of Li10.35Si1.35P1.65S12 is higher than 2 mA cm−2. Figure 4D shows the constant-current polarization curve at an areal capacity of 0.05 mAh cm−2. The cell is stable up to 432 h, showing good resistance to the growth of lithium dendrites.
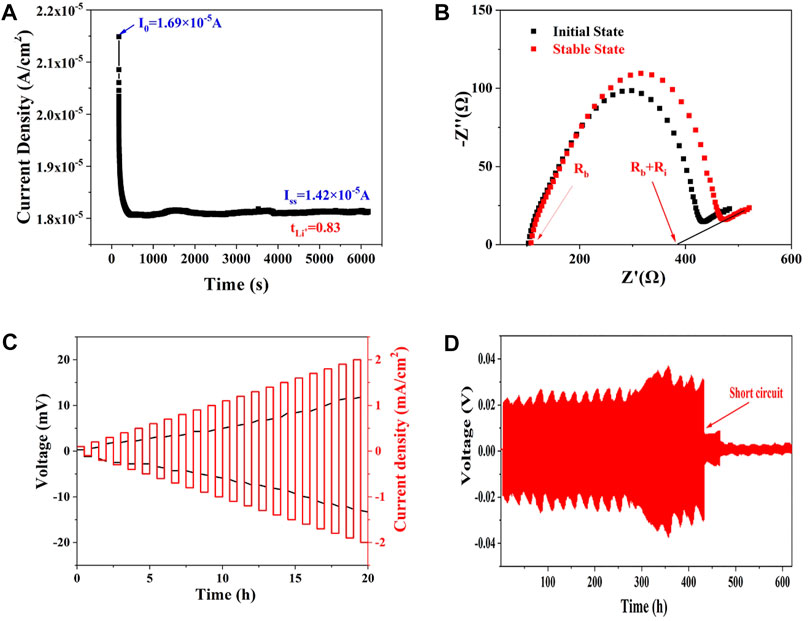
FIGURE 4. The time-current curve of Li/SSE/Li symmetric cell under 10 mV (A), the Nyquist plots of the cell at initial and steady states (B), and polarization curves of the Li/SSE/Li symmetric cell under different current densities (C,D).
To further enhance the ionic conductivity of Li10.35Si1.35P1.65S12, Ti4+ (0.042 nm) and Co4+ (0.04 nm) were introduced into the lattice of Li10.35Si1.35P1.65S12 because of their comparable ionic radii with Ge4+ but much lower price. The XRD patterns of the synthesized CoS2 and TiS2 are shown in Supplementary Figure S1. After ball milling and thermal annealing, Co4+ and Ti4+-doped Li10.35Si1.35P1.65S12 SSE were obtained.
Figure 5A shows the normalized XRD patterns of Co4+-doped Li10.35Si1.35P1.65S12. The position of the peaks match well with Li10.35Si1.35P1.65S12, indicating that the doping of Co4+ does not change the initial tetragonal structure. The crystallinity decreases with the increase of Co4+ content, showing more defects are introduced which can promote the transport of Li+. Unknown impurity appears (15.5°, 25.3°, and 32.3°) when the doping ratio of Co4+ is higher than 2%. The higher content of Co4+ exceeds the limit of the solid solution and leads to the emergence of new phase. It worth to note that peak shifts to higher angles are observed (14.4°, 17.4°, and 20.2°) at relatively low doping ratios (0.5% and 1%). This indicates a constriction of crystal lattice and contradicts with the previous prediction. To explore the crystal parameters after doping, the Rietveld refinement for 1% Co4+-doped Li10.35Si1.35P1.65S12 was carried out. The results are shown in Supplementary Table S2 and Supplementary Figure S2. The 1% Co4+-doped Li10.35Si1.35P1.65S12 shows a P42/nmc space group with lattice constants of a = 8.6731 Å and c = 12.5331 Å. Compared to original Li10.35Si1.35P1.65S12 (a = 8.6708 Å and c = 12.5396 Å), the unit cell expands along the a-direction but shrinks slightly in the c-direction due to the Co4+ doping, resulting in an expansion of the cell volume. This broadens the channels of Li+ transport, which further enhances the ionic conductivity of electrolytes. The XRD patterns of Ti4+-doped Li10.35Si1.35P1.65S12 show similarly characteristics (Supplementary Figure S3). The Raman spectrum of 1% Co-doped Li10.35Si1.35P1.65S124 is shown in Figure 5B. Compared to Li10.35Si1.35P1.65S12, two new peaks emerge at 950 and 2,550 cm−1, which are related to (Co./P)S44− structure. The morphology of the 1% Co4+-doped Li10.35Si1.35P1.65S12 is shown in Figure 5C. It can be seen that most of the electrolyte granules melt together during the thermal treatment, and some are clearly visible on the surface. All the elements are uniformly distributed within the electrolyte, again confirming the successful doping of Co4+.
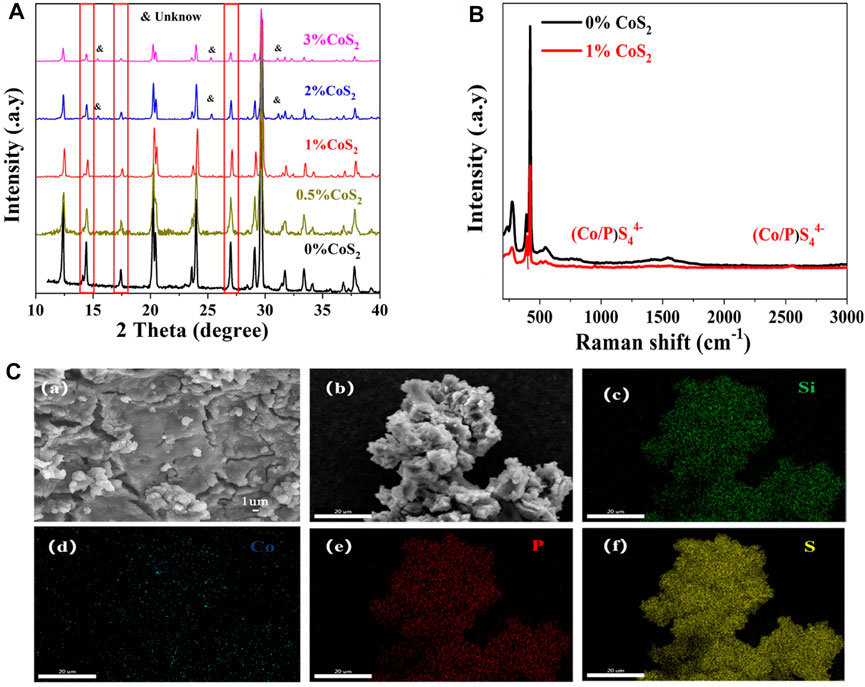
FIGURE 5. XRD patterns of Li10.35Si1.35-xCoxP1.65S12 with different Co4+ doping ratios (A), Raman Spectra of pristine and 1% Co4+-doped electrolytes (B), and SEM and EDS images of 1% Co4+-doped Li10.35Si1.35-xCoxP1.65S12 (C).
The ionic conductivity of Co4+-doped Li10.35Si1.35P1.65S12 was measured by blocking cell. The testing parameters are summarized in Supplementary Table S3. As shown in Figures 6A,B, the ionic conductivity of Li10.35Si1.35P1.65S12 is effectively enhanced by Co4+ doping, and 1% Co4+-doped sample shows the highest ionic conductivity of 6.91 mS cm−1, 40% higher than the undoped one. The enhanced ionic conductivity could be attributed to the LGPS-type anion packing, the higher concentration of Li+ induced by M4+ substitution, and the broadened Li+ transport path. Compared to Co4+, the doping of Ti4+ can also enhance the ionic conductivity of Li10.35Si1.35P1.65S12 by 15% (5.69 mS cm−1) when 0.5% TiS2 was added, showing the effectiveness of the doping strategy (Suplementary Figure S4). The slightly difference may be attributed to the limited doping ratio of Ti4+. The electrochemical windows of the Co4+-doped samples were studied using asymmetrical cell. Figure 6C and Suplementary Figure S5 show the CV curves of 0.5%, 1%, and 2% Co4+-doped Li10.35Si1.35P1.65S12. Only one pair of redox peak at around 0 V is observed for all the samples, indicating that they are electrochemically stable between 0 and 5 V. The ionic migration number of 1% Co4+-doped Li10.35Si1.35P1.65S12 is calculated to be 0.97. The much increased value shows that Co4+ doping can promote the migration of Li+. As a demonstration, a solid-state Li battery was assembled using the 1% Co4+-doped Li10.35Si1.35P1.65S12 as electrolyte and TiS2 as the active material. As shown in Figure 6D, the specific charge capacity of the first cycle is 95.2 mAh g−1, and 72% of the initial capacity can be retained after 110 cycles, showing stable performance in practical use. The low Coulombic efficiency of the first cycle can be attributed to the decomposition of LiFSI precursor, as shown in Figure 3F.
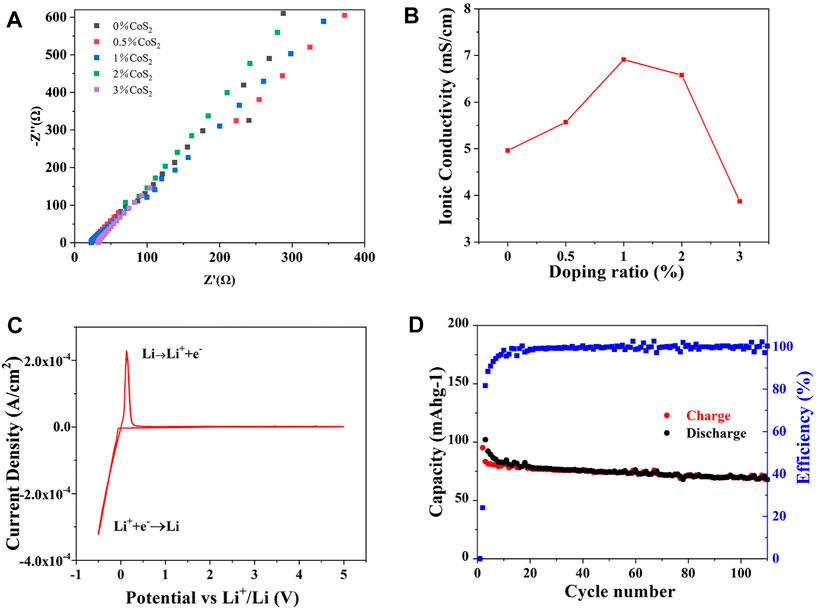
FIGURE 6. Ionic conductivity of Co4+-doped Li10.35Si1.35P1.65S12 (A,B), CV curve of 1% Co4+-doped electrolyte (C), and cycling stability of the all-solid-state lithium battery (D).
The above results have inspired us to further improve the ionic conductivity of Li10.35Si1.35P1.65S12 through dual doping. The Se2− (0.198 nm) has a large ionic radius than S2− (0.184 nm). Similar to Co4+, the proper Se2− anion substitution may also enlarge the diffusion channel of Li+. What is more, the higher polarizability of Se2− can further weaken the binding between Li+ and the anion framework, thus improving the ionic conductivity of Li10.35Si1.35P1.65S12.
CoSe2 was first synthesized by solid-phase reaction. The CoSe2 consists of cubic-shaped particles with size of ca. 1 µm (Supplementary Figure S6), and its XRD is shown in Supplementary Figure S7. After ball milling and thermal treatment, sintered irregular particles are obtained. The normalized XRD patterns of CoSe2-doped Li10.35Si1.35P1.65S12 SSEs are shown in Figure 7A. All the samples exhibit the same LGPS-type structure. With the increase of doping ratio, the peak intensity decreases gradually and some peaks shift to lower angles, similar to the case of CoS2. When the doping ratio of CoSe2 exceeds 1%, the saturation of CoSe2 is reached and impurity phase appears at 26°. The cell parameters of the 1% CoSe2-doped Li10.35Si1.35P1.65S12 were analyzed by Rietveld refinement. The results are shown in Figure 7B and Supplementary Table S4. The dual-doped sample maintains the same tetragonal structure. The lattice parameters are a = 8.677 Å and c = 12.535 Å with a cell volume of 943.835 Å3. These values are larger than that of 1% Co4+-doped sample, indicating the successful doping of Co4+ and Se2− into the lattice of Li10.35Si1.35P1.65S12. The incorporation of Co4+ and Se2− mainly induces the lattice expansion along the a-axis.
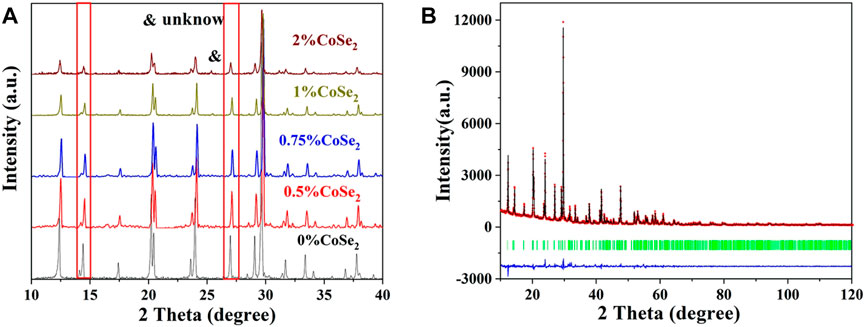
FIGURE 7. XRD pattern of the CoSe2 doping Li10.35Si1.35P1.65S12 (A) and the Rietveld refinement of 1% CoSe2-doped sample (B).
The ionic conductivities of the CoSe2-doped samples were measured by EIS. As shown in Figure 8A, all the samples show negligible grain boundary resistances. With the increase of CoSe2 doping ratio, the impedance first decreases and then increases, and 1% CoSe2-doped sample has the highest ionic conductivity of 6.07 × 10⁻³ S cm−1, slight lower than that of 1% Co4+-doped one. The electronic conductivity of the 1% CoSe2-doped sample was added in Supplementary Figure S9. The electronic conductivity of 1% CoSe2-doped electrolyte was measured to be 1.89 × 10⁻⁷ S cm−1, four orders of magnitude lower than its ionic conductivity. The results show that the doping of Co and Se in the LSiPS system can greatly enhance the ionic conductivity. The ionic conductivity obtained in this work is comparable or even better than the previous reports as shown in Supplementary Table S5.
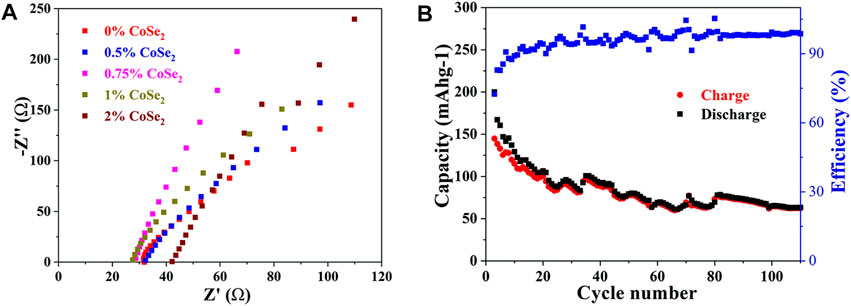
FIGURE 8. (A) Nyquist plots of CoSe2-doped Li10.35Si1.35P1.65S12 (B) Cycling stability of the all-solid-state lithium battery assembled with 1% CoSe2 doped SSE.
An all-solid-state Li battery was then assembled using the 1% CoSe2-doped sample as SSE. The cell shows an initial specific charge capacity 160 mAh g−1 and the reversible specific capacity decreases gradually to 65 mAh g−1 at the end of 100th (Figure 8B). This result shows that, although the incorporation of Se2+ can enlarge the MS4-x2−/Sex2− tetrahedrons, the conductivity of doped Li10.35Si1.35P1.65S12 strongly related to its purity and composition. Further research is still underway and will be reported elsewhere.
In summary, a low-cost and high-quality sulfide SSE Li10.35Si1.35P1.65S12 with favorable tetrahedron structure was synthesized, which was further modified by elemental doping. The 1% Co4+-doped Li10.35Si1.35P1.65S12 maintained body-centered cubic-like anion framework and shows a high ionic conductivity of 6.91 × 10⁻³ S cm−1 due to easy Li+ transport between enlarged tetrahedral sites. A high Li+ transport number of 0.97 and wide electrochemical stability window of up to 5 V are also reached. These interesting characteristics endow the sample with good electrochemical performance when assembled into all-solid-state Li batteries.
The original contributions presented in the study are included in the article/Supplementary Material; further inquiries can be directed to the corresponding author.
YL, JC, and JY contributed to conception and design of the study. YZ and HL performed the data collection. JC performed the analysis. YL wrote the first draft of the manuscript. All authors contributed to manuscript revision, read, and approved the submitted version.
This work is supported by the Overseas High-level Talents Foundation of Shenzhen.
The authors declare that the research was conducted in the absence of any commercial or financial relationships that could be construed as a potential conflict of interest.
All claims expressed in this article are solely those of the authors and do not necessarily represent those of their affiliated organizations or those of the publisher, the editors, and the reviewers. Any product that may be evaluated in this article, or claim that may be made by its manufacturer, is not guaranteed or endorsed by the publisher.
The Supplementary Material for this article can be found online at: https://www.frontiersin.org/articles/10.3389/fchem.2022.851264/full#supplementary-material
Adams, S., and Rao, R. P. (2012). Structural Requirements for Fast Lithium Ion Migration in Li10GeP2S12. J. Mater. Chem. 22, 7687–7691. doi:10.1039/c2jm16688g
Bates, J., Dudney, N. J., Gruzalski, G. R., Zuhr, R. A., Choudhury, A., Luck, C. F., et al. (1992). Electrical Properties of Amorphous Lithium Electrolyte Thin Films. Solid State Ionics 53-56, 647–654. doi:10.1016/0167-2738(92)90442-r
Bron, P., Dehnen, S., and Roling, B. (2016). Li10Si0.3Sn0.7P2S12 - A Low-Cost and Low-Grain-Boundary-Resistance Lithium Superionic Conductor. J. Power Sourc. 329, 530–535. doi:10.1016/j.jpowsour.2016.08.115
Chen, B., Ju, J., Ma, J., Zhang, J., Xiao, R., Cui, G., et al. (2017). An Insight into Intrinsic Interfacial Properties between Li Metals and Li10GeP2S12 Solid Electrolytes. Phys. Chem. Chem. Phys. 19, 31436–31442. doi:10.1039/c7cp05253g
Chen, S., Xie, D., Liu, G., Mwizerwa, J. P., Zhang, Q., Zhao, Y., et al. (2018). Sulfide Solid Electrolytes for All-Solid-State Lithium Batteries: Structure, Conductivity, Stability and Application. Energ. Storage Mater. 14, 58–74. doi:10.1016/j.ensm.2018.02.020
Chen, Y., Kang, Y., Zhao, Y., Wang, L., Liu, J., Li, Y., et al. (2021). A Review of Lithium-Ion Battery Safety Concerns: The Issues, Strategies, and Testing Standards. J. Energ. Chem. 59, 83–99. doi:10.1016/j.jechem.2020.10.017
De Luna, Y., Abdullah, M., Dimassi, S. N., and Bensalah, N. (2021). All-Solid Lithium-Sulfur Batteries: Present Situation and Future Progress. Ionics 27, 4937–4960. doi:10.1007/s11581-021-04284-7
Dudney, N., Bates, J. B., Zuhr, R. A., Luck, C. F., and Robertson, J. D. (1992). Sputtering of Lithium Compounds for Preparation of Electrolyte Thin Films. Solid State Ionics 53-56, 655–661. doi:10.1016/0167-2738(92)90443-s
Fan, X., Ji, X., Han, F., Yue, J., Chen, J., Chen, L., et al. (2018). Fluorinated Solid Electrolyte Interphase Enables Highly Reversible Solid-State Li Metal Battery. Sci. Adv. 4 (12), eaau9245. doi:10.1126/sciadv.aau9245
Harm, S., Hatz, A.-K., Moudrakovski, I., Eger, R., Kuhn, A., Hoch, C., et al. (2019). Lesson Learned from NMR: Characterization and Ionic Conductivity of LGPS-Like Li7SiPS8. Chem. Mater. 31, 1280–1288. doi:10.1021/acs.chemmater.8b04051
Kamaya, N., Homma, K., Yamakawa, Y., Hirayama, M., Kanno, R., Yonemura, M., et al. (2011). A Lithium Superionic Conductor. Nat. Mater 10, 682–686. doi:10.1038/nmat3066
Kanno, R., and Murayama, M. (2001). Lithium Ionic Conductor Thio-LISICON - The Li2S-GeS2-P2S5 System. J. Electrochem. Soc. 148, A742–A746. doi:10.1149/1.1379028
Kato, Y., Hori, S., Saito, T., Suzuki, K., Hirayama, M., Mitsui, A., et al. (2016). High-Power All-Solid-State Batteries Using Sulfide Superionic Conductors. Nat. Energ. 1, 16030. doi:10.1038/nenergy.2016.30
Kato, Y., Saito, R., Sakano, M., Mitsui, A., Hirayama, M., and Kanno, R. (2014). Synthesis, Structure and Lithium Ionic Conductivity of Solid Solutions of Li10(Ge1−M)P2S12 (M = Si, Sn). J. Power Sourc. 271, 60–64. doi:10.1016/j.jpowsour.2014.07.159
Kim, K.-H., and Martin, S. W. (2019). Structures and Properties of Oxygen-Substituted Li10SiP2S12-xOx Solid-State Electrolytes. Chem. Mater. 31, 3984–3991. doi:10.1021/acs.chemmater.9b00505
Kim, K. J., Balaish, M., Wadaguchi, M., Kong, L., and Rupp, J. L. M. (2021). Solid‐State Li-Metal Batteries: Challenges and Horizons of Oxide and Sulfide Solid Electrolytes and Their Interfaces. Adv. Energ. Mater. 11, 2002689. doi:10.1002/aenm.202002689
Kondo, S., Takada, K., and Yamamura, Y. (1992). New Lithium Ion Conductors Based on Li2s-Sis2 System. Solid State Ionics 53-56, 1183–1186. doi:10.1016/0167-2738(92)90310-l
Kuhn, A., Gerbig, O., Zhu, C., Falkenberg, F., Maier, J., and Lotsch, B. V. (2014). A New Ultrafast Superionic Li-Conductor: Ion Dynamics in Li11Si2PS12 and Comparison with Other Tetragonal LGPS-type Electrolytes. Phys. Chem. Chem. Phys. 16, 14669–14674. doi:10.1039/c4cp02046d
Li, W. J., Hirayama, M., Suzuki, K., and Kanno, R. (2016). Fabrication and All Solid-State Battery Performance of TiS2/Li10GeP2S12 Composite Electrodes. Mater. Trans. 57, 549–552. doi:10.2320/matertrans.Y-M2016804
Madsen, K. E., Bassett, K. L., Ta, K., Sforzo, B. A., Matusik, K. E., Kastengren, A. L., et al. (2020). Direct Observation of Interfacial Mechanical Failure in Thiophosphate Solid Electrolytes with Operando X‐Ray Tomography. Adv. Mater. Inter. 7, 2000751. doi:10.1002/admi.202000751
Manthiram, A., Yu, X., and Wang, S. (2017). Lithium Battery Chemistries Enabled by Solid-State Electrolytes. Nat. Rev. Mater. 2, 16103. doi:10.1038/natrevmats.2016.103
Murayama, M., Kanno, R., Irie, M., Ito, S., Hata, T., Sonoyama, N., et al. (2002). Synthesis of New Lithium Ionic Conductor Thio-LISICON-Lithium Silicon Sulfides System. J. Solid State. Chem. 168, 140–148. doi:10.1006/jssc.2002.9701
Ong, S. P., Mo, Y., Richards, W. D., Miara, L., Lee, H. S., and Ceder, G. (2013). Phase Stability, Electrochemical Stability and Ionic Conductivity of the Li10±1MP2X12 (M = Ge, Si, Sn, Al or P, and X = O, S or Se) Family of Superionic Conductors. Energy Environ. Sci. 6, 148–156. doi:10.1039/c2ee23355j
Porz, L., Swamy, T., Sheldon, B. W., Rettenwander, D., Frömling, T., Thaman, H. L., et al. (2017). Mechanism of Lithium Metal Penetration through Inorganic Solid Electrolytes. Adv. Energ. Mater. 7, 1701003. doi:10.1002/aenm.201701003
Pradel, A., and Ribes, M. (1989). Lithium Chalcogenide Conductive Glasses. Mater. Chem. Phys. 23, 121–142. doi:10.1016/0254-0584(89)90021-7
Shannon, R. D. (1976). Revised Effective Ionic Radii and Systematic Studies of Interatomic Distances in Halides and Chalcogenides. Acta Cryst. Sect A. 32, 751–767. doi:10.1107/s0567739476001551
Sun, Y., Suzuki, K., Hori, S., Hirayama, M., and Kanno, R. (2017). Superionic Conductors: Li10+δ[SnySi1-y]1+δP2−δS12 with a Li10GeP2S12-type Structure in the Li3PS4-Li4SnS4-Li4SiS4 Quasi-Ternary System. Chem. Mater. 29, 5858–5864. doi:10.1021/acs.chemmater.7b00886
Wang, Y., Richards, W. D., Ong, S. P., Miara, L. J., Kim, J. C., Mo, Y., et al. (2015). Design Principles for Solid-State Lithium Superionic Conductors. Nat. Mater 14, 1026–1031. doi:10.1038/nmat4369
Wenzel, S., Randau, S., Leichtweiss, T., Weber, D. A., Sann, J., Zeier, W. G., et al. (2016). Direct Observation of the Interfacial Instability of the Fast Ionic Conductor Li10GeP2S12 at the Lithium Metal Anode. Chem. Mater. 28, 2400–2407. doi:10.1021/acs.chemmater.6b00610
Whiteley, J. M., Woo, J. H., Hu, E., Nam, K.-W., and Lee, S.-H. (2014). Empowering the Lithium Metal Battery through a Silicon-Based Superionic Conductor. J. Electrochem. Soc. 161, A1812–A1817. doi:10.1149/2.0501412jes
Wu, F., Fitzhugh, W., Ye, L., Ning, J., and Li, X. (2018). Advanced Sulfide Solid Electrolyte by Core-Shell Structural Design. Nat. Commun. 9, 4037. doi:10.1038/s41467-018-06123-2
Keywords: sulfide solid-state electrolyte, solid-state battery, Li10.35Si1.35P1.65S12, ionic conductivity, cation substitution
Citation: Lin Y, Chen J, Yan J, Zhuang Y, Lu H and Zhao C (2022) Synthesis and Modification of Tetrahedron Li10.35Si1.35P1.65S12 via Elemental Doping for All-Solid-State Lithium Batteries. Front. Chem. 10:851264. doi: 10.3389/fchem.2022.851264
Received: 09 January 2022; Accepted: 21 February 2022;
Published: 22 March 2022.
Edited by:
Yu Ding, University of Maryland, United StatesReviewed by:
Wenwu Li, Guangdong University of Technology, ChinaCopyright © 2022 Lin, Chen, Yan, Zhuang, Lu and Zhao. This is an open-access article distributed under the terms of the Creative Commons Attribution License (CC BY). The use, distribution or reproduction in other forums is permitted, provided the original author(s) and the copyright owner(s) are credited and that the original publication in this journal is cited, in accordance with accepted academic practice. No use, distribution or reproduction is permitted which does not comply with these terms.
*Correspondence: Chenyang Zhao, Y3l6aGFvQHN6dS5lZHUuY24=
Disclaimer: All claims expressed in this article are solely those of the authors and do not necessarily represent those of their affiliated organizations, or those of the publisher, the editors and the reviewers. Any product that may be evaluated in this article or claim that may be made by its manufacturer is not guaranteed or endorsed by the publisher.
Research integrity at Frontiers
Learn more about the work of our research integrity team to safeguard the quality of each article we publish.