 Jinjian Hou
 Shuanglong Lin4
 Hong Sui
- 1School of Chemical Engineering and Technology, Tianjin University, Tianjin, China
- 2National Engineering Research Centre of Distillation Technology, Tianjin, China
- 3Collaborative Innovation Center of Chemical Science and Engineering, Tianjin, China
- 4School of Chemical Engineering, Shijiazhuang University, Shijiazhuang, China
Surfactants adsorption onto carbonate reservoirs would cause surfactants concentrations decrease in surfactant flooding, which would decrease surfactant efficiency in practical applications of enhanced oil recovery (EOR) processes. Different surfactants could be classified as cationic surfactants, anionic surfactants, non-ionic surfactants according to the main charge, or be classified as chemical surfactant and bio-surfactant according to the surfactant origin. However, the research on different type surfactants adsorption on carbonate reservoirs surface differences was few. Therefore, five representative surfactants (CTAB, SDS, TX-100, sophorolipid, rhamonilipid) adsorption effect onto carbonate reservoirs surface was studied. Owing to the fact that the salinity and temperature in underground carbonate reservoirs were high during the EOR process, it is vital to study the salinity effect and temperature effect on surfactant adsorption. In this study, different surfactants species, temperature and salinity adsorption onto carbonate reservoirs were studied. The adsorption isotherms were fitted by Langmuir, Freundlich, Temkin and Linear models, and the first three models fitting effect were good. The results showed that cationic surfactants adsorption quantity was higher than anionic surfactants, and the non-ionic surfactants adsorption quantity was the lowest. When the temperature increased, the surfactants adsorption would decrease, because the adsorption process was exothermic process, and increasing temperature would inhibit the adsorption. The higher salinity would increase surfactants adsorption because higher salinity could compress electric double layer. In order to decrease surfactants adsorption, SiO2 nanoparticles and TiO2 nanoparticles were added to surfactants solutions, and then surfactants could adsorb onto nanoparticles surface, then the steric hindrance between surfactant molecules would increase, which could decrease surfactants adsorption. Contact angle results indicated that surfactants adsorption made the carbonate reservoir wettability alteration. In the end, surfactants (with or without SiO2 nanoparticles) adsorption onto carbonate reservoirs mechanism were studied by molecular dynamics simulation. The simulation results indicated that the surfactants molecules could adsorb onto SiO2 nanoparticles surface, and then the surfactants adsorption quantity onto carbonate rocks would decrease, which was in accordance with the experiments results.
1 Introduction
In recent years, enhanced oil recovery technology has attracted extensive attention,surfactants have been widely used in the enhanced oil recovery process (Kumar et al., 2017; Saxena et al., 2017). The surfactants could decrease oil/water interfacial tension, alter the rocks surface wettability from oil-wet to water-wet, overcome capillary force, so as to improve the crude oil recovery (Kumar et al., 2008; Song et al., 2013; Das et al., 2018; Nikseresht et al., 2020). However, the loss of surfactant at the rock-water interface would decrease surfactants concentration, then decrease the surfactants efficiency of EOR process (Tangparitkul et al., 2018). The loss of surfactant can occur from the adsorption of surfactant onto reservoir surfaces (Liu et al., 2021). In addition, surfactants adsorption would influence solid surface wettability, and alter the surface property (Altamash et al., 2021; Hou and Sun 2021). Therefore, it is necessary for us to study the mechanism of surfactants adsorption on the rocks surface (Kania et al., 2021; Yusuf et al., 2021).
In recent years, the behaviors of surfactants adsorption on the minerals surface have been widely studied (Amirianshoja et al., 2013; Kumar and Mandal 2019). In recent years, many researchers focused on the carbonate rocks enhanced oil recovery, and the ions concentrations and species would influence the carbonate rocks wettability, and then influence the oil recovery (Koleini et al., 2019a; Dehaghani and Badizad 2019). Amit Kumar et al.(Kumar and Mandal 2019) studied the adsorption behavior of the zwitterionic surfactant on the sandstone and carbonate surface, and the results showed when the salinity increased, the surfactants adsorption quantity would increase, and the adsorption would alter sandstone and carbonate surface more hydrophilic. M. Tariq et al.(Tariq et al., 2019) studied the adsorption and viscoelastic behaviour of ionic liquid surfactants of on gold surfaces. The results showed that the ionic liquids surfactants adsorption quantity was low, and the surfactants aggregation would increase the surfactants adsorption quantity. The surfactants adsorption onto rock surface could be controlled by the surface charge of rocks and surfactants (Liu et al., 2021; Ruan et al., 2021).
Although many researches focus on the behavior of surfactants adsorption on the minerals surface, there are still some shortcomings in the previous study, as was shown as follows: 1) In the previous, most researches were focused on the chemical surfactants adsorption onto carbonate rocks, but the research on biosurfactants adsorption behavior was few. Besides, the cationic surfactant, anionic surfactant and non-ionic surfactant adsorption differences were unclear. 2) Many researches were conducted at ambient conditions, but there exist high temperature and high salinity in actual surfactant enhanced oil recovery process, but the temperature or salinity effect on surfactant adsorption was less. 3) Most researches only focused on the surfactants adsorption behavior, but the methods to decrease surfactants adsorption was few. 4) Molecular dynamics simulation was used to simulate the enhanced oil recovery process (Fan et al., 2018; Koleini et al., 2019b; Dehaghani et al., 2019; Kargozarfard et al., 2020). But the corresponding simulation on surfactants adsorption, surfactants-nanoparticles adsorption was few.
The aim of this research was as follows: 1) to explore surfactants species, temperature, salinity effect on surfactants adsorption onto carbonate rocks surface, and the adsorption isotherms were fitted by Langmuir, Freundlich, Temkin and Linear models; 2) to study SiO2 and TiO2 nanoparticles effect on decreasing surfactants adsorption; 3) to use molecular dynamics simulation to explore the nanoparticles effect on surfactants adsorption.
2 Materials and Methods
2.1 Materials
In this study, five surfactants (CTAB, SDS, TX-100, sophorolipid, rhamnolipid) were used in this experiment. Chemical surfactants, CTAB, SDS, TX-100 were from Aladdin, Shanghai. Biosurfactants, sophorolipid and rhamnolipid were from Aladdin, Shanghai. The five surfactants structure was shown in Supplementary Figure S1. The surfactant solution pH was adjusted to 8.0 by the HCl and NaOH. The different inorganic salts (NaCl, CaCl2) were purchased from Sigma-Aldrich with 97.0% grade. The carbonate rocks were granule, and the calcium carbonate rocks were crushed, and then was sieved, the particles sizes were in the range of 500–700 μm, and then was washed by deionized water and dried.
2.2 Surfactant Solution Preparation
Surfactants could be divided into chemical surfactants and biosurfactants. In addition, surfactants could also be divided into cationic surfactants, anionic surfactants and nonionic surfactants. In order to explore the surfactants adsorption differences between chemical surfactant and biosurfactants, the differences among cationic surfactants, anionic surfactants and non-ionic surfactants, we chose five surfactants CTAB, SDS, TX-100, sophorolipid and rhamnolipid. CTAB, SDS and TX-100 were chemical surfactants, and sophorolipid and rhamnolipid were biosurfactants. Besides, CTAB was cationic surfactant, SDS was anionic surfactant and TX-100 was non-ionic surfactant. The five surfactants included chemical surfactants (CTAB, SDS, TX-100) and biosurfactants (sophorolipid, rhamnolipid). Besides, the CTAB was cationic surfactant, SDS was anionic surfactant, and TX-100 was non-surfactant. We want to explore the adsorption differences between chemical surfactants and biosurfactants. Besides, the cationic surfactant, anionic surfactant and nonionic surfactant adsorption effect differences on the carbonate rocks surface. Therefore, we chose the five surfactants as the representative surfactant.
The different surfactants were used to form the different concentrations of surfactants solution. The surfactants solutions were formed by dissolving the 0.1–5.0 g surfactants into the 1,000 ml deionized water into 1,000 ml-volumetric flask, and then the different concentrations surfactant solutions were formed.
2.3 Surfactants Adsorption Experiment
In this study, the surfactants adsorption experiment was conducted to study the surfactants adsorption onto the carbonate rock surface, and the adsorption isotherms and adsorption dynamics were studied (Sun et al., 2011; Alhassawi and Romero-Zeron 2015). The detailed experiment procedures were as follows: 1) Five surfactant solutions were used to prepare the different concentrations solutions. 2) Then 100 ml five surfactants solutions and 10 g carbonate rocks were combined together. 3) The surfactants concentration was measured by the UV-Vis measurement, and the surfactants solution and carbonate rocks were mixed and stirred together, so as to make it mixed uniformly. 4) After the stirring process, the residual surfactants concentration was measured by the UV-Vis measurement.
When the surfactants adsorption quantity remained stable, then the adsorption equilibrium has been reached. In our study, the surfactant adsorption time was within 48 h. Therefore, the surfactants equilibrium concentration and surfactant initial concentration have been explored, the surfactants adsorption quantity could be calculated by the Eq. 1, where q was the surfactant quantity onto the carbonate rock surface (mg/g), msolution (g) was the surfactant mass in the original surfactant solutions, and the c0 (mg/L) was the surfactant initial concentration after surfactant adsorption process, c (mg/L) was the surfactant concentration after surfactant adsorption process. In this study, every measurement was repeated at least three times, and the average value was chosen as the data. The experiment was conducted at 25°C.
2.4 Morphology Analysis
After the carbonate rocks were treated by different surfactants, the morphology of the carbonate rocks was observed by SEM-EDS (S4800, Tokyo, Japan) method.
2.5 Adsorption Isotherms Models
In order to explore the surfactants adsorption rules, the adsorption models were used, and the four adsorption isotherms were fitted.
2.5.1 Langmuir Model
Langmuir model was used to describe surfactants adsorption behavior onto calcium carbonate surface, which was expressed by as Eq. 2 (Ahmadi and Shadizadeh 2012; Monfared et al., 2015), where qe is the quantity of the surfactant adsorption at the equilibrium per unit mass of calcite (mg/g), Qm is the maximum uptake capacity (mg/g), Ce is the surfactant equilibrium concentration in solution (mg/L), KL is Langmuir constant related to the adsorption site (mg/L).
The Langmuir model assumptions were as follows (Barati et al., 2016): The calcite surface should be considered homogeneous. Besides, surfactants molecules should have equal molar surface areas. Bulk and surface phase show an ideal behavior.
2.5.2 Freundlich Model
Freundlich model was based on the assumption that the calcium carbonate surface had a heterogeneous surface and different classes of adsorption sites covered the surface (Arabloo et al., 2015; Barati et al., 2016).
Freundlich model is expressed by Eq. 3 (Bera et al., 2013), where qe is the quantity of the surfactants adsorption at the equilibrium per unit mass of calcium carbonate surface (mg/g), Ce is the surfactant equilibrium concentration in solution (mg/L), KF Freundlich constants (L/mg), which showed the surfactants adsorption capacity, n is related to the adsorption intensity.
2.5.3 Temkin Model
The assumption of the Temkin model was that during the adsorption process the heat of adsorption decreases linearly and is not a function of logarithmic (Saxena et al., 2018). The Temkin model is expressed as the Eq. 4 (Ahmadi and Shadizadeh 2015; Saxena et al., 2018), where qe is the quantity of the surfactant adsorption at the equilibrium per unit mass of calcium carbonate (mg/g), Ce is the surfactant equilibrium concentration in solution (mg/L), B is the Temkin constant, KT is the equilibrium binding (L/mg), respectively.
2.5.4 Linear Model
The Linear model was the most simplified model, which was expressed as Eq. 5 (Barati et al., 2016), where qe is the quantity of the surfactant adsorption at the equilibrium per unit mass of calcium carbonate (mg/g), KH was the linear constant (L/mg), Ce is the surfactant equilibrium concentration in solution (mg/L),
2.6 Contact Angle Measurement
The contact angle was measured to value the carbonate reservoirs wettability alteration by different surfactants adsorption. Calcite surface was used to represent the carbonate rocks. Five surfactants with different species, concentration, temperature and salinity were used to treat the calcite surface for 3 days. Then the water drop was dripped onto the calcite surface, and the initial contact angle was the static contact angle. When calcite surface was immersed into the aqueous phase, the oil drop was injected into the calcite surface, and then the contact angle alteration with time was measured, which was the dynamic contact angle.
2.7 Surface Tension Measurement
In this study, the five surfactant solutions (2000 ppm) and five surfactants (2000 ppm)-SiO2 nanoparticles (0.5 wt%) solutions were measured by the programmable tensiometer (Kruss GmbH, Germany, Model: K20 EasyDyne) at 298 K by the Du Noüy ring method. Every experiment was repeated three times, and the average value was the surface tension.
3 Simulation Section
In this study, the molecular dynamics simulation was conducted to value the five surfactants (CTAB, SDS, TX-100, Sophorolipid, Rhamnolipid) adsorption behavior onto the carbonate rocks surface. In recent years, calcite was used to represent the carbonate rocks during the molecular dynamics simulation process (Badizad et al., 2020a). The simulation software was Materials Studio 8.0. The COMPASS force field was applied during the simulation process. Based on the COMPASS force field, the total energy was shown in Eq. 6 (Yuan et al., 2016). The total energy (Etotal) could be divided into two parts: valence terms and nonbond interaction terms (Sun et al., 1998). The valence terms included bond energy (
The detailed surfactants adsorption behavior was as follows:
1) Cleave the calcite (1 0 4) surface as the calcium carbonate surface. Then the calcite (1 0 4) surface was conducted the energy optimization and structure optimization, so as to obtain the stablest conformation, and fixed the calcite surface (1 0 4). The Ca atom and C atom were spatially constrained to avoid distortion or deformation of the slits walls, which was because of CaCO3 thermodynamic and kinetic characteristics basis (Badizad et al., 2020b).
2) Build the corresponding supercell, and the vacuum layer thickness was 50 Å. Besides, the periodicity changed from the two-dimensional to three-dimensional. The corresponding cell parameters were a = 72.86228 Å, b = 29.940008 Å, and the corresponding interfacial angle was α = 90°, β = 90°, γ = 90°.
3) Put twenty surfactant molecules into the amorphous cell, then run the COMPASS field of force. The COMPASS forcefield was used in the whole simulation section, and the surfactants adsorption process, surfactants-nanoparticles adsorption was conducted using COMPASS forcefield (Koleini et al., 2020).
4) Build layers, layer 1 was calcite surface, layer 2 was surfactants unit cell, and surfactants were used to adsorb onto the calcite surface, and the adsorption time continued 2000 ps, the step was 1fs. The simulation process conditions were as follows: run module was Forcite, NVT ensemble, COMPASS force field, cutoff distance 12.5 Å, 298 K, Berendsen thermostat.
5) Then the SiO2 nanoparticles were added into the simulation, and the simulation procedure followed the above process. Then the surfactants-nanoparticles system was conducted. The diffusion coefficients and concentration profile of surfactants molecules were analyzed. The diffusion coefficients of surfactants molecules onto the calcite surface are calculated by Eq. 9, where MSD represents the mean-square displacement (Å2), N is surfactants molecules number, Ri(t) is the coordinate of atom i at time of t, and Ri (0) is the initial position of atom.
6) The interaction energy between surfactants and calcite surface at different simulation time was calculated by Eq. 10, where Einteraction energy(surfactant/calcite) is the interaction energy between the surfactant molecules and calcite surface, Etotal is the energy of the system, including the surfactants and the calcite surface, Esurfactant is the energy of the surfactant molecules without calcite surface, Ecalcite is the energy of the calcite surface without oil molecules, respectively. The interaction energy between surfactants and nanoparticles at different simulation time was calculated by Eq. 11, where Einteraction energy(surfactant/nanoparticles) is the interaction energy between the surfactant molecules and nanoparticles, Etotal is the energy of the system, including the surfactants and the nanoparticles, Esurfactant is the energy of the surfactant molecules without nanoparticles, Enanoparticles is the energy of the calcite surface without nanoparticles, respectively.
4 Results and Discussion
4.1 Surfactants Adsorption at Ambient Conditions
Figure 1; Supplementary Table S1 showed the different isotherm models fit for adsorption of five surfactants onto carbonate rock at 298 K. The Qm parameter of the CTAB, SDS, TX-100, sophorolipid and rhamnolipid were 28.12 mg/g, 24.81 mg/g, 13.45 mg/g, 7.18 mg/g, 43.57 mg/g, respectively, which means that the surfactants adsorption quantity onto the calcite surface followed the rule: rhamnolipid > CTAB > SDS > TX-100 > sophorolipid. Besides, the R2 of the five surfactants for Langmuir, Freundlich and Temkin was well, but the R2 for the Linear fit was bad, which means that the Linear model was not fitted the surfactant adsorption. The B for Temkin model by the five surfactants were 11.9857 (rhamnolipid) >9.015(CTAB)> 6.818(SDS)> 6.818 (TX-100)> 1.7207 (sophorolipid), which was in accordance with the surfactants adsorption quantity. In other words, when the B value was higher, the surfactants adsorption quantity would increase.
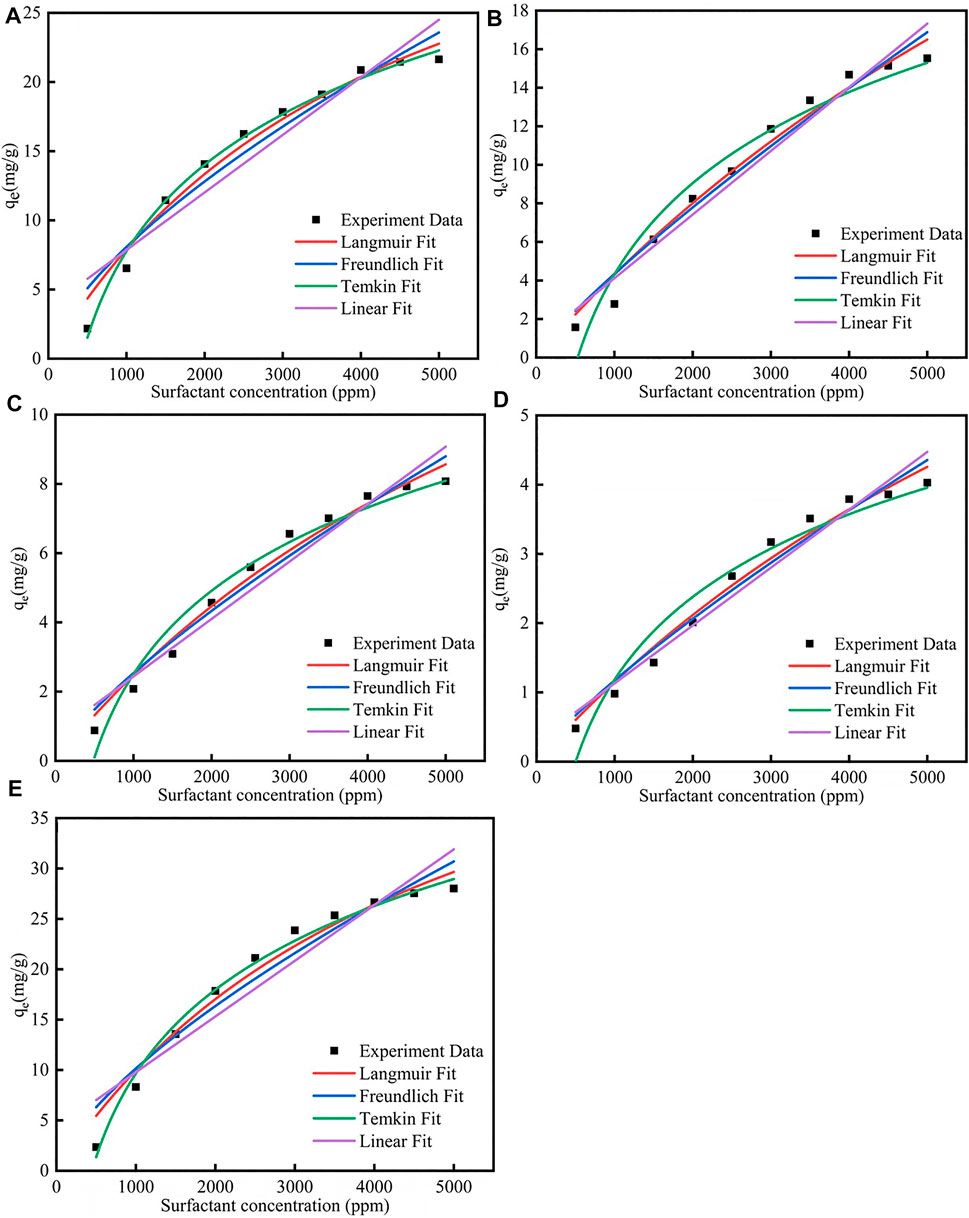
FIGURE 1. Different isotherm models fit for adsorption of (A) CTAB, (B) SDS, (C) TX-100, (D) sophorolipid, (E) rhamnolipid on carbonate rock at 298 K.
4.2 SEM Analysis
The calcite surfaces after surfactants adsorption were shown in Supplementary Figure S2. As was shown in Supplementary Figure S2A, when CTAB adsorbed onto the calcite surface, the surface was flat, and there was not the obvious shape alteration. Although CTAB adsorption was big, but the calcite shape alteration was not obvious. When SDS was used to alter the calcite surface, the surface become rugged. Other surfactants showed the similar effect like SDS.
4.3 Temperature Effect on Surfactants Adsorption
Due to the fact that the enhanced oil recovery was conducted at reservoir environment, therefore the temperature effect on surfactants adsorption was studied (Badizad et al., 2020). Figure 2 showed the different isotherm models fit for adsorption of five surfactants on calcite at different temperatures were shown in Supplementary Figures S3–S7; Supplementary Tables S2–S6. As was shown in Figure 2, the surfactants adsorption quantity would decrease when the temperature increased, the reason was when the temperature increased, the molecular thermal motion rate would increase, which helped the surfactant desorption. As was shown in Supplementary Tables S2–S6, when the temperature increased the Qm would decrease, and the corresponding rate would decrease.
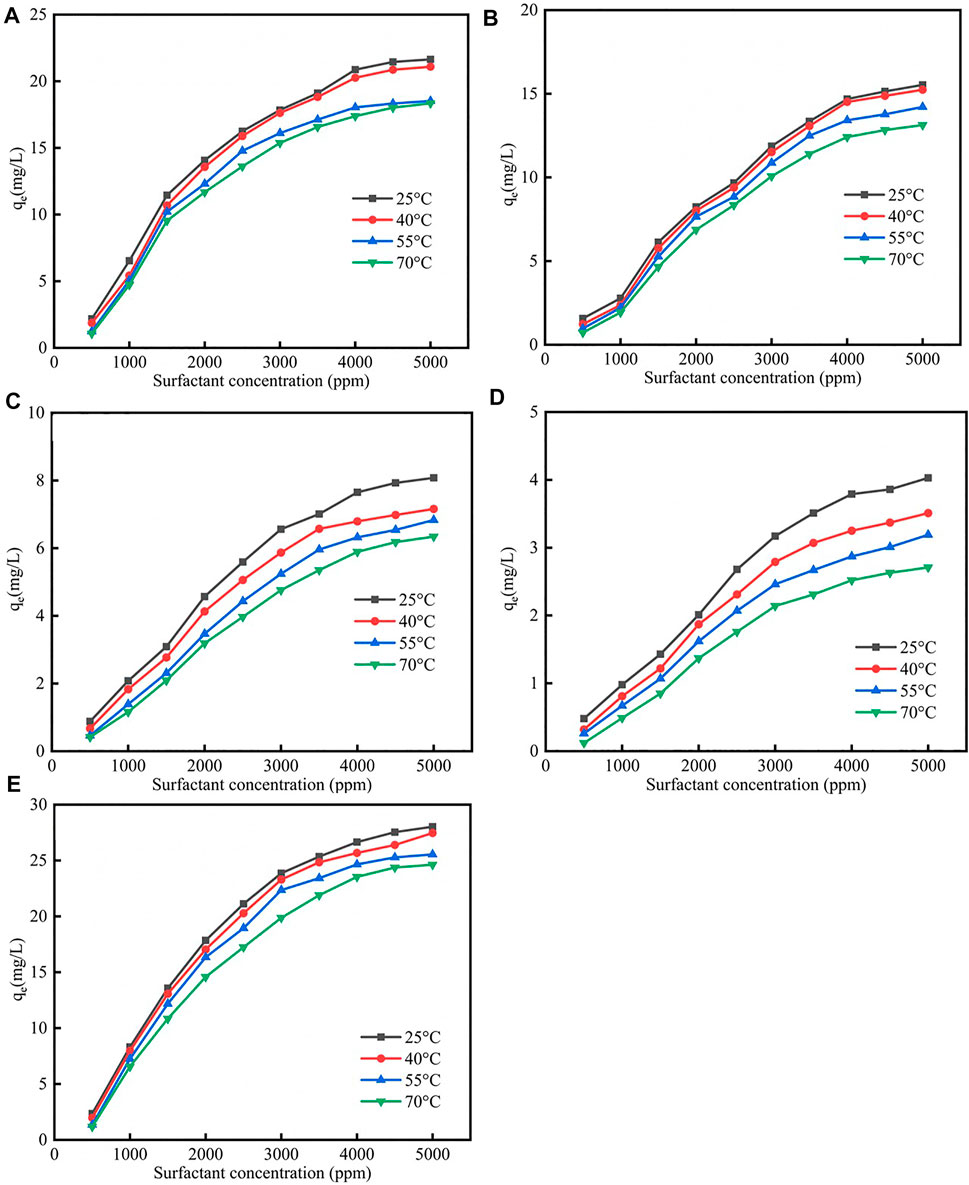
FIGURE 2. Different surfactants (A) CTAB, (B) SDS, (C) TX-100, (D) sophorolipid, (E) rhamnolipid adsorption on carbonate rock at different temperatures.
4.4 Salinity Effect on Surfactants Adsorption
The salinity effect on surfactants adsorption was shown in Figure 3; Supplementary Tables S7, S8. When the salinity increased, the surfactants adsorption quantity would increase, and the reason was because that the salinity would compress the electric double layer, which helped the surfactants adsorption. The R2 of the Langmuir fit for the five surfactants were good, which means that the Langmuir fitness was good, and the surfactants adsorption were more suitable for the Langmuir model.
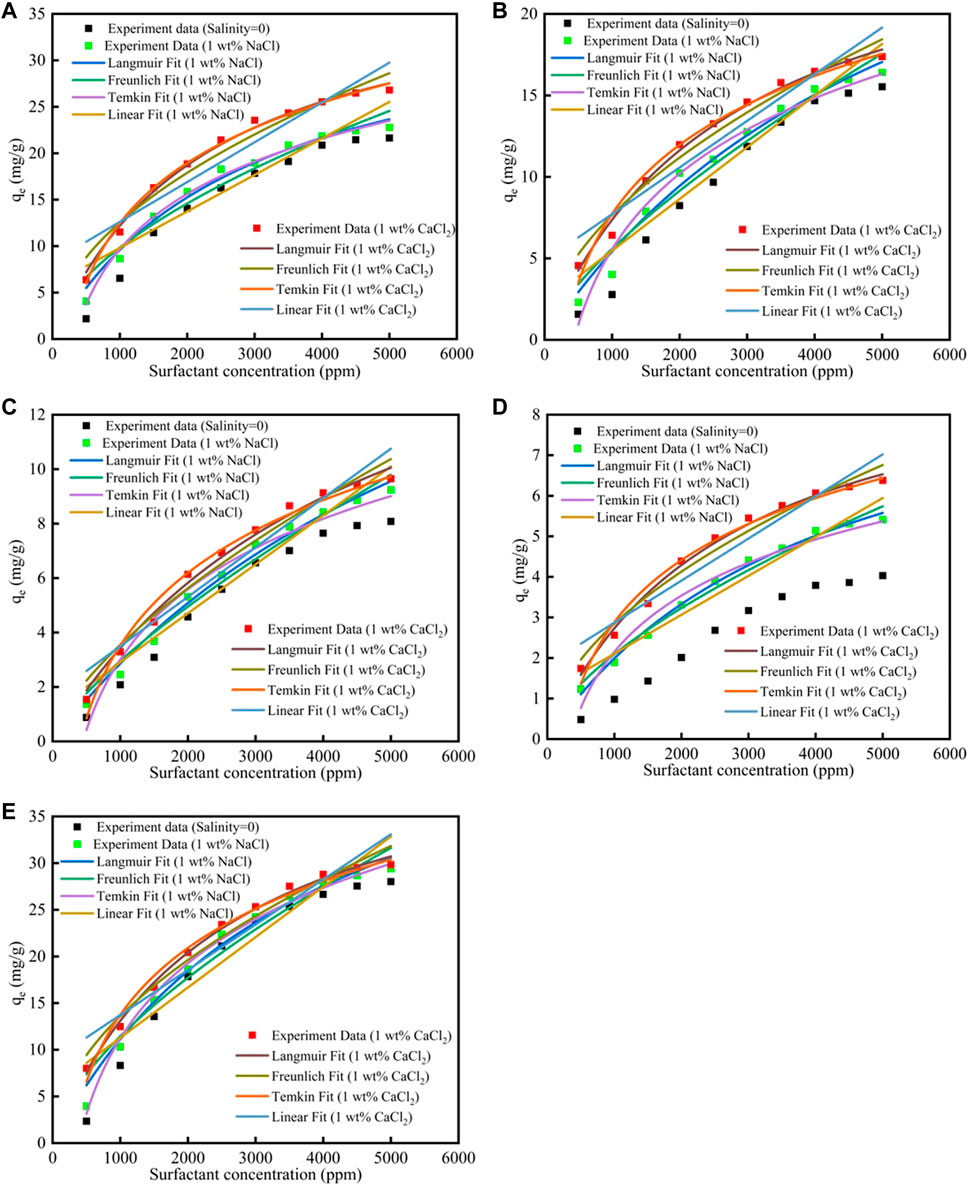
FIGURE 3. Different surfactants (A) CTAB, (B) SDS, (C)TX-100, (D) sophorolipid, (E) rhamnolipid adsorption on carbonate rock at different salinities.
The ionic strength could be calculated by Eq. 12, where I represent ionic strength (mol/kg), ci represent the i ion concentration (mol/kg), and zi was the ion charge. Debye-Hückel theory calculated the activity quotient, shown in Eq. 13, where
4.5 Nanoparticles Effect on Surfactants Adsorption
Different fitness of surfactants with SiO2 nanoparticles adsorption on calcite at 298 K was shown in Figure 4; Supplementary Table S9. The results showed that the SiO2 nanoparticles could effectively decrease the surfactants adsorption. The reason was because surfactants could effectively adsorb onto SiO2 nanoparticles surface, and then the surfactants adsorption would decrease, the adsorption effect could be verified by the molecular dynamic simulation. For Langmuir model, the Qm for CTAB, SDS, TX-100, sophorolipid and rhamnolipid were 39.57 mg/g, 38.16 mg/g, 21.87 mg/g, 9.72 mg/g, 46.18 mg/g, respectively. The adsorption quantity follows the previous surfactants adsorption procedure. The KL for the five surfactants were 2.06 × 10⁻⁴, 6.27 × 10⁻⁵, 7.31 × 10⁻⁵, 3.86 × 10⁻⁵, 1.66 × 10⁻⁴, respectively. For Freundlich model, the KF value was 6.12 × 10⁻², 8.52 × 10⁻³, 5.7 × 10⁻³, 1.36 × 10⁻³, 5.33 × 10⁻², respectively. The value was lower than the corresponding value in high salinity, therefore, it shows that for the Freundlich model, the surfactants adsorption was still less.
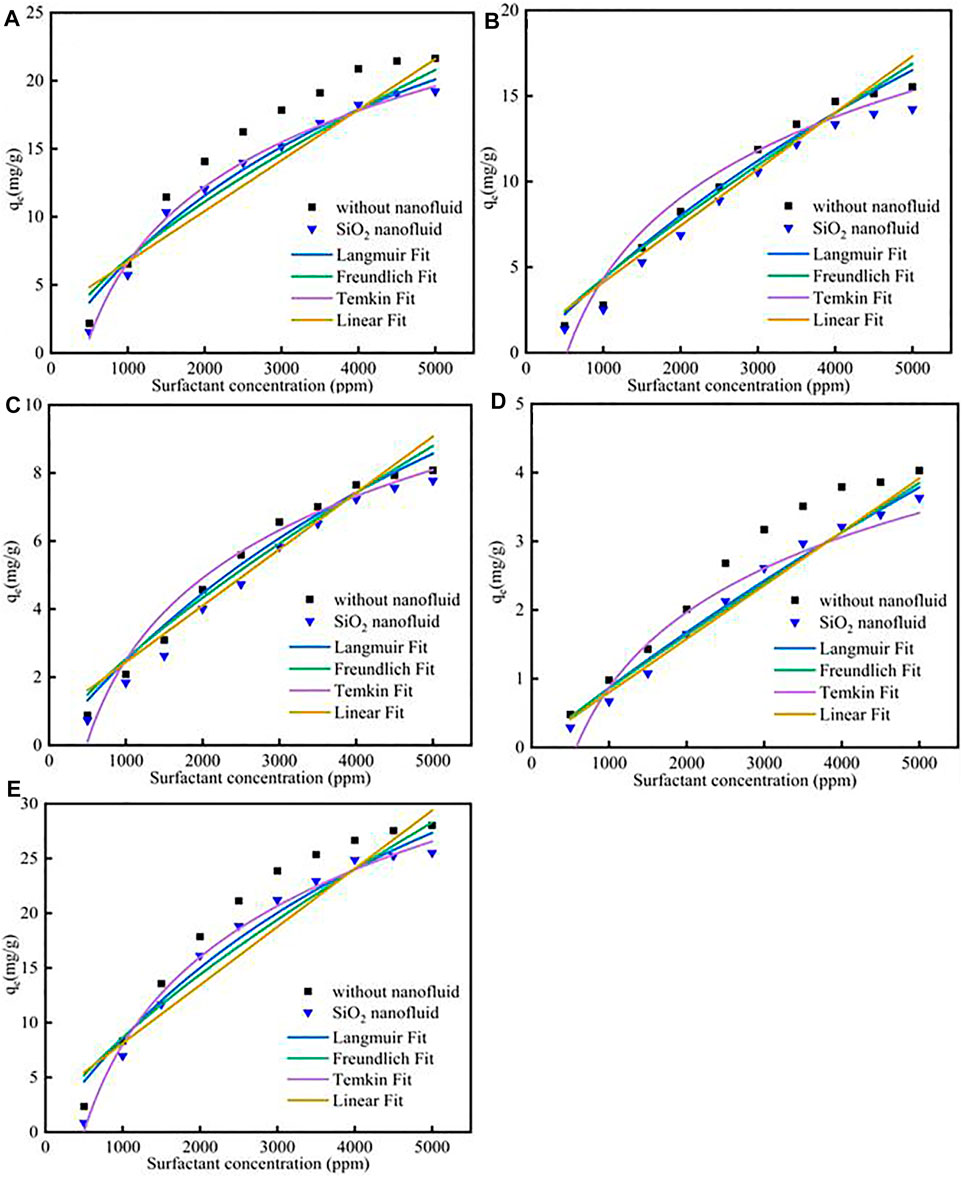
FIGURE 4. Different surfactants (A) CTAB, (B) SDS, (C)TX-100, (D) sophorolipid, (E) rhamnolipid with SiO2 nanoparticles adsorption on carbonate rock at 298 K.
Different fitness of surfactants with TiO2 nanoparticles adsorption on calcite at 298 K was shown in Figure 5; Supplementary Table S10. The results showed that the TiO2 nanoparticles could also decrease the surfactants adsorption. Besides, the correspond values of the different surfactant adsorption KL, KF, KT, KH would decrease.
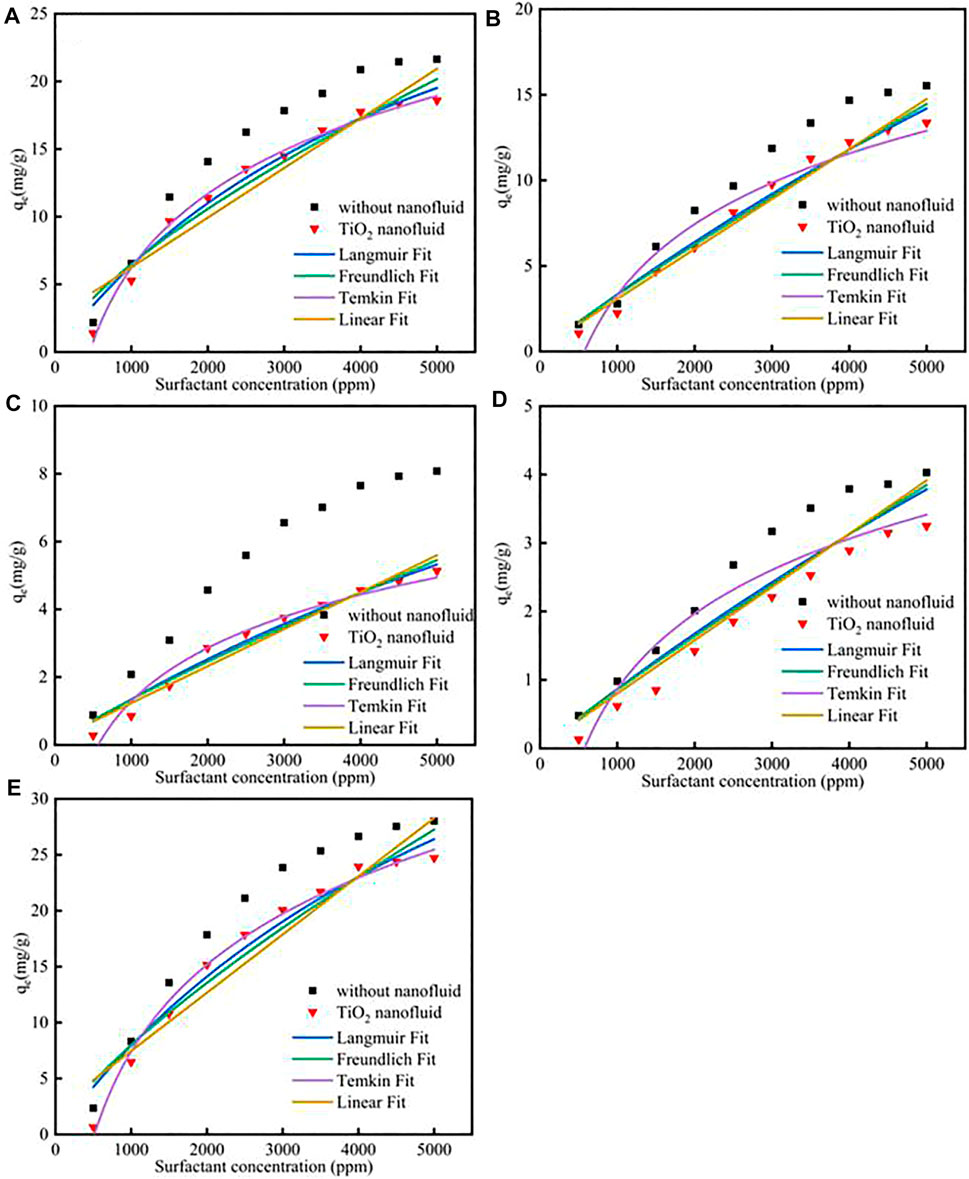
FIGURE 5. Different surfactants (A) CTAB, (B) SDS, (C)TX-100, (D) sophorolipid, (E) rhamnolipid with TiO2 nanoparticles adsorption on carbonate rock at 298 K.
4.6 Molecular Dynamics Analysis
4.6.1 Adsorption Snapshot Analysis
Figure 6 showed the surfactants adsorption snapshot at different internals (0ps-2000 ps). As was shown in this Figure 6, the five surfactants adsorption behavior was similar. When the simulation time was 125 ps, the five surfactants could adsorb onto the calcite surface, and when the simulation time continues, the surfactants adsorption conformation would be altered. In the end, all the five surfactants could remain the stable adsorption behavior. Figure 7 showed the different surfactants-SiO2 nanoparticles adsorption snapshot at different internals. The experiment results showed that the nanoparticles could efficiently decrease surfactants adsorption effect, and in order to explain the corresponding mechanism, the water phase was added in the simulation process (Koleini et al., 2021). As was shown in Figure 7A to Figure 7E, the surfactants would adsorb onto SiO2 nanoparticles surface, which would make the surfactants adsorption quantity would decrease. When the time was 125 ps, some surfactants molecules would contact with the SiO2 nanoparticles, and when the simulation time proceeds, the surfactants molecules would closely with the SiO2 nanoparticles. The simulation results (Figure 7) showed that five surfactants could adsorb onto nanoparticles surface, increase the steric hindrance between different surfactants, and then decrease surfactants adsorption onto calcium carbonate surface. The results were in accordance with the experiment results.
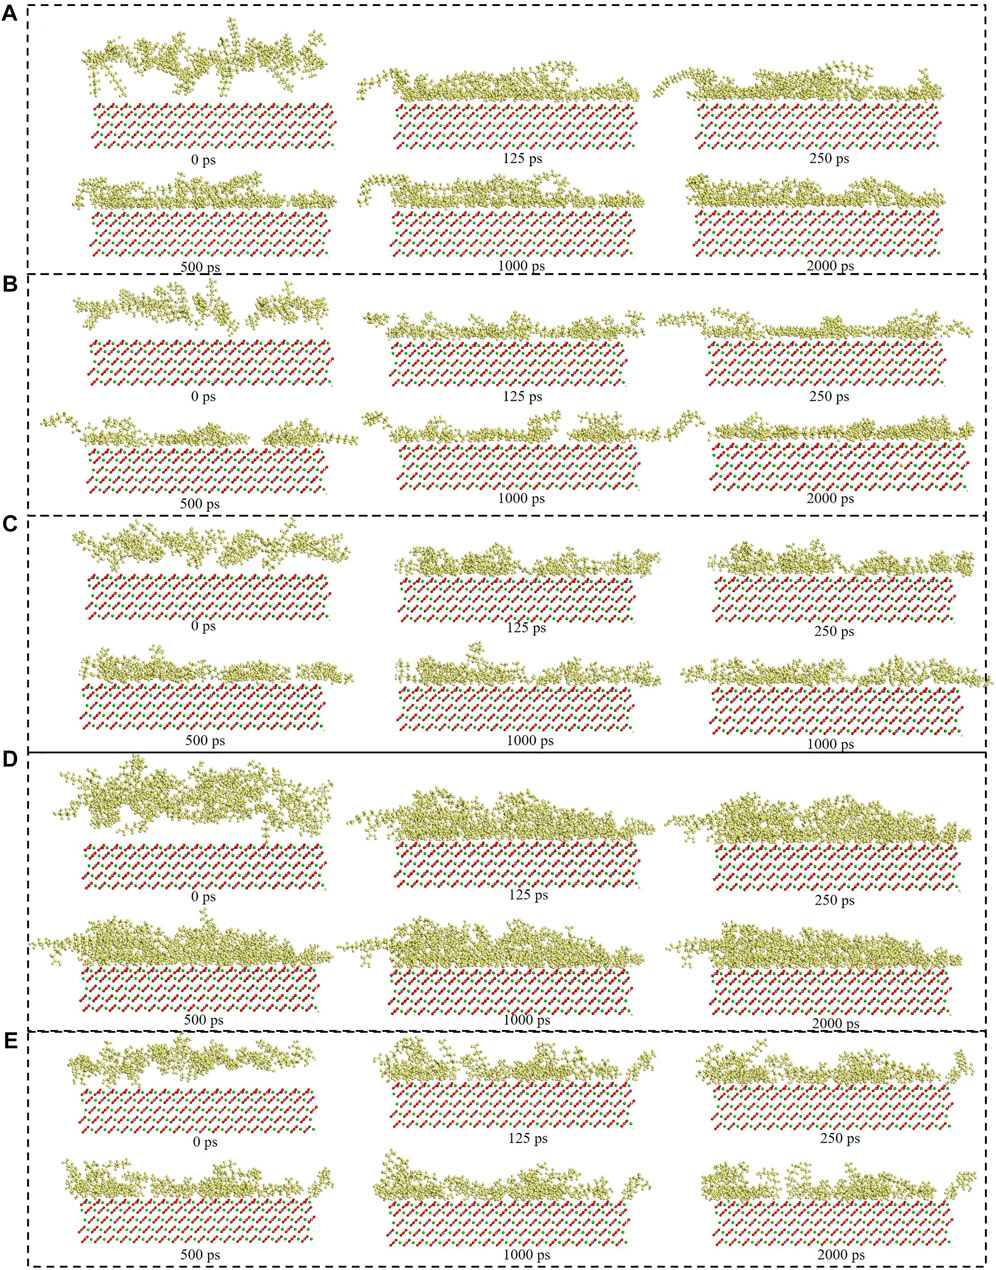
FIGURE 6. Consecutive snapshot (0 ps–2000 ps) of (A) CTAB, (B) SDS, (C) TX-100, (D) Sophorolipid, (E) Rhamnolipid adsorption onto the modelled calcite surface. yellow = surfactants, red and grey = CO32-, green = Ca2+, red, grey and green = calcite surface.
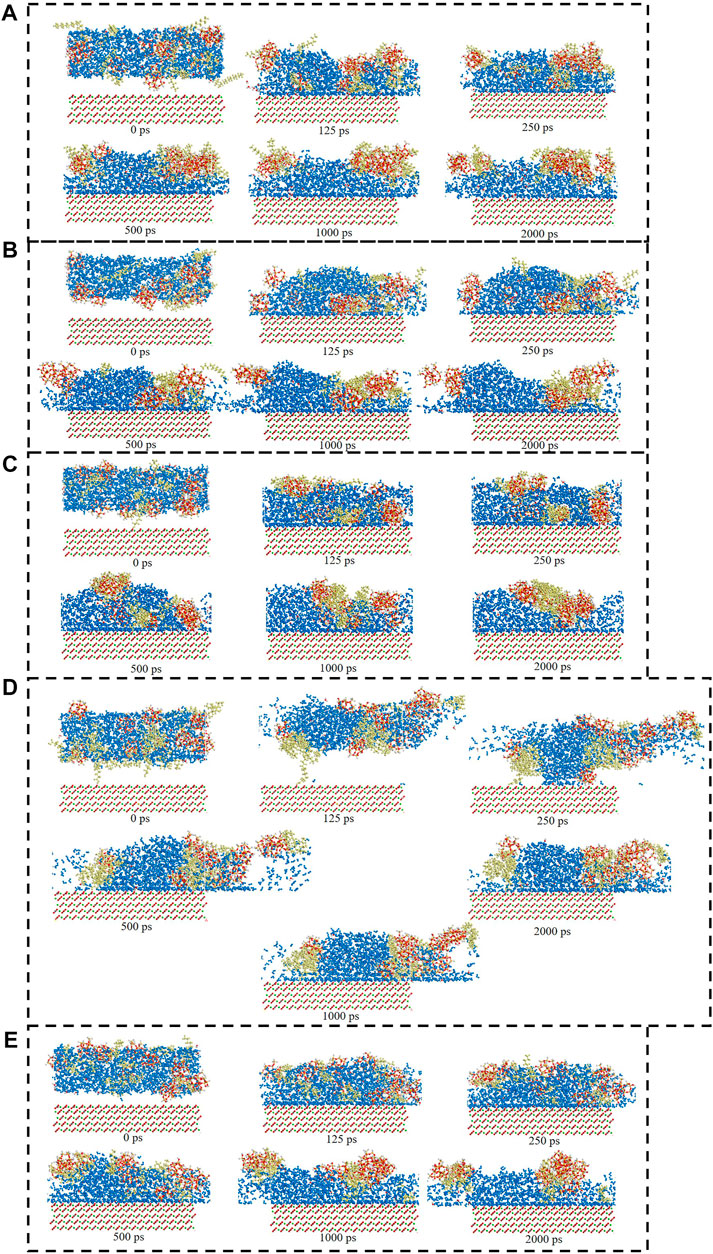
FIGURE 7. Consecutive snapshot (0 ps–2000 ps) of (A) CTAB-SiO2, (B) SDS-SiO2, (C) TX-100-SiO2, (D) Sophorolipid-SiO2, (E) Rhamnolipid-SiO2 adsorption onto the modelled calcite surface. yellow = surfactants, red and grey = CO32−, green = Ca2+, red, grey and green = calcite surface, red and white = SiO2 nanoparticles.
The surfactants adsorption behavior included two parts: one the one hand, the intermolecular force, which was verified by interaction energy data. One the other hand, the electrostatic force influenced the molecules behavior by coulomb action. Besides, salinity would influence the surfactant-calcite carbonate interaction force. The heavy oil-calcium carbonate interfacial behavior was influenced by the CaCO3 mineral surface chemistry and polar hydrocarbons residing charged (Badizad et al., 2021). The surfactant adsorption onto the calcite surface was also influenced by the CaCO3 mineral surface chemistry and polar hydrocarbons residing charge.
4.6.2 Surfactants Concentration Analysis and Diffusion Coefficient Analysis
The relative concentration and mean square displacement of different surfactants and surfactants-SiO2 nanofluids system was shown in Figure 8. Figure 8A showed that the peak position concentrations of the five surfactants were as follows: TX-100 < SDS < CTAB < rhamonilipid < sophorolipid. As was shown in Figure 8 (c), the mean square displacement order of five surfactants was as follows: CTAB > SDS > TX-100 > rhamnolipid≈sophorolipid (t<1900 ps). When the simulation time was higher than 1900 ps, the mean square displacement was CTAB < SDS. Figure 8 showed that the chemical surfactants showed obvious strong adsorption with the calcite surface. For the surfactants-SiO2 nanoparticles system, the distance was longer than the surfactants-calcite surface directly, which means that the surfactants were not closely to the calcite surface. As was shown in Figure 8B, the CTAB and TX-100 was the most far away to the calcite surface. As was shown in Figure 8D, the mean square displacement of CTAB was much higher than other surfactants, which means the CTAB showed obvious effect on decrease the surfactants adsorption.
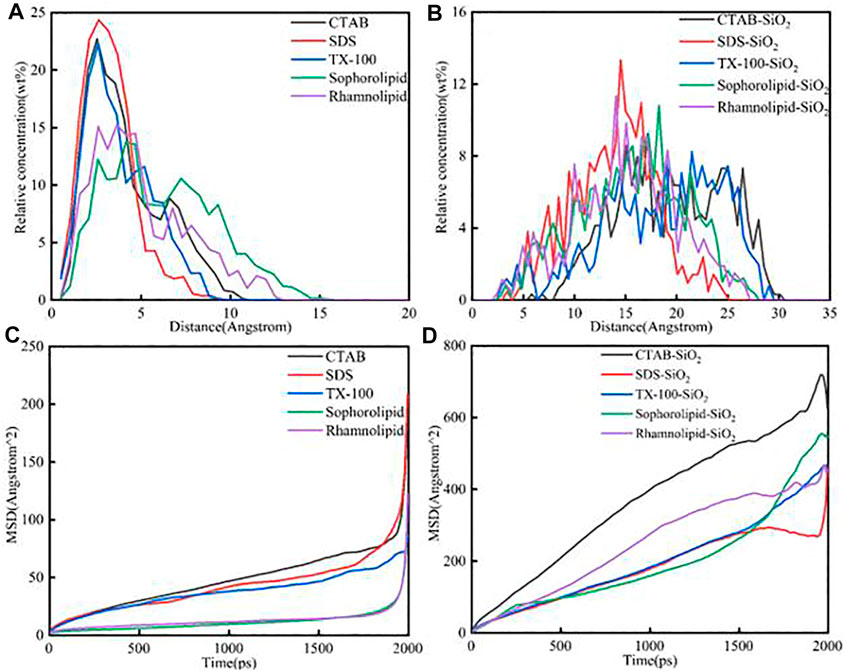
FIGURE 8. The relative concentration of different (A) surfactants; (B) surfactants-SiO2 nanofluids system. The mean square displacement of different (C) surfactants; (D) surfactants-SiO2 nanofluids system.
4.6.3 Energy/Temperature Balance
The consecutive snapshots (1,500 ps–2000 ps) of five surfactants adsorption onto the modelled calcite surface were shown in Figure 9. The consecutive snapshots (1,500–2000 ps) of five surfactants-SiO2 nanoparticles adsorption onto the modelled calcite surface were shown in Figure 10. Figures 9, 10 showed that both the surfactants and surfactants-SiO2 nanoparticles adsorption was stable after 1,500 ps, in other words, the position of the surfactant molecules and SiO2 nanoparticles remained stable after 1,500 ps
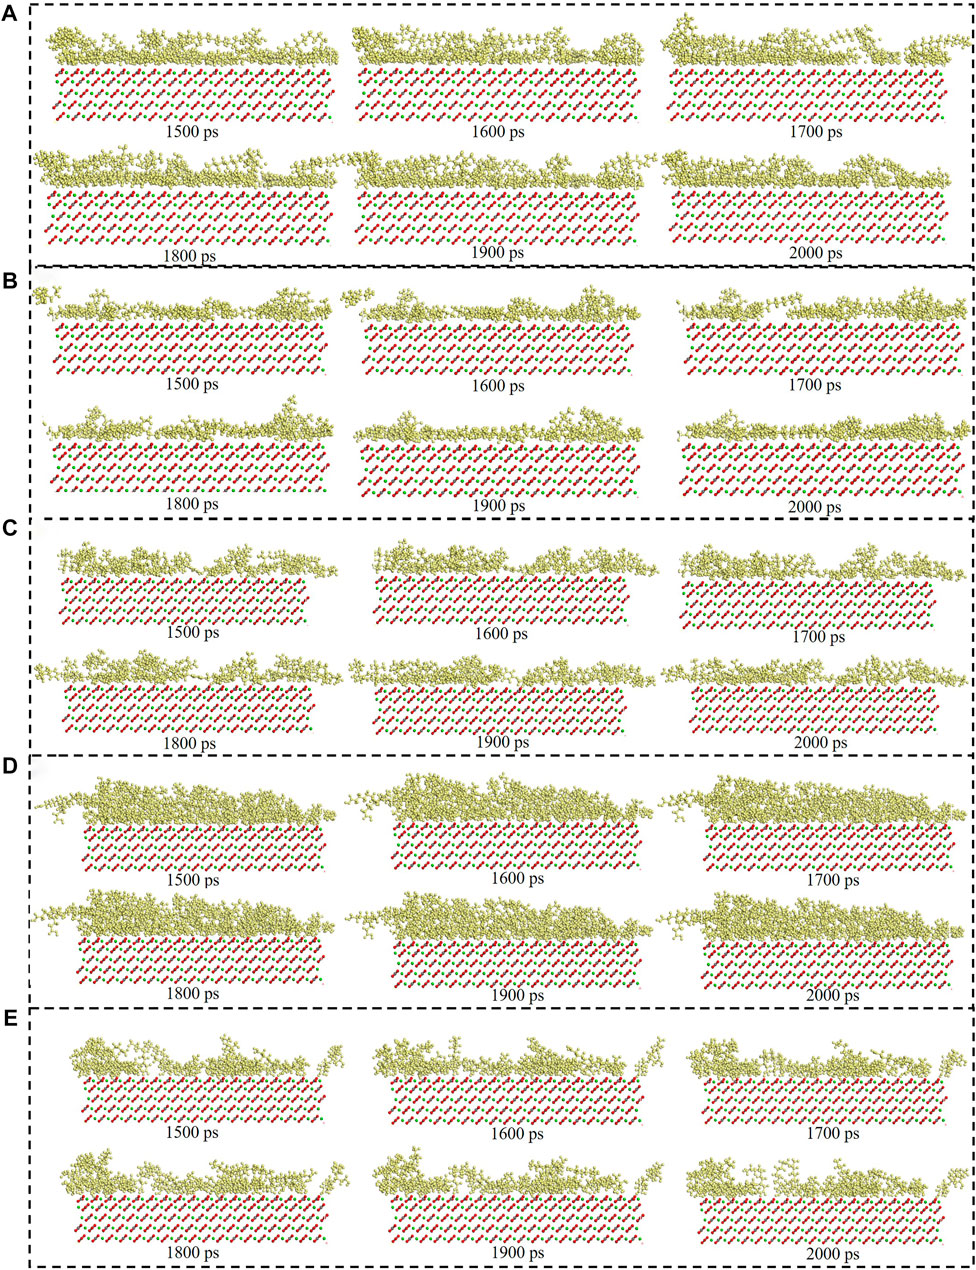
FIGURE 9. Consecutive snapshot (1,500–2000 ps) of (A) CTAB, (B) SDS, (C) TX-100, (D) Sophorolipid, (E) Rhamnolipid adsorption onto the modelled calcite surface. yellow = surfactants, red and grey = CO32-, green = Ca2+, red, grey and green = calcite surface.
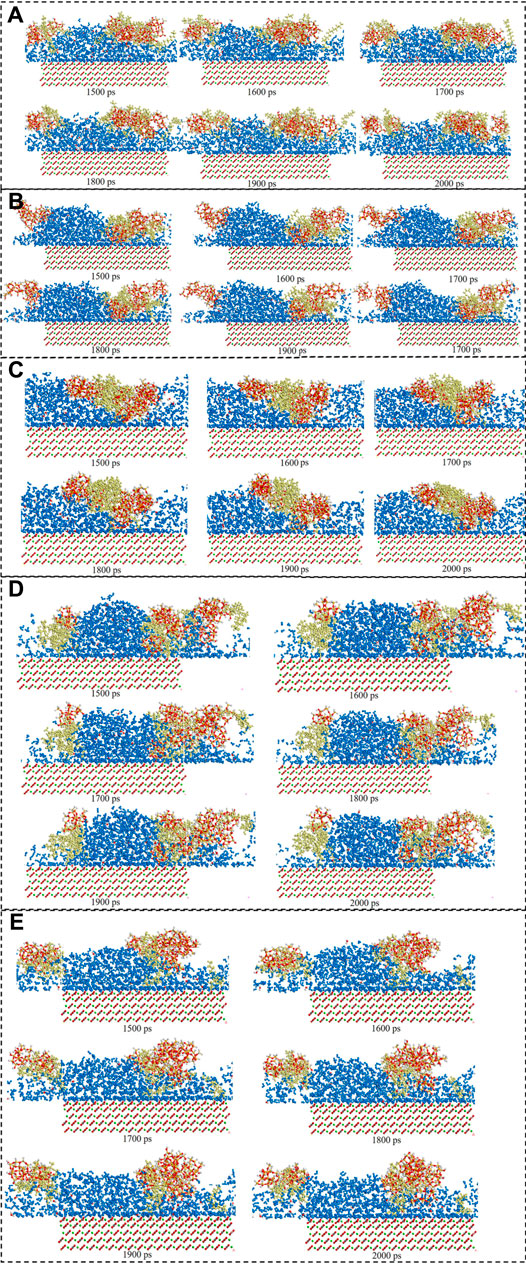
FIGURE 10. Consecutive snapshot (1,500–2000 ps) of (A) CTAB-SiO2, (B) SDS-SiO2, (C) TX-100-SiO2, (D) Sophorolipid-SiO2, (E) Rhamnolipid-SiO2 adsorption onto the modelled calcite surface. yellow = surfactants, red and grey = CO32−, green = Ca2+, red, grey and green = calcite surface, red and white = SiO2 nanoparticles.
Supplementary Figures S8, S10 showed the energy balance of surfactants-calcite system and surfactants-SiO2 nanoparticles calcite system. As was shown in Supplementary Figures S8, S10, the red line represents kinetic energy, and the kinetic energy remained stable, and non-bond energy, potential energy and total energy decreased with simulation time proceeded. The non-bond energy, potential energy, and total energy decreased significantly within 100 ps, and then three energies would become stable. Supplementary Figures S9, S11 showed that the temperature stabilized at 298K, and the temperature fluctuation range was within 10 K. Energy change rate from 1,500 ps to 2000ps could be calculated by Eq. 14, and temperature change rate from 1,500 ps to 2000 ps could be calculated by Eq. 15. Table 1 showed the energy change rate and temperature change rate (%) (1,500 ps–2000 ps) of surfactants (with and without SiO2 nanoparticles) system. The temperature change rate for the five surfactants (with and without SiO2 nanoparticles) was low. The potential energy, kinetic energy, non-bond energy and total energy change rate were also low.
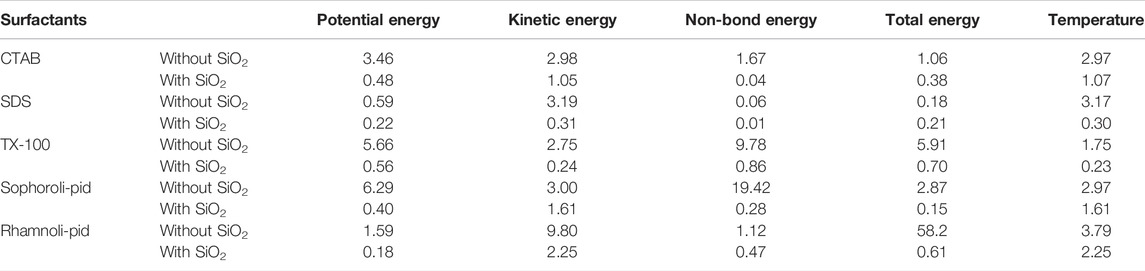
TABLE 1. The energy change rate and temperature change rate (%) (1,500–2000 ps) of surfactants (with and without SiO2 nanoparticles) system.
5 The Comparison Analysis Between Simulation and Experiments
5.1 Contact Angle Measurement
The static and dynamic contact angle experiment device diagram was shown in Supplementary Figure S12. The static contact angle results were shown in Figure 11. As was shown in Figure 11, the five surfactants could make the calcite surface more hydrophilic. As was shown in Figure 11A, when the surfactants concentration increased, the contact angle on the surfactant altered calcite surface would decrease a lot, which means that the calcite surface become more hydrophilic. The reason was due to the fact that when surfactants concentration increased, the surfactants adsorption would increase, which made the calcite surface more hydrophilic. As was shown in Figure 11B, the contact angle would increase when the temperature increased. When the temperature increase, the surfactant adsorption would decrease, which made the calcite surface become less hydrophilic. As was shown in Figure 11C, the contact angle decreased with the high salinity. When the salinity increased, the surfactant adsorption would increase, which was beneficial to the calcite surface wettability alteration. As was shown in Figure 11D, the contact angle decreased when the surfactants work with SiO2/TiO2 nanoparticles, and the reason was because the SiO2/TiO2 nanoparticles would adsorb onto calcite surface, regardless of the surfactants adsorption. Therefore, although surfactants adsorption would decrease, the contact angle would still decrease.
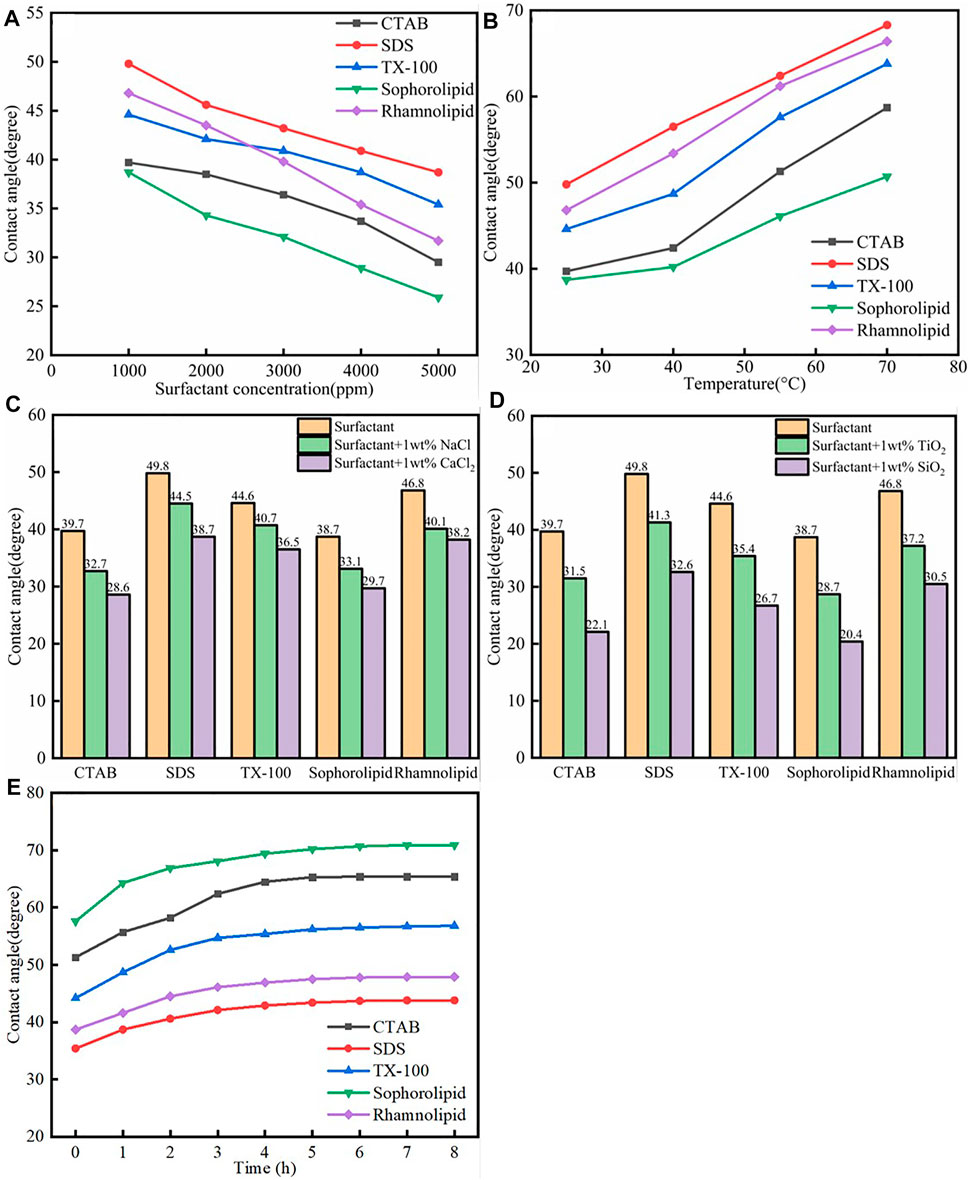
FIGURE 11. (A) Surfactants species; (B) Temperature; (C) Salinity; (D) Nanoparticles- assisted effect on the calcite surface wettability—static contact angle measurement. (E) The different surfactants assisted calcite surface wettability alteration-dynamic contact angle measurement.
The dynamic contact angle was shown in Figure 11E. As was shown in Figure 11E, the contact angle of the oil drops on the calcite surface (in aqueous solution) would increase with time passed, which means that the surface become more hydrophilic when the time passed. On the one hand, surfactants adsorption quantity would increase when the time passed. On the other hand, the surfactants could effective enhanced oil liberate.
5.2 Interaction Energy Analysis
Figure 12 showed the interaction energy among surfactants, SiO2 nanoparticles and calcite surface. As was shown in Figure 12, the interaction energy between CTAB, SDS, TX-100, sophorolipid and rhamnolipid with calcite surface were −320.04, −903.82, −685.93, −1,225.74, −971.42 kcal/mol, respectively. The interaction energy between biosurfactants (sophorolipid, rhamnolipid) and calcite surface was higher than that between chemical surfactants and calcite surface. The reason was due to the fact that the biosurfactants had high steric hindrance and molecular mass, which made them have strong interaction force with calcite surface. When the simulation time proceeds, the interaction energy of surfactants-calcite surface, surfactants-SiO2 nanoparticles would increase, which means that the surfactants adsorbed onto SiO2 nanoparticles surface.
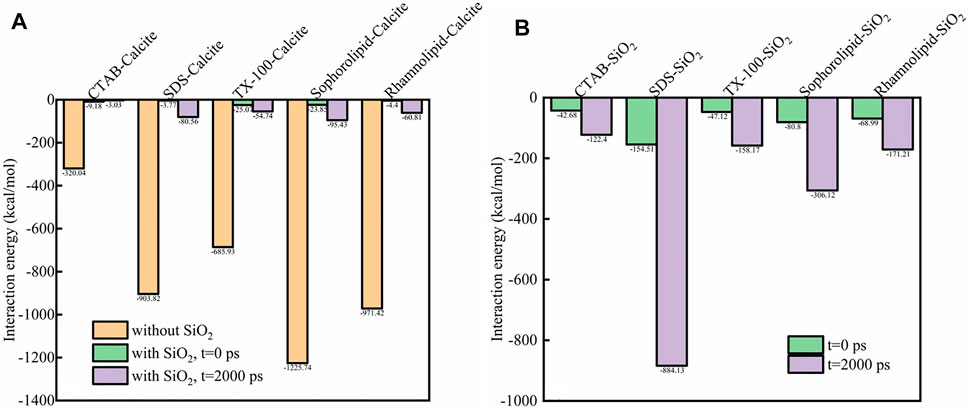
FIGURE 12. The interaction energy (kcal/mol) between (A) surfactant-calcite surface (with or without SiO2 nanoparticles); (B) surfactants-SiO2 nanoparticles.
5.3 Surface Tension Analysis
The five surfactants and surfactants-SiO2 nanoparticles effect on surface tension was Figure 13. As was shown in Figure 13, the surfactants could effectively decrease surface tension. 2000 ppm CTAB, SDS, TX-100, sophorolipid and rhamnolipid could decrease the water surface tension from 72.1 mN/m to 41.4 mN/m, 39.7 mN/m, 28.7 mN/m, 31.1 mN/m, 33.5 mN/m, respectively. Besides, the surfactants-SiO2 nanoparticles could further decrease the water surface tension, and the corresponding surface tension was 38.9 mN/m, 37.8 mN/m, 26.4 mN/m, 30.2 mN/m, 30.8 mN/m, respectively. The results indicated that surfactants adsorbed onto the SiO2 nanoparticles surface, and then surfactants and SiO2 nanoparticles could synergistically decrease the water surface tension.
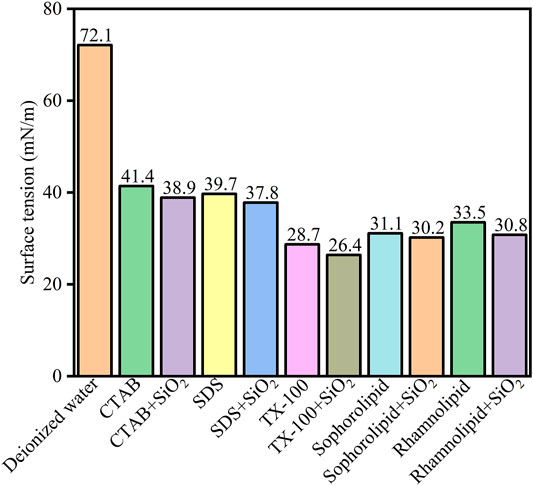
FIGURE 13. Surface tension (mN/m) of the deionized water, surfactants solutions (2000 ppm) and surfactant (2000 ppm)-SiO2 nanoparticles at 298 K.
5.4 Similar Results From Experiment and Simulation
The experiment results could be verified by molecular dynamic simulation, and the detailed similar results from experiment and simulation was as follows.
1) The experiment results showed that the SiO2 nanoparticles could decrease the five surfactants adsorption onto the carbonate rocks, and the simulation results verified the results.
2) For the three chemical surfactants, the adsorption quantity order was CTAB > SDS > TX-100, and the simulation results were in accordance with the experiment results, the mean square displacement order of the chemical surfactants was as follows: CTAB > SDS > TX-100.
3) The contact angle measurements showed that the surfactants adsorption would make the carbonate surface more hydrophilic, and the simulation results verified the experiment results.
6 Conclusion
In this study, we studied the surfactants adsorption onto carbonate surface by experiment and molecular dynamics simulation, and the detailed conclusions were as follows:
1) CTAB, SDS, TX-100, sophorolipid and rhamnolipid adsorption onto carbonate rocks could be well fitted by Langmuir model, Freundlich model and Temkin model. Cationic surfactants adsorption quantity was higher than anionic surfactants, and the non-ionic surfactants adsorption quantity was the lowest.
2) When the temperature decreased or salinity increased, the surfactants adsorption would increase. Higher salinity could compress electric double layer which increased the surfactants adsorption. In addition, divalent ions (Ca2+) could make the surfactants adsorption quantity higher than monovalent ion (Na+).
3) TiO2 nanoparticles and SiO2 nanoparticles decreased the surfactants adsorption onto the carbonate rocks surface, and the reason was because the surfactants molecules adsorbed onto SiO2 nanoparticles surface, which increased the surfactants molecules steric hindrance. The contact angle measurement indicated that SiO2 nanoparticles adsorption could make the carbonate rock surface more hydrophilic.
4) The molecular dynamics simulation results showed that the surfactants molecules adsorbed onto the SiO2 nanoparticles surface, and the surfactants adsorption was decreased.
Data Availability Statement
The original contributions presented in the study are included in the article/Supplementary Material, further inquiries can be directed to the corresponding authors.
Author Contributions
JH write the original manuscript. SL, JD and HS revised the whole manuscript. HS and SL provided the fund. JH, JD, HS and SL did the experiment.
Funding
This research was funded by 973 National Basic Research Program of China (2015CB251403), Hebei Natural Science Funds for Young Scholar (B2021106003) and Science and Technology Project of Hebei Education Department (BJ2021097).
Conflict of Interest
The authors declare that the research was conducted in the absence of any commercial or financial relationships that could be construed as a potential conflict of interest.
Publisher’s Note
All claims expressed in this article are solely those of the authors and do not necessarily represent those of their affiliated organizations, or those of the publisher, the editors, and the reviewers. Any product that may be evaluated in this article, or claim that may be made by its manufacturer, is not guaranteed or endorsed by the publisher.
Supplementary Material
The Supplementary Material for this article can be found online at: https://www.frontiersin.org/articles/10.3389/fchem.2022.847986/full#supplementary-material
References
Ahmadi, A. M., and Shadizadeh, S. R. (2015). Experimental Investigation of a Natural Surfactant Adsorption on Shale-sandstone Reservoir Rocks: Static and Dynamic Conditions. Fuel 159, 15–26. doi:10.1016/j.fuel.2015.06.035
Ahmadi, M. A., and Shadizadeh, S. R. (2012). Adsorption of Novel Nonionic Surfactant and Particles Mixture in Carbonates: Enhanced Oil Recovery Implication. Energy Fuels 26, 4655–4663. doi:10.1021/ef300154h
Alhassawi, H., and Romero-Zerón, L. (2015). New Surfactant Delivery System for Controlling Surfactant Adsorption onto Solid Surfaces. Part I: Static Adsorption Tests. Can. J. Chem. Eng. 93, 1188–1193. doi:10.1002/cjce.22217
Altamash, T., EsperançaEsperança, J. M. S. S., and Tariq., M. (2021). Surface Coatings and Treatments for Controlled Hydrate Formation: A Mini Review. Physchem 1, 272–287. doi:10.3390/physchem1030021
Amirianshoja, T., Junin, R., Kamal Idris, A., and Rahmani, O. (2013). A Comparative Study of Surfactant Adsorption by clay Minerals. J. Pet. Sci. Eng. 101, 21–27. doi:10.1016/j.petrol.2012.10.002
Arabloo, M., Ghazanfari, M. H., and Rashtchian, D. (2015). Spotlight on Kinetic and Equilibrium Adsorption of a New Surfactant onto sandstone Minerals: A Comparative Study. J. Taiwan Inst. Chem. Eng. 50, 12–23. doi:10.1016/j.jtice.2014.12.012
Badizad, M. H., Koleini, M. M., Greenwell, H. C., Ayatollahi, S., and Ghazanfari, M. H. (2021). 'Atomistic Insight into the Behavior of Ions at an Oil-Bearing Hydrated Calcite Surface: Implication to Ion-Engineered Waterflooding. Energy & Fuels 35, 13039–13054. doi:10.1021/acs.energyfuels.1c01357
Badizad, M. H., Koleini, M. M., Greenwell, H. C., Ayatollahi, S., and Ghazanfari, M. H. (2020). A Deep Look into the Dynamics of Saltwater Imbibition in a Calcite Nanochannel: Temperature Impacts Capillarity Regimes. Langmuir 36, 9035–9046. doi:10.1021/acs.langmuir.0c00437
Badizad, M. H., Koleini, M. M., Greenwell, H. C., Ayatollahi, S., Ghazanfari, M. H., and Mohammadi, M. (2020b). Ion-specific Interactions at Calcite-Brine Interfaces: a Nano-Scale Study of the Surface Charge Development and Preferential Binding of Polar Hydrocarbons. Phys. Chem. Chem. Phys. 22, 27999–28011. doi:10.1039/d0cp04828c
Badizad, M. H., Koleini, M. M., Hartkamp, R., Ayatollahi, S., and Ghazanfari, M. H. (2020a). How Do Ions Contribute to Brine-Hydrophobic Hydrocarbon Interfaces? an In Silico Study. J. Colloid Interf. Sci. 575, 337–346. doi:10.1016/j.jcis.2020.04.060
Barati, A., Najafi, A., Daryasafar, A., Nadali, P., and Moslehi, H. (2016). Adsorption of a New Nonionic Surfactant on Carbonate Minerals in Enhanced Oil Recovery: Experimental and Modeling Study. Chem. Eng. Res. Des. 105, 55–63. doi:10.1016/j.cherd.2015.10.047
Bera, A., Kumar, T., Ojha, K., and Mandal, A. (2013). Adsorption of Surfactants on Sand Surface in Enhanced Oil Recovery: Isotherms, Kinetics and Thermodynamic Studies. Appl. Surf. Sci. 284, 87–99. doi:10.1016/j.apsusc.2013.07.029
Das, S., Nguyen, Q., Patil, P. D., Yu, W., and Bonnecaze, R. T. (2018). Wettability Alteration of Calcite by Nonionic Surfactants. Langmuir 34, 10650–10658. doi:10.1021/acs.langmuir.8b02098
Dehaghani, A. H. S., Taleghani, M. S., Badizad, M. H., and Daneshfar, R. (2019). 'Simulation Study of the Gachsaran Asphaltene Behavior within the Interface of Oil/water Emulsion: a Case Study. Colloid Interf. Sci. Commun. 33, 100202. doi:10.1016/j.colcom.2019.100202
Dehghan Monfared, A., Ghazanfari, M. H., Jamialahmadi, M., and Helalizadeh, A. (2015). Adsorption of Silica Nanoparticles onto Calcite: Equilibrium, Kinetic, Thermodynamic and DLVO Analysis. Chem. Eng. J. 281, 334–344. doi:10.1016/j.cej.2015.06.104
Fan, J. C., Wang, F. C., Chen, J., Zhu, Y. B., Lu, D. T., Liu, H., et al. (2018). Molecular Mechanism of Viscoelastic Polymer Enhanced Oil Recovery in Nanopores. R. Soc. Open Sci. 5, 180076. doi:10.1098/rsos.180076
Hou, J. J., and Sun, L. Y. (2021). 'Synergistic Effect of Nanofluids and Surfactants on Heavy Oil Recovery and Oil-Wet Calcite Wettability. Nanomaterials 11, 1849. doi:10.3390/nano11071849
Jian, G., Puerto, M., Wehowsky, A., Miller, C., Hirasaki, G. J., and Biswal, S. L. (2018). Characterizing Adsorption of Associating Surfactants on Carbonates Surfaces. J. Colloid Interf. Sci. 513, 684–692. doi:10.1016/j.jcis.2017.11.041
Kania, D., Yunus, R., Omar, R., Rashid, S. A., Jan, B. M., and Aulia, A. (2021). 'Adsorption of Non-ionic Surfactants on Organoclays in Drilling Fluid Investigated by Molecular Descriptors and Monte Carlo Random Walk Simulations. Appl. Surf. Sci. 538, 148154. doi:10.1016/j.apsusc.2020.148154
Kargozarfard, Z., Haghtalab, A., Ayatollahi, S., and Badizad, M. H. (2020). Molecular Dynamics Simulation of Calcium Sulfate Nucleation in Homogeneous and Heterogeneous Crystallization Conditions: An Application in Water Flooding. Ind. Eng. Chem. Res. 59, 22258–22271. doi:10.1021/acs.iecr.0c04290
Koleini, M. M., Badizad, M. H., Mahani, H., Dastjerdi, A. M., Ayatollahi, S., and Ghazanfari, M. H. (2021). Atomistic Insight into Salinity Dependent Preferential Binding of Polar Aromatics to Calcite/brine Interface: Implications to Low Salinity Waterflooding. Sci. Rep. 11, 11967. doi:10.1038/s41598-021-91402-0
Koleini, M. M., Badizad, M. H., Ghatee, M. H., and Ayatollahi, S. (2019a). 'An Atomistic Insight into the Implications of Ion-Tuned Water Injection in Wetting Preferences of Carbonate Reservoirs. J. Mol. Liquids 293, 111530. doi:10.1016/j.molliq.2019.111530
Koleini, M. M., Badizad, M. H., Hartkamp, R., Ayatollahi, S., and Ghazanfari, M. H. (2020). The Impact of Salinity on the Interfacial Structuring of an Aromatic Acid at the Calcite/Brine Interface: An Atomistic View on Low Salinity Effect. J. Phys. Chem. B 124, 224–233. doi:10.1021/acs.jpcb.9b06987
Koleini, M. M., Badizad, M. H., Kargozarfard, Z., and Ayatollahi, S. (2019b). Interactions between Rock/Brine and Oil/Brine Interfaces within Thin Brine Film Wetting Carbonates: A Molecular Dynamics Simulation Study. Energy Fuels 33, 7983–7992. doi:10.1021/acs.energyfuels.9b00496
Kumar, A., and Mandal, A. (2019). 'Critical Investigation of Zwitterionic Surfactant for Enhanced Oil Recovery from Both sandstone and Carbonate Reservoirs: Adsorption, Wettability Alteration and Imbibition Studies. Chem. Eng. Sci. 209, 115222. doi:10.1016/j.ces.2019.115222
Kumar, K., Dao, E. K., and Mohanty, K. K. (2008). Atomic Force Microscopy Study of Wettability Alteration by Surfactants. Spe J. 13, 137–145. doi:10.2118/93009-pa
Kumar, S., Kumar, A., and Mandal, A. (2017). Characterizations of Surfactant Synthesized from Jatropha Oil and its Application in Enhanced Oil Recovery. Aiche J. 63, 2731–2741. doi:10.1002/aic.15651
Liu, Z. L., Zhao, G., Brewer, M., Lv, Q. C., and Sudholter, E. J. R. (2021). 'Comprehensive Review on Surfactant Adsorption on mineral Surfaces in Chemical Enhanced Oil Recovery. Adv. Colloid Interf. Sci. 294, 102467. doi:10.1016/j.cis.2021.102467
Nikseresht, S., Riazi, M., Amani, M. J., and Tabrizi, F. F. (2020). 'Prediction of Oil/water Interfacial Tension Containing Ionic Surfactants. Colloid Interf. Sci. Commun. 34, 100217. doi:10.1016/j.colcom.2019.100217
Ruan, Y. Y., Deng, B. N., He, D. S., and Chi, R. (2021). 'Synergetic Effect of Cottonseed Fatty Acid Salt and Nonionic Surfactant NP-4 in the Froth Flotation of Siliceous-Calcareous Phosphate Rock'. Colloids Surf. a-Physicochemical Eng. Aspects 622, 126650. doi:10.1016/j.colsurfa.2021.126650
Saeedi Dehaghani, A. H., and Badizad, M. H. (2019). Impact of Ionic Composition on Modulating Wetting Preference of Calcite Surface: Implication for Chemically Tuned Water Flooding. Colloids Surf. A: Physicochemical Eng. Aspects 568, 470–480. doi:10.1016/j.colsurfa.2019.02.009
Saxena, N., Kumar, S., and Mandal, A. (2018). 'Adsorption Characteristics and Kinetics of Synthesized Anionic Surfactant and Polymeric Surfactant on Sand Surface for Application in Enhanced Oil Recovery. Asia-Pacific J. Chem. Eng. 13, e2211. doi:10.1002/apj.2211
Saxena, N., Pal, N., Dey, S., and Mandal, A. (2017). Characterizations of Surfactant Synthesized from palm Oil and its Application in Enhanced Oil Recovery. J. Taiwan Inst. Chem. Eng. 81, 343–355. doi:10.1016/j.jtice.2017.09.014
Song, X.-W., Zhao, R.-h., Cao, X.-L., Zhang, J.-C., Zhang, L., Zhang, L., et al. (2013). Dynamic Interfacial Tensions between Offshore Crude Oil and Enhanced Oil Recovery Surfactants. J. Dispersion Sci. Tech. 34, 234–239. doi:10.1080/01932691.2012.658324
Sun, H., Ren, P., and Fried, J. R. (1998). The COMPASS Force Field: Parameterization and Validation for Phosphazenes. Comput. Theor. Polym. Sci. 8, 229–246. doi:10.1016/s1089-3156(98)00042-7
Sun, L. H., Liu, W. D., and Sun, C. L. (2011). The Adsorption Property of Wettability Reversal Surfactant. Amr 233-235, 2051–2055. doi:10.4028/www.scientific.net/amr.233-235.2051
Tangparitkul, S., Charpentier, T. V. J., Pradilla, D., and Harbottle, D. (2018). 'Interfacial and Colloidal Forces Governing Oil Droplet Displacement: Implications for Enhanced Oil Recovery. Colloids Inter. 2, 30. doi:10.3390/colloids2030030
Tariq, M., Serro, A. P., Saramago, B., Lopes, J. N. C., and Rebelo, L. P. N. (2019). Adsorption and Viscoelastic Behaviour of Ionic Liquid Surfactants on Gold Surfaces. J. Mol. Liquids 282, 633–641. doi:10.1016/j.molliq.2019.02.060
Yuan, S., Wang, S., Wang, X., Guo, M., Wang, Y., and Wang, D. (2016). Molecular Dynamics Simulation of Oil Detachment from Calcite Surface in Aqueous Surfactant Solution. Comput. Theor. Chem. 1092, 82–89. doi:10.1016/j.comptc.2016.08.003
Keywords: surfactants, adsorption isotherm, wettability, molecular dynamics simulation, nanoparticles
Citation: Hou J, Lin S, Du J and Sui H (2022) Study of the Adsorption Behavior of Surfactants on Carbonate Surface by Experiment and Molecular Dynamics Simulation. Front. Chem. 10:847986. doi: 10.3389/fchem.2022.847986
Received: 04 January 2022; Accepted: 28 February 2022;
Published: 07 April 2022.
Edited by:
Mohammad Tariq, Universidade NOVA de Lisboa, PortugalReviewed by:
Nilesh Choudhary, Indian Institute of Technology Tirupati, IndiaMehdi Koleini, Sharif University of Technology, Iran
Copyright © 2022 Hou, Lin, Du and Sui. This is an open-access article distributed under the terms of the Creative Commons Attribution License (CC BY). The use, distribution or reproduction in other forums is permitted, provided the original author(s) and the copyright owner(s) are credited and that the original publication in this journal is cited, in accordance with accepted academic practice. No use, distribution or reproduction is permitted which does not comply with these terms.
*Correspondence: Jinze Du, dGpkdWppbnplQGhvdG1haWwuY29t; Hong Sui, c3VpaG9uZ0B0anUuZWR1LmNu