 XiaoLe Han
 Fan Yu1†
 Xiao-Long Yang
95% of researchers rate our articles as excellent or good
Learn more about the work of our research integrity team to safeguard the quality of each article we publish.
Find out more
ORIGINAL RESEARCH article
Front. Chem. , 14 February 2022
Sec. Supramolecular Chemistry
Volume 10 - 2022 | https://doi.org/10.3389/fchem.2022.821392
This article is part of the Research Topic Stimuli-Responsive Emissive Organic and Metal-Organic Compounds View all 6 articles
Water-soluble Cu-In-Zn-S quantum dots (CIZS QDs) with orange fluorescence have been synthesized with a glutathione (GSH) as stabilizer via facile a one-step hydrothermal method. The optimal reaction conditions of CIZS QDs including temperature, time, pH, and the molar ratios of precursors were studied. TEM results indicate that the aqueous-dispersible CIZS QDs are quasi-spherical, and the average diameters are 3.76 nm with excellent fluorescent stability. Furthermore, the cytotoxicity of CIZS QDs was investigated by the microcalorimetry combining with TEM and the IC50 was 10.2 μM
Quantum dots (QDs), also known as semiconductor nanocrystals, generally have a particle size of 2–10 nm (Liu et al., 2018; Bai et al., 2019). Due to the strong quantum confinement effect, their continuous band structure becomes a discrete energy level structure (Tian et al., 2020), giving QDs unique optoelectronic properties and causing the interests of researchers (Rani et al., 2020; Adel et al., 2021). Especially, the quaternary system QDs are the most widely studied and relatively mature quaternary semiconductor. For instance, Cu-In-Zn-S (CIZS) QDs are not only having a global rich composition of non-toxic elements, but also with direct band gap covering the best energy range for photovoltaic applications (Chen et al., 2017; Chen et al., 2018; Liu et al., 2020). In addition, the introduction of Zn ions in the ternary system CIS or CISe makes the CIZS or CISe system have good stability, narrow emission line width, wide spectrum adjustable range, and high photoluminescence quantum yield (PLQYs) (Xu et al., 2017; Bai et al., 2019). Due to their unique and excellent optical properties, quaternary system QDs are often used in light-emitting solar concentrators (LSCs), bioimaging and light-emitting diodes, sensors, and other fields (Deng et al., 2012; Niu et al., 2018; Wu et al., 2018; Hu et al., 2019). At the same time, QDs are considered to be very ideal materials for preparing fluorescent probes because of their high photoluminescence efficiency and large stokes shift (Zhao et al., 2021). In this regard, for different types of QDs, their unique properties are appropriately used for application research such as the labeling and detection of ions and other substances (Gui et al., 2017; Meng et al., 2020).
In this paper, the synthesized CIZS QDs with low cytotoxicity can selectively detect lead ions. Lead is a heavy-duty, non-ferrous metal material with corrosion resistance due to its low melting point, good corrosion resistance, good X-ray impermeability, good plasticity (Bonnassieux et al., 2021; Jin et al., 2021), and widely used in plate and pipe processing (Singh et al., 2018). In addition, it is also used in industrial fields such as the chemical industry, cable manufacturing, battery production, and radiation protection (Chibowska et al., 2016; Singh et al., 2018; Bai et al., 2019). There is no doubt that lead is also one of the three major heavy metal pollutants. It is a heavy metal element that seriously harms human health. Lead in the human body mainly comes from food intake and drinking tap water. Most lead is stored in the bones, and only about 10% flows with the blood circulation distributing to various tissues and organs throughout the body, affecting the functions of red blood cells, the brain, the kidneys, and the nervous system (Chibowska et al., 2016). Especially after infants and young children absorb lead, more than 30% of the lead will stay in the body, affecting their growth and intellectual development (Senut et al., 2012). Therefore, researchers have developed many methods to detect Pb2+ in the past few decades to study the impact of lead on biology and the environment. Among them, the fluorescent probe method has attracted wide attention of researchers due to its high sensitivity, strong selectivity, simplicity, and low power consumption. In this paper, using glutathione as stabilizer and nitrate as precursor, hydrophilic CIZS QDs were synthesized by the one-step hydrothermal method with good biocompatibility and high fluorescence stability. According to the micro-calorimetric technique, the biological effect of CIZS QDs on S. cerevisiae was investigated and its low cytotoxicity is proved. What is more, in the selective detection of specific metal ions, high-sensitivity detection of Pb2+ is realized. In addition, we also used isothermal titration calorimetry (ITC) experiment, TEM, and fluorescence lifetime experiment to explore the mechanism of interaction between QDs and lead ions, which laid a good foundation for the design and application of fluorescent probes.
Copper nitrate (Cu(NO3)2) was purchased from Sinopharm Chemical Reagent Co., Ltd. (Shanghai, China). Sodium sulfide (Na2S·9H2O) was purchased from Shanghai Ling Feng Chemical Reagent Co., Ltd. (Shanghai, China). Zinc nitrate (Zn(NO3·6H2O)2, 99.99%), glutathione (reduced) (GSH, 98%), and sodium hydroxide (NaOH, AR) were purchased from Shanghai Aladdin Bio-Chem Technology Co., Ltd. Indium nitrate (In(NO3)3, 99.99%) was bought from Shanghai Macklin Biochemical Co., Ltd.
Phosphatebuffer saline (PBS, pH = 7.4), and yeast extract peptone dextrose (YPED) medium were prepared by dissolving yeast extract (10 g), peptone (10 g), and glucose (20 g) in DI water (1.0 L) at natural pH, which was then sterilized under high-pressure steam at 120°C for 30 min. The water used in the experiment is deionized distilled. All the chemicals were of analytical grade and used without further purification.
The photoluminescence (PL) emission and ultraviolet-visible (UV-Vis) absorption spectrums were measured by the fluorescence spectrophotometer (HITACHI F-4600) and ultraviolet-visible spectrophotometer (HITACHI U-3900H), respectively. Transmission microscopy (TEM, TECNAI G220 S-TWIN) was used to obtain the shape and size distribution of CIZS QDs. XPS spectra was acquired via X-ray photoelectron spectroscopy (MULTILAB2000) for determining the elementary composition. X-ray diffraction (XRD) measurement was carried out using X-ray diffractometer (D8 ADVANCE) to analyze the crystalline structure of CIZS QDs. The fluorescence lifetime of CIZS QDs was measured by photoluminescence spectrometer (FLS 1000) to obtain the average fluorescence lifetime of QDs and the decay model of fluorescence intensity.
The CIZS QDs were synthesized by a simple hydrothermal method. Typically, 1.9 mg of Cu(NO3)2 (10−5 M), 30.08 mg of In(NO3)3 (10−5 M), 14.87 mg of Zn(NO3)2·6H2O (5 × 10⁻⁵ M), and 0.2151 g of GSH were mixed with 48 ml of water. Then, 0.1680 g of Na2S·9H2O was dispersed in 2 ml of water and slowly poured into the mixture. Subsequently, the NaOH solution (1 and 0.1 M) was used dropwise to adjust the pH of the mixture to 9.0 under vigorous stirring. Then the mixture was place into a three-necked flask followed by heating 120°C under an open-air atmosphere using a condenser. At various time intervals, aliquots of reaction solution were withdrawn, and the reaction was stopped after 3 h. After the reaction solution was cooled to room temperature, CIZS QDs were precipitated by adding twofold ethanol. Then the precipitates were dispersed in water and freeze-dried thoroughly for further use. After that, by changing the experimental variables such as reaction temperature, reaction pH, reaction time, and precursor molar ratio, the fluorescence intensity of aqueous CIZS QDs were investigated on the different conditions.
Microcalorimetry is the science of measuring heat changes from chemical reactions or physical events. In this experiment, the metabolism thermogenic curves of S. cerevisiae in YPED medium with different concentrations of CIZS QDs at 30°C were investigated. The specific experimental process was as follows: First, S. cerevisiae was cultured in YPED medium for 10 h at 30°C. Second, 50 ml of sterilized YPED medium was mixed with 500 μl of S. cerevisiae solution, and then separated into 8 ampoules via pipette and added 5 ml yeast liquid into each ampoule. Third, different amounts of CIZS QDs (0, 0.8, 1.2, 1.6, 2.4, 3.2, 4.8, 9.6 μM) were added into these ampoules, respectively. Then all these ampules were sealed and oscillated thoroughly. Finally, transfer the packaged ampoule to isothermal microcalorimeter (TAM air) for measuring heat changes of S. cerevisiae incubated with different concentrations of CIZS QDs. After the experiments, the data were analyzed. All the experiments were repeated three times.
S. cerevisiae was incubated with CIZS QDs (1.6, 4.8 μM) in YEPD at 30°C for 6 h as the absorbance rose to 0.8 (about 360 min) at 600 nm (A600) for laser scanning confocal and TEM.
Isothermal titration calorimetry (ITC) is a technique for measuring the heat of titration reaction between the titrant and the titrant under the condition that the sample and the reference are at the same temperature. Like ordinary acid-base titration, there will be a heat change after each titration, and ITC can just capture this heat change. Under the condition of 298.15 K, the titrated substance is CIZS QDs (2.3 × 10⁻⁴ M), the titrant is Pb2+ solution (10−7 M), and the total amount of titrant is 50 µl, which is instilled 25 times, 2 µl each time. Titration interval is 200 s.
CIZS QDs were prepared by a hydrothermal reaction between the nitrate salts of the corresponding metals and sodium sulfide as sulfide precursor at 120°C. In this study, we investigated the effects of reaction temperature, reaction time, pH value of reaction, and the molar ratio of different precursors on the fluorescence intensity of the synthesized QDs to confirm the optimum reaction condition. The related results are shown in Supplementary Figure S1. According to the experiments, the PL intensity of CIZS QDs was the strongest when the molar ratios of precursors were Cu:In:Zn:S = 1:10:70:70 and Cu:Zn = 1:5. Meanwhile, we found the optimal reaction time was 3.0 h, reaction temperature was 120°C, and pH value of the reaction was 9.00.
The synthesized QDs were characterized by fluorescence spectroscopy and UV-vis spectrophotometer. The fluorescence emission spectrum and UV-visible spectrum of QDs are shown in Figure 1. It indicates that the position of emission and absorption peaks is at 603 and 365 nm, respectively. In addition, the fluorescence of QDs was orange under the irradiation of 365 nm ultraviolet lamp, which was enhanced gradually with increasing the reaction time, and reached a maximum at 3.0 h, followed by a slight decrease. It suggested that the PL intensity of CIZS QDs reached the maximum when the reaction time was 3.0 h. Therefore, the CIZS QDs used in the following tests were all samples that reacted at 3.0 h.
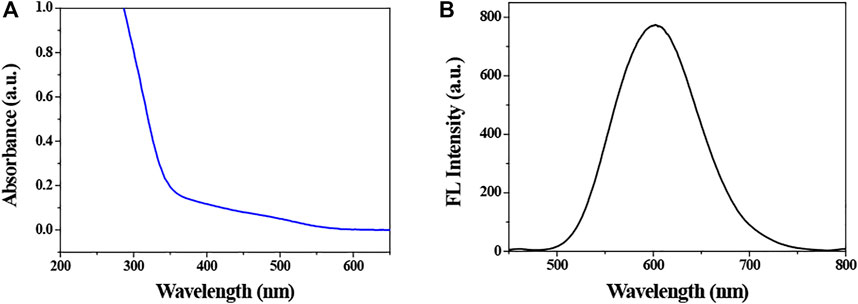
FIGURE 1. (A) Absorption and (B) photoluminescence spectrums of CIZS QDs (the concentration is 2.3 × 10⁻⁴ M). The related absorption and fluorescence peak positions were 365 and 603 nm, respectively.
Fluorescence quantum yield is an indispensable analytical quantity for the characterization of synthetic quantum dots, which was obtained by photoluminescence spectrometer. The results showed that the PL quantum yield is about 9.18%, which was obtained after three repeated tests. Meanwhile, the quantum yield of CIZS QDs obtained from a photoluminescence spectrometer was reconfirmed with the data calculated with rhodamine B as control. The quantum yield of CIZS QDs was calculated according to Eq. 1.
where Yu is the quantum yield of CIZS QDs and Ys is the quantum yield of rhodamine B. Fu and Fs are the integrated fluorescence intensity of CIZS QDs and rhodamine, respectively. Au and As represent the maximum absorbance value of CIZS QDs and rhodamine B, respectively. Besides, according to the literature report (Guo et al., 2013), the PL quantum yield of rhodamine B is 89%. We can speculate that the PL quantum yield of CIZS QDs was 9.16%, which was basically the same as the data obtained from the above test.
The morphology, particle size, and dispersion of the synthesized QDs can be observed by means of microscope. The TEM observation of CIZS QDs is in Figure 2B. The wide-field TEM images of CIZS QDs revealed that QDs have a good monodispersity and quasi-spherical morphology. As shown in Figure 2A, the average particle size of the CIZS QDs was calculated to be 3.76 nm. Figure 2C was the XRD pattern for a sample of CIZS QDs with the optimal reaction condition. It showed that the XRD pattern of CIZS QDs consist of the characteristic peaks of the zinc blended (cubic) structure (Park and Kim, 2011). In addition, it matched well the pattern of the CuInS2 bulk (JCPDS:47-1372) (Park and Kim, 2011). The diffraction peaks were broadened due to the finite particle size of CIZS QDs. Moreover, as shown in Figure 3, the XPS pattern of CIZS QDs demonstrated the existence of Cu, In, Zn, and S of quaternary CIZS QDs, which were consistent with the fact that they were obtained from the XRD pattern of CIZS QDs. The elementary composition of Cu, In, Zn, and S of CIZS QDs was 0.10, 0.32, 0.39, and 5.76%, respectively. Thus, the approximate ratio of these elements was Cu:In:Zn:S = 1:3:4:57.
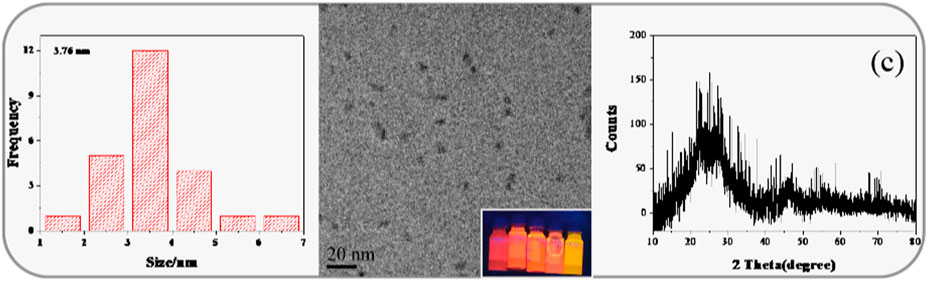
FIGURE 2. (A) The corresponding histograms of size distribution of CIZS QDs; (B) TEM image of CIZS QDs, inset: digital imaging under different Cu-Zn molar ratio UV lamps; (C) XRD pattern of CIZS QDs.
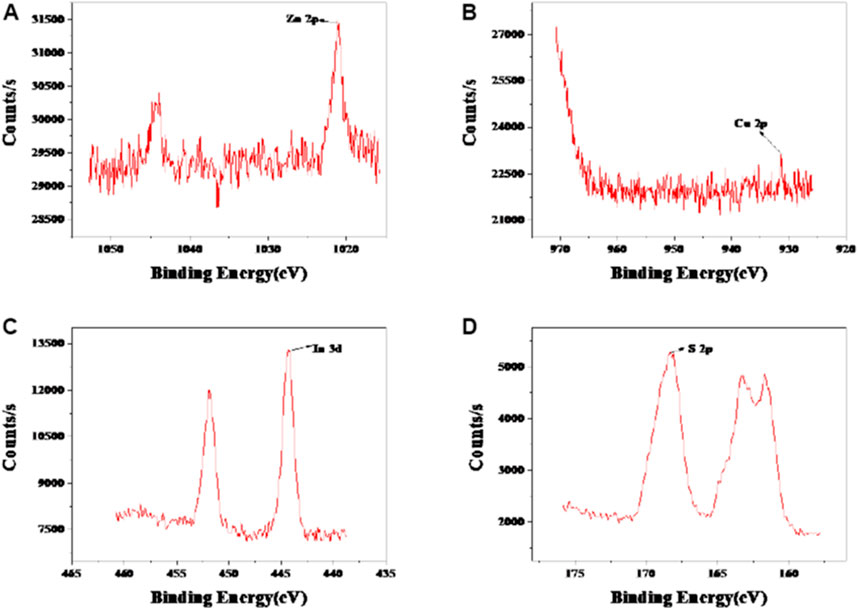
FIGURE 3. XPS of spectrum of CIZS QDs. (A) Zn 2p spectrum; (B) Cu 2p spectrum; (C) In 3 d spectrum; and (D) S 2p spectrum of CIZS QDs.
To evaluate the cytotoxicity of CIZS QDs, the effects of CIZS QDs on S. cerevisiae were investigated by using a TAM air micro-calorimeter and TEM. S. cerevisiae was selected as a unicellular eukaryotic model organism because it has been widely used as in the toxicological evaluation of chemicals (Chouhan et al., 2014). The typical thermogenic power-time (p-t) curve of S. cerevisiae as a control group without CIZS QDs was shown in Figure 4A. Comparing to the thermogenic curves of S. cerevisiae with different concentrations of CIZS QDs (Figure 4B), we could find the metabolism of S. cerevisiae was changed regularly and the heat output in the metabolism process decreased gradually with the increase of concentration of CIZS QDs. It suggested that CIZS QDs have a certain effect on the growth and metabolism of yeast. According to the thermokinetic Equation 3, the data are analyzed and the related thermodynamic and kinetic information about the multiplying metabolism are listed in Table 1.
Or
where t is the incubation time, P is the power output at time t, P0 is the power at time t = 0, and k is the growth rate constant calculated from the slope of the semi-logarithm of the exponential phase (Han et al., 2019). As shown in Figure 4C, the relationship between growth rate constant k and concentration of CIZS QDs was fitted and there was a good exponential relationship between them. Then we calculated the inhibitory ratio (I) and the half inhibitory concentration (IC50) by formula. The inhibitory ratio is a particularly important parameter to detect the biological toxicity of QDs, which can be calculated through Eq. 4:
where k0 is the rate constant of the control and kc is the rate constant for microbes inhibited by an inhibitor at a concentration c (Han T. et al., 2020). Similarly, with the addition of concentration of CIZS QDs, the inhibitory ratio (I) increased gradually, as seen in Figure 4C. When the inhibitory ratio (I) is equal to 50%, the half inhibitory concentration (IC50) was obtained, which could represent the inhibition capability of the compound quantitatively. The smaller the value of IC50, the stronger its inhibitory activity. According to the fitted relationship between the inhibitory ratio (I) and the concentration of CIZS QDs, the value of IC50 was equal to 10.2 μM (Table 1). According to the data studied by our group previously (Han et al., 2019; Han XL et al., 2020) (Supplementary Tables S1, S2), it suggested that CIZS QDs had less toxicity. The results of electron microscopy also confirmed this conclusion.
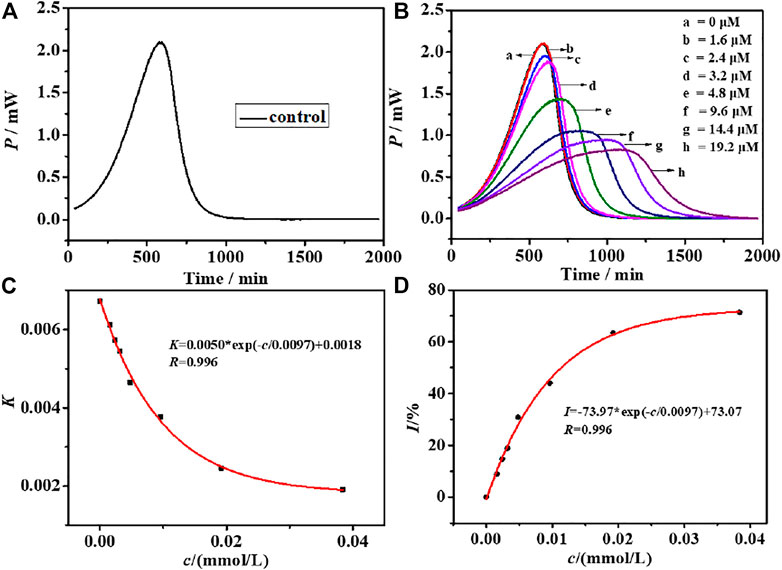
FIGURE 4. (A) Growth thermogenic curve of S. cerevisiae without CIZS QDs and (B) affected by CIZS QDs with different concentrations at 30°C; relationship between the CIZS QDs with different concentrations and (C) growth rate constant k; (D) fitting graph of the relationship between CIZS concentration and inhibition ratio.
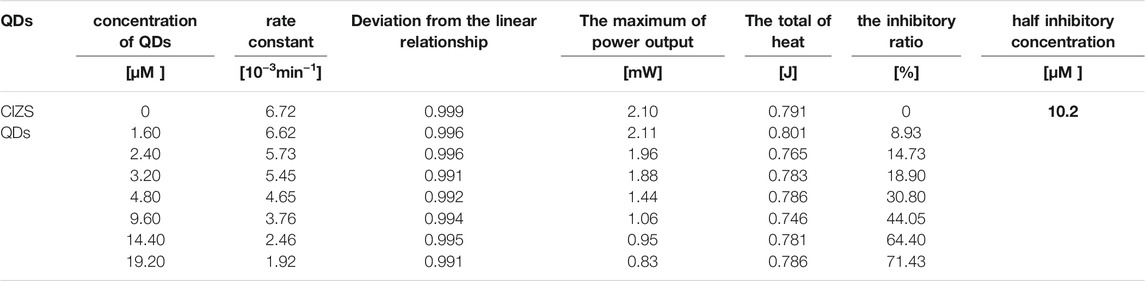
TABLE 1. Parameters of S. cerevisiae growth at different concentrations of CIZS QDs.
Just as shown in Figure 5, TEM images of S. cerevisiae treated with a certain concentration of CIZS QDs (Figures 5D,E) were found to have some differences of morphology in comparison with the control groups without CIZS QDs (Figures 5A,B). The control cell morphology is clear, and the cell wall is intact. Comparing with another two images representing the morphology of S. cerevisiae treated with CIZS QDs, some white vacuoles appeared in the cytoplasm. However, most of them remained intact. This phenomenon revealed that CIZS QDs had a negligible effect on the morphology of S. cerevisiae. Meanwhile, we found CIZS QDs could be internalized into the yeast cells by using laser scanning confocal microscopy. The yeast cells have been incubated with CIZS QDs for 6 h to analyze the intracellular uptake of QDs. Figures 5C,F represented the bright-field and dark-field images of yeast cells incubated with CIZS QDs, respectively. In Figure 5F, the orange fluorescence of CIZS QDs could be observed in yeast cells after being incubated with S. cerevisiae, which indicated that the CIZS QDs can be applied in bioimaging. We speculated CIZS QDs have a good potential application in bioimaging due to the low cytotoxicity and fluorescent stability.
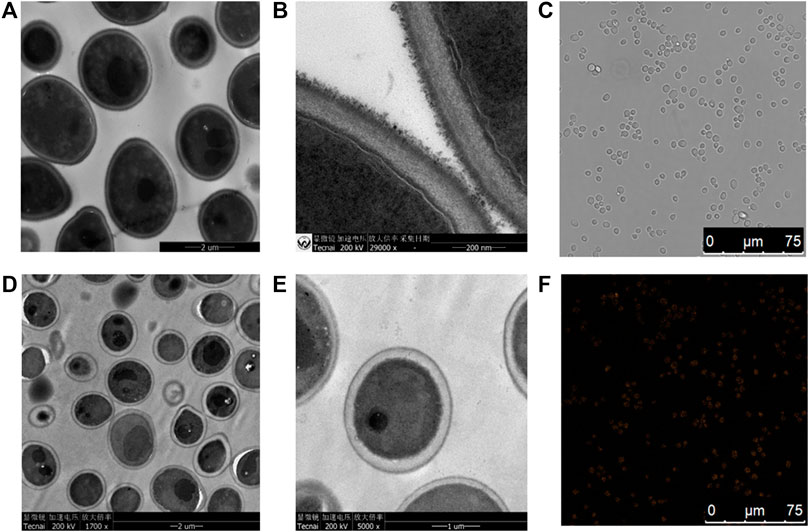
FIGURE 5. TEM images of a thin section of yeast cells after incubation. (A,B) Control group of yeast cells without CIZS QDs; (D,E) test group of yeast cells of 5 h incubation with CIZS QDs; (C,F) confocal images of yeast cells incubated with CIZS QDs under the excitation at 405 nm. The concentrations of CIZS QDs were 1.6 μM.
UV-vis absorption measurement is a sensitive method to explore the structural changes and to know the complex formations (Bashir et al., 2021). Figure 6A is the UV absorption spectrum of CIZS QDs only (A) and the absorption of CIZS QDs with the eight diverse kinds of metal cations (B-I). It is shown that the absorbance of CIZS QDs decreased with joining the same concentration of different metal cations to varying degrees, especially lead ions, leading to a most significant reduction. Meanwhile, after joining Pb2+, CIZS QDs have a slight red shift phenomenon. We concluded that CIZS QDs can detect Pd2+ sensitively due to forming complexes of Pb2+- CIZS QDs and speculated the structure of CIZS QDs has a certain influence. The XED data confirmed our prediction. Figure 6B was an obvious wide peak in the XRD pattern of CIZS QDS in the range of 10–80°, and the peak position was about 23°. According to the Bragg equation
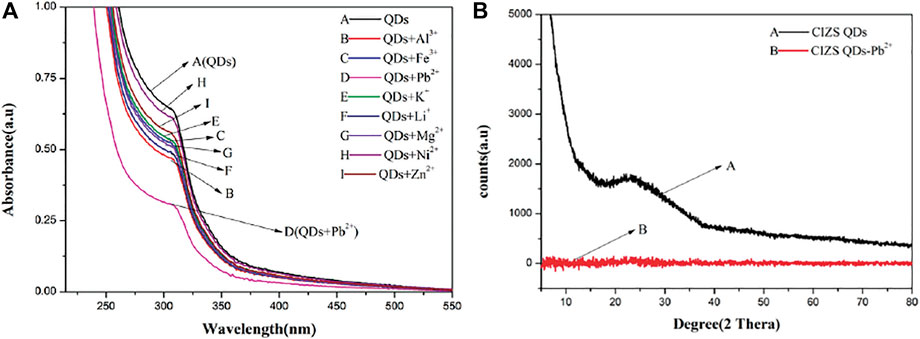
FIGURE 6. (A) The ultraviolet absorption curves of CIZS QDs in the presence of different metal ions. (B) Comparison of X-ray diffraction patterns of CIZS QDs before and after Pb2+ addition.
We further attempted to use CIZS QDs with low toxicity and good fluorescence stability as an ion detection probe. By measuring the PL intensities of CIZS QDs in the presence of 11 other kinds of metal ions, we found no significant difference at the concentration of all metal ions which is 10 nM, respectively, from Figure 7A. However, as the concentration of metal ions increased to 10 mM, it could be seen that Pb2+ had the largest quenching effect on the fluorescence intensity of CIZS QDs (in Figure 7B). It revealed the PL emission of orange emitting CIZS QDs could be selectively quenched by Pb2+ without extra surface modification. Furthermore, we carried about the experiment related to the fluorescence spectra of CIZS QDs quenched by the addition of different concentrations of Pb2+ (in Figure 7C). It was illustrated that the fluorescence of CIZS QDs can be selectively quenched by Pb2+ to a great extent. All the data were analyzed according to the Stern-Volmer Eq. 5.
where F0 and F are PL intensity of CIZS QDs with and without the quenchers [Pb2+], KD is the Stern-Volmer constant. The relationship between relative PL intensity (F0/F-1) of CIZS QDs and the concentration of quencher [Pb2+] is illustrated in Figure 7D. From the linear Stern-Volmer plot, the calculated KD value is 0.052 × 10⁶ M−1, and the LoD is estimated using the formula
where τ0 denotes the lifetime of CIZS QDs in the absence of a quencher. The maximum value of
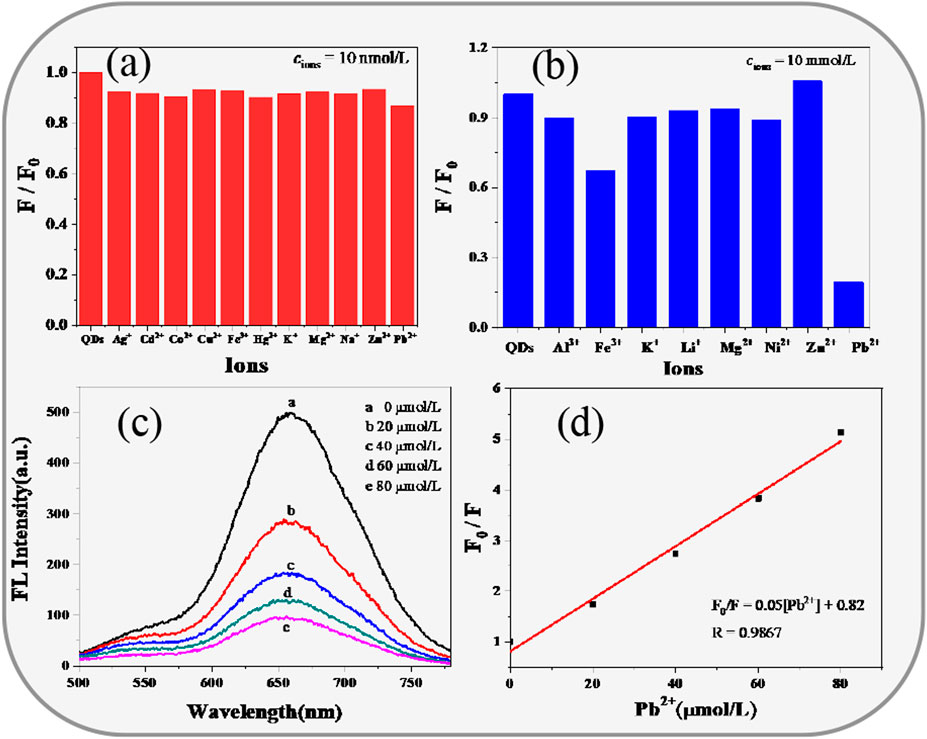
FIGURE 7. Fluorescence detection of Cu2+ by CIZS QDs. the relative fluorescence emission intensity at 603 nm of CIZS QDs in the presence of different metal ions, (A) the concentration of the metal cation is 10 nM and (B) 10 mM; (C) fluorescence emission quenching spectra of CIZS QDs with different concentrations of Pb2+, the concentrations of Cu2+ are 0, 20, 40, 60, and 80 μM; (D) the linear relationship between the fluorescent intensity ratios of F0/F and the concentration of Pb2+; all the experiments were conducted three times in parallel.
The instantaneous fluorescence lifetime of CIZS QDS and the instantaneous fluorescence lifetime after adding Pb2+ were measured by instantaneous fluorometer. The PL decay curves of CIZS QDs were fitted by the triexponential function equation:
where τ1, τ2, and τ3 denote the photoluminescent fluorescence lifetime of CIZS QDS, and A1, A2, and A3 denote the relative weight of the decay component at t = 0. According to the fitting results in (Supplementary Figure S2), the values of A1, A2, and A3 accounted for 5.9%, 6.5%, and 88.0%, respectively. Besides, τ1, τ2, and τ3 accounted for 0.89, 8.88, and 0.89 µs, respectively. Among them, τ1 and τ3 are associated with short-lived decay, while τ2 stands for long-lived decay. The average lifetime was calculated from the following equation (Sun et al., 2021):
The average life (
Isothermal titration calorimetry (ITC) has been widely used to understand molecular interactions, which provides a direct route to the complete thermodynamic and kinetic properties of molecular interactions. Therefore, ITC is used to explore the formation mechanism of CIZS QDs-Pb2+ complex and obtain the thermodynamic parameters and binding affinity of the interacting process (Huang et al., 2015; Zhao et al., 2017; Li et al., 2021). The solutions of CIZS QDs and Pb2+ were added in the calorimeter-cell and the syringe, respectively. The results were fitted by Micro Cal PEAQ-ITC Analysis software (Nano Analyze) after deducting the dilution heats and are shown in Supplementary Figure S3. Affinity constant (

TABLE 2. Thermodynamic parameters obtained by ITC for the interaction between CIZS QDs and Pb2+.
In summary, we synthesized a facile quaternary CIZS QDs via a one-step hydrothermal method in the usual atmosphere pressure, under the optimal reaction condition (t = 3.0 h, T = 120°C, pH = 9.00, the molar ration is Cu:In:GSH:S: n = 1:10:70:70:5). The QDs were characterized quasi-spherically, and their average diameter were 3.76 nm with excellent orange fluorescence. According to the value of IC50 (10.3 uM), CIZS QDs were proved to have low cytotoxicity. Meanwhile, CIZS QDs can be internalized in the yeast cell and fluorescence and stability can be seen. Without any modification, the synthesized CIZS QDs have a rapid and gentle response to Pb2+ ion. The fluorescence of CIZS QDs can be used to detect the Pb2+ ion as a fluorescent sensor, the limit of detection (LoD) is 5.18 × 10⁻⁷ M for Pb2+. According to the PL and ITC experiments, the quenching mechanism is judged to be static quenching, involving hydrogen bonding or van der Waals forces in the formation of Pb2+ and CIZS QDs.
The raw data supporting the conclusion of this article will be made available by the authors, without undue reservation.
XH and X-LY: conception and design. XH, FY and JZ: development and methodology and analysis and interpretation of data. All authors contributed to writing, reviewing, and revising the article and approved the submitted version.
This work was supported by the National Natural Science Foundation of China (21503283,81872755 and 82073714); the National Key R&D Program of China (2020YFC1712703), Natural Science Foundation of Hubei Province 2018CFB135; Fundamental Research Funds for the South-Central University for Nationalities (CZY20015); The National Civil Affairs Commission’s young and middle-aged talents training program (MZR20008), and the Talented Youth Cultivation Program from “the Fundamental Research Funds for the Central Universities,” South-Central University for Nationalities (CZP20008).
The authors declare that the research was conducted in the absence of any commercial or financial relationships that could be construed as a potential conflict of interest.
All claims expressed in this article are solely those of the authors and do not necessarily represent those of their affiliated organizations, or those of the publisher, the editors, and the reviewers. Any product that may be evaluated in this article, or claim that may be made by its manufacturer, is not guaranteed or endorsed by the publisher.
XH provided important mentorship for FY. We thank the many individuals that supported sentinel plots and contributed.
The Supplementary Material for this article can be found online at: https://www.frontiersin.org/articles/10.3389/fchem.2022.821392/full#supplementary-material
Adel, R., Ebrahim, S., Shokry, A., Soliman, M., and Khalil, M. (2021). Nanocomposite of CuInS/ZnS and Nitrogen-Doped Graphene Quantum Dots for Cholesterol Sensing. ACS Omega 6, 2167–2176. doi:10.1021/acsomega.0c05416
Bai, X., Purcell-Milton, F., and Gun’ko, Y. (2019). Optical Properties, Synthesis, and Potential Applications of Cu-Based Ternary or Quaternary Anisotropic Quantum Dots, Polytypic Nanocrystals, and Core/Shell Heterostructures. Nanomaterials 9, 85. doi:10.3390/nano9010085
Bashir, A., Farooq, M., Malik, A., Naseem, S., and Bhatti, A. S. (2021). UV-A Treatment of ZrO2 Thin Films Fabricated by Environmental Friendlier Water-Based Solution Processing: Structural and Optical Studies. Coatings 11, 821. doi:10.3390/coatings11070821
Bonnassieux, Y., Brabec, C. J., Cao, Y., Carmichael, T. B., Chabinyc, M. L., Cheng, K.-T., et al. (2021). The 2021 Flexible and Printed Electronics Roadmap. Flex. Print. Electron. 6, 023001. doi:10.1088/2058-8585/abf986
Chen, X., Chen, S., Xia, T., Su, X., and Ma, Q. (2017). Aqueous Synthesis of High Quality Multicolor Cu-Zn-In-S Quantum Dots. J. Lumin. 188, 162–167. doi:10.1016/j.jlumin.2017.04.019
Chen, F., Yao, Y., Lin, H., Hu, Z., Hu, W., Zang, Z., et al. (2018). Synthesis of CuInZnS Quantum Dots for Cell Labelling Applications. Ceramics Int. 44, S34–S37. doi:10.1016/j.ceramint.2018.08.276
Chibowska, K., Baranowska-Bosiacka, I., Falkowska, A., Gutowska, I., Goschorska, M., and Chlubek, D. (2016). Effect of Lead (Pb) on Inflammatory Processes in the Brain. Int. J. Mol. Sci. 17, 2140. doi:10.3390/ijms17122140
Chouhan, R. S., Qureshi, A., and Niazi, J. H. (2014). Quantum Dot Conjugated S. cerevisiae as Smart Nanotoxicity Indicators for Screening the Toxicity of Nanomaterials. J. Mater. Chem. B 2, 3618–3625. doi:10.1039/c4tb00495g
De Acha, N., Elosúa, C., Corres, J., and Arregui, F. (2019). Fluorescent Sensors for the Detection of Heavy Metal Ions in Aqueous Media. Sensors 19, 599. doi:10.3390/s19030599
Deng, D., Chen, Y., Cao, J., Tian, J., Qian, Z., Achilefu, S., et al. (2012). High-Quality CuInS2/ZnS Quantum Dots for In Vitro and In Vivo Bioimaging. Chem. Mater. 24, 3029–3037. doi:10.1021/cm3015594
Gui, W., Chen, X., and Ma, Q. (2017). A Novel Detection Method of Human Serum Albumin Based on CuInZnS Quantum Dots-Co2+ Sensing System. Anal. Bioanal. Chem. 409, 3871–3876. doi:10.1007/s00216-017-0332-8
Guo, W., Chen, N., Dong, C., Tu, Y., Chang, J., and Zhang, B. (2013). One-pot Synthesis of Hydrophilic ZnCuInS/ZnS Quantum Dots for In Vivo Imaging. RSC Adv. 3, 9470–9475. doi:10.1039/c3ra40752g
Han, X. L., Lei, J., Chen, K., Li, Q., Hao, H., Zhou, T., et al. (2019). Cytotoxicity of CdTe Quantum Dots with Different Surface Coatings against Yeast Saccharomyces cerevisiae. Ecotoxicol. Environ. Saf. 174, 467–474. doi:10.1016/j.ecoenv.2019.03.013
Han T, T., Kang, H., Ye, S., Yuan, Y., Zhang, Y., and Dong, L. (2020). Ultra-stable Fluorescent Film Sensor Based on Quantum Dots for the Real-Time Detection of Cu2+. Sci. Total Environ. 746, 141412. doi:10.1016/j.scitotenv.2020.141412
Han, X. L., Li, Q., Hao, H., Liu, C., Li, R., Yu, F., et al. (2020). Facile One-step Synthesis of Quaternary AgInZnS Quantum Dots and Their Applications for Causing Bioeffects and Detecting Cu2+. RSC Adv. 10, 9172–9181. doi:10.1039/c9ra09840b
Hu, Z. M., Fei, G. T., and Zhang, L. D. (2019). Synthesis of green-to-red-emitting Cu-Ga-S/ZnS Core/shell Quantum Dots for Application in white Light-Emitting Diodes. J. Lumin. 208, 18–23. doi:10.1016/j.jlumin.2018.12.023
Huang, S., Qiu, H., Liu, Y., Huang, C., Sheng, J., Su, W., et al. (2015). Molecular Interaction Investigation between Three CdTe:Zn 2+ Quantum Dots and Human Serum Albumin: A Comparative Study. Colloids Surf. B: Biointerfaces 136, 955–962. doi:10.1016/j.colsurfb.2015.10.028
Jiang, P., Li, S., Han, M., Liu, Y., and Chen, Z. (2019). Biocompatible Ag2S Quantum Dots for Highly Sensitive Detection of Copper Ions. Analyst 144, 2604–2610. doi:10.1039/c9an00096h
Jin, B. B., Huang, H. S., Kong, S. Y., Zhang, G. Q., Yang, B., Jiang, C. X., et al. (2021). Antimony Tin Oxide/lead Selenide Composite as Efficient Counter Electrode Material for Quantum Dot-Sensitized Solar Cells. J. Colloid Interf. Sci. 598, 492–499. doi:10.1016/j.jcis.2021.04.073
Kumar, V., Kumar, A., Chini, M. K., and Satapathi, S. (2021). Fluorescent Fe2O3-CdSe Nanocomposite Probe for Selective Detection and Removal of Picric Acid. Mater. Chem. Phys. 260, 124130. doi:10.1016/j.matchemphys.2020.124130
Leng, Z., Huang, L., Shao, F., Lv, Z., Li, T., Gu, X., et al. (2014). Facile Synthesis of Cu-In-Zn-S Alloyed Nanocrystals with Temperature-dependent Photoluminescence Spectra. Mater. Lett. 119, 100–103. doi:10.1016/j.matlet.2013.12.109
Li, R.-H., Feng, X.-Y., Zhou, J., Yi, F., Zhou, Z.-Q., Men, D., et al. (2020). Rhomboidal Pt(II) Metallacycle-Based Hybrid Viral Nanoparticles for Cell Imaging. Inorg. Chem. 60, 431–437. doi:10.1021/acs.inorgchem.0c03095
Li, Y., Liu, X., Liang, T., and Fan, J. (2021). Core and Surface Electronic States and Phonon Modes in SiC Quantum Dots Studied by Optical Spectroscopy and Hybrid TDDFT. J. Phys. Chem. C 125, 7259–7266. doi:10.1021/acs.jpcc.1c00209
Liu, X.-Y., Zhang, G., Chen, H., Li, H., Jiang, J., Long, Y.-T., et al. (2018). Efficient Defect-Controlled Photocatalytic Hydrogen Generation Based on Near-Infrared Cu-In-Zn-S Quantum Dots. Nano Res. 11, 1379–1388. doi:10.1007/s12274-017-1752-7
Liu, Y., Jiang, K., Nie, Y., Guo, Y., and Ma, Q. (2020). A Visual Electrochemiluminescence Biosensor Based on CuInZnS Quantum Dots for Superoxide Dismutase Detection. Anal. Bioanal. Chem. 412, 1893–1899. doi:10.1007/s00216-020-02440-y
Liu, Y., Tang, X., Deng, M., Zhu, T., Edman, L., and Wang, J. (2021). Hydrophilic AgInZnS Quantum Dots as a Fluorescent Turn-On Probe for Cd2+ Detection. J. Alloys Compd. 864, 158109. doi:10.1016/j.jallcom.2020.158109
Meng, L., Liu, M., Xiao, K., Zhang, X., Du, C., and Chen, J. (2020). Sensitive Photoelectrochemical Assay of Pb2+ Based on DNAzyme-Induced Disassembly of the "Z-Scheme" TiO2/Au/CdS QDs System. Chem. Commun. 56, 8261–8264. doi:10.1039/d0cc03149f
Niu, X., Zhong, Y., Chen, R., Wang, F., Liu, Y., and Luo, D. (2018). A "Turn-On" Fluorescence Sensor for Pb2+ Detection Based on Graphene Quantum Dots and Gold Nanoparticles. Sensors Actuators B: Chem. 255, 1577–1581. doi:10.1016/j.snb.2017.08.167
Park, J., and Kim, S.-W. (2011). CuInS2/ZnS Core/shell Quantum Dots by Cation Exchange and Their Blue-Shifted Photoluminescence. J. Mater. Chem. 21, 3745–3750. doi:10.1039/c0jm03194a
Passos, S. G. B., Kunst, T. H., Freitas, D. V., and Navarro, M. (2020). Paired Electrosynthesis of ZnSe/ZnS Quantum Dots and Cu2+ Detection by Fluorescence Quenching. J. Lumin. 228, 117611. doi:10.1016/j.jlumin.2020.117611
Rani, U. A., Ng, L. Y., Ng, C. Y., and Mahmoudi, E. (2020). A Review of Carbon Quantum Dots and Their Applications in Wastewater Treatment. Adv. Colloid Interf. Sci. 278, 102124. doi:10.1016/j.cis.2020.102124
Senut, M.-C., Cingolani, P., Sen, A., Kruger, A., Shaik, A., Hirsch, H., et al. (2012). Epigenetics of Early-Life lead Exposure and Effects on Brain Development. Epigenomics 4, 665–674. doi:10.2217/epi.12.58
Shi, J. H., Lin, Z. Y., Kou, S. B., Wang, B. L., and Jiang, S. L. (2021). Enantioseparation of Mandelic Acid and Substituted Derivatives by High‐performance Liquid Chromatography with Hydroxypropyl‐β‐cyclodextrin as Chiral mobile Additive and Evaluation of Inclusion Complexes by Molecular Dynamics. Chirality 33, 675–684. doi:10.1002/chir.23348
Shu, Y., Yan, J., Lu, Q., Ji, Z., Jin, D., Xu, Q., et al. (2020). Pb Ions Enhanced Fluorescence of Ag2S QDs with Tunable Emission in the NIR-Ⅱ Window: Facile One Pot Synthesis and Their Application in NIR-Ⅱ Fluorescent Bio-Sensing. Sensors Actuators B: Chem. 307, 127593. doi:10.1016/j.snb.2019.127593
Singh, G., Singh, V., Sobolewski, M., Cory-Slechta, D. A., and Schneider, J. S. (2018). Sex-Dependent Effects of Developmental Lead Exposure on the Brain. Front. Genet. 9, 89. doi:10.3389/fgene.2018.00089
Sun, Y., Zhu, H., Jin, N., Chen, O., and Zhao, J. (2021). Fast Lifetime Blinking in Compact CdSe/CdS Core/Shell Quantum Dots. J. Phys. Chem. C 125, 15433–15440. doi:10.1021/acs.jpcc.1c03949
Tian, W., Dou, L., Jin, Z., Xiao, J., and Li, J. (2020). Full-color Micro-LED Displays with Cadmium-free Quantum Dots Patterned by Photolithography Technology. Appl. Opt. 59, 11112–11122. doi:10.1364/AO.412267
Vaishanav, S. K., Korram, J., Nagwanshi, R., Karbhal, I., Dewangan, L., Ghosh, K. K., et al. (2021). Interaction of Folic Acid with Mn2+ Doped CdTe/ZnS Quantum Dots: In Situ Detection of Folic Acid. J. Fluoresc. 31, 951–960. doi:10.1007/s10895-021-02708-1
Wang, X., Xie, C., Zhong, J., Liang, X., and Xiang, W. (2015). Synthesis and Temporal Evolution of Zn-Doped AgInS2 Quantum Dots. J. Alloys Compd. 648, 127–133. doi:10.1016/j.jallcom.2015.06.240
Wang, Y., Li, W., Hu, X., Zhang, X., Huang, X., Li, Z., et al. (2021). Efficient Preparation of Dual-Emission Ratiometric Fluorescence Sensor System Based on Aptamer-Composite and Detection of Bis(2-Ethylhexyl) Phthalate in Pork. Food Chem. 352, 129352. doi:10.1016/j.foodchem.2021.129352
Wu, R., Wang, T., Wu, M., Lv, Y., Liu, X., Li, J., et al. (2018). Synthesis of Highly Stable CuInZnS/ZnS//ZnS Quantum Dots with Thick Shell and its Application to Quantitative Immunoassay. Chem. Eng. J. 348, 447–454. doi:10.1016/j.cej.2018.04.145
Xu, Y., Chen, T., Hu, X., Jiang, W., Wang, L., Jiang, W., et al. (2017). The Off-Stoichiometry Effect on the Optical Properties of Water-Soluble Copper Indium Zinc Sulfide Quantum Dots. J. Colloid Interf. Sci. 496, 479–486. doi:10.1016/j.jcis.2017.02.049
You, J., Ji, J., Wu, J., Wang, S., Chen, P., Mao, R., et al. (2020). Ratiometric Fluorescent Test Pen Filled with a Mixing Ink of Carbon Dots and CdTe Quantum Dots for Portable Assay of Silver Ion on Paper. Microchim Acta 187, 391. doi:10.1007/s00604-020-04369-6
Zhao, X., Lu, D., Liu, Q. S., Li, Y., Feng, R., Hao, F., et al. (2017). Hematological Effects of Gold Nanorods on Erythrocytes: Hemolysis and Hemoglobin Conformational and Functional Changes. Adv. Sci. 4, 1700296. doi:10.1002/advs.201700296
Keywords: CuInZnS quantum dots, Microcalorimetry, IC50, Fluorescent sensor, Pb2+, Ion detection
Citation: Han XL, Yu F, Lei JW, Zhu JH, Fu HY, Hu JC and Yang X-L (2022) Pb2+ Responsive Cu-In-Zn-S Quantum Dots With Low Cytotoxicity. Front. Chem. 10:821392. doi: 10.3389/fchem.2022.821392
Received: 24 November 2021; Accepted: 05 January 2022;
Published: 14 February 2022.
Edited by:
Zhao Chen, Jiangxi Science and Technology Normal University, ChinaReviewed by:
Daobin Zhang, Jiangxi Science and Technology Normal University, ChinaCopyright © 2022 Han, Yu, Lei, Zhu, Fu, Hu and Yang. This is an open-access article distributed under the terms of the Creative Commons Attribution License (CC BY). The use, distribution or reproduction in other forums is permitted, provided the original author(s) and the copyright owner(s) are credited and that the original publication in this journal is cited, in accordance with accepted academic practice. No use, distribution or reproduction is permitted which does not comply with these terms.
*Correspondence: XiaoLe Han, SFhMMTIyMEBob3RtYWlsLmNvbQ==; Xiao-Long Yang, eXhsMTk4MzA5MTVAMTYzLmNvbQ==
†These authors share first authorship
Disclaimer: All claims expressed in this article are solely those of the authors and do not necessarily represent those of their affiliated organizations, or those of the publisher, the editors and the reviewers. Any product that may be evaluated in this article or claim that may be made by its manufacturer is not guaranteed or endorsed by the publisher.
Research integrity at Frontiers
Learn more about the work of our research integrity team to safeguard the quality of each article we publish.