 Xuzhuo Sun1
 Bo Li
Bo Li Jing Chen
95% of researchers rate our articles as excellent or good
Learn more about the work of our research integrity team to safeguard the quality of each article we publish.
Find out more
ORIGINAL RESEARCH article
Front. Chem. , 06 October 2022
Sec. Electrochemistry
Volume 10 - 2022 | https://doi.org/10.3389/fchem.2022.1034993
This article is part of the Research Topic Photo/Electrocatalysis for Energy Storage and Conversion View all 9 articles
In this work, TiO2 was selected as an additive to the Sm0.2Ce0.8O2-δ (SDC) electrolyte and its influence on the electrolyte properties were investigated. The tetrabutyl titanate hydrolysis product was introduced into the SDC samples as a source of TiO2. The lattice contraction of SDC was observed by XRD when the smaller ionic radius Ti4+ (0.605Å) were substituted for Ce4+ (0.97 Å). XRD analysis shows that the doping content of the TiO2 in SDC should be limited to 1 wt% to maintain the single-phase cubic fluorite structure of the SDC and avoid impurity phases. SEM characterizations suggest that the addition of TiO2 significantly promoted the grain growth and the sintering activity, especially when doping with 0.5 wt% of TiO2. The electrochemical measurements reveal that the addition of TiO2 had little effect on the conductivity of SDC samples, which was 0.0306 S cm−1 at 700°C. This study shows that 0.5 wt% TiO2 doping can effectively improve the sintering activity without reducing the SDC performance.
As one of the most promising energy conversion technologies, solid oxide fuel cells (SOFCs) have been widely investigated and utilized in the past few decades owing to their low pollution emission and high conversion efficiency (Chen et al., 2020; Sun et al., 2021; Tahir et al., 2022). Many efforts have been made to advance the application of SOFCs in large-scale power plants and various transportation systems (Park et al., 2014; Curletti et al., 2015; Chen et al., 2018; Lee et al., 2018; Zhang et al., 2022). As an important component of SOFCs, the electrolyte acts as a gas barrier between the anode and the cathode, preventing the fuel and air from mixing. Meanwhile, the electrolyte offers a pathway for oxygen transportation due to the presence of oxygen vacancies in the lattice, which play a role in facilitating the ionic oxygen conductivity (Norberg et al., 2011; Mahato et al., 2015).
Among the many candidates, yttrium stabilized zirconia (YSZ) has a high oxygen ionic conductivity and chemical stability and is a commonly used electrolyte for SOFCs (Son et al., 2020). However, the utilization of the YSZ electrolyte requires a high operating temperature since its ionic conductivity drastically decreases below 800°C (Chen et al., 2002; Zheng et al., 2011; Zhao et al., 2013). Additionally, Bi2O3, which shows high ionic conductivity at intermediate temperatures, is also considered to replace YSZ (Punn et al., 2007; Li et al., 2008; Tan et al., 2012; Zagaynov et al., 2017). Another promising electrolyte family is Sr and Mg-doped lanthanum gallium (La0.8Sr0.2Ga0.8Mg0.2O3-δ, LSGM), which has a perovskite structure, high ion conductivity and negligible electronic conductivity at 600°C (Gao et al., 2020). In addition, it is chemically stable within a wide range of oxygen partial pressures (Garcia-Garcia et al., 2020). However, when the sintering temperature is higher than 1,250°C, the commonly used NiO-containing cermet anode tends to react with the LSGM electrolyte, generating the second phase with high resistance at the anode/electrolyte interface, which leads to the degradation of cell performance (Joo et al., 2011).
Therefore, developing alternative electrolytes which show high ionic conductivity at intermediate temperatures is urgent. In recent years, studies have shown that the ionic conductivity of doped CeO2 is nearly one order of magnitude higher than that of YSZ at 500∼800°C (Raghvendra and Singh, 2017). Moreover, there is no phase transition for Sm0.2Ce0.8O2-δ (SDC) from room temperature to high temperatures. The addition of the trivalent rare-earth ions Y3+, Gd3+ or Sm3+ into the CeO2 lattice can form a cubic fluorite structure and generate a large number of oxygen vacancies, which further improves the ionic conductivity and mobility (Zheng et al., 2011; Anjaneya et al., 2014). In particular, in Sm-doped CeO2 materials, the radius of Sm3+ (1.04 Å) matches the radius of Ce4+ (1.04 Å), and the binding enthalpy between Sm3+ and the oxygen vacancies in the CeO2 lattice is the lowest, which is most favorable for oxygen ion transport. Therefore, SDC has a high ionic conductivity at low and medium temperatures.
Despite the excellent ionic conductivity of SDC, there are still two main issues limiting its application as electrolytes for SOFCs, i.e., the poor sintering activity and the increase of electrical conductance at low oxygen partial pressures. Due to the space charge effect, Sm doping has a significant inhibitory effect on the grain growth of CeO2, which is unfavorable to SDC sintering.
A certain number of oxygen vacancies (
The addition of 0.1 mol% TiO2 to the CeO2 matrix has been found to enhance the grain boundary mobility of cerium oxide (Chen and Chen, 1996). However, additives that act as sintering aids in the SDC electrolyte may cause problems, such as the appearance of impurity phases and the reduction of ionic conductivity. In this work, TiO2 were selected as additives to improve the sintering activity of SDC. The influence of TiO2 addition on the phase stability, microstructure, conductivity and sintering behavior of SDC was investigated.
Commercial SDC powder (Samarium Doped Ceria (20% Sm)-Tape Cast Grade Powder, Fuel Cell Materials, United States) with a surface area of 5.8 m2 g−1 was used in this study. TiO2 is obtained by hydrolysis and calcination of tetrabutyl titanate solution (C16H36O4Ti, 99.0%; Tianjin Kermel, China). SDC powders were mixed with tetrabutyl titanate using ethanol as solvent, and 1 wt% of PVB was added into the starting solution. The raw material powder was obtained by stirring and drying the solution in a hot plate. The SDC powder of mixed TiO2 (0–1.5 wt% of TiO2 to SDC denoted as SDC-xT; x = 0, 0.1, 0.2, 0.5, 1 and 1.5) was pressed with a die of diameter 13 mm at 5 MPa. The initial diameter (Ø0) of the sample is 13 mm. The pellets were subsequently sintered in air for 5 h at 1,400°C, 1,300°C and 1,200°C, respectively. The diameter of the calcined disc was measured with vernier calipers as Ø1. The shrinkage of the calcined pellets was calculated as Ø1/ Ø0. The density of the samples were obtained by Archimedes’ drainage method.
The X-ray diffraction (XRD) data of the SDC-XT pellets were obtained using a Bruker D8 advance (Germany, diffractometer with Cu-Kα radiation, scan test parameters: 20–80°, scanning speed: 5° min−1). The valence state of cerium was investigated by X-ray photoelectron spectroscopy (XPS, Escalab 250Xi). All the spectra were calibrated with the binding energy of carbon (1s) as the baseline (284.6 eV). The curve fitting of the XPS spectra was achieved by the XPS speak4.1 software.
For electrochemical characterizations, Pt slurry was coated on both sides of the SDC-xT pellets and fired at 800°C for 1 h. Electrochemical impedance spectroscopy (EIS) was performed on symmetric cells in static air, in a temperature range of 550–800°C, using the electrochemical workstation (Zennium) in the frequency range from 0.01 Hz to 1 MHz. The ionic conductivity was calculated using the measured resistance according to the following equation:
where σ is the ionic conductivity (S cm−1), L is the pellet thickness (cm), and S is the surface area of the electrode (cm2). Each measurement was taken three times and the results were averaged for further comparison.
The microstructures of the electrolyte samples were characterized using scanning electron microscopy (SEM, HT7700 Exalens). The fractured cross-section and surface of the disc samples were sputter-coated with gold for SEM observations. The average grain size was estimated by the Nano Measurer software.
Figure 1A shows the XRD spectra of the SDC-xT (x = 0, 0.2, 0.5, 1 and 1.5) samples sintered at 1,400°C for 5 h. The SDC-xT (x = 0, 0.2 and 0.5) samples were found to have single phase with a cubic-fluorite structure. When the TiO2 content is below 1%, TiO2 is better dispersed in SDC and both form a good solid solution. When the TiO2 content exceeded 1 wt%, impurity phases were observed and the intensities of the impurity phases increased with the TiO2 content. Rutile TiO2 (JCPDS#-010860148) has a characteristic peak at 27.4°, and anatase TiO2 has a characteristic peak at 25.3°. The above characteristic peaks cannot coincide with the impurity peak in Figure 1A, which proves that TiO2 and SDC have chemically reacted to produce a new substance. When the TiO2 content exceeded 1%, the reaction between TiO2 and SDC produced CeTi2O6 (Otsuka-Yao-Matsuo et al., 2004), and this impurity phase could also be observed in the SEM spectrum of the sample.
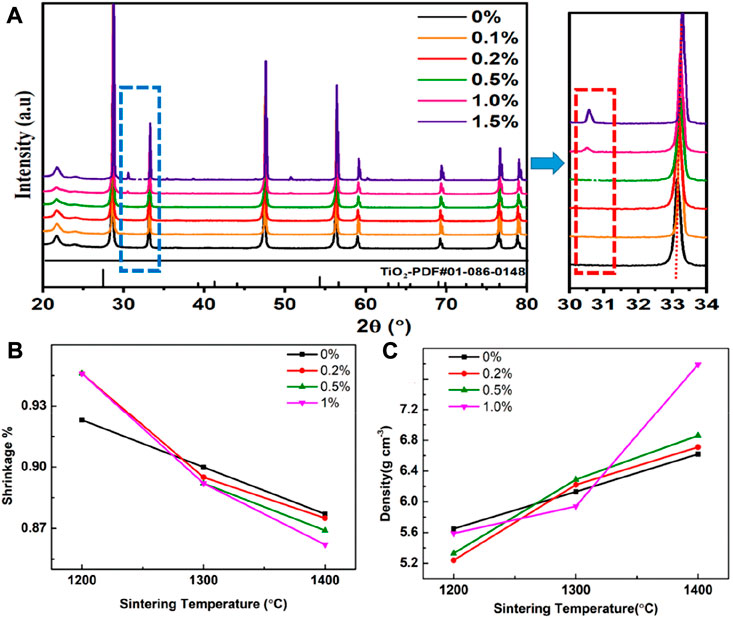
FIGURE 1. (A) The XRD patterns of SDC-xT with different TiO2 contents (x = 0, 0.2, 0.5, 1.0 and 1.5). (B) The shrinkage of SDC-xT (x = 0, 0.2, 0.5 and 1). (C) The density of SDC-xT (x = 0, 0.2, 0.5 and 1) sintered at different temperatures.
With the increase of TiO2 content, the characteristic peaks of the XRD were shifted to higher angles, which proved that the samples exhibited obvious lattice shrinkage. The cell volume of each SDC sample was evaluated by fitting the XRD patterns using the Jade software. Table 1 summarized the impact of TiO2 content on the cell volume. The cell volume decreases with TiO2 content, except for SDC0.5T, which shows a slight increase in cell volume. The radius of the ions decreases in the following order: Ce3+ (1.283 Å) > Sm3+ (1.219 Å) > Ce4+ (0.97 Å) > Ti4+ (0.74 Å)/Ti3+ (0.67 Å) (Shannon, 1976; Mao et al., 2010; Li et al., 2013). Thus, the partial substitution of Ce4+ with Ti4+/Ti3+ leads to a decrease in cell volume, exhibits significant lattice shrinkage. However, when the TiO2 content is 0.5 wt%, the cell volume increases. According to the XPS spectra of Ce 3d and O 1s (Figure 3), when doping with 0.5 wt% TiO2, the incorporation of TiO2 promotes the reduction of Ce4+ to Ce3+, corresponding to an increase in cell volume (Mandal et al., 2016). Meanwhile, the increase in adsorbed oxygen suggested by the O 1s spectrum also accounts for the increase in cell volume.
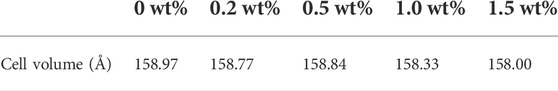
TABLE 1. Cell volumes derived from the XRD patterns of samples with different TiO2 content.
The density of the samples were obtained by Archimedes’ drainage method. The shrinkage (Figure 1B) and densification (Figure 1C) of the SDC were investigated as a function of TiO2 content and sintering temperature. Figure 1B shows the shrinkage of the SDC-xT with sintering temperature. The shrinkage was significantly high for samples sintered at higher temperatures compared to lower temperatures. Therefore, the optimum sintering temperature for the SDC-xT powders was selected to be 1,400°C. The density of all SDC-xT samples increase with the increase in sintering temperature, as shown in Figure 1C. After sintering at 1,200°C, the undoped SDC-0T showed the highest density and the density of the doped SDC-xT decreased with increasing of TiO2 content. For the samples sintered at 1,400°C, the densities of all SDC-xT samples showed a large increase, with SDC-1T showing a drastic increase.
Figures 2A–E show the surface SEM images of SDC-xT (x = 0, 0.2, 0.5 1 and 1.5). The grain size was obtained by multiplying the average linear intercept length of at least 200 grains by Nano Measurer software. The averaged particle sizes for SDC-xT were shown in Figure 2F. With the increase of TiO2 content, the size of grains shows a parabolic trend, the average particle size of the SDC-xT samples first increases and then decreases. The average particle size for SDC-0.5T reached 1.34 μm, which is nearly twice as large as that of undoped SDC. Figures 2G–I provide the cross-sectional SEM images of SDC-xT (x = 0, 0.5, and 1.5). It is clearly observed from the fracture that the addition of TiO2 can improve the sintering density and reduce the porosity of the samples, and TiO2 addition is beneficial to the densification of SDC electrolytes. The sample had the smallest porosity and the densest when the TiO2 content in the sample was 0.5%. The SDC-0.5T had the largest grain size and the smallest porosity. Severely undersized dopants TiO2 at lower doping have a tendency to enhance grain boundary mobility, probably due to the large distortion of the surrounding lattice that apparently facilitates defect migration. However, TiO2 at higher doping have a tendency to suppress grain boundary mobility for a strong solute drag effect (Chen and Chen, 1996).
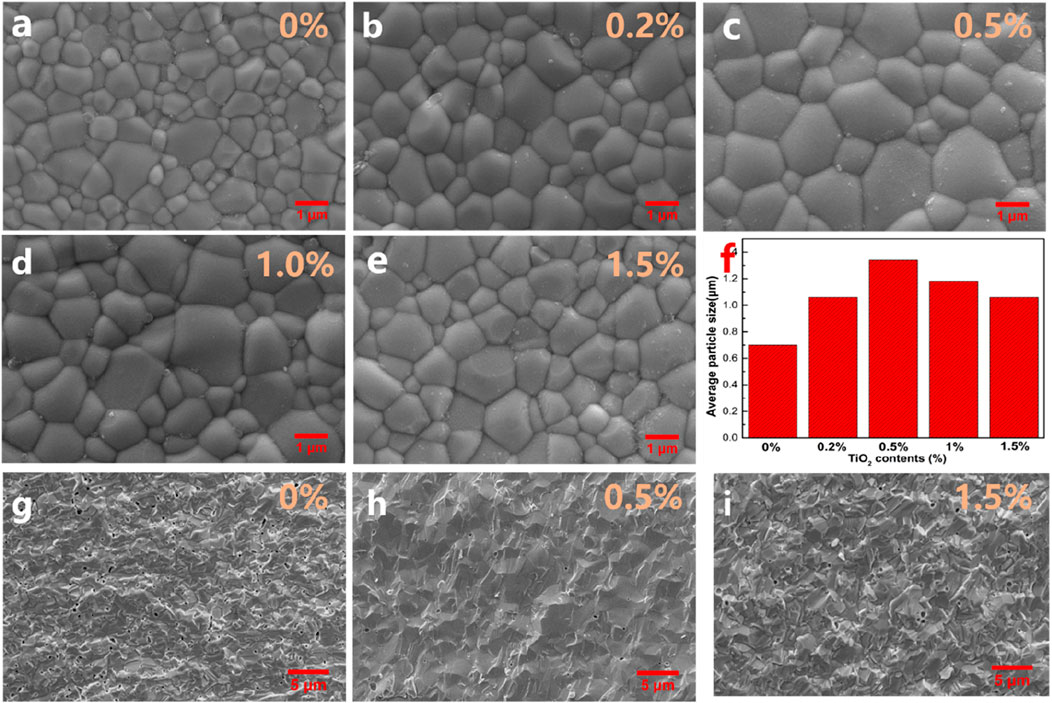
FIGURE 2. (A–E) The surface SEM images of SDC-xT (x = 0, 0.2, 0.5, 1 and 1.5) sintered at 1,400°C. (F) The averaged particle sizes for SDC-xT (x = 0, 0.2, 0.5, 1 and 1.5). (G–I) The cross-sectional SEM images of SDC-xT (x = 0, 0.5 and 1.5).
Since the activation energy for oxygen ions conductivity increases as the grain size decreases, a large grain size offers an easy pathway for oxygen transport in the electrolyte. Meanwhile, large grain size can also reduce the alternating current (AC) impedance of internal grains (Pei et al., 2017), facilitating the conduction of oxygen ions in the electrolyte. The surface morphology of the SDC-xT suggests that doping SDC with 0.5 wt% TiO2 is the best composition to achieve a dense electrolyte, and 1,400°C is the appropriate sintering temperature.
XPS was utilized to investigate the influence of TiO2 content on the oxidation state of Ce. Figures 3A,C,E show the XPS spectra of Ce 3d; the peaks are denoted as u and v, corresponding to Ce 3d3/2 and Ce 3d5/2, respectively. The sub-bands denoted as u3, v3, u1 and v1 are assigned to the characteristic peaks of Ce4+, while the sub-bands labeled u2, v2, u0 and v0 correspond to the characteristic peak of Ce3+ (Heckert et al., 2008; Gupta et al., 2009; Paparazzo, 2011). The Sm3+-doped CeO2 is a mixed ionic and electronic conductor, which exhibits the highest oxygen ionic conductivity at an optimal dopant concentration due to the minimal enthalpy of association between the Ce cations and oxygen vacancies in the fluorite lattice (Chen et al., 2009). The Ce4+/ Ce3+ ratios in SDC-xT with different TiO2 content are given in Figures 3A,C,E. As shown in Figure 3A without TiO2, the Ce3+ content in SDC was 18.26%. When the TiO2 content is 0.5%, the Ce3+ content in SDC-0.5T increased to 21.32% (Figure 3C). However, when the TiO2 content was 1%, the ratio of Ce4+/Ce3+ decreases, the content of Ce3+ decreased to 20.92% (Figure 3E), which can be attributed to an excess of TiO2 that does not enter the CeO2 lattice and forms impurity phases, such as CeTi2O625.
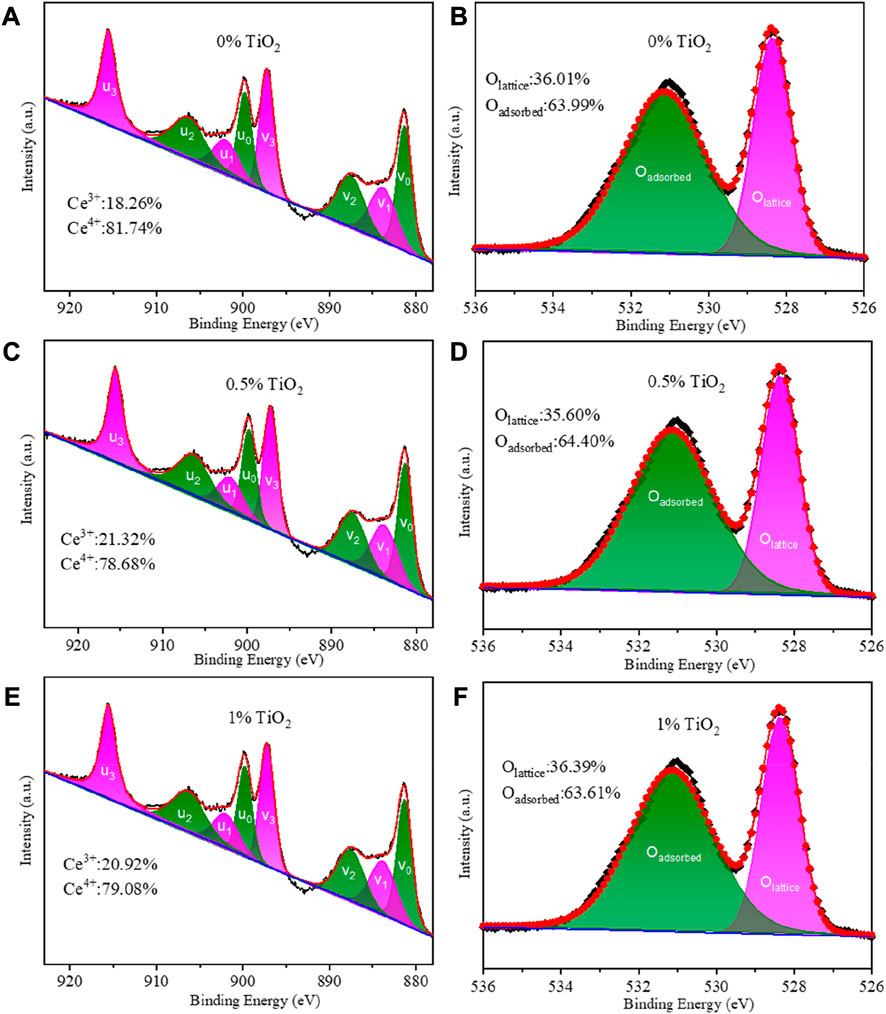
FIGURE 3. (A,C,E) XPS Ce 3d emission spectra of SDC-xT (x= 0, 0.5 and 1); (B,D,F) XPS O1s emission spectra of SDC-xT (x= 0, 0.5 and 1).
Figures 3D–F show the XPS spectra of O 1s. The sub-band with a binding energy of 528.5 eV represents the characteristic peak of lattice oxygen, and the sub-band with a binding energy of 531 eV corresponds to the characteristic peak of adsorbed oxygen (Kang et al., 2019). Figure 3 gives the ratio of lattice oxygen/adsorbed oxygen for SDC-xT samples with different TiO2 content. The lattice oxygen content of SDC-0.5T is 35.60% and the adsorbed oxygen content is 64.40%. It can be seen from Figure 3 that when the content of Ce3+ increases, the content of lattice oxygen decreases and the content of adsorbed oxygen on the oxide surface increases. SDC-0.5T has the highest surface adsorbed oxygen content. This may be due to the distortion of the lattice part caused by the mismatch of ionic radii when Ti4+ occupies the lattice site of Ce4+. The radius of Ce3+ (1.14 Å) is larger than that of Ce4+ (0.97 Å), and in order to attenuate the degree of distortion, part of Ce4+ is reduced to Ce3+, which results in a decrease of the lattice oxygen content and an increase of the surface oxygen content.
The ohmic resistance of SDC-xT (x = 0, 0.2, 0.5, and 1) sintered at 1,400°C was obtained using the four-probe method in the temperature range of 600–750°C, as shown in Figures 4A–E. In the Nyquist plot, the intersection of the impedance data measured at high frequencies with the x-axis (the real part of the impedance) is the ohmic resistance indicated by the yellow color block in the figure. The ohmic resistance value decreases with increasing test temperature, indicating that the conductivity of the electrolyte is proportional to temperature. The electrical conductivity of the SDC-xT can be calculated using Eq. 1, and the result are shown in Figure 4F. Table 2 gives the electrical conductivity of SDC-xT as a function of TiO2 content and sintering temperatures. mThe temperature firstly has a very significant effect on the conductivity, and secondly the content of TiO2 also has an effect on the conductivity. As an example, the conductivity of the sample at 650°C was 0.0217 s cm−1 without the addition of TiO2, and the conductivity of the sample decreased to 0.0169 s cm−1 with 0.2 wt% TiO2 was added. When the TiO2 content was increased to 0.5 wt% and 1.0 wt%, the conductivity of SDC-0.5T was similar to that of SDC-1.0T.
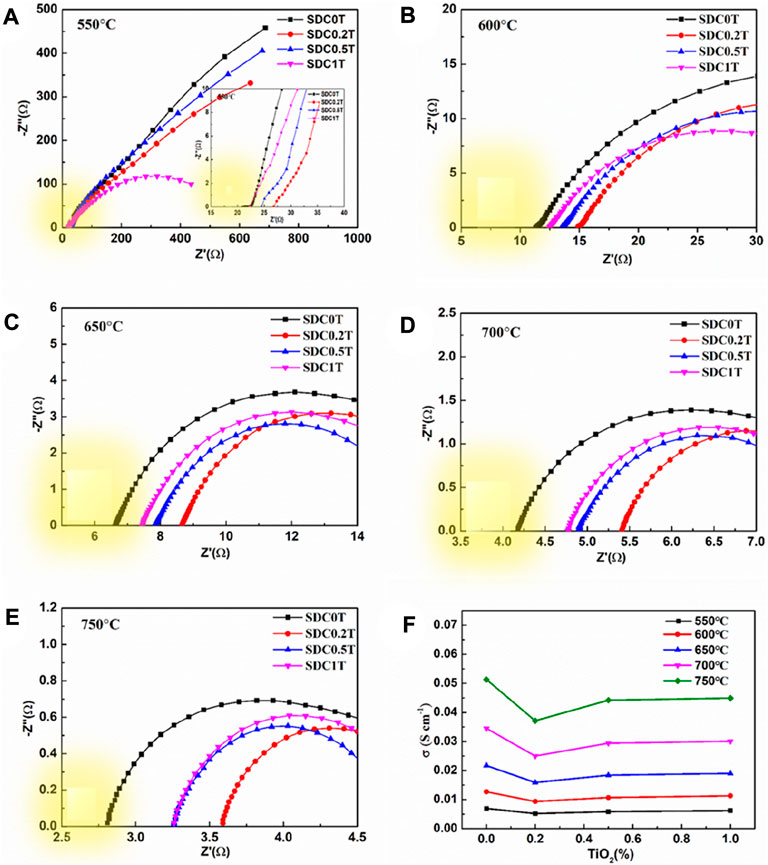
FIGURE 4. (A–E) Nyquist diagram of the impedance spectra for SDC-xT obtained at 1,400°C. (F) The electrical conductivity of the SDC-xT from 550°C to 750°C.
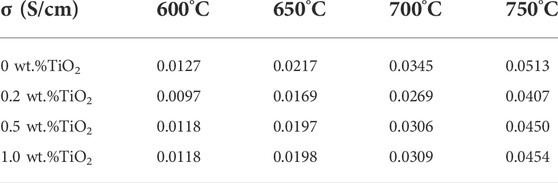
TABLE 2. Ideal electrical conductivity of SDC-xT between 600–750°C.
The density and shrinkage characterizations of the SDC-xT samples show that the samples sintered at 1,400 °C demonstrate the best sintering activity and largest grain size, which is beneficial for oxygen transport. As expected, the conductivity of undoped SDC sintered at 1,400°C was higher than that of undoped SDC sintered at lower temperatures. However, TiO2 addition led to slight reduction in the conductivity of SDC-xT, which can be attributed to the poor conductivity of TiO2 (< 10–10 S cm−1) (Miyazaki, 2008; Mazúr et al., 2012). Upon TiO2 addition, Ti4+ enters the SDC lattice, partially replacing Ce4+, resulting in a decrease in oxygen vacancy concentration of SDC (Miyazaki, 2008); consequently, decreasing the conductivity of SDC. In addition, according to the SEM results, the densification of SDC increases upon TiO2-doping when x = 0.2 and 0.5. While the conductivity of the SDC-xT samples slightly decreased, it still qualifies for electrolyte applications in SOFCs (Li et al., 2006; Bu et al., 2013). Subsequently, SDC-0.5T sintered at 1,400°C, with large particle size and good electrical conductivity, is a suitable electrolyte candidate.
Using Pt as the electrodes for symmetrical cells, the EIS results at different temperatures are shown in Figures 5A–D. Generally, the oxygen reduction reaction at the cathode includes the surface path and volume path (Fleig, 2003). However, for the pure electronic conductor Pt (Barbucci et al., 2002), the oxygen reduction reaction can only be carried out at the three-phase boundary (TPB) interface between the electrode, electrolyte and oxygen. As can be seen from the schematic diagram Figures 5E,F, the blue dashed line is the TPB interface. Hence, for Pt electrodes, only the TPB is the active reaction region (Co and Birss, 2006).
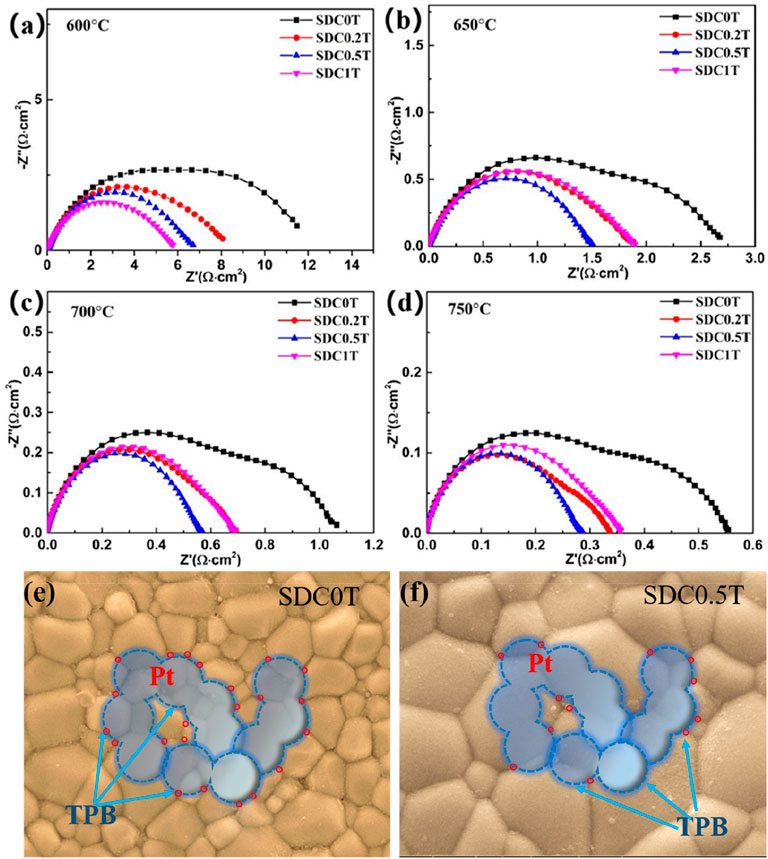
FIGURE 5. (A–D) Nyquist plots of the impedance spectra of the Pt electrodes. (E–F) Schematic diagram of the three-phase boundary of the Pt electrode reacting with oxygen at SDC-0T and SDC-0.5T electrolyte surface.
The reaction of oxygen at the electrode mainly includes several processes such as gas-phase diffusion, dissociation-adsorption, surface diffusion, and charge transfer.
The high frequency region of the EIS mainly corresponds to the charge transfer process, which is a fast reaction process. The low frequency region corresponds to the gas-phase diffusion process and dissociation-adsorption process. As shown in Figure 5, the polarization resistance of Pt at 650–750°C in the TiO2-doped electrolyte is smaller than that of the undoped SDC-0T. The polarization resistance of SDC-0.5T is the smallest, and the polarization resistance of SDC-0.2T is similar to that of SDC1T. At 700°C, the EIS of SDC0T clearly shows two arcs in the high-frequency region and low-frequency region, and the arc in the high-frequency region is larger than that in the low-frequency region. With the addition of TiO2, both arcs are reduced. The reduction of the arc in the high frequency is not significant, but the arc in the low frequency is significantly reduced. The experimental results indicate that the change in grain size of the electrolyte leads to a change in the rate control process of the oxygen reduction reaction. The charge transfer process corresponding to the high-frequency region of the impedance spectrum is less influenced by the grain size, while the adsorption-diffusion of oxygen in the corresponding low-frequency region are strongly influenced by the grain size.
Although the length of TPB interface of Pt on the surface of SDC-0T and SDC-0.5T electrolytes is the same as shown in Figures 5E,F, the Pt electrode forms a larger contact point with the grain boundary on the surface of small-sized grains (SDC-0T) than on the surface of large-sized grains (SDC-0.5T) due to the difference in grain size. The contact points are shown as red circles in the figure.
There are two paths of oxygen ions transport, one way is oxygen ions through the grain and the other way is oxygen ions through the grain boundary. The impedance spectrum shows that the polarization resistance of the electrode is gradually becoming smaller as the electrolyte grain size becomes larger, especially the impedance in the low frequency region decreases ---significantly. This result indicates that the grain boundaries in the SDC electrolyte are not favorable for the oxygen adsorption-desorption reaction, and the oxygen ions are more favorable for conduction through the grain body phase. The large grain size can effectively reduce the interface between TPB and grain, which reduces the resistance to grain boundary conduction and enhances the bulk phase conduction of oxygen ions, thus facilitating steps (2)–(3). Tian et al. (Tian and Chan, 2000) found that an increase in the sintering temperature of SDC leads to a decrease in the grain boundary region when the grain size grows, and increases the impurities within the grain boundaries as well as the SmCe´ concentration, which brings about a decrease in the grain boundary conductivity. The results also demonstrate that the growth of SDC grain size leads to a reduction in the grain boundary region, which brings about a decrease in grain boundary conductivity.
The electrolyte performance of SDC with the addition of TiO2 at various ratios was first explored. After sintering at different temperatures, it was found that the SDC had the best sintering activity at 1,400°C. In particular, when the doping ratio is 0.5 wt%, TiO2 not only promoted the increase in the electrolyte grain size but also had a minimal effect on the conductivity of the SDC. The bigger SDC grain size leads to a reduction in the grain boundary region and brings about a decrease in grain boundary conductivity.
The conductivity of SDC-0.5T reached 0.0306 S cm−1 at 700°C. This proves that TiO2 is an excellent sintering aid, and 0.5 wt% is considered to be the best dopant concentration. When the doping rate was 0.5 wt%, the addition of TiO2 improved the sintering activity of SDC, leading to an increased grain size, which facilitated the oxygen transport in the electrolyte.
The original contributions presented in the study are included in the article/supplementary materials, further inquiries can be directed to the corresponding author.
XS significantly to analysis and manuscript preparation. SD and YX performed the experiment and performed the data analyses. BL contributed to the conception of the study, performed the experiment. YT helped perform the analysis with constructive discussions. JC Supervised writing—review and editing resources.
This work was financially supported by Natural Science Foundation of China (22279029), Natural Science Foundation of Henan (212300410035, 212300410339), and Innovative Funds Plan of Henan University of Technology.
The authors declare that the research was conducted in the absence of any commercial or financial relationships that could be construed as a potential conflict of interest.
All claims expressed in this article are solely those of the authors and do not necessarily represent those of their affiliated organizations, or those of the publisher, the editors and the reviewers. Any product that may be evaluated in this article, or claim that may be made by its manufacturer, is not guaranteed or endorsed by the publisher.
Anjaneya, K. C., Nayaka, G. P., Manjanna, J., Govindaraj, G., and Ganesha, K. N. (2014). Studies on structural, morphological and electrical properties of Ce0.8Ln0.2O2−δ (Ln=Y3+, Gd3+, Sm3+, Nd3+ and La3+) solid solutions prepared by citrate complexation method. J. Alloys Compd. 585, 594–601. doi:10.1016/j.jallcom.2013.09.101
Barbucci, A., Bozzo, R., Cerisola, G., and Costamagna, P. (2002). Characterisation of composite SOFC cathodes using electrochemical impedance spectroscopy. Analysis of Pt/YSZ and LSM/YSZ electrodes. Electrochimica Acta 47 (13-14), 2183–2188. doi:10.1016/s0013-4686(02)00095-6
Bu, Y.-f., Zhong, Q., Tan, W.-y., Zhou, R.-j., Song, Y., and Cai, W. (2013). Synthesis and properties of samaria-doped ceria electrolyte via ultrasound–microwave assisted sol–gel method. Mater. Sci. Semicond. Process. 16 (6), 2058–2062. doi:10.1016/j.mssp.2013.07.034
Chen, J., Wan, D., Sun, X., Li, B., and Lu, M. (2018). Electrochemical impedance spectroscopic characterization of impregnated La0.6Sr0.4Co0.2Fe0.8O3−δ cathode for intermediate-temperature SOFCs. Int. J. Hydrogen Energy 43 (20), 9770–9776. doi:10.1016/j.ijhydene.2018.03.223
Chen, J., Yang, X., Wan, D., Li, B., Lei, L., Tian, T., et al. (2020). Novel structured Sm0.5Sr0.5CoO3-δ cathode for intermediate and low temperature solid oxide fuel cells. Electrochimica Acta 341, 136031. doi:10.1016/j.electacta.2020.136031
Chen, M., Kim, B. H., Xu, Q., Ahn, B. K., Kang, W. J., and Huang, D. p. (2009). Synthesis and electrical properties of Ce0.8Sm0.2O1.9 ceramics for IT-SOFC electrolytes by urea-combustion technique. Ceram. Int. 35 (4), 1335–1343. doi:10.1016/j.ceramint.2008.06.014
Chen, P. L., and Chen, I. W. (1996). Grain growth in CeO2: Dopant effects, defect mechanism, and solute drag. J. Am. Ceram. Soc. 79 (7), 1793–1800. doi:10.1111/j.1151-2916.1996.tb07997.x
Chen, X. J., Khor, K. A., Chan, S. H., and Yu, L. G. (2002). Influence of microstructure on the ionic conductivity of yttria-stabilized zirconia electrolyte. Mater. Sci. Eng. A 335 (1-2), 246–252. doi:10.1016/s0921-5093(01)01935-9
Co, A. C., and Birss, V. I. (2006). Mechanistic analysis of the oxygen reduction reaction at (La, Sr)MnO3 cathodes in solid oxide fuel cells. J. Phys. Chem. B 110 (23), 11299–11309. doi:10.1021/jp060099h
Curletti, F., Gandiglio, M., Lanzini, A., Santarelli, M., and Maréchal, F. (2015). Large size biogas-fed Solid Oxide Fuel Cell power plants with carbon dioxide management: Technical and economic optimization. J. Power Sources 294, 669–690. doi:10.1016/j.jpowsour.2015.06.091
Fleig, J. (2003). Solid oxide fuel cell cathodes: Polarization mechanisms and modeling of the electrochemical performance. Annu. Rev. Mat. Res. 33 (1), 361–382. doi:10.1146/annurev.matsci.33.022802.093258
Gao, R., Jain, A. C. P., Pandya, S., Dong, Y., Yuan, Y., Zhou, H., et al. (2020). Designing optimal perovskite structure for high ionic conduction. Adv. Mat. 32 (1), e1905178. doi:10.1002/adma.201905178
Garcia-Garcia, F. J., Tang, Y., Gotor, F. J., and Sayagués, M. J. (2020). Development by mechanochemistry of La0.8Sr0.2Ga0.8Mg0.2O2.8 electrolyte for SOFCs. Materials 13 (6), 1366. doi:10.3390/ma13061366
Gupta, S., Kuchibhatla, S. V. N. T., Engelhard, M. H., Shutthanandan, V., Nachimuthu, P., Jiang, W., et al. (2009). Influence of samaria doping on the resistance of ceria thin films and its implications to the planar oxygen sensing devices. Sensors Actuators B Chem. 139 (2), 380–386. doi:10.1016/j.snb.2009.03.021
Heckert, E. G., Karakoti, A. S., Seal, S., and Self, W. T. (2008). The role of cerium redox state in the SOD mimetic activity of nanoceria. Biomaterials 29 (18), 2705–2709. doi:10.1016/j.biomaterials.2008.03.014
Joo, J. H., Kim, D. Y., and Choi, G. M. (2011). Effects of anode firing temperature on the performance of the lanthanum-gallate thick-film-supported SOFC. Solid State Ionics 192 (1), 523–526. doi:10.1016/j.ssi.2010.07.014
Kang, B. S., Matsuda, J., Ju, Y. W., Kim, H. H., and Ishihara, T. (2019). Nano strain induced double columnar oxide as highly active oxygen-dissociation electrode for Ni-Fe metal supported solid oxide fuel cells. Nano Energy 56, 382–390. doi:10.1016/j.nanoen.2018.11.074
Lee, K., Kang, J., Lee, J., Lee, S., and Bae, J. (2018). Evaluation of metal-supported solid oxide fuel cells (MS-SOFCs) fabricated at low temperature (∼1, 000 °C) using wet chemical coating processes and a catalyst wet impregnation method. Int. J. Hydrogen Energy 43 (7), 3786–3796. doi:10.1016/j.ijhydene.2018.01.027
Li, H., Xia, C., Zhu, M., Zhou, Z., and Meng, G. (2006). Reactive Ce0.8Sm0.2O1.9 powder synthesized by carbonate coprecipitation: Sintering and electrical characteristics. Acta Mater. 54 (3), 721–727. doi:10.1016/j.actamat.2005.10.004
Li, Y., Yang, L., Li, Y., Yu, S., Yang, P., and Jiang, F. (2013). Influence of Ce3+ and Gd3+ co-doping on the structure and upconversion emission in hexagonal Ho3+ doped NaYbF4 phosphors. Ceram. Int. 39 (2), 1183–1188. doi:10.1016/j.ceramint.2012.07.042
Li, Z. C., Zhang, H., and Bergman, B. (2008). Synthesis and characterization of nanostructured Bi2O3-doped cerium oxides fabricated by PVA polymerization process. Ceram. Int. 34 (8), 1949–1953. doi:10.1016/j.ceramint.2007.07.018
Mahato, N., Banerjee, A., Gupta, A., Omar, S., and Balani, K. (2015). Progress in material selection for solid oxide fuel cell technology: A review. Prog. Mater. Sci. 72, 141–337. doi:10.1016/j.pmatsci.2015.01.001
Mandal, B., Mondal, A., Ray, S. S., and Kundu, A. (2016). Sm doped mesoporous CeO2 nanocrystals: Aqueous solution-based surfactant assisted low temperature synthesis, characterization and their improved autocatalytic activity. Dalton Trans. 45 (4), 1679–1692. doi:10.1039/c5dt03688g
Mao, M. M., Fan, X. C., and Chen, X. M. (2010). Effect of A-site ionic radius on the structure and microwave dielectric characteristics of Sr1+xSm1−xAl1−xTixO4 ceramics. Int. J. Appl. Ceram. Technol. 7, E156–E162. doi:10.1111/j.1744-7402.2010.02492.x
Mazúr, P., Polonský, J., Paidar, M., and Bouzek, K. (2012). Non-conductive TiO2 as the anode catalyst support for PEM water electrolysis. Int. J. Hydrogen Energy 37 (17), 12081–12088. doi:10.1016/j.ijhydene.2012.05.129
Miyazaki, H. (2008). Influence of TiO2Solid solution on the thermal property and ionic conductivity of partially stabilized zirconia. Int. J. Appl. Ceram. Technol. 5 (5), 490–498. doi:10.1111/j.1744-7402.2008.02194.x
Norberg, S. T., Hull, S., Ahmed, I., Eriksson, S. G., Marrocchelli, D., Madden, P. A., et al. (2011). Structural disorder in doped zirconias, Part I: The Zr0.8Sc0.2−xYxO1.9 (0.0 ≤ x ≤ 0.2) system. Chem. Mat. 23 (6), 1356–1364. doi:10.1021/cm102808k
Otsuka-Yao-Matsuo, S., Omata, T., and Yoshimura, M. (2004). Photocatalytic behavior of cerium titanates, CeTiO4 and CeTi2O6 and their composite powders with SrTiO3. J. Alloys Compd. 376 (1-2), 262–267. doi:10.1016/j.jallcom.2004.01.006
Paparazzo, E. (2011). On the curve-fitting of XPS Ce(3d) spectra of cerium oxides. Mater. Res. Bull. 46 (2), 323–326. doi:10.1016/j.materresbull.2010.11.009
Park, K., Yoon, D. H., Lee, S., Kwon, T. h., Bae, G., Hyun, S., et al. (2014). Fabrication and operation of a 6 kWe class interconnector-type anode-supported tubular solid oxide fuel cell stack. Int. J. Hydrogen Energy 39 (24), 12884–12893. doi:10.1016/j.ijhydene.2014.06.080
Pei, K., Li, H., Zou, G., Yu, R., Zhao, H., Shen, X., et al. (2017). Detonation nanodiamond introduced into samarium doped ceria electrolyte improving performance of solid oxide fuel cell. J. Power Sources 342, 515–520. doi:10.1016/j.jpowsour.2016.12.051
Punn, R., Feteira, A. M., Sinclair, D. C., and Greaves, C. (2007). Enhanced oxide ion conductivity in stabilized δ-Bi2O3. ChemInform 38 (11). doi:10.1002/chin.200711008
Pandey, R., and Singh, P. (2017). Electrical conductivity of YSZ-SDC composite solid electrolyte synthesized via glycine-nitrate method. Ceram. Int. 43 (15), 11692–11698. doi:10.1016/j.ceramint.2017.05.359
Shannon, R. D. (1976). Revised effective ionic radii and systematic studies of interatomic distances in halides and chalcogenides. Acta Cryst. Sect. A 32 (5), 751–767. doi:10.1107/s0567739476001551
Son, M. J., Kim, M. W., Virkar, A. V., and Lim, H.-T. (2020). Locally developed electronic conduction in a yttria stabilized zirconia (YSZ) electrolyte for durable solid oxide fuel cells. Electrochimica Acta 353, 136450. doi:10.1016/j.electacta.2020.136450
Sun, C., Alonso, J. A., and Bian, J. (2021). Recent advances in perovskite-type oxides for energy conversion and storage applications. Adv. Energy Mat. 11 (2), 2000459. doi:10.1002/aenm.202000459
Tahir, N. N. M., Baharuddin, N. A., Samat, A. A., Osman, N., and Somalu, M. R. (2022). A review on cathode materials for conventional and proton-conducting solid oxide fuel cells. J. Alloys Compd. 894, 162458. doi:10.1016/j.jallcom.2021.162458
Tan, M. Y., Tan, K. B., Zainal, Z., Khaw, C. C., and Chen, S. K. (2012). Subsolidus formation and impedance spectroscopy studies of materials in the (Bi2O3)1− (Y2O3) binary system. Ceram. Int. 38 (4), 3403–3409. doi:10.1016/j.ceramint.2011.12.052
Tian, C., and Chan, S.-W. (2000). Ionic conductivities, sintering temperatures and microstructures of bulk ceramic CeO2 doped with Y2O3. Solid State Ionics 134 (1), 89–102. doi:10.1016/s0167-2738(00)00717-7
Zagaynov, I. V., Fedorov, S. V., Konovalov, A. A., and Antonova, O. S. (2017). Perspective ceria-based solid solutions GdxBi0.2−xCe0.8O2. Mater. Lett. 203, 9–12. doi:10.1016/j.matlet.2017.05.100
Zhang, X., Tong, Y., Liu, T., Zhang, D., Yu, N., Zhou, J., et al. (2022). Robust Ruddlesden-Popper phase Sr3Fe1.3Mo0.5Ni0.2O7-δ decorated with in-situ exsolved Ni nanoparticles as an efficient anode for hydrocarbon fueled solid oxide fuel cells. SusMat 2 (4), 487–501. doi:10.1002/sus2.58
Zhao, Y., Xia, C., Jia, L., Wang, Z., Li, H., Yu, J., et al. (2013). Recent progress on solid oxide fuel cell: Lowering temperature and utilizing non-hydrogen fuels. Int. J. Hydrogen Energy 38 (36), 16498–16517. doi:10.1016/j.ijhydene.2013.07.077
Keywords: solid oxide fuel cell, Sm-doped CeO2, grain boundary, TPB, electrolyte
Citation: Sun X, Deng S, Xia Y, Li B, Tian Y and Chen J (2022) Effect of TiO2 as an additive on the sintering performance of Sm-doped CeO2-based electrolyte for solid oxide fuel cells. Front. Chem. 10:1034993. doi: 10.3389/fchem.2022.1034993
Received: 02 September 2022; Accepted: 21 September 2022;
Published: 06 October 2022.
Edited by:
Hang Cong, Guizhou University, ChinaReviewed by:
Jose Manuel Porras Vázquez, University of Malaga, SpainCopyright © 2022 Sun, Deng, Xia, Li, Tian and Chen. This is an open-access article distributed under the terms of the Creative Commons Attribution License (CC BY). The use, distribution or reproduction in other forums is permitted, provided the original author(s) and the copyright owner(s) are credited and that the original publication in this journal is cited, in accordance with accepted academic practice. No use, distribution or reproduction is permitted which does not comply with these terms.
*Correspondence: Jing Chen, Y2hlbmppbmcwNTA0QGhhdXQuZWR1LmNu
Disclaimer: All claims expressed in this article are solely those of the authors and do not necessarily represent those of their affiliated organizations, or those of the publisher, the editors and the reviewers. Any product that may be evaluated in this article or claim that may be made by its manufacturer is not guaranteed or endorsed by the publisher.
Research integrity at Frontiers
Learn more about the work of our research integrity team to safeguard the quality of each article we publish.