 Qiang Liu
 Yi Sun2†
 Chuanliang Li
- 1Key Laboratory of Atmospheric Optics, Anhui Institute of Optics and Fine Mechanics, HFIPS, Chinese Academy of Sciences, Hefei, China
- 2Shanxi Engineering Research Center of Precision Measurement and Online Detection Equipment and School of Applied Science, Taiyuan University of Science and Technology, Taiyuan, China
A resonant photoacoustic spectrometer (PAS) was developed for detecting trace atmospheric CH4. The sensitivity of the PAS was significantly increased via a Herriott-type multipass cell with a beam pattern concentrated in the cavity. The effective optical pathlength of the PAS can be optimized to 6.8 m with 34 reflections and a diameter of 6 mm. A distributed feedback diode laser at 1,653 nm was employed as the light source, and wavelength modulation spectroscopy was used for the 2nd harmonic signal to reduce the noise of the system. The resonant cell of PA and optimal modulation frequency were obtained by varying the measurements. In comparison with a single path, the sensitivity of the multipass strategy was improved 13 times. To evaluate the long-term stability and minimum detection limit (MDL) of the system, an Allan variance analysis was performed, and the analysis illustrated that the MDL accomplished 116 ppb at an average time of 84 s. The system was utilized for 2 days test campaign to validate the feasibility and robustness of the sensor. The system provides a promising technique for online monitoring of greenhouse gasses.
Introduction
Detecting trace gas is vital in processes that monitor atmospheric environment, such as air quality inspections, pollutant emission detections and greenhouse gas measurements (Bogue, 1981; Werle et al., 1998). Methane (CH4) is a flammable and explosive gas that considerably influences the greenhouse effect of the atmosphere (Wuebbled and Hayhoe, 2002; Bamberger et al., 2014; Nisbet et al., 2014; Gong et al., 2021). Therefore, real-time, rapid and accurate detection of CH4 concentrations is crucial for environmental monitoring and physical and chemical atmospheric research. Photoacoustic spectroscopy (PAS) is superior to other trace gas detection methods due to its fast response, high selectivity and sensitivity (Harren et al., 2000; Gong et al., 2017; Wu et al., 2017; Yin et al., 2017; Gong et al., 2018; Chen et al., 2020).
PAS relies on the PA effect that is generated by the absorption of light by the sample (Bell, 1880). Therefore, the PA signals could be enhanced under a higher output power of the light source (Kosterev et al., 2008; Wang et al., 2011; Wang and Wang, 2014; Gong et al., 2019; Yin et al., 2021). In recent years, much effort has been made to improve the detection sensitivity of PAS. Several groups have reported mid-infrared PA sensors that exhibit high sensitivity based on quantum cascade lasers, which correspond to molecular strong fundamental bands and have higher output power compared to that of the near infrared region (Ma et al., 2013; Peltola et al., 2013; Krzempek et al., 2018; Wu et al., 2019). However, mid-infrared lasers are still limited to practical applications due to their cost. Therefore, it is a better choice to increase the absorption optical path in the near-infrared in consideration of cost. Qiao et al. (2021) constructed a multipass quartz-enhanced PA sensor that allowed the laser beam to pass through the quartz tuning fork (QTF) prong spacing six times. The signal was enhanced approximately 3.2 times compared to that of the single-pass structure. The QTF widely serves as a resonant microphone in PA sensors because of its high quality factor, but the QTF is susceptible to disturbance by water vapour in atmospheric monitoring (Shanwen et al., 2012). Zhang et al. developed a multipass PA gas sensor utilizing a nonresonant PA cell with 29 reflections, in which the minimum detection limit can reach 12.2 ppb (Zhang et al., 2020). The researchers replaced the windows of the PA cell with concave mirrors, forming a Herriott-type cell. However, the fixed distance of cell mirrors limits the number of reflections and the mirrors are easily contaminated in atmospheric detection.
In this work, we developed a low-cost and high-sensitivity multipass enhancement PA sensor based on resonant PAS for gas atmospheric CH4 detection. The detection sensitivity was improved 13 times by a Herriott-type resonant PA cell with 34 reflections. The total absorption length was 6.8 m. In addition, the experimental parameters of the sensor were optimized by 200 ppm CH4 standard gas. The minimum detection limit (MDL) of this sensor can reach 116 ppb at an 84 s average time. To validate the stability of the system, the PA sensor was deployed to measure atmospheric CH4 for 2 days.
Design of the photoacoustic spectrometer sensor
Design of the Herriott-type multipass PA cell
Based on the ABCD matrix, the Herriott beam pattern was derived as illustrated in Figure 1A. The size of the beam pattern and the number of reflections can be adjusted by changing the distance of the mirrors and the laser incident angle. An optimum of 34 reflections was chosen in consideration of the volume of the PA cell, so it is reflected 17 times for each mirror. Two windows are used to enclose the PA cell, and cavity mirrors are placed outside to prevent the sample gas from being comtaminated. Two mirrors with a reflectivity of −95% and 30.48 cm curve radius are separated by 28.5 cm. As presented in Figure 1B, the diameter of the beam footprint on the mirror is approximately 6 mm, which can pass through an acoustic resonator with a diameter of 9 mm. The cell windows are coated with anti-reflection film at both 640 and 1,653 nm, which correspond to indication and signal lasers, respectively. The anti-reflective coating in both spectral regions is better than 1% within ± 10 nm bandwidth.
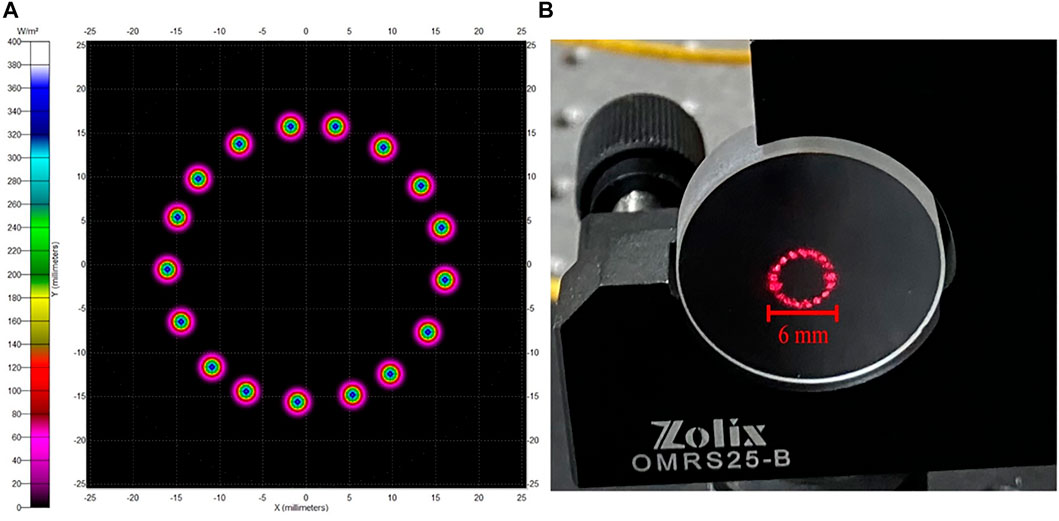
FIGURE 1. (A) Simulation result of the beam pattern; (B) Observed footprint of laser beam at 640 nm.
Experimental setup and its optimization
Figure 2 shows the schematic structure of the multipass PA sensor for the gas detection system. A distributed feedback diode (DFB) laser operating at 1,653 nm with an output power up to 15 mW is used as an excitation source. The absorption line is free of interference from atmospheric gases in this band (Iseki et al., 2000). To obtain higher output power, the laser temperature and current are set to 27.7°C and 105.42 mA, respectively, in the experiment. An optical isolator is connected to the laser tail fiber to prohibit the feedback of the partially reflected laser beam from influencing the DFB laser. The output of the laser passes through a grin lens, is reflected by a plane mirror, and is finally coupled into the Herriott-type cell through a coupled mirror. Analogous to wavelength modulation spectroscopy, a triangle wave of 2 Hz generated by the function generator and the sinusoidal wave provided by a lock-in amplifier (Stanford Research Systems, Model SR830) are superimposed through an adder to drive the injection current of the DFB laser. The signal from the microphone (BSWA, MA221) is magnified 1,000 times by a built-in amplifier and demodulated by the lock-in amplifier at the 2nd harmonic (2f). Ultimately, the demodulated signal is recorded by the DAQ (National Instruments, PCIe-6353) and stored by a computer. The range of the flow rate of the homemade mass flowmeter was 100–300 ml/min. The concentration of the sample gas was calibrated by a series of standard mixing gases of CH4 diluted by nitrogen (N2). The pressure of the PA cell was controlled to be −100 Torr and the setup was worked in room temperature 26°C.
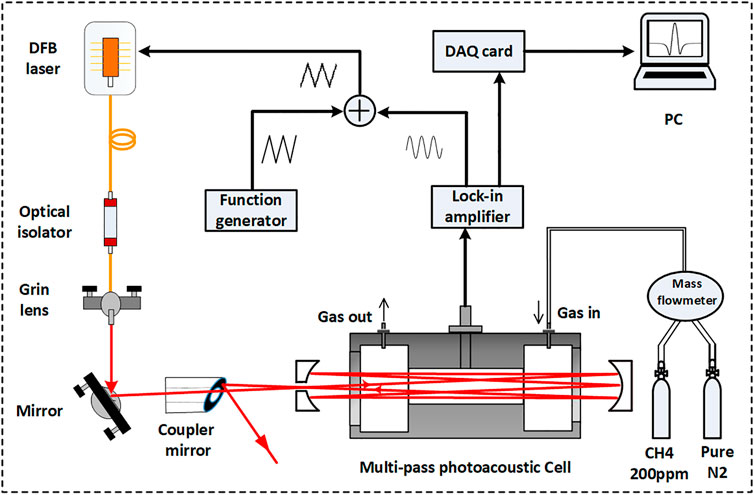
FIGURE 2. Schematic experimental setup of a multi-pass PA sensor for trace gas detection.
Modulation frequency and modulation amplitude are two crucial parameters with respect to the amplitude of PA. The optimum performance can be derived when the modulation frequency matches the resonant frequency (f0) of the PA cell. The resonance frequency was obtained by using a high concentration of CH4 gas. As depicted in Figure 3A. The maximum amplitude appears at f0 = 807 Hz and corresponds to half of the resonance of the PA cell (Ma et al., 2019), which is associated with a quality factor of 13. Hence, the f0 of the PA cell is 1,614 Hz. The relationship between the PA signal peak and modulation amplitude was measured under 200 ppm standard CH4 gas. During the experiment, the relationship between the PA signals and the amplitude of the modulated sinusoidal wave is shown in Figure 3B. The PA signal is strongest at a modulation amplitude of 0.188 V. In the experiment, the sensitivity and time constant of the lock-in amplifier were set at 10 μV and 3 ms, respectively. Under the optimal condition of detection, the performance of the multipass enhancement resonant PA sensor was investigated using the setup depicted in Figure 2.
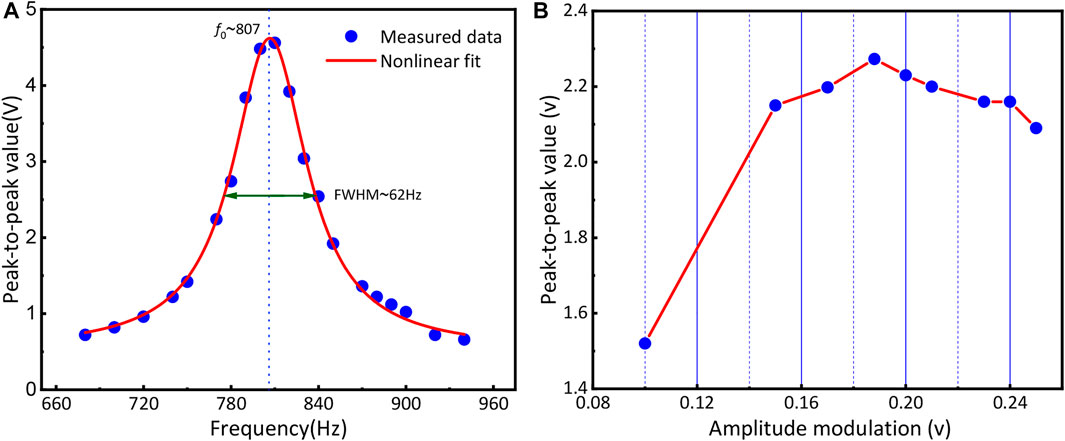
FIGURE 3. (A) Frequency response (f0) of the PA cell; (B) Peak value of standard gas at different amplitude modulation.
The comparison of the 2f signal of the multipass system and single-pass configuration is shown in Figure 4. The peak-to-peak value for the multi-pass PA sensor was estimated at 5.2 V in comparison to the 0.4 V obtained via the single-pass configuration. For the multipass PA sensor, the integral laser power in the PA cell can be calculated according to the following equation:
Where P0 is the output power of the DFB laser, R is the reflectivity of the cavity mirrors and is of about 95%, n is the reflection times of the laser and is of 34. Thus P is calculated to be −16.6 times of P0. The gain of the photoacoustic signal is reduced due to the loss of the window mirror and the difference of optical-acoustic pattern matching between single-pass and multipass.
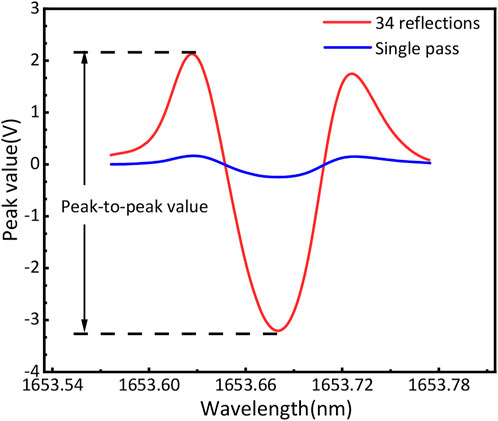
FIGURE 4. 2f signal of the 34 reflected PA system (blue line) and single-pass conventional standard PA system (red line), respectively.
Results and discussion
To further verify the linear characteristics of the multipass PA gas sensor, several concentrations of CH4 were filled into the PA cell, which was controlled by the mass flowmeter. A series of concentrations (5, 10, 20, 30, 40, and 50 ppm) of CH4/N2 gas were obtained by diluting the 200 ppm CH4 with pure N2. The spectral lines of CH4 at different concentrations are presented in Figure 5A. Then the relationship of the signal amplitude of the spectra with concentrations was obtained by linear fitting, as shown in Figure 5B. The R square equal to 0.993 indicates that the multipass PA gas sensor exhibits a good linear characteristic for CH4 gas detection. In addition, the linear function can be easily used to calculate any unknown CH4 concentration. The signal of 30 ppm CH4 was measured for 1 h to assess the detection limitation and stability of the sensor. A total of −2,400 data points were obtained with a scan frequency of 1 Hz. As shown in Figure 6 (bottom), the Allan variance is a function of the measurement time. The figure indicates that the minimum detection limit appears at 84 s and approaches 116 ppb.
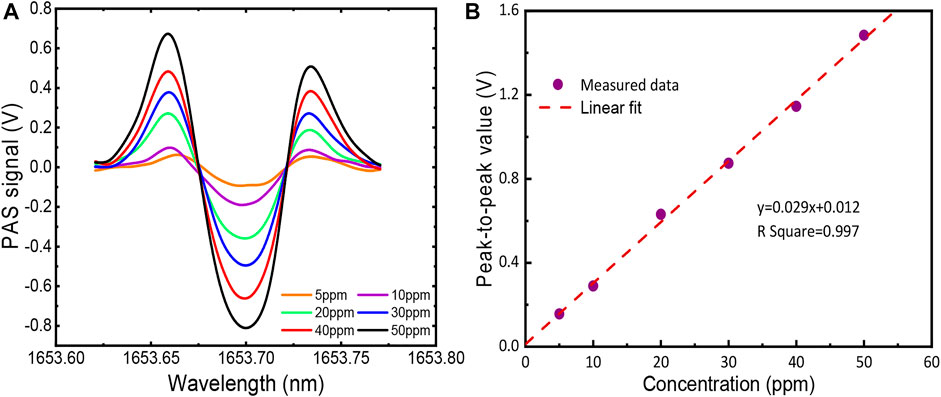
FIGURE 5. (A) Observed 2f signals of CH4 at different concentrations; (B) Linear fitting of amplitudes of PA signals at different CH4 concentrations.
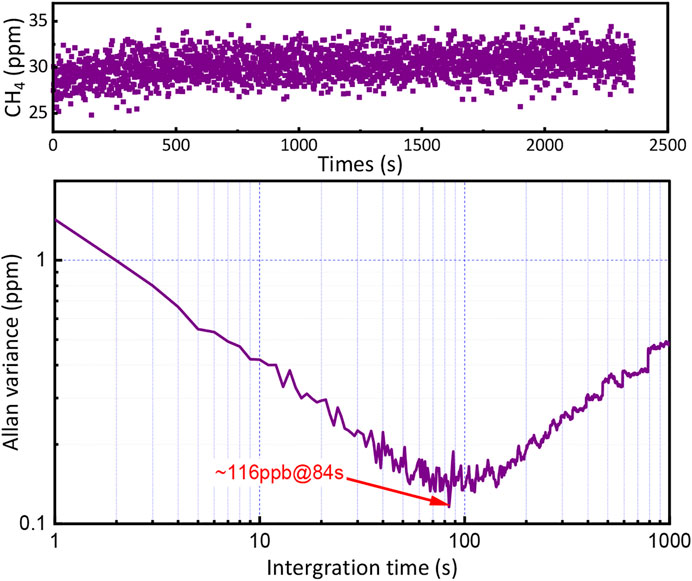
FIGURE 6. Row data of individual concentration measurements over 40 min (top) and Allan variance as a function of integration time (bottom).
The sensor was validated by real-time and in situ measurements of atmospheric CH4 for 2 days. The test was carried out on the campus of Taiyuan University of Science and Technology, which is a mixed-use area with woods and apartments and is near the Xizhonghuan Express road, which has heavy traffic, especially during rush hours. The weather conditions (19°C33°C and AQI (Air Quality Index) −150) were similar on both days, and complex weather factors, such as thunderstorms and snowstorm, were excluded. In addition, a dryer and a particle filter were installed upstream of the air inlet to suppress the interference of humidity and aerosols. As depicted in Figure 7, the diurnal variation trends of the CH4 concentration on these 2 days were the same. The highest concentration of CH4 occurred at night, and the lowest concentration occurred during the daytime. The variation in the CH4 concentrations during the day was possibly due to the local CH4 sources after sunrise (5:12 a.m.), while the concentration increases after sunset (7:55 pm) were probably due to a decreased boundary layer height (Fowler et al., 1996). Moreover, the observed result in Figure 7 clearly shows that more CH4 was produced on workdays than on weekends near the road, which explains why vehicle emissions are an important source of CH4.
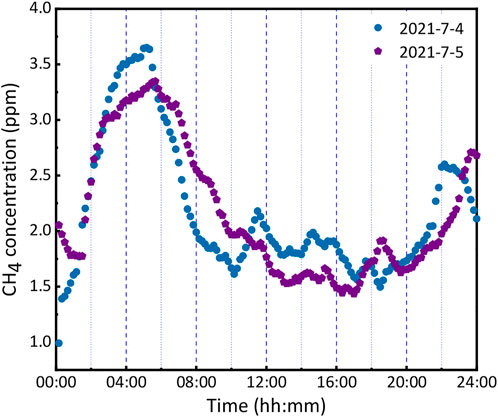
FIGURE 7. Measured CH4 concentrations in atmospheric variation on 2021-7-4(Sunday) and 2021-7-5 (Monday).
Conclusion
An enhanced resonant PAS in the near infrared region was developed based on the Herriott type cell for determining the concentration of atmospheric CH4. It reaches 34 reflections within the diameter of the beam footprint of approximately 6 mm. The sensitivity of PAS was significantly improved by 13 times in comparison with that of the single pass. The linear relationship between the signal amplitude of the 2nd harmonic and CH4 concentration was derived in the region of 200–0 ppm. An Allan variance analysis demonstrated that the MDL accomplished 116 ppb at an integration time of 84 s. The system was deployed for 2 days in situ measurement. The results showed that the varying trend in CH4 concentration was similar and that of the CH4 concentration on working days was slightly higher than that on weekends. The technique is promising for the real-time monitoring of atmospheric CH4.
Data availability statement
The original contributions presented in the study are included in the article/Supplementary Material, further inquiries can be directed to the corresponding author.
Author contributions
QL and YS contributed equally to this work, concluding the methodology, validation, software, formal analysis, investigation, resources and writing original draft preparation. XQ and GG. provided supervision, project administration and funding acquisition LL. participated in the data curation and visualization CL. carried out the conceptualization and manuscript review. All authors have read and agreed to the published version of the manuscript.
Funding
The work presented in this paper was supported by the National Natural Science Foundation of China (U1810129, 52076145, 11904252, and 42077201), the State Key Laboratory of Applied Optics (SKLAO-201902), the Transformation of Scientific and Technological Achievements Fund of Shanxi Province (201904D131025), Excellent Youth Academic Leader in Higher Education of Shanxi Province (2018), the Key Research and Development Program of Shanxi Province of China (201803D31077 and 201803D121090), the Shanxi”1331 Project“ Key Innovative Research Team (1331KIRT), the Natural Science Foundation of Shanxi Province (201801D221017), Laboratory of Pulsed Power Laser Technology(SKL2020ZR01) and the Fund for Shanxi Key Subjects Construction.
Conflict of interest
The authors declare that the research was conducted in the absence of any commercial or financial relationships that could be construed as a potential conflict of interest.
Publisher’s note
All claims expressed in this article are solely those of the authors and do not necessarily represent those of their affiliated organizations, or those of the publisher, the editors and the reviewers. Any product that may be evaluated in this article, or claim that may be made by its manufacturer, is not guaranteed or endorsed by the publisher.
References
Bamberger, I., Stieger, J., Buchmann, N., and Eugster, W. (2014). Spatial variability of methane: Attributing atmospheric concentrations to emissions. Environ. Pollut. 190, 65–74. doi:10.1016/j.envpol.2014.03.028
Bell, A. G. (1880). Upon the production and reproduction of sound by light. J. Soc. Telegraph Eng. 9 (34), 404–426. doi:10.1049/jste-1.1880.0046
Bogue, R. (1981). Detecting gases with light: A review of optical gas sensor technologies. Sens. Rev. 35, 133–140. doi:10.1108/sr-09-2014-696
Chen, K., Deng, H., Guo, M., Luo, C., Yu, Q., Zhang, B., et al. (2020). Tube-cantilever double resonance enhanced fiber-optic photoacoustic spectrometer. Opt. Laser Technol. 123, 105894. doi:10.1016/j.optlastec.2019.105894
Fowler, D., Hargreaves, K., Choularton, T., Gallagher, M., Simpson, T., and Kaye, A. (1996). Measurements of regional CH4 emissions in the UK using boundary layer budget methods. Energy Convers. Manag. 37 (6-8), 769–775. doi:10.1016/0196-8904(95)00254-5
Gong, Z., Chen, K., Chen, Y., Mei, L., and Yu, Q. (2019). Integration of T-type half-open photoacoustic cell and fiber-optic acoustic sensor for trace gas detection. Opt. Express 27 (13), 18222–18231. doi:10.1364/oe.27.018222
Gong, Z., Chen, K., Yang, Y., Zhou, X., and Yu, Q. (2018). Photoacoustic spectroscopy based multi-gas detection using high-sensitivity fiber-optic low-frequency acoustic sensor. Sensors Actuators B Chem. B260, 357–363. doi:10.1016/j.snb.2018.01.005
Gong, Z., Gao, T., Mei, L., Chen, K., Chen, Y., Zhang, B., et al. (2021). Ppb-level detection of methane based on an optimized T-type photoacoustic cell and a NIR diode laser. Photoacoustics 21, 100216. doi:10.1016/j.pacs.2020.100216
Gong, Z., Ke, C., Yang, Y., Zhou, X., Wei, P., and Yu, Q. (2017). High-sensitivity fiber-optic acoustic sensor for photoacoustic spectroscopy based traces gas detection. Sensors Actuators B Chem. 247, 290–295. doi:10.1016/j.snb.2017.03.009
Harren, F. J., Cotti, G., Oomens, J., and Te Lintel Hekkert, S. (2000). Photoacoustic spectroscopy in trace gas monitoring. Encycl. Anal. Chem. 3, 2203–2226. doi:10.1002/9780470027318.A0718
Iseki, T., Tai, H., and Kimura, K. (2000). A portable remote methane sensor using a tunable diode laser. Meas. Sci. Technol. 11, 594–602. doi:10.1088/0957-0233/11/6/302
Kosterev, A., Wysocki, G., Bakhirkin, Y., So, S., Lewicki, R., Fraser, M., et al. (2008). Application of quantum cascade lasers to trace gas analysis. Appl. Phys. B 90 (2), 165–176. doi:10.1007/s00340-007-2846-9
Krzempek, K., Hudzikowski, A., Głuszek, A., Dudzik, G., Abramski, K., Wysocki, G., et al. (2018). Multi-pass cell-assisted photoacoustic/photothermal spectroscopy of gases using quantum cascade laser excitation and heterodyne interferometric signal detection. Appl. Phys. B 124 (5), 74–76. doi:10.1007/s00340-018-6941-x
Ma, Y., Lewicki, R., Razeghi, M., and Tittel, F. K. (2013). QEPAS based ppb-level detection of CO and N2O using a high power CW DFB-QCL. Opt. Express 21 (1), 1008–1019. doi:10.1364/oe.21.001008
Ma, Y., Qiao, S., He, Y., Li, Y., Zhang, Z., Yu, X., et al. (2019). Highly sensitive acetylene detection based on multi-pass retro-reflection-cavity-enhanced photoacoustic spectroscopy and a fiber amplified diode laser. Opt. Express 27 (10), 14163–14172. doi:10.1364/oe.27.014163
Nisbet, E. G., Dlugokencky, E. J., and Bousquet, P. (2014). Methane on the rise-again. Science 343 (6170), 493–495. doi:10.1126/science.1247828
Peltola, J., Vainio, M., Hieta, T., Uotila, J., Sinisalo, S., Metsälä, M., et al. (2013). High sensitivity trace gas detection by cantilever-enhanced photoacoustic spectroscopy using a mid-infrared continuous-wave optical parametric oscillator. Opt. Express 21 (8), 10240–10250. doi:10.1364/oe.21.010240
Qiao, S., Ma, Y., Patimisco, P., Sampaolo, A., He, Y., Lang, Z., et al. (2021). Multi-pass quartz-enhanced photoacoustic spectroscopy-based trace gas sensing. Opt. Lett. 46 (5), 977–980. doi:10.1364/ol.418520
Shanwen, S., Hongming, Y., Guishi, W., Lei, W., Xiaoming, G., Liu Kun, 刘., et al. (2012). Impact of water on quartz enhanced photo-acoustic absorption spectroscopy methane senor performance. 中国激光. 39 (7), 0715001. doi:10.3788/cjl201239.0715001
Wang, J., and Wang, H. (2014). Tunable fiber laser based photoacoustic gas sensor for early fire detection. Infrared Phys. Technol. 65, 1–4. doi:10.1016/j.infrared.2014.03.002
Wang, Q., Wang, J., Li, L., and Yu, Q. (2011). An all-optical photoacoustic spectrometer for trace gas detection. Sensors Actuators B Chem. 153 (1), 214–218. doi:10.1016/j.snb.2010.10.035
Werle, P., Muecke, R., D'Amato, F., and Lancia, T. (1998). Near-infrared trace-gas sensors based on room-temperature diode lasers. Appl. Phys. B Lasers Opt. 67, 307–315. doi:10.1007/s003400050510
Wu, H., Dong, L., Yin, X., Sampaolo, A., Patimisco, P., Ma, W., et al. (2019). Atmospheric CH4 measurement near a landfill using an ICL-based QEPAS sensor with VT relaxation self-calibration. Sensors Actuators B Chem. 297, 126753. doi:10.1016/j.snb.2019.126753
Wu, H., Dong, L., Zheng, H., Yu, Y., Ma, W., Zhang, L., et al. (2017). Beat frequency quartz-enhanced photoacoustic spectroscopy for fast and calibration-free continuous trace-gas monitoring. Nat. Commun. 8 (1), 15331–15338. doi:10.1038/ncomms15331
Wuebbled, D. J., and Hayhoe, K. (2002). Atmospheric methane and global change. Earth-Science Rev. 57 (3-4), 177–210. doi:10.1016/s0012-8252(01)00062-9
Yin, X., Dong, L., Wu, H., Zheng, H., Ma, W., Zhang, L., et al. (2017). Sub-ppb nitrogen dioxide detection with a large linear dynamic range by use of a differential photoacoustic cell and a 3.5 W blue multimode diode laser. Sensors Actuators B Chem. 247, 329–335. doi:10.1016/j.snb.2017.03.058
Yin, X., Gao, M., Miao, R., Zhang, L., Zhang, X., Liu, L., et al. (2021). Near-infrared laser photoacoustic gas sensor for simultaneous detection of CO and H2S. Opt. Express 29 (21), 34258–34268. doi:10.1364/oe.441698
Keywords: photoacoustic spectroscopy (PA), herriott-type, multipass enhancement, wavelength modulation spectroscopy (laser spectroscopy), atmospheric CH4 detection
Citation: Liu Q, Sun Y, Qiu X, Guo G, Li L, Gong T and Li C (2022) Resonant photoacoustic spectrometer enhanced by multipass absorption for detecting atmospheric CH4 at the ppb-level. Front. Chem. 10:1021145. doi: 10.3389/fchem.2022.1021145
Received: 17 August 2022; Accepted: 05 September 2022;
Published: 21 September 2022.
Edited by:
Lei Dong, Shanxi University, ChinaCopyright © 2022 Liu, Sun, Qiu, Guo, Li, Gong and Li. This is an open-access article distributed under the terms of the Creative Commons Attribution License (CC BY). The use, distribution or reproduction in other forums is permitted, provided the original author(s) and the copyright owner(s) are credited and that the original publication in this journal is cited, in accordance with accepted academic practice. No use, distribution or reproduction is permitted which does not comply with these terms.
*Correspondence: Chuanliang Li, bGlfY2h1YW5saWFuZ0AxMjYuY29t
†These authors contributed equally to this work