 Noureen Ashraf1†
 Asnuzilawati Asari2*†
 Numan Yousaf1†
 Matloob Ahmad3
 Mahmood Ahmed4
 Amir Faisal5
 Muhammad Saleem6
 Muhammad Muddassar1*
- 1Department of Biosciences, COMSATS University Islamabad, Islamabad, Pakistan
- 2Faculty of Science and Marine Environment, Universiti Malaysia Terengganu, Kuala Nerus, Terengganu, Malaysia
- 3Department of Chemistry, Government College University, Faisalabad, Pakistan
- 4Department of Chemistry, Division of Science and Technology, University of Education, Lahore, Pakistan
- 5Department of Biology, Syed Babar Ali School of Science and Engineering, Lahore University of Management Sciences, Lahore, Pakistan
- 6School of Biological Sciences, University of the Punjab, Lahore, Pakistan
Tyrosine threonine kinase (TTK) is the key component of the spindle assembly checkpoint (SAC) that ensures correct attachment of chromosomes to the mitotic spindle and thereby their precise segregation into daughter cells by phosphorylating specific substrate proteins. The overexpression of TTK has been associated with various human malignancies, including breast, colorectal and thyroid carcinomas. TTK has been validated as a target for drug development, and several TTK inhibitors have been discovered. In this study, ligand and structure-based alignment as well as various partial charge models were used to perform 3D-QSAR modelling on 1H-Pyrrolo[3,2-c] pyridine core containing reported inhibitors of TTK protein using the comparative molecular field analysis (CoMFA) and comparative molecular similarity indices analysis (CoMSIA) approaches to design better active compounds. Different statistical methods i.e., correlation coefficient of non-cross validation (r2), correlation coefficient of leave-one-out cross-validation (q2), Fisher’s test (F) and bootstrapping were used to validate the developed models. Out of several charge models and alignment-based approaches, Merck Molecular Force Field (MMFF94) charges using structure-based alignment yielded highly predictive CoMFA (q2 = 0.583, Predr2 = 0.751) and CoMSIA (q2 = 0.690, Predr2 = 0.767) models. The models exhibited that electrostatic, steric, HBA, HBD, and hydrophobic fields play a key role in structure activity relationship of these compounds. Using the contour maps information of the best predictive model, new compounds were designed and docked at the TTK active site to predict their plausible binding modes. The structural stability of the TTK complexes with new compounds was confirmed using MD simulations. The simulation studies revealed that all compounds formed stable complexes. Similarly, MM/PBSA method based free energy calculations showed that these compounds bind with reasonably good affinity to the TTK protein. Overall molecular modelling results suggest that newly designed compounds can act as lead compounds for the optimization of TTK inhibitors.
Introduction
The dual specificity kinase TTK (Also known as monopolar spindle 1 or MPS1) is the core component of spindle assembly checkpoint that ensures accurate segregation of chromosomes during mitosis. TTK controls the bipolar attachment of chromosomes to spindle microtubules by regulating the spindle assembly checkpoint (Wei et al., 2005; Lindberg and Meijer, 2021; Xing et al., 2021). TTK is activated at the unattached kinetochores and recruits’ components of the mitotic checkpoint complex (MCC), thereby initiating SAC (Fisk and Winey, 2001; Stucke et al., 2002; Laufer et al., 2014; Huang et al., 2021). MCC hinders metaphase to anaphase transition by inhibiting the activation of Anaphase Promoting Complex/Cyclosome (APC/C) until all the kinetochores are correctly attached to the microtubules, which is prerequisite for accurate chromosome division (Wengner et al., 2016). TTK is composed of 857 amino acids with double lobed protein kinase structure. It comprises C terminal catalytic and activation loops having residues ranging from 515-794. The N terminal lobe (Glu 516-Met602) is smaller than the C terminal lobe (Asn606-Gln794) and has six beta sheets and one alpha helix. The larger C-terminal lobe, however, is more complex and consists of 2 beta sheets, 7 alpha helices together with the activation, catalytic and p + 1 loops. Both lobes join the hinge region through the amino acid residues Glu603 and Gly605. In its dormant state TTK is catalytically inactive as the activation loop is locked. However, phosphorylation at the activation loop enables the TTK to adopt an active conformation and elevate its catalytic activity (Wang et al., 2009). Besides its role in mitosis, it also plays a role in meiosis, cell transformation and cytokinesis (Maia et al., 2015; Sugimoto et al., 2017b). TTK overexpression is detected in many cancer types including, breast, hepatocellular and thyroid carcinomas (Maia et al., 2015; Lu and Ren, 2021). Overexpression of TTK is associated with high serum AFP (alpha-fetoprotein) levels, large tumor size, advanced TNM stage (tumor, nodes, and metastases), and distant metastases. Enhanced expression can also lead to centrosome duplication, genomic instability, mitotic check point failure, abrogated kinetochore attachment, incorrect spindle stress, and chromosomal misalignment (Liu and Winey, 2012; Liu et al., 2015a; Liu et al., 2015b; Sugimoto et al., 2017a). Due to its major role in mitotic checkpoint and overexpression in different malignancies, TTK is considered a potential anti-cancer drug target.
Studies involving RNA interference-mediated knockdown or chemical inhibition of TTK have validated it as a target for cancer therapeutics (Schmidt et al., 2005; Brough et al., 2011; Daniel et al., 2011). Several TTK inhibitors, therefore, have been discovered during the last decade. This includes NMS-P715, CCT251455, CFI-402257, BOS172722, S81694, BAY1161909 and BAY 1217389 with last five progressing to clinical evaluations (Chen et al., 2018). Similarly, some other small-molecule inhibitors i.e., Diaminopyridine, pyrrolopyrimidine and quinazolines containing compounds have shown low nano-molar activities with reasonably well growth inhibition of cell lines (Kusakabe et al., 2012; Bursavich et al., 2013).
In the current study Pyrrolo pyridine derivatives were used to develop 3D-QSAR models for designing of TTK inhibitors with improved activity. To the best of our knowledge so far, no QSAR modeling and docking simulations have been performed on this class of compounds. CoMFA and CoMSIA models were developed using different alignment schemes and charge models which were then validated using various statistical methods. The information derived from the models were exploited in designing of new compounds that are predicted to have better biological activities than the existing compounds in this class. The stability of binding modes and interactions of newly designed compounds with TTK protein were confirmed by MD Simulations.
Materials and methods
Data collection
Different reported inhibitors of TTK protein sharing similar scaffolds but different biological activities were retrieved from the literature (Naud et al., 2013). The IC50 values of all inhibitors were converted into pIC50 values. The 39 retrieved compounds were randomly divided into two groups: training (28 compounds) and test (11 compounds) datasets (Puzyn et al., 2011). The pIC50 values were used as dependent variable while CoMFA and CoMSIA descriptors were taken as independent variables (Balasubramanian et al., 2014).
Structure preparation and alignment
The 2D structures of inhibitors were sketched by 2D builder tool of Maestro implemented in Schrödinger’s suite (Bhachoo and Beuming, 2017). The structures of all compounds were minimized by Conjugate gradient and Powell methods, while the partial charges were computed by Gasteiger Huckel (GH), Gasteiger Marsili (GM), Pullman, and MMFF94 charges (Sainy and Sharma, 2015; Shiri et al., 2016). The compound with the highest biological activity among all the inhibitors was selected as a template for ligand and structure-based conformer alignment of all compounds.
CoMFA and CoMSIA field calculations
The CoMFA electrostatic and steric fields were calculated through SYBYL software using a 3D grid having a 2.0 Å spacing (Ghosh et al., 2021). A fixed energy value of 30 kcal/mol was set to avoid energy clashes. A carbon with sp3 hybridization and an atom with +1.0 charge were used as steric and electrostatic probes, respectively. A probe atom having a radius of 1.0 Å was used to calculate the CoMSIA fields. The attenuation factor (α) with a default value 0.3 was used to calculate the distance dependent similarities. The Eq. 1 was used to calculate the indices. All computations were carried out in the same way as the CoMFA analysis (Hu et al., 2009; Li et al., 2017).
Aq = similarity indexK = physiochemical properties of CoMFA fields descriptorsωprobe = the probe atomi = summation index of molecule jωik = observed value k of a specific property of the atom ir = atomic radiusThe efficiency of SAR model was determined by Partial Least Square regression. The CoMFA and CoMSIA descriptors were selected as dependent variables while IC50 value was selected as an independent variable in PLS regression (Tahir et al., 2018). The cross validation using the leave-one-out method was used to select the best model that had high prediction power. The cross-validation (q2) analysis is defined by Eq. 2.
ypred = predicted valuesyobs = experimental valuesymean = mean values
For non-cross validation, the column filtering was set to 2.0. Standard error estimation (SEE) values were also calculated along cross and non-cross validation. To evaluate the effectiveness of the generated models, bootstrapping was used up to 100 runs. Predictive r2 was used to express the predictive ability of the developed models, that was based on the test set compounds. The predictive r2 was calculated using Eq. 3.
SD = sum of squared deviations between pIC50 values of the test set and mean pIC50 values of the training setPRESS = sum of squared deviations between the test molecules observed and expected activities
Designing of new compounds
Based on the information obtained from the contour maps of best predictive CoMFA and CoMSIA models, ten new compounds were designed by substitution of specific electrostatic, steric, hydrophobic, hydrogen bond donor, and hydrogen bond acceptor groups to enhance their inhibitory activities against TTK protein. The newly designed compounds belong to the synthetic class of compounds and their biological activities were predicted using the best predictive models (Lorca et al., 2018; Ghosh et al., 2021).
Molecular docking
The co-crystal structure of TTK (PDB ID: 4C4J) was prepared by protein preparation wizard implemented in Maestro. The receptor was preprocessed by adding hydrogens, removing water, adding charges and fixing residues side chain atoms. The unnecessary ligands and chains were removed while the tautomeric states were generated at pH 7.0. The structure of the receptor was further optimized and minimized by OPLS_2005 forcefield [34]. The grid was generated by selecting the co-crystal ligand to perform site-specific docking. To soften the potential of non-polar sections of the receptor, the van der Waals radii of the receptor atom were scaled to 1.0 and the partial charge cutoff value was set to 0.25. The values for the X, Y, and Z coordinates were 0.8, 17.52, and 45.37 respectively. After grid generation, newly designed compounds were prepared by LigPrep tool of Maestro prior to docking [35]. Different ionization states were generated at pH 7 by using Epik [35]. The stereoisomers of compounds with specified chirality were generated by using OPLS_2005 forcefield. The prepared ligands were then docked to the prepared receptor by using the Glide docking tool and the binding poses were analyzed based on the glide gscore.
MD simulations
The binding poses of each compound were used to make complexes with the TTK protein. The stability of each protein-ligand complex was estimated by running MD simulation using NAMD (Acun et al., 2018). All the complexes were prepared by using LeaP module of AMBER21 tools (Case et al., 2021). The parameters of the ligands were generated by antechamber program by semi-empirical calculation. The PDB4amber module was used to convert the amino acid residues to amber format. The forcefield parameters for protein and ligands were AMBER ff14SB force field and general amber forcefield, respectively (Duan et al., 2003). The parameters of ligands and receptor were connected by tleap program. All the complexes were solvated in a water box of size 10 Å using TIP3P water model. To neutralize the system, counter ions Na+ and Cl− were added by using LeaP. The systems were minimized by conjugating gradient and steepest descent method for 10,000 times. The water equilibration was done for 5,000 steps, followed by the three-temperature equilibration from 0 to 200 K, 200–250 K, and 250–300 K for 5,000 steps. After equilibration of the system at different temperatures, the production of systems was run for 25 ns with constant temperature 310 K and pressure of 1 atm using NPT ensemble. The trajectories of all the systems were analyzed to get RMSD, RMSF, Radius of gyration, SASA, PCA, by using VMD tcl commands, CPPTRAJ (Roe et al., 2013) and R package.
Binding free energy calculation
The binding free energy of the system was calculated by using molecular mechanics-based scoring methods MM/PBSA (Sun et al., 2014). The calculations were based on a total of 300 snapshots of the complex, taken at 2 ps interval from the last 2 ns stable MD trajectories. The binding free energy was determined as the difference between the total free energy (ΔGcom) of the ligand-receptor complex and the sum of free energy of individual receptors (ΔGpro) and ligand (ΔGlig) using the equation provided below:
The ΔG for the complex, receptor and ligand can be calculated by the following equation:
ΔEMM = Molecular Mechanics EnergyΔGsol = Solvation Free EnergyTΔS = Entropy at given Temperature
ADMET analysis
The physicochemical properties i.e., molecular weight, Hydrogen bond donors and acceptors along with the ADMET properties of the newly designed compounds were predicted by QikProp tool of Maestro (Koç et al., 2021).
Results and discussion
An essential stage in ‘3D-QSAR’ is the systematized assortment of compounds and their division into training and test datasets. Compounds and their biological activities in terms of pIC50 values are mentioned in Supplementary Table S1. They were classified into two categories with respect to their activity range from high to low while maintaining structural variations. All the selected compounds possess a common sub-structure 1H-Pyrrolo[3,2-c] pyridine as shown in Figure 1A. These compounds have mainly hydrophobic (halogens Cl and Br) and hydrophilic substituents (amine and amides) attached to the core scaffold 1H-Pyrrolo[3,2-c] pyridine. Hydrogen bond donors like NH and OH, hydrogen bond acceptors like N, O and F and steric groups like CH3 and Cl have been attached to enhance the activities of the compounds. By changing the substituent at main scaffold, the activity of the compounds predicted by the developed models, was affected. The quality of the models is affected by multiple factors like the conformation of the molecules and their assigned partial charges (Muddassar et al., 2009; Wang et al., 2015). Therefore, different conformations of dataset molecules using ligand and structure-based approaches were generated along with different charge models i.e., GH, GM, MMFF. For structural alignment, compounds were aligned on a common sub-structure to get the best predictive “CoMFA” and “CoMSIA” models (Figure 1).
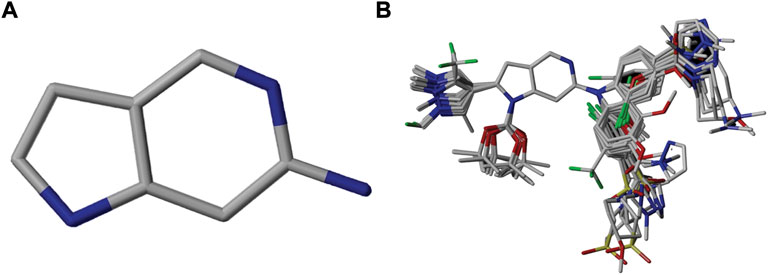
FIGURE 1. Alignment of dataset compounds: (A) Common Substructure and (B) Structure-based alignment of docked compounds.
The best models were obtained with Merck Molecular Force Field charges using structure-based conformation alignment as shown in Figure 1B. The correlation coefficient q2 of leave-one-out cross validation for CoMFA fields was 0.589, with 3 optimum number of components, the standard error of estimation was 0.088, non-cross validated coefficient (r2ncv) = 0.902, F-value = 73.624 and r2pred = 0.751 as mentioned in Table 1. The electrostatic and steric fields contributed 68.3% and 31.7% respectively to the model. However, ligand-based conformations yielded the poor predictive models. Powell method generated conformation with MMFF charges produced best CoMFA model with q2 = 0.268 value for 3 optimum number of components (other data shown in Supplementary Table S2). Similarly Conjugate Gradient conformation method with MMFF charges using 2 optimum number of components yielded q2 = 0.191 value for steric and electrostatic fields (Supplementary Table S3). In the ligand-based alignment technique, the effects of different charges on the models are shown in Supplementary Table S3. The reasons for superior performance of one charge method over the other in “CoMFA” and “CoMSIA” predictive models are still unknown, as the literature shows variable performance of these charge models on compounds targeting different proteins. As for as COMSIA models are concerned, structure-based alignment with Merck Molecular Force Field charges produced q2 = 0.690 with N = 3, SEE = 0.109, F-value = 108.296, r2ncv = 0.931, and r2pred = 0.767 shown in Table 1. The CoMSIA fields like steric, electrostatic, hydrophobic, hydrogen bond donor and acceptor contributions were 12.9%, 23.1%, 25.1%, 17.7% and 21.2% respectively. The results exhibited that electrostatic and hydrophobic interactions and hydrogen bond donors played major role in CoMSIA model. In CoMSIA modeling GH, GM, PM, and MMFF94 charges did not significantly influence the quality of models. Using the best predictive CoMFA and CoMSIA models, the biological activities of the training and test dataset compounds were predicted as shown in Figures 2A–B , respectively. The scattered plots show that the predicted values are similar to the experimental values except one compound (Outlier). Outliers can occur as a result of incorrectly measured inhibitory concentrations, variable binding confirmations, or major physicochemical variances. Similarly, external validation (higher r2pred values of test set compounds) of both models shows their highly predictive nature. Internal validations such as r2ncv, F-values, and r2bs values revealed their reliability and precision to design and improve new compounds. As any individual field can influence the quality of the model, therefore models with good statistical significance were used to design new compounds for improved activity as shown in Table 2.
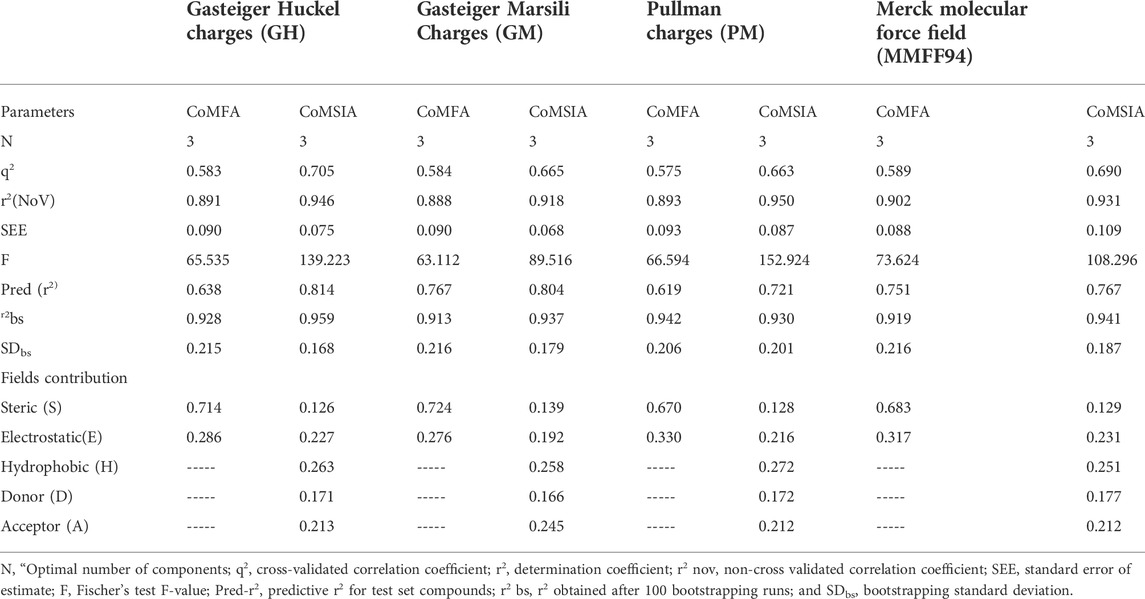
TABLE 1. Statistical parameters of structure based CoMFA and CoMSIA models with different charge schemes.
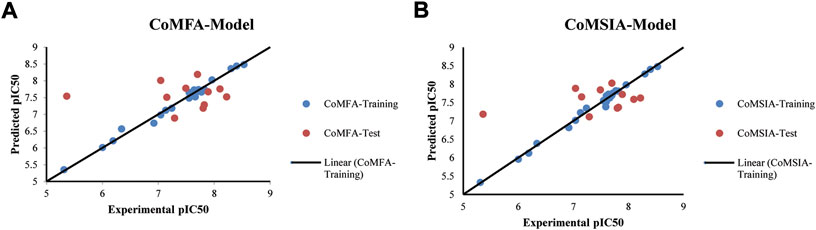
FIGURE 2. Correlation plots between experimental and predicted biological activities (A) From CoMFA Model (B) From CoMSIA Model.
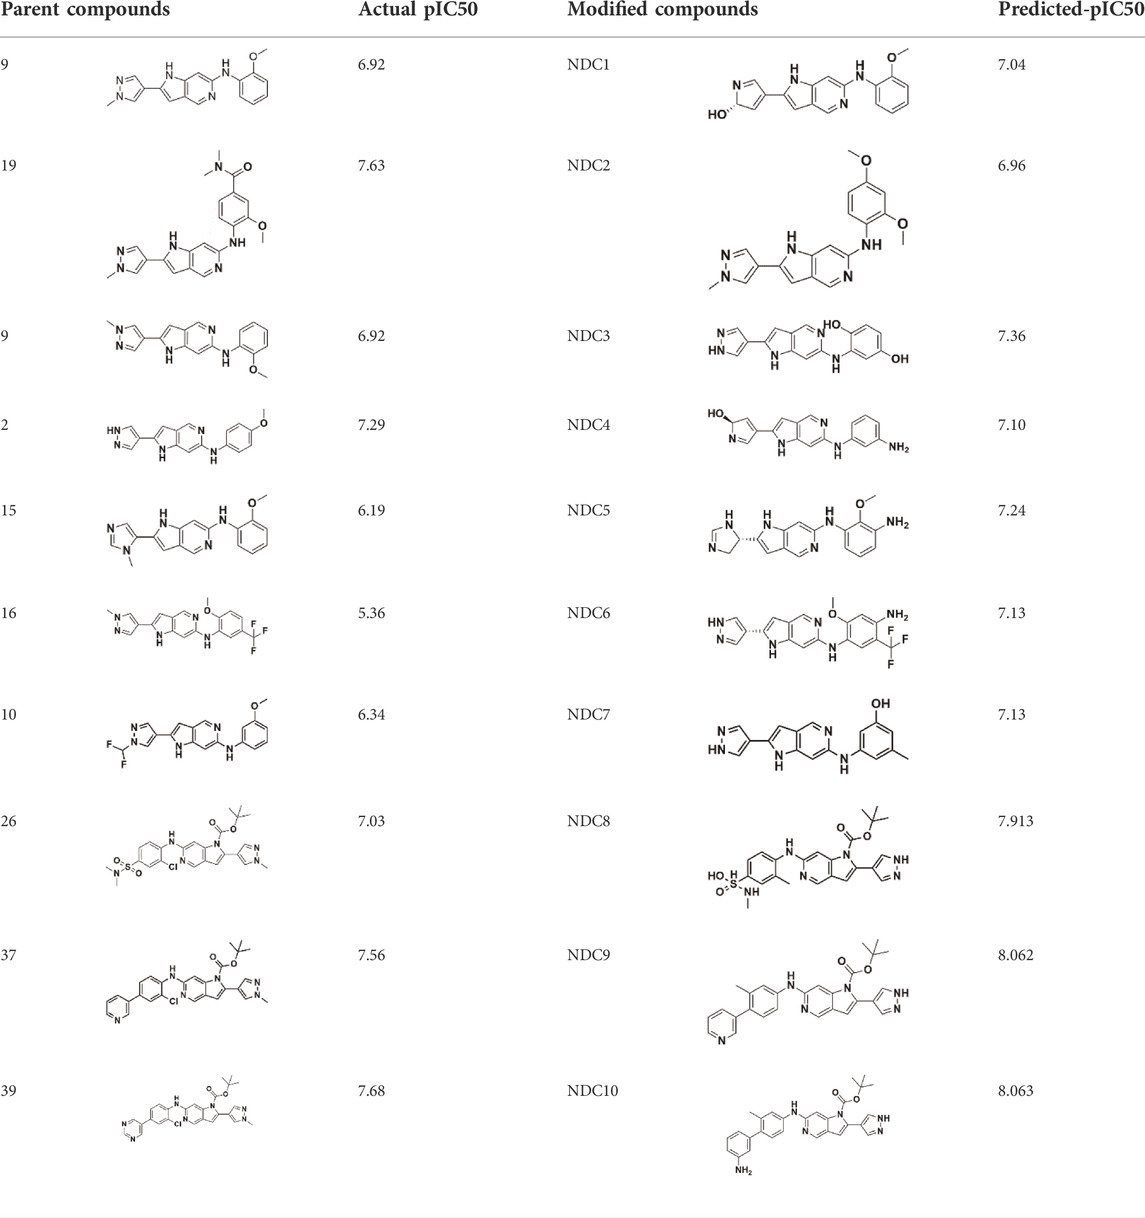
TABLE 2. Comparison of parent and modified compounds activities.
CoMFA contour maps
Contour maps of the best predictive models were generated on the most active compound, and then this 3D information was exploited to create new compounds predicted to have improved biological activities. The contour maps of CoMFA fields for the best model are shown in Figures 3A,B. The steric contour maps are shown in Figure 3A, the green contour denotes the favored area for bulky group substitution, whereas the yellow contour shows the disfavored area for bulky group substitutions. The replacement of bulky groups at R4 position will increase the activity of compounds. For example, compound 27 (pIC50 = 8.1) with azetidine amide at R4 is predicted to be more active than compound 17 (pIC50 = 7.13) which has nothing at same position. Figure 3B shows the electrostatic field contour maps. The red and blue contours represent the effect of the electrostatic field on the biological activity of compounds. The large blue contour near R1 position shows that the substitution of electron donating group will increase the activity of compound that’s why the activity of compound 1 (pIC50 = 7.60) having electron donating nitrogen at R1, is better than compound 10 (pIC50 = 6.34) that has electron with drawing difluromethyl at the same position. Similarly, the red contour near the R2 indicates that the replacement with electron withdrawing group will increase the bioactivity of the compounds. These observations are in agreement with previously published results (Vaidya et al., 2017).
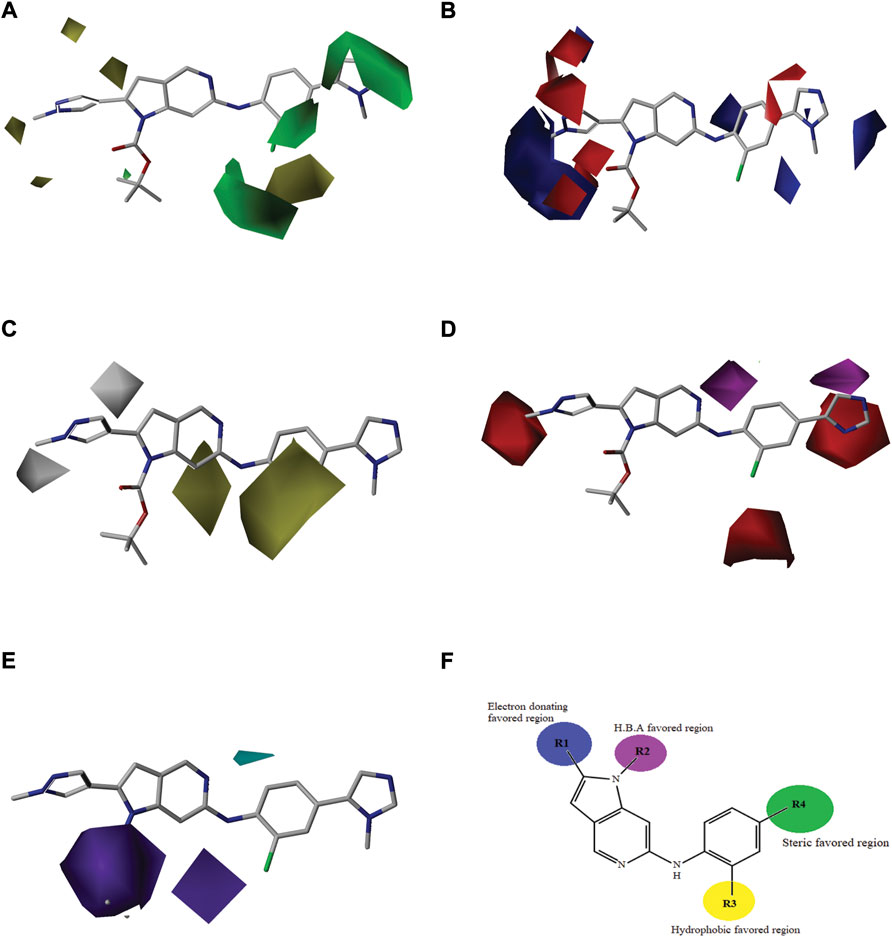
FIGURE 3. “Structure-based model of the most active compound represented through contour maps (36). (A) Contour maps of CoMFA steric field; (B) Contour maps of CoMFA electrostatic fields; (C) Contour maps of CoMSIA hydrophobic field; (D) Contour maps of CoMSIA hydrogen bond acceptor fields; (E) Contour maps of CoMSIA hydrogen bond donor fields; (F) Structure activity relationship representation of contour groups.”
CoMSIA contour maps
The contour maps of CoMFA and CoMSIA showed the similarity in steric and electrostatic fields. The remaining fields of CoMSIA i.e., hydrophobic, HBA and HBD are shown in Figures 3C,D,E. Figure 3C shows the hydrophobic contour, where yellow contour at the R3 position indicates that the substitution of the hydrophobic group is favorable to increase the activity while white contour near R1 position shows that the activity can be increased by replacing the hydrophilic group at this position. Therefore, compounds 22, 23, 28-30 and 33-39 with hydrophobic groups at the R3 position showed significant predicted biological activities. Figure 3D indicates the hydrogen bond acceptors contour. Magenta contour shows the area which is favorable for hydrogen bond acceptor group substitution while red region is favorable for hydrogen bond donor group substitution to increase the activity of compounds. Similarly, the purple contour in Figure 5E shows the disfavored area for hydrogen bond donor group substitution. So, the substitution of hydrogen bond donor groups at R1 and R4 position will increase the biological activity of compounds, while the substitution of hydrogen bond acceptor groups at R2 position will increase the activity. In the contour maps, hydrogen bond acceptors and donors shared 80% for favored regions while 20% for unfavored regions to increase the biological activity of compounds. The structure-activity relationship diagram (Figure 3F) was obtained from the CoMFA and CoMSIA contour maps. In order to design new compounds with better biological activities, the regions R1, R2, R3, and R4 are favorable for substitutions of electron donating groups, hydrogen bond acceptor groups, hydrophobic groups and bulky groups, respectively. In order to design new compounds, different modifications in the parent structures have been introduced based on the best CoMFA and CoMSIA models contours. For example, pyrazole ring of compound 9 showed favorable region for electron donating groups, so by replacing the methyl group with hydroxyl group, new compounds showed better predicted activity than parent compound. Similarly, a hydroxyl group was added to the compound 2 to get a new molecule with better activity. All new compounds were designed by adding specific groups at the favorable electron donating, hydrogen bond acceptor and steric group regions for better activities.
Binding mode elucidation of newly designed compounds
Newly designed compounds NDC1-10 were docked into the active site of TTK protein to identify their plausible binding modes. Prior to the docking of newly designed compounds, the glide docking protocol was validated by calculating the RMSD of redocked poses of co-crystal ligands (Muddassar et al., 2010). The co-crystal ligands were extracted from the co-crystal structures (PDB IDs: 3WZK, 4C4J, 5AP7) and docked again at the same binding position where cocrystal ligands were making the hydrogen bonding interactions with the hinge region residues. The docked pose was then aligned on the native ligand which showed identical interaction with <1.0 Å deviation from original pose. The redocking of representative co-crystal ligands can be observed in Figures 4A–C. Moreover, the accuracy of glide tool was estimated by area under curve studies. A decoy dataset of 917 compounds was used along with active compounds of TTK. The AUC curve value of 0.80 showed that the true positive rate was higher than the false positive results produced by the glide scoring scheme as shown in Figure 4D. After validation of docking method, newly designed compounds were docked in the active site of TTK protein. All compounds showed good binding affinities in terms of glide scores given in Supplementary Table S4. The binding interactions of the newly designed compounds were analyzed and it was observed that all compounds were making hydrogen bonds with the hinge region residues especially Gly110. The other interacting residues were Ile36, Lys58, Glu76, Met107, Cys109, Asn111, Ile112, Ser116, Lys120, Asp169, Met176 and Pro178. In case of hydrogen bonding, NDC1 made two hydrogen bonds with Glu76 and Gly110 with a distance of 1.7 and 2.8 Å respectively. NDC2 made one hydrogen bond with Gly110, while NDC3 was making two hydrogen bonds with Gly110. The same bonding pattern was observed in all complexes i.e., hydrogen bonding with Gly110, Glu76. Moreover, the residues Ile36, Ile112, Met105, Met176 and Pro178 were involved in hydrophobic interactions with the newly designed compounds. The hydrogen bonds and the distances between the ligands and key residues are given in Figure 5.

FIGURE 4. Docking protocol validation studies. The redocking of co-crystal ligands of three TTK X-rays crystal structures, (A) redocked pose of ligand in PDB ID: 3WZK is shown in cyan sticks, (B) redocked pose of ligand in PDB ID: 4C4J isshown in green sticks, (C) redocked pose of ligand in PDB ID: 5AP7 is shown in yellow sticks. The RMSD of redocked poses was less than 1Å. (D) The estimation of docking accuracy by AUC curve with a value of 0.80.
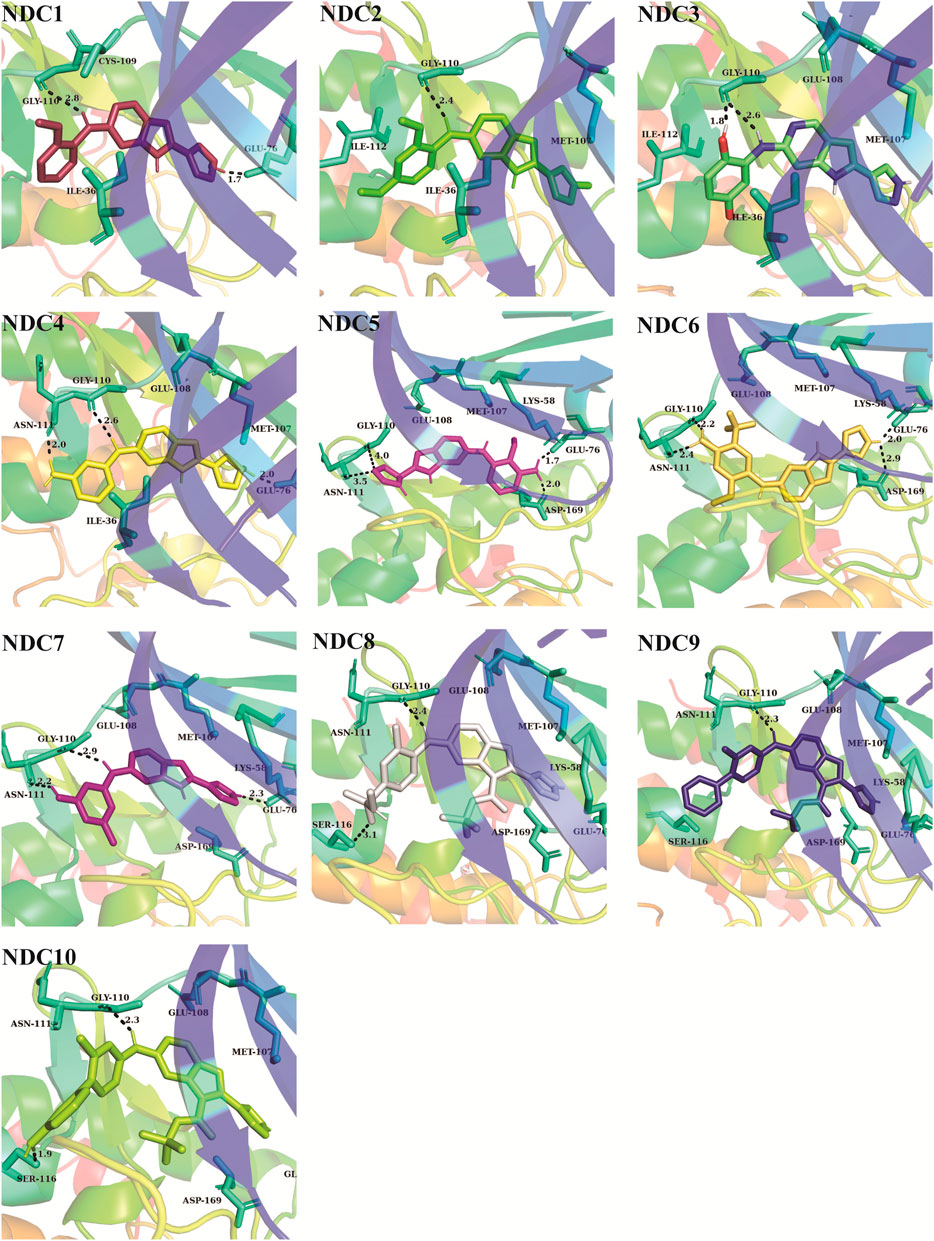
FIGURE 5. The binding interactions of newly designed compounds with the key residues of TTK binding pocket. The hydrogen bonds are denoted with black dash lines. The distance between the compounds and binding site residues is measured in Å.
MD simulation analysis
MD simulations were carried out to estimate the steady nature and stability of the protein and ligand complexes. The protein-ligand complex stability was estimated by the Root Mean Square Deviation (RMSD) of the complexes in 25 ns long simulation. The RMSD trajectories of ten complexes are shown in Figures 6A,B. The ideal range for the stable complex in terms of RMSD is 2–3 Å. It can be observed that all the complexes showed a stable RMSD value i.e., less than ∼2.5 Å as compare to the apo TTK which showed higher deviation in confirmation than complexes. All the complexes equilibrated at ∼ 2 ns and then got stability till the end of the simulation. Some complexes showed higher stability than others i.e., TTK-NDC4 and TTK-NDC5 with a RMSD values less than ∼1.5 Å. Additionally, the behavior of apo protein was also tested which showed that the protein complexes were more stable than apo protein.
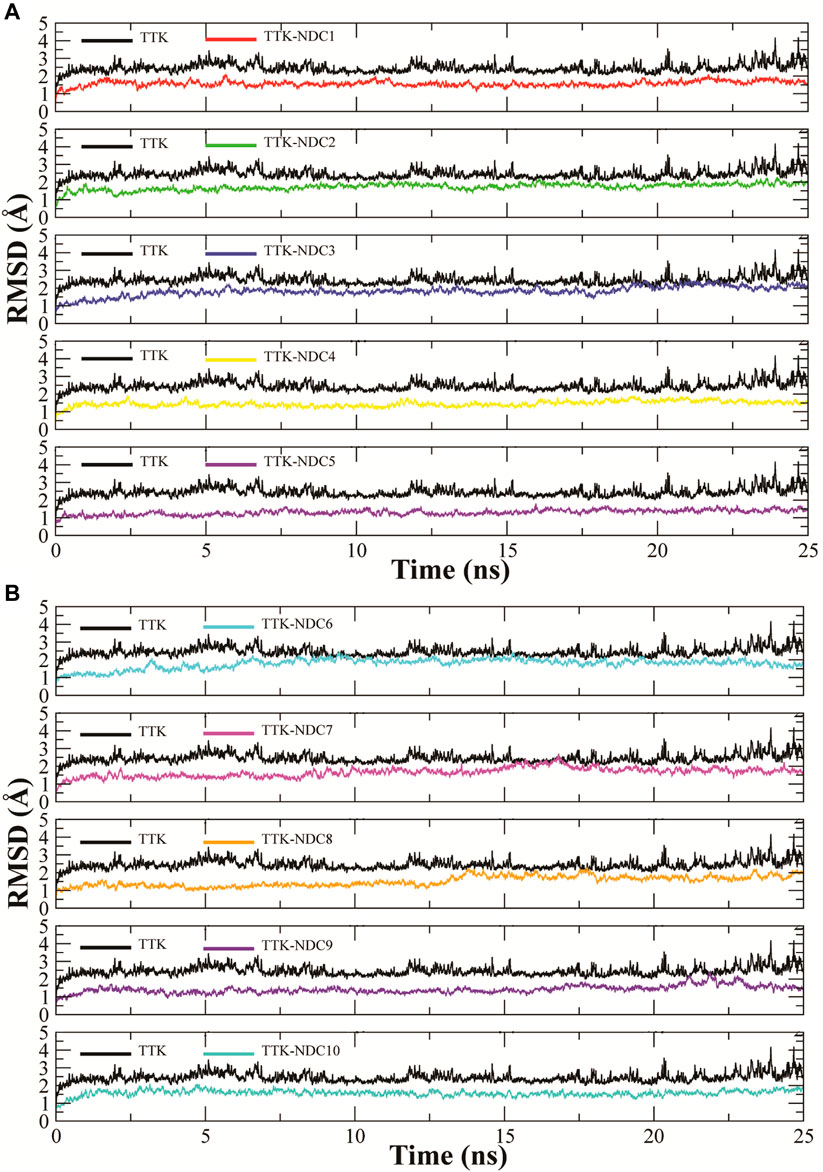
FIGURE 6. Root Mean Square Deviations in backbone of TTK bound to newly designed compounds; (A)TTK-NDC1 (red), TTK-NDC2 (green), TTK-NDC3 (blue), TTK-NDC4 (yellow), TTK-NDC5 (violet) (B)TTK-NDC6 (cyan), TTK-NDC7 (magenta), TTK-NDC8 (orange), TTK-NDC9 (indigo) and TTK-NDC10 (turquoise).
The fluctuations in the amino acid residues were calculated by Root Mean Square Fluctuation (RMSF). The residues with high RMSF values showed higher flexibility, or the residues that form loop regions showed higher RMSF values. Similarly, the residues with lower RMSF values remained rigid during the simulation. Figures 7A,B describes the RMSF plots of all complexes. The C and N terminals showed highest RMSF values while the loop regions also showed relatively higher values than the rigid residues. All the complexes showed almost the same trend in RMSF values, with two regions having major fluctuations except for TTK-NDC3 and TTK-NDC6 complex. The major fluctuations were observed in the regions 85 to 115 and 210 to 225 residues. These correspond to the loop regions in the TKK protein while the other residues remained rigid having only a minor fluctuation in RMSF values.
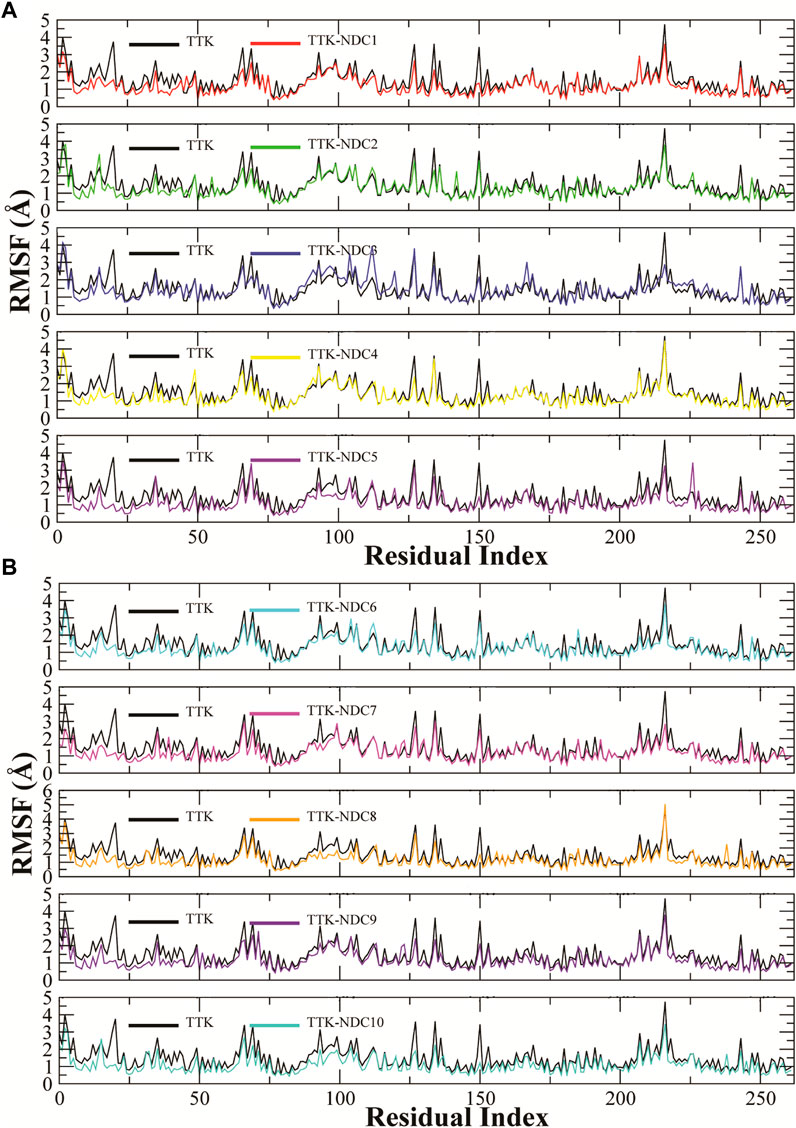
FIGURE 7. (A,B). Root Mean Square Fluctuations of amino acid residues of TTK protein and its complexes to compare the flexibility of protein structures.
Rg (radius of gyration) is used to show the change in the structure compactness of subjected protein during simulations. The compactness shows that bound small molecules did not induce any conformational in the protein over the simulation time period (Seeliger and de Groot, 2010). Rg analysis represents how the secondary structures are compactly packed in 3D structure of proteins. The Rg plots of all complexes and apo TTK are shown in Figures 8A,B. TTK-NDC1 (black) had shown highest Rg during ∼5–8 ns, with Rg value reaching16.6 Å, while TTK-NDC2 (red) had shown the second highest value of ∼16.6 Å during first 5 ns simulations. The remaining complexes showed the stable Rg values throughout the simulation period. The stable Rg values indicated that the protein remained compact, and less unfolding was observed in all protein-ligand complexes as compare to the apo protein which showed higher Rg values than complexes throughout the simulation period (Grutsch et al., 2014).
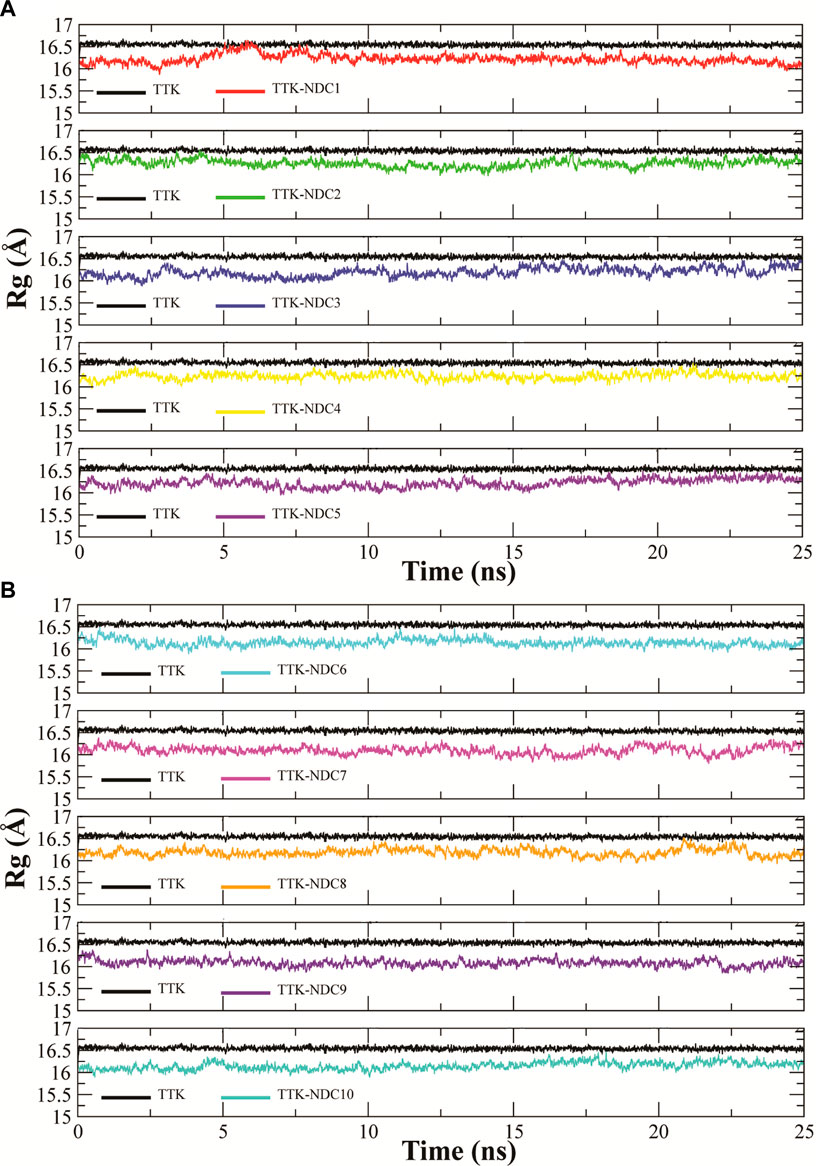
FIGURE 8. (A,B). Radius of gyration of Cα atoms of TTK protein with bound compounds to analyze the relative compactness of protein complexes.
SASA (solvent accessible surface area) is the surface area of a biomolecule that is accessible to a solvent. It determines how much an amino acid is exposed to its environment. Lower SASA values represent compact structure of protein while high values represent unfolded structures. SASA values of all TTK protein and its complexes were analyzed to predict the changes in the structure of the protein Figures 9A,B. The Figure shows that the proteins with ligands NDC2, NDC3 and NDC5 have higher SASA values while proteins with rest of the ligands have lowest SASA values. These results indicate that ligand binding can affect the protein’s tertiary structure. Increased values of SASA represent distortion in the structures.
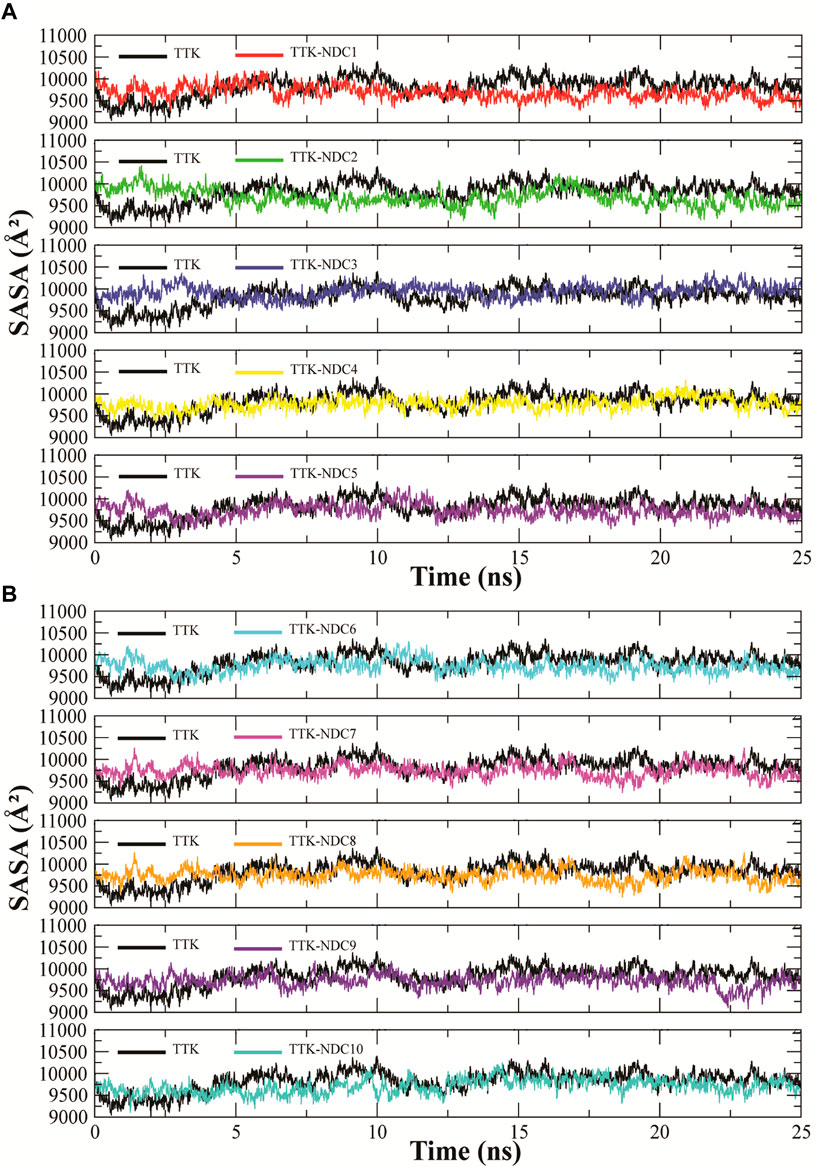
FIGURE 9. (A,B). Solvent accessible surface area (SASA) calculation of TTK protein and its complexes throughout the simulation to find the exposed surface of protein to solvent during simulation.
PCA (Principal Component Analysis) characterizes the dynamic behavior of proteins (David and Jacobs, 2014). It helps to identify collective motions of the trajectories during MD simulations. In the graph of TTK-NDC1 (Figure 10), eigenvalues of the proteins were plotted against the corresponding eigenvector index for the first twenty modes of motion. The eigenvalues represent eigenvector fluctuations in hyperspace. In simulations overall movement of the proteins is controlled by eigenvectors with higher eigenvalues. In our systems, the first five eigenvectors exhibited dominant movements with a higher eigenvalue (29.5–70.3%), whereas the remaining eigenvectors had low eigenvalues. The plotted first three PC1, PC2 and PC3 covered the more than 50% of total variations. The Figure 10 plots shows that PC1 clusters possessed highest variability of 29.54%, PC2 depicted the variability of 15.39%, while PC3 exhibited minimal variability which is 6.92%. Minimal variability suggests that PC3 has the most stabilized protein ligand binding and occupies less region in phase space; hence its structure is compact as compare to PC1 and PC2. Through simple clustering in PC subspace, the PCA analysis revealed conformational changes in all clusters, blue regions showed most significant movement, white regions show intermediate movement while red regions show that there is less movement of flexibility. The PCA plots of remaining complexes are given in Supplementary Figures S1A–S1I.
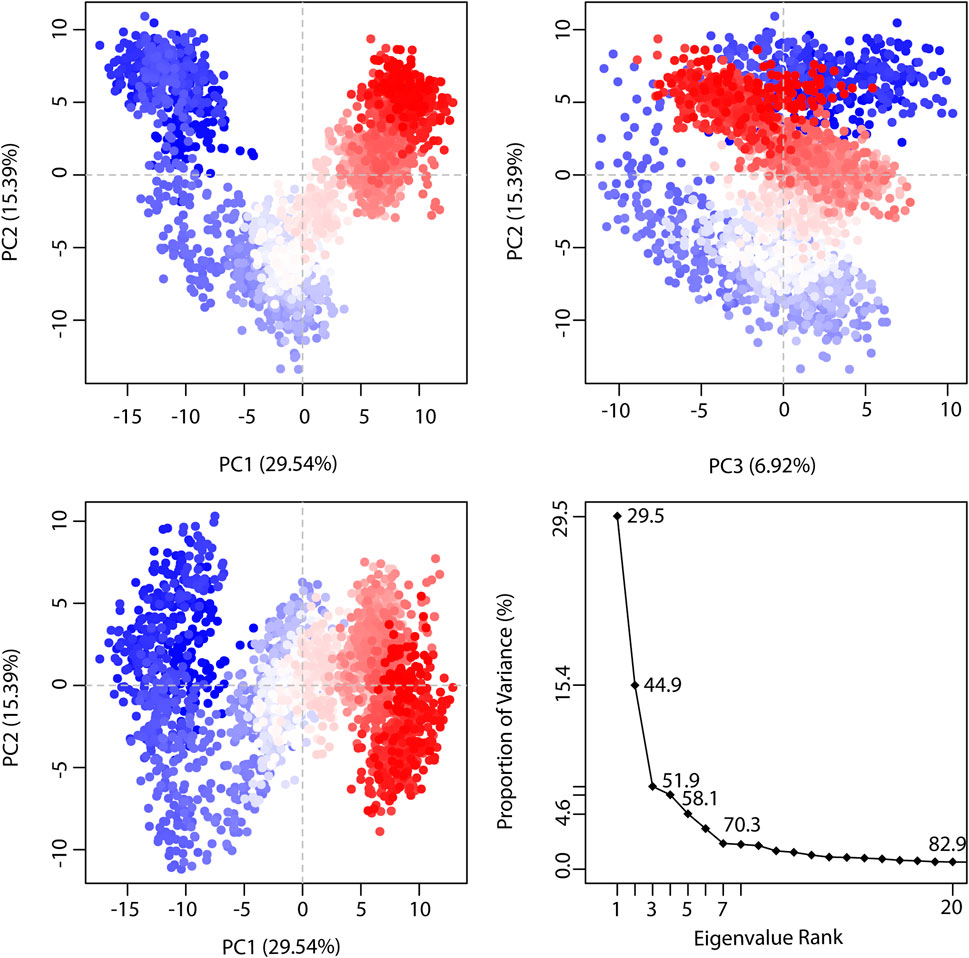
FIGURE 10. The representation of proportion of variance % (TTK-NDC1) against eigenvalue calculated by Principal Component Analysis. Three PCs are showing the fluctuating regions. The fluctuations in PC1, PC2, and PC3 are 29.54%, 15.39% and 6.92% respectively. The overall fluctuations are 51.85%.
The cross-correlation map showed the pairwise correlation of NDC1 with the TTK protein by the value of pairwise cross-correlation coefficient (Figure 11). The correlated residues are more than 0.8 and are shown in cyan color, while the anti-correlated residues (<-0.4) are indicated with magenta color. The high percentage of pairwise correlated residues indicated the stable binding of the ligand with the TKK protein. The cross-correlation maps of other complexes are given in Supplementary Figures S2A–S2I.
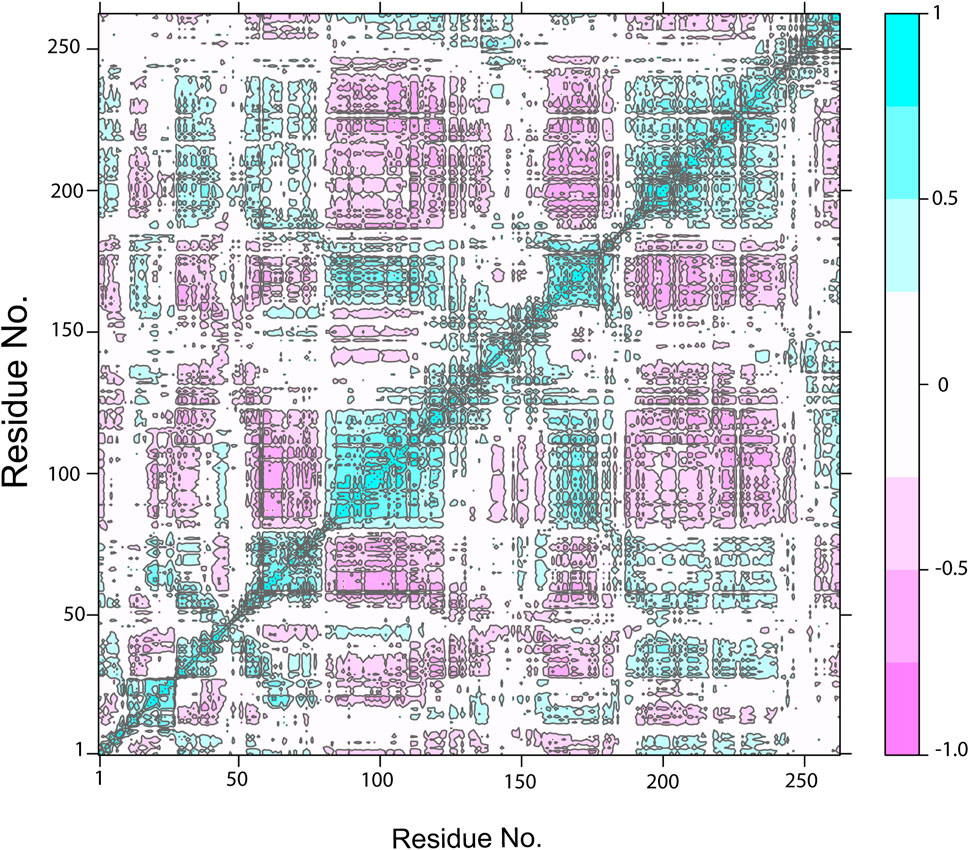
FIGURE 11. The Dynamic Cross-Correlation map of TTK-NDC1 complex. The positive and negative correlation among the residues is shown by cyan and purple color, respectively.
The binding free energy estimation
The MM/PBSA is a significant method to estimate the binding free energy of protein-ligand complexes. The ΔGbind values for all complexes were estimated using this method. The ΔG is the outcome of tcontribu-tion of various protein-ligand interactions such as van der Waals energy (ΔEvdW), electrostatic energy (ΔEele) and EPB (electrostatic contribution to solvation free energy by Poisson-Boltzmann) energy. The ΔEvdW of NDC9 and NDC10 complexes are found to be -78.76 kcal/mol and-72.07 kcal/mol respectively and contributing more in binding affinities as compared to other designed compounds. Whereas NDC8 complex having −29.34 kcal/mol showing its limited contribution whereas in remaining complexes it contributed more. In case of ΔEele contribution, the energy component is −5.85 kcal/mol in NDC1, 0.39 kcal/mol in NDC2, −4.09 kcal/mol in NDC3, −2.38 kcal/mol in NDC4, −8.55 kcal/mol in NDC5, −2.05 kcal/mol in NDC6, −2.57 kcal/mole in NDC7, −19.18 kcal/mol in NDC8, −5.04 kcal/mol in NDC9, and −5.22 kcal/mol in NDC10. ΔEele energy contribution of NDC8 complex is highest among all other complexes. Moreover, the PB contribution of all complexes are showing that NDC8 has higher PB value than other complexes. The calculated binding free energies of all the complexes are shown in Table 3. The binding free energies ΔGbind of NDC1 (−19.20 kcal/mol), NDC7(−18.71 kcal/mol) and NDC9 (−20.72 kcal/mol) are quite better than other complexes. The differences in the binding energies are due to the difference in the contribution of electrostatic, polar, and non-polar energies in the protein-ligand complexes.
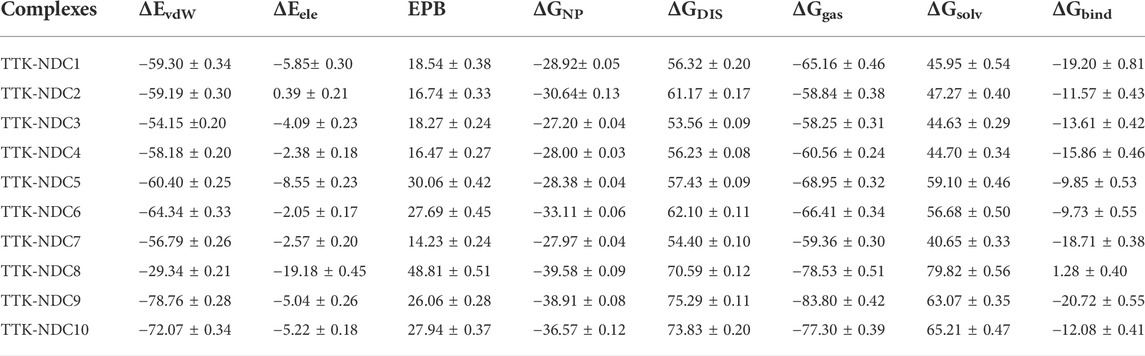
TABLE 3. Components of the binding free energies of TTK and designed compounds complexes.
Calculations of physicochemical properties
QikProp software was used to estimate the physicochemical parameters (Table 4). With almost one rule violation, the majority of newly created molecules followed the Lipinski’s rule. The predicted octanol/water partition coefficient ‘QPlogPo/w’ values range (10.346–16.905), HERG K+ channels “QPlogHERG” blocking IC50 values range (−7.032 to −5.518), caco-2 cell permeability “QPPCaco’” values range (66.578–2019.982), brain/blood partition coefficient “QPlogBB” values range (−1.9 to −0.427), and human serum albumin binding “QPkhsa” values range (−0.155–0.947) are within the acceptable ranges for 95 percent oral drugs (Kumar et al., 2016). Within the recommended ranges, physicochemical qualities such as ‘QPlogPo/w and QPlogHERG’ showed smooth diffusion of drug and protection against unexpected cardiac arrest (Kumar et al., 2016).
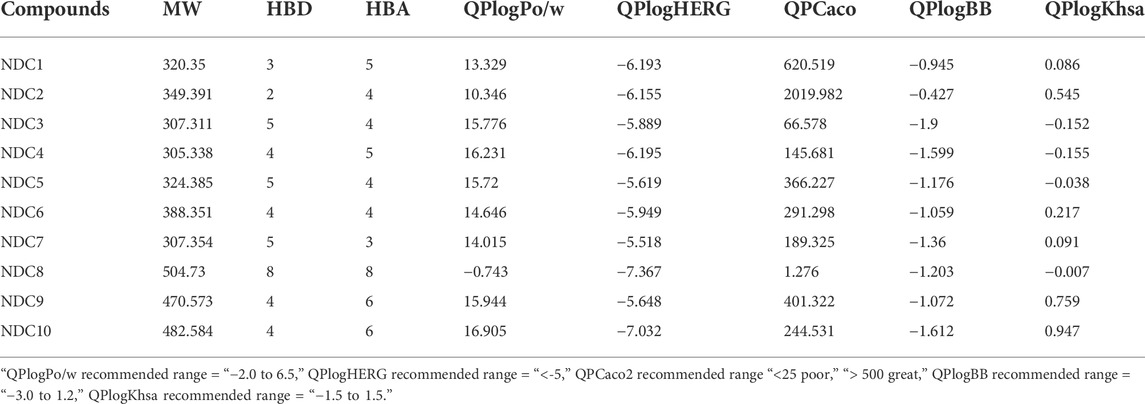
TABLE 4. Predicted physicochemical properties of the newly designed molecules.
Conclusion
TTK is an important mitotic kinase whose loss of function results in chromosomal segregation defects that can lead to aneuploidy and cell death, making it an attractive drug target for cancer. Using different partial charges and alignment methods, structure-based 3D-QSAR models on MMFF94 charges yielded best CoMFA and CoMSIA models. Using these predictive models and contour maps information ten new compounds were designed and their biological activities were predicted. The newly designed compounds showed better predicted activities than their parent compounds, demonstrating that structure-based approaches using MMFF94 charges can be used to design better active TTK inhibitors. Further MD simulations described the stability of protein-ligand complexes. Similarly computational binding free energy calculations suggest that newly designed compounds can bind to TTK protein with better binding affinity than reported compounds.
Data availability statement
The original contributions presented in the study are included in the article/Supplementary Material, further inquiries can be directed to the corresponding authors.
Author contributions
NA, NY, and AF retrived data and performed experiment. AA, MA, MS and MM contributed to conception and design of the study. MA performed the statistical analysis. NA, NY, AF, MM wrote the first draft of the manuscript. MA, AA, and MS, proof read all sections of the manuscript.
Acknowledgments
Authors are thankful to Higher Education Commission of Pakistan for providing funds vide project no. 8094/Balochistan/NRPU/R&D/HEC/2017 to purchase software. We also thank the CERTARA company for providing us the evaluation version of SYBYL-X software.
Conflict of interest
The authors declare that the research was conducted in the absence of any commercial or financial relationships that could be construed as a potential conflict of interest.
Publisher’s note
All claims expressed in this article are solely those of the authors and do not necessarily represent those of their affiliated organizations, or those of the publisher, the editors and the reviewers. Any product that may be evaluated in this article, or claim that may be made by its manufacturer, is not guaranteed or endorsed by the publisher.
Supplementary material
The Supplementary Material for this article can be found online at: https://www.frontiersin.org/articles/10.3389/fchem.2022.1003816/full#supplementary-material
References
Acun, B., Hardy, D. J., Kale, L. V., Li, K., Phillips, J. C., and Stone, J. E. (2018). Scalable molecular dynamics with NAMD on the Summit system. IBM J. Res. Dev. 62 (4), 1–9. doi:10.1147/jrd.2018.2888986
Balasubramanian, P. K., Balupuri, A., and Cho, S. J. (2014). A CoMFA study of phenoxypyridine-based JNK3 inhibitors using various partial charge schemes. J. Chosun Nat. Sci. 7, 45–49. doi:10.13160/ricns.2014.7.1.45
Bhachoo, J., and Beuming, T. J. M. P.-P. I. (2017). Investigating protein–peptide interactions using the Schrödinger computational suite. Methods Mol. Biol. 1561, 235–254. doi:10.1007/978-1-4939-6798-8_14
Brough, R., Frankum, J. R., Sims, D., Mackay, A., Mendes-Pereira, A. M., Bajrami, I., et al. (2011). Functional viability profiles of breast cancer. Cancer Discov. 1, 260–273. doi:10.1158/2159-8290.CD-11-0107
Bursavich, M. G., Dastrup, D., Shenderovich, M., Yager, K. M., Cimbora, D. M., Williams, B., et al. (2013). Novel Mps1 kinase inhibitors: From purine to pyrrolopyrimidine and quinazoline leads. Bioorg. Med. Chem. Lett. 23, 6829–6833. doi:10.1016/j.bmcl.2013.10.008
Case, D. A., Aktulga, H. M., Belfon, K., Ben-Shalom, I., Brozell, S. R., Cerutti, D., et al. (2021). Amber 2021: Reference manual. Covers Amber20 AmberTools21. doi:10.13140/RG.2.2.15902.66881
Chen, Y., Yu, W., Jiang, C.-C., and Zheng, J.-G. J. M. (2018). Insights into resistance mechanisms of inhibitors to Mps1 C604Y mutation via a comprehensive molecular modeling study. Molecules 23, 1488. doi:10.3390/molecules23061488
Daniel, J., Coulter, J., Woo, J.-H., Wilsbach, K., and Gabrielson, E. J. P. O. T. N. A. O. S. (2011). High levels of the Mps1 checkpoint protein are protective of aneuploidy in breast cancer cells. Proc. Natl. Acad. Sci. U. S. A. 108, 5384–5389. doi:10.1073/pnas.1007645108
David, C. C., and Jacobs, D. J. (2014). Principal component analysis: A method for determining the essential dynamics of proteins. Methods Mol. Biol. 1084, 193–226. doi:10.1007/978-1-62703-658-0_11
Duan, Y., Wu, C., Chowdhury, S., Lee, M. C., Xiong, G., Zhang, W., et al. (2003). A point‐charge force field for molecular mechanics simulations of proteins based on condensed‐phase quantum mechanical calculations. J. Comput. Chem. 24, 1999–2012. doi:10.1002/jcc.10349
Fisk, H. A., and Winey, M. (2001). The mouse Mps1p-like kinase regulates centrosome duplication. Cell 106, 95–104. doi:10.1016/s0092-8674(01)00411-1
Ghosh, S., Keretsu, S., and Cho, S. J. (2021). Designing of the N-ethyl-4-(pyridin-4-yl) benzamide based potent ROCK1 inhibitors using docking, molecular dynamics, and 3D-QSAR. PeerJ 9, e11951. doi:10.7717/peerj.11951
Grutsch, S., Fuchs, J. E., Freier, R., Kofler, S., Bibi, M., Asam, C., et al. (2014). Ligand binding modulates the structural dynamics and compactness of the major birch pollen allergen. Biophys. J. 107, 2972–2981. doi:10.1016/j.bpj.2014.10.062
Hu, R., Barbault, F., Delamar, M., and Zhang, R. (2009). Receptor-and ligand-based 3D-QSAR study for a series of non-nucleoside HIV-1 reverse transcriptase inhibitors. Bioorg. Med. Chem. 17, 2400–2409. doi:10.1016/j.bmc.2009.02.003
Huang, M., Huang, Y., Guo, J., Yu, L., Chang, Y., Wang, X., et al. (2021). Pyrido [2, 3-d] pyrimidin-7 (8H)-ones as new selective orally bioavailable Threonine Tyrosine Kinase (TTK) inhibitors. Eur. J. Med. Chem. 211, 113023. doi:10.1016/j.ejmech.2020.113023
Koç, E., Üngördü, A., and Candan, F. J. S. C. (2021). Antioxidant activities of Alyssum virgatum plant and its main components. Struct. Chem. 33, 267–279. doi:10.1007/s11224-021-01856-1
Kumar, A., Ito, A., Hirohama, M., Yoshida, M., and Zhang, K. Y. (2016). Identification of new SUMO activating enzyme 1 inhibitors using virtual screening and scaffold hopping. Bioorg. Med. Chem. Lett. 26, 1218–1223. doi:10.1016/j.bmcl.2016.01.030
Kusakabe, K.-I., Ide, N., Daigo, Y., Itoh, T., Higashino, K., Okano, Y., et al. (2012). Diaminopyridine-based potent and selective Mps1 kinase inhibitors binding to an unusual flipped-peptide conformation. ACS Med. Chem. Lett. 3, 560–564. doi:10.1021/ml3000879
Laufer, R., Ng, G., Liu, Y., Patel, N. K. B., Edwards, L. G., Lang, Y., et al. (2014). Discovery of inhibitors of the mitotic kinase TTK based on N-(3-(3-sulfamoylphenyl)-1H-indazol-5-yl)-acetamides and carboxamides. Bioorg. Med. Chem. 22, 4968–4997. doi:10.1016/j.bmc.2014.06.027
Li, S., Fan, J., Peng, C., Chang, Y., Guo, L., Hou, J., et al. (2017). New molecular insights into the tyrosyl-tRNA synthase inhibitors: CoMFA, CoMSIA analyses and molecular docking studies. Sci. Rep. 7, 1–13. doi:10.1038/s41598-017-10618-1
Lindberg, M. F., and Meijer, L. (2021). Dual-specificity, tyrosine phosphorylation-regulated kinases (DYRKs) and cdc2-like kinases (CLKs) in human disease, an overview. Int. J. Mol. Sci. 22, 6047. doi:10.3390/ijms22116047
Liu, X., Liao, W., Yuan, Q., Ou, Y., and Huang, J. (2015a). TTK activates Akt and promotes proliferation and migration of hepatocellular carcinoma cells. Oncotarget 6, 34309–34320. doi:10.18632/oncotarget.5295
Liu, X., and Winey, M. (2012). The MPS1 family of protein kinases. Annu. Rev. Biochem. 81, 561–585. doi:10.1146/annurev-biochem-061611-090435
Liu, Y., Lang, Y., Patel, N. K., Ng, G., Laufer, R., Li, S.-W., et al. (2015b). The discovery of orally bioavailable tyrosine threonine kinase (TTK) inhibitors: 3-(4-(heterocyclyl) phenyl)-1 H-indazole-5-carboxamides as anticancer agents. J. Med. Chem. 58, 3366–3392. doi:10.1021/jm501740a
Lorca, M., Valdes, Y., Chung, H., Pessoa-Mahana, C. D., and Mella, J. 2018. 3D-QSAR on a series of pyrimidinyl-piperazine-carboxamides based Fatty Acid Amide Hydrolase (FAAH) inhibitors as a useful tool to obtain novel endocannabinoid enhancers, Preprints 2018.
Lu, N., and Ren, L. J. B. (2021). TTK (threonine tyrosine kinase) regulates the malignant behaviors of cancer cells and is regulated by microRNA-582-5p in ovarian cancer. Bioengineered 12, 5759–5768. doi:10.1080/21655979.2021.1968778
Maia, A. R., De Man, J., Boon, U., Janssen, A., Song, J.-Y., Omerzu, M., et al. (2015). Inhibition of the spindle assembly checkpoint kinase TTK enhances the efficacy of docetaxel in a triple-negative breast cancer model. Ann. Oncol. 26, 2180–2192. doi:10.1093/annonc/mdv293
Muddassar, M., Jang, J. W., Hong, S. K., Cho, Y. S., Kim, E. E., Keum, K. C., et al. (2010). Identification of novel antitubercular compounds through hybrid virtual screening approach. Bioorg. Med. Chem. 18, 6914–6921. doi:10.1016/j.bmc.2010.07.010
Muddassar, M., Pasha, F., Neaz, M., Saleem, Y., and Cho, S. (2009). Elucidation of binding mode and three dimensional quantitative structure–activity relationship studies of a novel series of protein kinase B/Akt inhibitors. J. Mol. Model. 15, 183–192. doi:10.1007/s00894-008-0416-7
Naud, S., Westwood, I. M., Faisal, A., Sheldrake, P., Bavetsias, V., Atrash, B., et al. (2013). Structure-based design of orally bioavailable 1H-Pyrrolo[3, 2-c]pyridine inhibitors of mitotic kinase monopolar spindle 1 (MPS1). J. Med. Chem. 56, 10045–10065. doi:10.1021/jm401395s
Puzyn, T., Mostrag-Szlichtyng, A., Gajewicz, A., Skrzyński, M., and Worth, A. P. (2011). Investigating the influence of data splitting on the predictive ability of QSAR/QSPR models. Struct. Chem. 22, 795–804. doi:10.1007/s11224-011-9757-4
Roe, D. R., and Cheatham, T. E. J. J. O. C. T. (2013). PTRAJ and CPPTRAJ: Software for processing and analysis of molecular dynamics trajectory data. J. Chem. Theory Comput. 9, 3084–3095. doi:10.1021/ct400341p
Sainy, J., and Sharma, R. (2015). QSAR analysis of thiolactone derivatives using HQSAR, CoMFA and CoMSIA. SAR QSAR Environ. Res. 26, 873–892. doi:10.1080/1062936x.2015.1095238
Schmidt, M., Budirahardja, Y., Klompmaker, R., and Medema, R. H. J. E. R. (2005). Ablation of the spindle assembly checkpoint by a compound targeting Mps1. EMBO Rep. 6, 866–872. doi:10.1038/sj.embor.7400483
Seeliger, D., and De Groot, B. L. (2010). Conformational transitions upon ligand binding: Holo-structure prediction from apo conformations. PLoS Comput. Biol. 6, e1000634. doi:10.1371/journal.pcbi.1000634
Shiri, F., Rakhshani-Morad, S., Samzadeh-Kermani, A., and Karimi, P. (2016). Computer-aided molecular design of some indolinone derivatives of PLK4 inhibitors as novel anti-proliferative agents. Med. Chem. Res. 25, 2643–2665. doi:10.1007/s00044-016-1638-3
Stucke, V. M., Silljé, H. H., Arnaud, L., and Nigg, E. A. (2002). Human Mps1 kinase is required for the spindle assembly checkpoint but not for centrosome duplication. EMBO J. 21, 1723–1732. doi:10.1093/emboj/21.7.1723
Sugimoto, Y., Sawant, D. B., Fisk, H. A., Mao, L., Li, C., Chettiar, S., et al. (2017b). Novel pyrrolopyrimidines as Mps1/TTK kinase inhibitors for breast cancer. Bioorg. Med. Chem. 25, 2156–2166. doi:10.1016/j.bmc.2017.02.030
Sugimoto, Y., Sawant, D. B., Fisk, H. A., Mao, L., Li, C., Chettiar, S., et al. (2017a). Novel pyrrolopyrimidines as Mps1/TTK kinase inhibitors for breast cancer. Bioorg. Med. Chem. 25, 2156–2166. doi:10.1016/j.bmc.2017.02.030
Sun, H., Li, Y., Shen, M., Tian, S., Xu, L., Pan, P., et al. (2014). Assessing the performance of MM/PBSA and MM/GBSA methods. 5. Improved docking performance using high solute dielectric constant MM/GBSA and MM/PBSA rescoring. Phys. Chem. Chem. Phys. 16, 22035–22045. doi:10.1039/c4cp03179b
Tahir, A., Alharthy, R. D., Naseem, S., Mahmood, N., Ahmed, M., Shahzad, K., et al. (2018). Investigations of structural requirements for brd4 inhibitors through ligand-and structure-based 3D QSAR approaches. Molecules 23, 1527. doi:10.3390/molecules23071527
Vaidya, A., Jain, A. K., Kumar, B. P., Sastry, G., Kashaw, S. K., and Agrawal, R. K. (2017). CoMFA, CoMSIA, kNN MFA and docking studies of 1, 2, 4-oxadiazole derivatives as potent caspase-3 activators. Arabian J. Chem. 10, S3936–S3946. doi:10.1016/j.arabjc.2014.05.034
Wang, F., Yang, W., Shi, Y., and Le, G. (2015). Structural analysis of selective agonists of thyroid hormone receptor β using 3D-QSAR and molecular docking. J. Taiwan Inst. Chem. Eng. 49, 1–18. doi:10.1016/j.jtice.2014.11.009
Wang, W., Yang, Y., Gao, Y., Xu, Q., Wang, F., Zhu, S., et al. (2009). Structural and mechanistic insights into Mps1 kinase activation. J. Cell. Mol. Med. 13, 1679–1694. doi:10.1111/j.1582-4934.2008.00605.x
Wei, J.-H., Chou, Y.-F., Ou, Y.-H., Yeh, Y.-H., Tyan, S.-W., Sun, T.-P., et al. (2005). TTK/hMps1 participates in the regulation of DNA damage checkpoint response by phosphorylating CHK2 on threonine 68. J. Biol. Chem. 280, 7748–7757. doi:10.1074/jbc.m410152200
Wengner, A. M., Siemeister, G., Koppitz, M., Schulze, V., Kosemund, D., Klar, U., et al. (2016). Novel Mps1 kinase inhibitors with potent antitumor activity. Mol. cancer Ther. 15, 583–592. doi:10.1158/1535-7163.mct-15-0500
Keywords: TTK inhibitors, molecular docking, 3D-QSAR, MD simulations, MMPBSA
Citation: Ashraf N, Asari A, Yousaf N, Ahmad M, Ahmed M, Faisal A, Saleem M and Muddassar M (2022) Combined 3D-QSAR, molecular docking and dynamics simulations studies to model and design TTK inhibitors. Front. Chem. 10:1003816. doi: 10.3389/fchem.2022.1003816
Received: 26 July 2022; Accepted: 13 October 2022;
Published: 02 November 2022.
Edited by:
Sibhghatulla Shaikh, Yeungnam University, South KoreaReviewed by:
Malay Kumar Rana, Indian Institute of Science Education and Research Berhampur (IISER), IndiaHanine Hadni, Sidi Mohamed Ben Abdellah University, Morocco
Copyright © 2022 Ashraf, Asari, Yousaf, Ahmad, Ahmed, Faisal, Saleem and Muddassar. This is an open-access article distributed under the terms of the Creative Commons Attribution License (CC BY). The use, distribution or reproduction in other forums is permitted, provided the original author(s) and the copyright owner(s) are credited and that the original publication in this journal is cited, in accordance with accepted academic practice. No use, distribution or reproduction is permitted which does not comply with these terms.
*Correspondence: Asnuzilawati Asari, YXNudUB1bXQuZWR1Lm15; Muhammad Muddassar, bW11ZGRhc3NhckBjb21zYXRzLmVkdS5waw==
†These authors have contributed equally to this work