 Wenbo Guo1,2
 Zhichen Fan2Kai Fan2Jiajia Meng2Dongxia Nie2
 Emmanuel K. Tangni3Zenghe Li1*Zhihui Zhao2
 Zheng Han2*
- 1School of Chemistry, Beijing University of Chemical Technology, Beijing, China
- 2Institute for Agro-food Standards and Testing Technology, Shanghai Key Laboratory of Protected Horticultural Technology, Shanghai Academy of Agricultural Sciences, Shanghai, China
- 3Organic Contaminants and Additives, Chemical and Physical Health Risks, Sciensano, Leuvensesteenweg, Brussels, Belgium
The in vivo kinetics of aflatoxin B1 (AFB1) and its carry-over as aflatoxin M1 (AFM1) in milk as well as the toxin loads in the tissue of dairy cows were assessed through a repetitive feeding trial of an AFB1-contaminated diet of 4 μg kg−1 body weight (b.w.) for 13 days. This was followed by a clearance period that ended with a single dose trial of an AFB1-contaminated diet of 40 μg kg−1 b.w. An ultra-high performance liquid chromatography tandem mass spectrometry method was developed and successfully validated by the determination of linearity (R2 ≥ 0.990), sensitivity (lower limit of quantification, 0.1–0.2 ng ml−1), recovery (79.5–111.2%), and precision relative standard deviation (RSD) ≤14.7%) in plasma, milk, and various tissues. The repetitive ingestion of AFB1 indicated that the biotransformation of AFB1 to AFM1 occurred within 48 h, and the clearance period of AFM1 in milk was not more than 2 days. The carry-over rate of AFM1 in milk during the continuous ingestion experiment was in the range of 1.15–2.30% at a steady state. The in vivo kinetic results indicated that AFB1 reached a maximum concentration of 3.8 ± 0.9 ng ml−1 within 35.0 ± 10.2 min and was slowly eliminated from the plasma, with a half-life time (T1/2) of 931.1 ± 30.8 min. Meanwhile, AFM1 reached a plateau in plasma (0.5 ± 0.1 ng ml−1) at 4 h after the ingestion. AFB1 was found in the heart, spleen, lungs, and kidneys at concentrations of 1.6 ± 0.3, 4.1 ± 1.2, 3.3 ± 0.9 and 5.6 ± 1.4 μg kg−1, respectively. AFM1 was observed in the spleen and kidneys at concentrations of only 0.7 ± 0.2 and 0.8 ± 0.1 μg kg−1, respectively. In conclusion, the in vivo kinetics and biotransformation of AFB1 in dairy cows were determined using the developed UHPLC-MS/MS method, and the present findings could be helpful in assessing the health risks to consumers.
Introduction
Aflatoxin B1 (AFB1), primarily produced by Aspergillus flavus, Aspergillus parasiticus, and Aspergillus nomius, is frequently found in different feeds and their raw materials (Kumar et al., 2016; Frazzoli et al., 2017). AFB1 has been classified as a group Ι. Carcinogen by the International Agency for Research on Cancer (IARC) (Global Health, 2012) because of its hepatic, carcinogenic, teratogenic, mutagenic, immunosuppressive, and reproductive toxicities to livestock and poultry (Gross-Steinmeyer and Eaton, 2012; Iqbal et al., 2019). Aflatoxin M1 (AFM1), derived from the 4-hydroxylated metabolite of AFB1 (chemical structures shown in Supplementary Figure S1), is also a potential human carcinogen classified as group Ι by IARC (Ostry et al., 2017), and it is usually secreted into milk after the ingestion of AFB1-contaminated diets.
In recent decades, there have been many reports on the natural occurrence of AFB1 in feeds and AFM1 in milk and milk products (Natour et al., 1991; Han et al., 2013; Canestrari et al., 2016). The amount of AFM1 in milk and AFB1 in feeds consumed by animals could lead to health risks to consumers (Gonçalves et al., 2017). Therefore, the maximum AFB1 limits have been set as 5 μg kg−1 for compound feeds and 20 μg kg−1 for all feed materials in EU (European Commission (EC), 2003), 20 μg kg−1 for different feeds in the United States (Food and Agriculture Organization (FAO), 2004), and 10 μg kg−1 in concentrate supplementary feeds and 50 μg kg−1 in feed materials in China (State Administration for Market Regulation, 2017). For AFM1, China, several other Asian countries, and the United States have set a maximum level of 0.5 μg kg−1 in raw milk and dairy products (Food and Drug Adminstration (FDA), 1996; ASEAN, 2015; National Health Commission of the people’s Republic of China, 2017), while a considerably lower level (0.05 μg kg−1) is stipulated in the EU (European Commission (EC), 2006).
Considering the widespread occurrence and intense toxicity, the in vivo kinetics of AFB1 have been attracting more increasing attention. A few of studies have demonstrated that dietary AFB1 is rapidly absorbed into the gastrointestinal tract of different animals and partially transformed to AFM1 in milk for ruminant animals, such as cows and sheep, which are the primary source of AFM1 in milk (Battacone et al., 2003; Zaghini et al., 2005; Corcuera et al., 2012). The rate of dietary AFB1 carry-over as AFM1 in milk ranged from 0.3 to 6.2% for cows (Applebaum et al., 1982; Frobish et al., 1986) and from 1.3 to 2.9% for sheep (Battacone et al., 2005; Battacone et al., 2009). Similarly, the in vivo toxicokinetics of AFB1 have also been studied in different model animals, including rats, mice, and monkeys (Wong and Hsieh, 1980; Bastaki et al., 2010; Corcuera et al., 2012) but not in dairy cow. To date, there is no literature on the distribution of AFB1 in different tissues and organs of dairy cows, which poses potential health risks to consumers. Notably, distinct differences in previous reports about the carry-over rate and in vivo kinetics of AFB1 in various animal species were due to differences in AFB1-delivery types, metabolic pathways, and animal susceptibility. Moreover, outdated detection methods, such as thin-layer chromatography (Stubblefield, 1986) and enzyme-linked immunosorbent assay (Diaz et al., 2004) have occasionally resulted in discrepant and contradictory results in earlier studies owing to complex sample pretreatment, lower sensitivity, and incomplete methodology.
The main objective of this study was to develop and validate an accurate and sensitive ultra-high performance liquid chromatography tandem mass spectrometry (UHPLC-MS/MS) method to analyze the in vivo kinetics and biotransformation of AFB1 in AFB1-contaminated diet. Based on the model of dairy cows, the results will contribute to the understanding of the effects of dietary AFB1 loads on its carry-over in milk, such as AFM1, as well as distribution, and elimination of AFB1 in vivo. The illustration of the kinetics and biotransformation of AFB1 is shown in Supplementary Figure S2.
Materials and Methods
Chemicals and Reagents
Methanol, acetone, and acetonitrile (all HPLC grade) were purchased from Merck (Darmstadt, Germany). Ammonium acetate (HPLC grade) was obtained from Sigma-Aldrich (St. Louis, MO, United States). Water was filtered using a Millipore system (Millipore, Billerica, MA, United States). AFB1 (2.03 μg ml−1), and AFM1 (0.5 μg ml−1) of analytical standard were purchased from Romer Labs (Union, MO, United States).
Preparation of Contaminated Diets
To produce AFB1-contaminated maize, an AFB1-producing strain (Aspergillus flavus 01) was isolated and identified at the mycotoxin research laboratory of Shanghai Academy of Agricultural Sciences, followed by cultivation on maize grains at 28°C for 28 days. The maize culture was then sterilized at 121°C, dried at 40°C for 60 h, and ground into powder. The concentrations of AFB1 in contaminated maize flour and total mixed rations (TMR) feed were accurately determined according to the previously developed UHPLC-MS/MS method (Guo et al., 2017). Subsequently, 8.3 and 83 g of the obtained maize culture containing 240 mg kg−1 AFB1 were blended with 200 g of AFB1-free TMR feed to develop two AFB1 contaminated diets: Diet A, 4 μg kg−1 body weight (b.w.) and Diet B, 40 μg kg−1 b.w. for the animal trials, respectively. After finishing the diets, the animals were fed AFB1-free TMR feed. The control group was directly fed AFB1-free TMR feed.
Animals and Diet Management
Five Holstein dairy lactating cows (b.w. = 500 ± 10 kg, 30–32 weeks of calving) were purchased from Zhangxueping Dairy Farm (Nanjing, China). Before the experiments began, the dairy cows were given feed and water daily for a week for acclimatization. The dairy cows were randomly divided into an experimental group (three cows) and a control group (two cow). TMR feed (20 kg) per cow per day was administered in equal doses at 0,700 h and 1700 h according to the methods of the National Research Council to ensure milk production of ≥10 kg. The feed was divided into small portions and given to the cows several times to ensure that all feed was consumed. The health of all the dairy cows was monitored continuously during the experimental period. This experiment was approved by the Animal Ethics Committee of Shanghai Academy of Agricultural Science (Shanghai, China) (SYXK (Hu) 2015-0007) and Zhuozhou Jierong Bio-Technology Co., Ltd. (Zhuozhou City, Hebei, China) (SYXK (Ji) 2018-003).
Experiment Design and Sample Collection
During the carry-over trial, dairy cows were repeatedly fed with AFB1- contaminated TMR feed (4 μg kg−1 b.w.) or AFB1-free TMR feed for 13 days. All the dairy cows were milked at 0,730 h and 1730 h, and the milk yield was recorded. Milk samples (10 ml) were collected twice daily according to the volume of daily milk production. All milk samples were stored at −20°C until analysis. After a 30-days clearance period, a higher single dose of AFB1 in contaminated TMR feed (40 μg kg−1 b. w.) was administered to the experimental cows. Successive milk samples (10 ml) were collected at 0.5, 1, 3, 6, 9, 24, 36, 48, 72, and 96 h after the administration of AFB1-contaminated diet for further carry-over analysis of AFB1. Simultaneously, 5 ml of blood from each cow was drawn from the caudal vein at 10, 35, 45, 60, 120, 180, 240, 360, 540, 720, 1,440, 2,160, and 2,880 min for the in vivo kinetic study of AFB1. Each blood sample was immediately collected in a heparinized tube and centrifuged at 2,739×g for 15 min. Subsequently, aliquots of plasma were transferred into clean tubes and stored at −20°C until use. After another 30-days clearance period, all the cows were sacrificed 6 h after the oral administration of AFB1 (40 μg kg−1 b.w.). Tissue samples from cows, including heart, liver, spleen, lung, and kidney, were collected and stored in liquid nitrogen until analysis. Blank milk, blood, and tissue samples from the control group were collected to establish the analytical method.
UHPLC-MS/MS Analysis
After thawing at room temperature, 200 µL of milk, plasma, and tissue homogenates, which were homogenized with normal saline (1/3, m/v), were separately transferred into a 2.5-ml centrifuge tube. Acetone (1.4 ml) of was added for protein precipitation and target extraction. The mixtures were blended by vortexing for 30 s and centrifuged at 16,099 ×g for 5 min. Subsequently, 1 ml of the supernatant was evaporated under a soft stream of nitrogen gas at 40°C, and the residues were re-dissolved in 200 µL of acetonitrile/water containing 5 mmol L−1 ammonium acetate (20/80, v/v). The residues were then filtered through a 0.22 μm membrane filter for UHPLC-MS/MS analysis.
UHPLC-MS/MS analysis was performed on a Waters ACQUITY UPLC system coupled with an AB SCIEX Triple Quad TM 5500 mass spectrometer. LC separation was achieved on a Poroshell EC18 column (2.1 × 100 mm, 2.7 μm, Agilent, United States) with methanol (A) and 5 mmol L−1 ammonium acetate (B) as the mobile phase. The flow rate was 0.4 ml min−1 and a total of 8 min of gradient elution procedure was applied as follows: initial 10% A; 0.5 min, 10% A; 1.5 min, 50% A; 5.0 min, 90% A; 6.0 min, 90% A; 6.2 min, 10% A; and 8.0 min, 10% A. The injection volume was 3 μL, and the column temperature was 40°C.
Electrospray ionization was used in positive (ESI+) mode with the following parameters: ion spray voltage, 5500 V; source temperature, 500°C; ion source gas 1 (GS1), 50 psi; ion source gas 2 (GS2), 50 psi; and collision gas (CAD), 8 psi. The multiple reaction monitoring (MRM) mode was used for the quantification and confirmation of AFB1 and AFM1 with the parameters listed in Supplementary Table S1.
Carry-Over Analysis
The carry-over rate of AFB1 to AFM1 was calculated according to the following formula:
The mmilk and mTMR are the milk yield (kg) and quantity of AFB1- contaminated TMR feed (kg) daily, respectively. CAFM1 and CAFB1 are the concentrations of AFM1 in milk (µg kg−1) and AFB1 in the diet (µg kg−1), respectively.
The graphs of concentration–time curves were prepared using Origin 9.0, (La Jolla, CA, United States), which were then used to illustrate the carryover of AFB1 and AFM1 in milk. All data are presented as mean ± standard deviation (SD).
In Vivo Kinetics and Tissue Distribution
After oral administration, in vivo kinetics of AFB1 was performed with DAS 2.0 (Shanghai, China) using non-compartmental analysis. AUC(0-t) and AUC(0-∞) are the areas under the plasma concentration–time curve from time 0–2,160 min and infinity, respectively. MRT(0-t) and MRT(0-∞) are the mean residence times from time 0–2,160 min and infinity, respectively, where T1/2 is the terminal elimination half-life. C0 and Cmax are the initial and maximal plasma concentrations, respectively. Tmax is the time to maximal plasma concentration. All data are presented as mean ± SD.
The concentrations of AFB1 and AFM1 in different tissues from individual dairy cows, including the heart, liver, spleen, lungs, and kidneys were determined.
Method Validation
The analytical method for detecting AFB1 and AFM1 in plasma, milk, and various tissues, such as the heart, liver, spleen, lungs, and kidneys, was validated according to the guidelines on bioanalytical method validation provided by the European Medicines Agency (Blume et al., 2011). Linearity was evaluated in neat solvent and in plasma, milk, and various tissues spiked with AFB1 and AFM1 at concentrations of 0.1–200 ng ml−1. The calibration curves were drawn by plotting responses versus analyte concentrations, and the acceptable criterion of R2 was ≥0.99. The lower limit of quantification (LLOQ) was the lowest concentration point of the calibration curves, which is typically defined as a theoretical signal-to-noise (S/N) ratio of 10. The lower limit of detection (LLOD) was the lowest concentration that could be determined and defined as a theoretical S/N ration of 3. Note that S/N=SD/k, where SD is the standard deviation of the blank (n = 6) and k is the slope of the matrix-matched calibration curve. The recovery and precision were evaluated in blank samples spiked with LLOQ, low, intermediate, and high levels (LLOQ, 1, 50, and 200 ng ml−1 for plasma and milk; LLOQ, 1, 50, and 200 μg kg−1 for various tissues, respectively) of AFB1 and AFM1 in six replicates. RSD values on the same day and on five successive days were used to evaluate the intra- and inter-day precision, respectively. The short-term (room temperature for 8 h) and long-term (-20°C for 20 days) stability of spiked plasma and tissue samples (1 and 50 ng ml−1 for plasma and milk, 1 and 50 μg kg−1 for various tissues), as well as the stability after three freeze–thaw cycles, were evaluated to ensure that the concentrations of AFB1 and AFM1 were not affected. In addition, blank, spiked, and real plasma, milk, and spleen collected after AFB1 oral administration were individually analyzed and evaluated for specificity.
Results and Discussion
Optimization of Extraction Solvent
In the current study, three different solvents (methanol, acetonitrile and acetone) at different extraction volumes (0.6, 1.0, 1.4, and 1.8 ml, respectively) were compared for the spiked milk samples (50 ng ml−1). The extraction efficiency was evaluated according to the following formula:
Extraction efficiency = extraction recovery × matrix effect × 100%
As shown in Supplementary Table S2, the highest extraction efficiency of 77.5 and 89.4% was achieved for AFB1 and AFM1, respectively, when 1.4 ml of acetone was selected. Similar trends were observed for AFB1 and AFM1 in plasma and different tissue samples. Therefore, 1.4 ml of acetone was selected as the extraction solvent for protein precipitation and target extraction.
Method Validation
Good linear relationships were obtained with correlation coefficients (R2) > 0.99 in neat solvent and blank plasma, milk, and tissues (Supplementary Table S3). The LLODs and LLOQs for AFB1 and AFM1 in different matrices were in the range of 0.03–0.2 ng ml−1 (μg kg−1) and 0.1–0.5 ng ml−1 (μg kg−1), respectively. Satisfactory recoveries and precisions for AFB1 and AFM1 at various spiking levels are listed in Table 1. The recoveries ranged from 79.5 to 102.3% for milk; 82.8–107.9% for plasma; 88.7–111.2% for heart; 83.3–109.6% for liver; 86.8–104.8% for spleen; 85.8–103.0% for lung; and 85.1–106.6% for kidney. The intra- and inter-day RSDs were in the range of 3.0–12.3% and 6.8–14.7%, respectively, for various matrices, indicating the acceptable reproducibility of the proposed method. The concentration at each spiking level of all samples after the short-term, long-term, and three freeze–thaw cycle stability tests were in the range of 82.2–102.0% (Supplementary Table S4), which indicated that AFB1 and AFM1 in all the biological matrices were stable. Moreover, no endogenous interference was observed at the respective retention times of AFB1 (5.0 min) and AFM1 (5.5 min) in plasma, milk, and spleen matrices (Figure 1), verifying the good selectivity of this method.
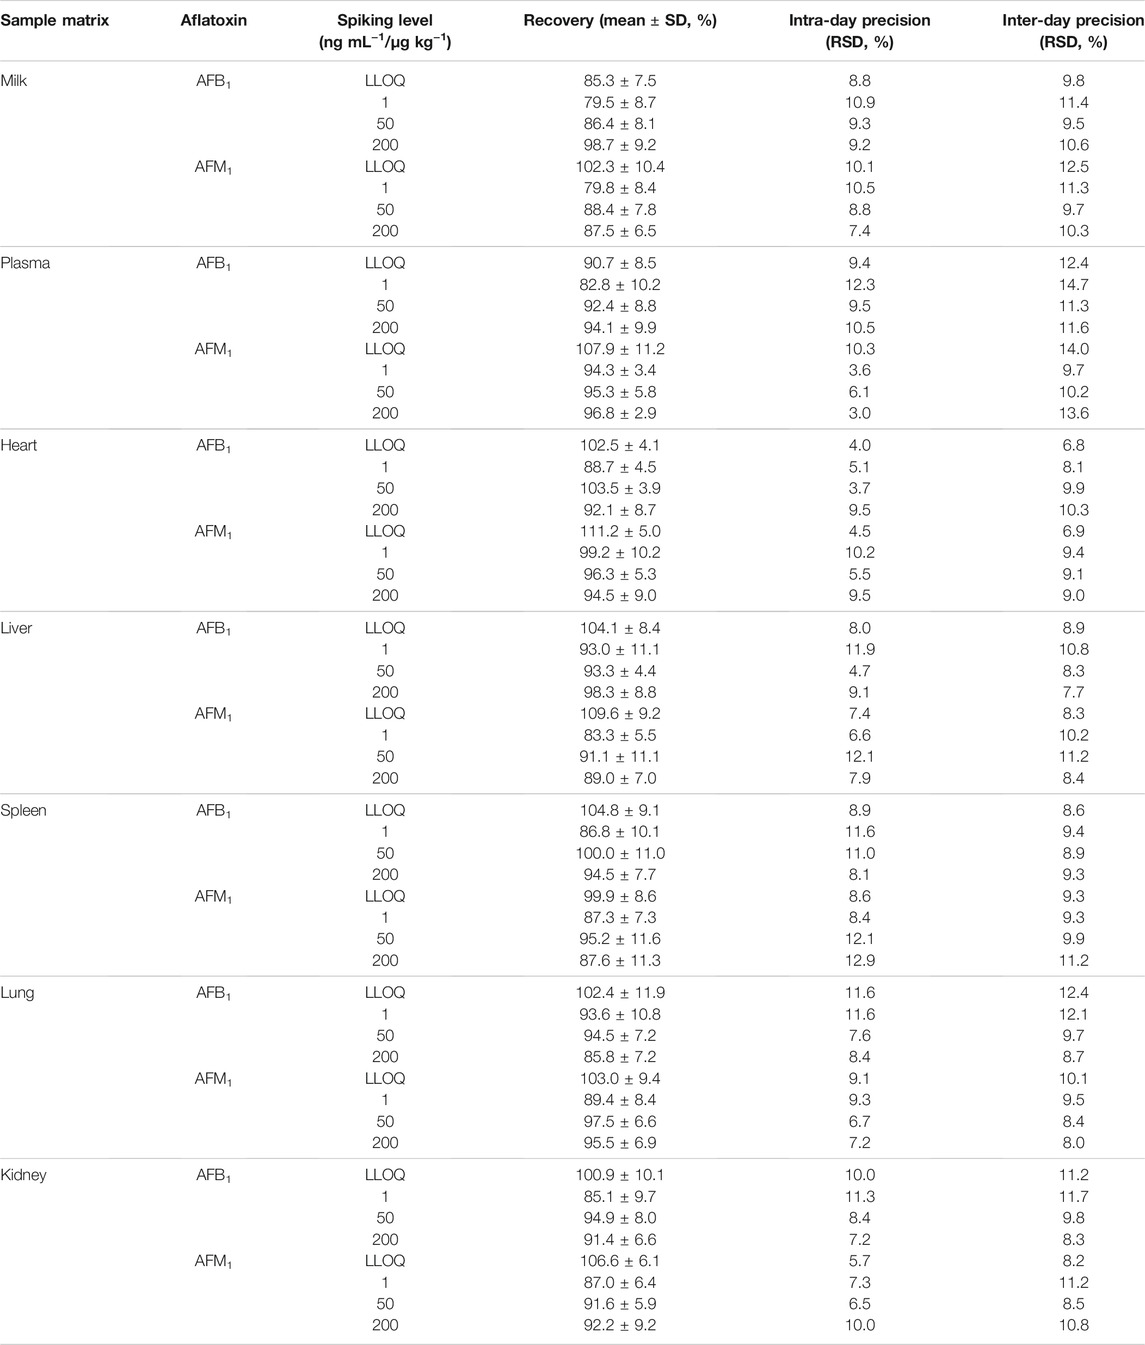
TABLE 1. Recovery and intra- and inter-day precision of AFB1 and AFM1 in milk, plasma, and different tissues (n = 6).
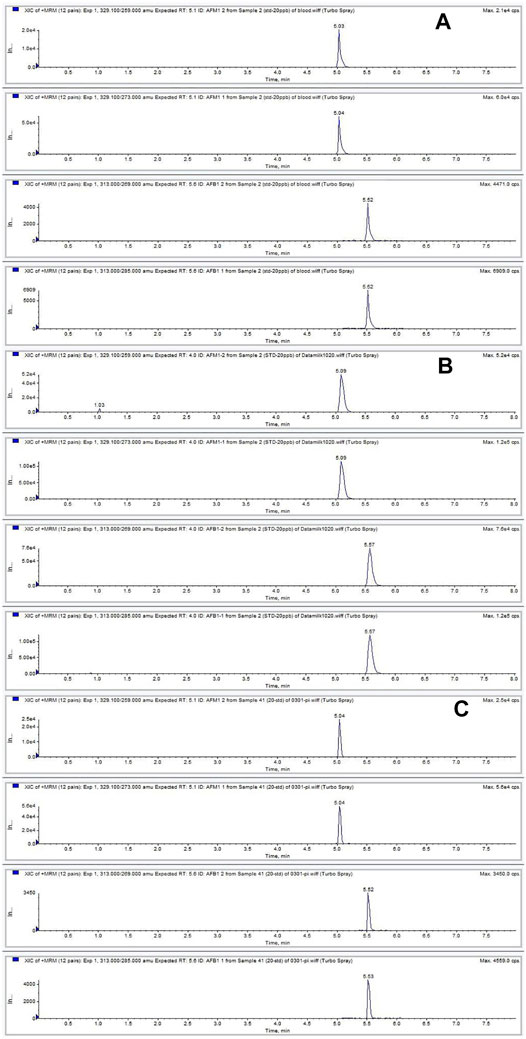
FIGURE 1. Chromatograms of AFB1 and AFM1 detected in plasma (A), milk (B), and spleen (C) contaminated at 20 ng ml−1. The retention times of AFB1 and AFM1 were 5.0 and 5.5 min, respectively.
Carry-Over Rate of AFB1 to AFM1 in Milk
The repetitive ingestion of 4 μg kg−1 b.w. of AFB1 for 13 days (intoxication period) demonstrated that the concentrations of AFM1 in the milk increased rapidly from the first day, with concentrations remaining in the range of 2.6–3.8 μg kg−1 till day 13 (Figure 2A). As presented in Supplementary Table S5, this result was similar to that previously reported in cows that were fed a diet containing ∼ 86 μg AFB1 daily for 7 days (Britzi et al., 2013). After the intoxication period (13 days), the cows were fed AFB1-free feeds, and the milk was collected for 7 days (clearance period). The concentration of AFM1 in milk decreased gradually and could not be detected after 2 days. These results corresponded with those of previous studies that reported the clearance period typically lasted less than 3 days for AFB1 (Diaz et al., 2004). As depicted in Figure 2B, the carry-over rate of AFM1 in milk during the continuous ingestion experiment was in the range of 1.15–2.30% at a steady state, which was consistent with the range of 1–3% that has been reported in previous studies (Diaz et al., 2004; Van Eijkeren et al., 2006; Masoero et al., 2007) (Supplementary Table S5).
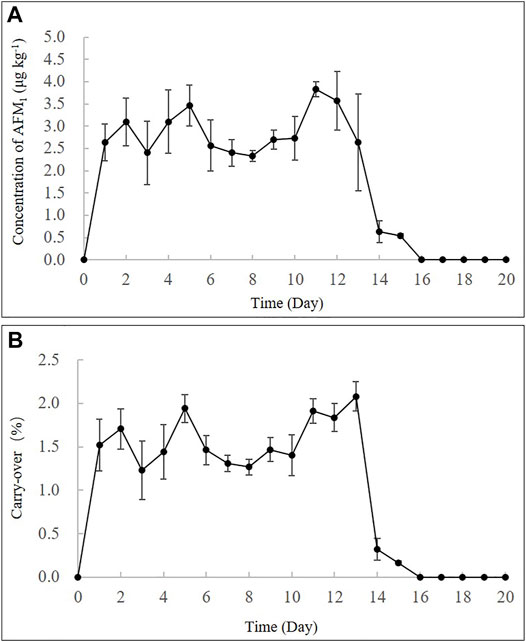
FIGURE 2. Time-concentration profiles (A) and carry-over rate % (B) of AFM1 in milk after continuous ingestion of AFB1 (4 μg kg−1 b.w.) for 13 days.
Furthermore, a high single dose (40 μg kg−1 b.w.) of feed artificially contaminated with AFB1 showed that AFM1 in milk increased rapidly and the highest concentration of AFM1 was observed at 24 h (21.3 ± 2.9 μg kg−1) (Figure 3A). After its plateau, AFM1 concentration decreased rapidly and could not be detected after 96 h. The disappearance pattern of AFM1 in milk is depicted in Figure 3B, and the disappearance of AFM1 in milk can be expressed as:
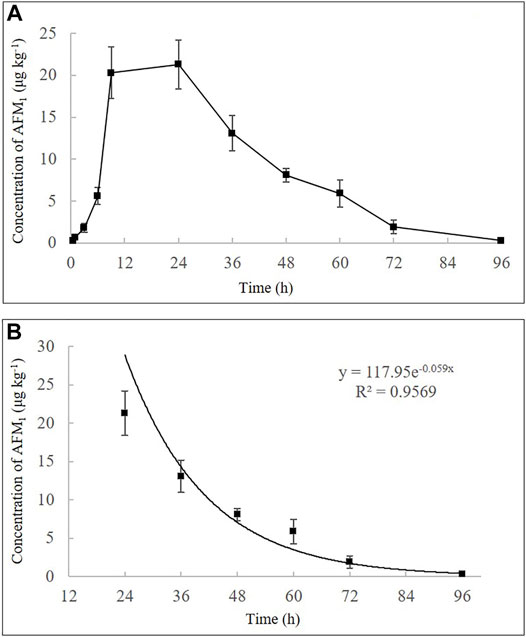
FIGURE 3. Time-concentration profiles of AFM1 in milk after a single oral administration of AFB1 (40 μg kg−1 b.w.) (A) and the disappearance pattern of AFM1 in the milk (B). Values are presented as mean ± standard deviation, n = 3.
In Vivo Kinetics
The concentration–time profiles of AFB1 and AFM1, as well as the toxicokinetic parameters in plasma after a single dose (40 μg kg−1 b.w.) of AFB1 are presented in Figure 4 and Table 2. The results indicated that AFB1 was rapidly absorbed in all studied cows with the highest concentrations (Cmax = 3.8 ± 0.9 ng ml−1) approximately 35.0 ± 10.2 min after oral administration. Meanwhile, AFB1 was rapidly eliminated in cows (T1/2 = 931.1 ± 30.8 min) and transformed into AFM1, which plateaued in the plasma (0.5 ± 0.1 ng ml−1) at 4 h after ingestion. As presented in Supplementary Table S5, the values of the primary kinetic parameters in this study were significantly different from those of other animals, such as rats, mice, monkeys, and broiler chickens (Bastaki et al., 2010; Cui et al., 2017). This can be attributed to many factors, including the differences in AFB1 intake, gastrointestinal absorption, animal health, and particularly in the activity of cytochrome P450 (CYP450) enzymes, which play an important role in the transformation of AFB1 to AFM1 in the liver (Applebaum et al., 1982; Gross-Steinmeyer and Eaton, 2012).
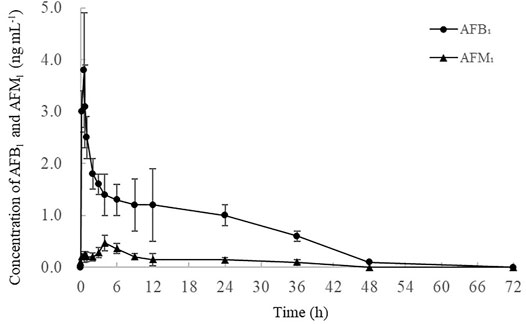
FIGURE 4. Time-concentration profile of AFB1 and AFM1 in the plasma after a single oral administration of AFB1 (40 μg kg−1 b.w.) (n = 3). Values are presented as mean ± standard deviation.
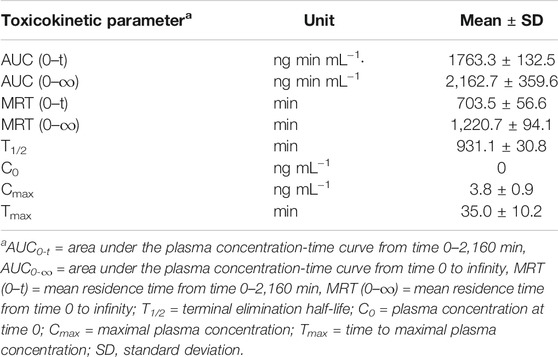
TABLE 2. Primary toxicokinetic parameters of AFB1 after a single oral administration (40 μg kg−1 b.w.) to dairy cows (n = 3).
Tissue Distribution
After a single oral dose of AFB1 (40 μg kg−1 b.w.), all tissues were analyzed via the validated UHPLC-MS/MS method. The concentrations of AFB1 in the heart, spleen, lungs and kidneys were 1.6 ± 0.3, 4.1 ± 1.2, 3.3 ± 0.9 and 5.6 ± 1.4 μg kg−1, respectively. Although the liver is typically considered the most susceptible organ for AFB1, neither aflatoxin was detected in all the live samples. It is likely that AFB1 in the liver was completely cleared because of the time taken between last feed and sacrifice (Corcuera et al., 2012; Cui et al., 2017). Moreover, AFM1 was observed in the spleen and kidneys at concentrations of 0.7 ± 0.2 and 0.8 ± 0.1 μg kg−1, respectively. In summary, these results verified the effects of AFB1 and AFM1 accumulation in different tissues, particularly in the spleen and kidneys, which could pose health risks for both dairy cows and consumers.
Conclusion
An accurate and reliable UHPLC-MS/MS method was established and validated for the simultaneous determination of AFB1 and AFM1 in the plasma, milk, and tissues of dairy cows. And the method was applied to investigate in vivo kinetics and biotransformation of AFB1 in dairy cows. A rapid absorption, distribution, and excretion of AFB1 was observed in dietary cows with relatively high residues detected in kidneys, lungs, heart, and spleen. A certain amount of AFB1 (1.15–2.30%) could also be transformed to AFM1, as another important risk factors and then excreted into milk. This comprehensive study will be of great value in the evaluation and control of AFB1 contamination in feeds to reduce the health risks posed to both humans and animals.
Data Availability Statement
The original contributions presented in the study are included in the article/Supplementary Material, further inquiries can be directed to the corresponding authors.
Ethics Statement
The animal study was reviewed and approved by the Animal Ethics Committee of Shanghai Academy of Agricultural Science (Shanghai, China) (SYXK (Hu) 2015-0007) and Zhuozhou Jierong Bio-Technology Co., Ltd. (Zhuozhou City, Hebei, China) (SYXK (Ji) 2018-003).
Author Contributions
WG and ZF performed the experiments; KF and JM contributed to the sample preparation, and WG wrote the manuscript; DN performed the data processing; ET and ZZ reviewed the manuscript; ZL and ZH conceived and designed the experiments.
Funding
This work was financially supported by the National Key R&D Plan (No. 2017YFC1700806), Shanghai Rising-Star Program (21QB1403300), Science and Technology Innovation Action Plan Project of Shanghai Municipal Commission of Science and Technology (No. 17391901200), and National Natural Science Foundation of China (No. 31972178).
Conflict of Interest
The authors declare that the research was conducted in the absence of any commercial or financial relationships that could be construed as a potential conflict of interest.
Publisher’s Note
All claims expressed in this article are solely those of the authors and do not necessarily represent those of their affiliated organizations, or those of the publisher, the editors and the reviewers. Any product that may be evaluated in this article, orclaim that may be made by its manufacturer, is not guaranteed or endorsed by the publisher.
Supplementary Material
The Supplementary Material for this article can be found online at: https://www.frontiersin.org/articles/10.3389/fchem.2021.809480/full#supplementary-material
References
Applebaum, R. S., Brackett, R. E., Wiseman, D. W., and Marth, E. H. (1982). Responses of Dairy Cows to Dietary Aflatoxin: Feed Intake and Yield, Toxin Content, and Quality of Milk of Cows Treated With Pure and Impure Aflatoxin. J. Dairy Sci. 65, 1503–1508. doi:10.3168/jds.s0022-0302(82)82374-6
ASEAN (2015). Regulatory Limits of Mycotoxins in ASEAN Countries. Jakarta, Indonesia: Food Regulations Commission.
Bastaki, S. A., Osman, N., Kochiyil, J., Shafiullah, M., Padmanabhan, R., and Abdulrazzaq, Y. M. (2010). Toxicokinetics of Aflatoxin in Pregnant Mice. Int. J. Toxicol. 29, 425–431. doi:10.1177/1091581810369565
Battacone, G., Nudda, A., Cannas, A., Borlino, A. C., Bomboi, G., and Pulina, G. (2003). Excretion of Aflatoxin M1 in Milk of Dairy Ewes Treated With Different Doses of Aflatoxin B1. J. Dairy Sci. 86, 2667–2675. doi:10.3168/jds.s0022-0302(03)73862-4
Battacone, G., Nudda, A., Palomba, M., Mazzette, A., and Pulina, G. (2009). The Transfer of Aflatoxin M1 in Milk of Ewes Fed Diet Naturally Contaminated by Aflatoxins and Effect of Inclusion of Dried Yeast Culture in the Diet. J. Dairy Sci. 92, 4997–5004. doi:10.3168/jds.2008-1684
Battacone, G., Nudda, A., Palomba, M., Pascale, M., Nicolussi, P., and Pulina, G. (2005). Transfer of Aflatoxin B1 From Feed to Milk and From Milk to Curd and Whey in Dairy Sheep Fed Artificially Contaminated Concentrates. J. Dairy Sci. 88, 3063–3069. doi:10.3168/jds.s0022-0302(05)72987-8
Battacone, G., Nudda, A., Rassu, S. P. G., Decandia, M., and Pulina, G. (2012). Excretion Pattern of Aflatoxin M1 in Milk of Goats Fed a Single Dose of Aflatoxin B1. J. Dairy Sci. 95, 2656–2661. doi:10.3168/jds.2011-5003
Blume, H., Brendel, E., Brudny-Klöppel, M., Grebe, S., Lausecker, B., Rohde, G., et al. (2011). Workshop/Conference Report on EMA Draft Guideline on Validation of Bioanalytical Methods. Eur. J. Pharm. Sci. 42, 300–305. doi:10.1016/j.ejps.2010.12.008
Britzi, M., Friedman, S., Miron, J., Solomon, R., Cuneah, O., Shimshoni, J., et al. (2013). Carry-Over of Aflatoxin B1 to Aflatoxin M1 in High Yielding Israeli Cows in Mid- and Late-Lactation. Toxins. 5, 173–183. doi:10.3390/toxins5010173
Canestrari, G., Ricci, B., Pizzamiglio, V., Biancardi, A., Piazza, P., Merialdi, G., et al. (2016). Aflatoxin B1 Risk Management in Parmigiano Reggiano Dairy Cow Feed. Ital. J. Food Saf. 5, 5291. doi:10.4081/ijfs.2016.5291
Corcuera, L. A., Vettorazzi, A., Arbillaga, L., González-Peñas, E., and López de Cerain, A. (2012). An Approach to the Toxicity and Toxicokinetics of Aflatoxin B1 and Ochratoxin A After Simultaneous Oral Administration to Fasted F344 Rats. Food Chem. Toxicol. 50, 3440–3446. doi:10.1016/j.fct.2012.06.048
Cui, X., Muhammad, I., Li, R., Jin, H., Guo, Z., Yang, Y., et al. (2017). Development of a UPLC-FLD Method for Detection of Aflatoxin B1 and M1 in Animal Tissue to Study the Effect of Curcumin on Mycotoxin Clearance Rates. Front. Pharmacol. 8, 650. doi:10.3389/fphar.2017.00650
Diaz, D. E., Hagler Jr., W. M., Blackwelder, J. T., Eve, J. A., Hopkins, B. A., Anderson, K. L., et al. (2004). Aflatoxin Binders II: Reduction of Aflatoxin M1 in Milk by Sequestering Agents of Cows Consuming Aflatoxin in Feed. Mycopathologia. 157, 233–241. doi:10.1023/b:myco.0000020587.93872.59
European Commission (EC) (2003). Annex I to Directive 2002/32/EC of 1 Nov 2003 Setting Maximum Levels for Undesirable Substances in Animal Feed. Belgium, Brussels: Official Journal of the European Communities, L285.
European Commission (EC) (2006). Regulation No 1881/2006 of 19 Dec 2006 Setting Maximum Levels for Certain Contaminants in Foodstuffs Official Journal of the European Communities. Brussels: Belgium, L364.
Food and Agriculture Organization (FAO) (2004). Worldwide Regulations for Mycotoxins in Food and Feed in 200-A Compendium. Rome: FAO food and nutrition meetingItaly.
Food and Drug Adminstration (FDA) (1996). Whole Milk, Low Fat Milk, Skim Milk-Aflatoxin M1 (CPG 7106.210) FDA Compliance Policy Guides. Washington, DC: Office of Regulatory Affairs, Center for Food Safety and Applied Nutrition.
Frazzoli, C., Gherardi, P., Saxena, N., Belluzzi, G., and Mantovani, A. (2017). The Hotspot for (Global) One Health in Primary Food Production: Aflatoxin M1 in Dairy Products. Front. Public Health. 4, 294. doi:10.3389/fpubh.2016.00294
Frobish, R. A., Bradley, B. D., Wagner, D. D., Long-Bradley, P. E., and Hairston, H. (1986). Aflatoxin Residues in Milk of Dairy Cows After Ingestion of Naturally Contaminated Grain. J. Food Prot. 49, 781–785. doi:10.4315/0362-028x-49.10.781
Gonçalves, B. L., Gonçalves, J. L., Rosim, R. E., Cappato, L. P., Cruz, A. G. D., Oliveira, C. A. F., et al. (2017). Effects of Different Sources of Saccharomyces cerevisiae Biomass on Milk Production, Composition, and Aflatoxin M1 Excretion in Milk from Dairy Cows Fed Aflatoxin B1. J. Dairy Sci. 100, 5701–5708. doi:10.3168/jds.2016-12215
Gross-Steinmeyer, K., and Eaton, D. L. (2012). Dietary Modulation of the Biotransformation and Genotoxicity of Aflatoxin B1. Toxicology. 299, 69–79. doi:10.1016/j.tox.2012.05.016
Guo, W., Wu, L., Fan, K., Nie, D., He, W., Yang, J., et al. (2017). Reduced Graphene Oxide-Gold Nanoparticle Nanoframework as a Highly Selective Separation Material for Aflatoxins. Sci. Rep. 7, 14484. doi:10.1038/s41598-017-15210-1
Global Health (2012). IARC Chemical Agents and Related Occupations, A Review of Human Carcinogens. IARC Monogr. Eval. Carcinogenic Risks Humans. 100, 9–567.
Han, R. W., Zheng, N., Wang, J. Q., Zhen, Y. P., Xu, X. M., and Li, S. L. (2013). Survey of Aflatoxin in Dairy Cow Feed and Raw Milk in China. Food Control. 34, 35–39. doi:10.1016/j.foodcont.2013.04.008
Iqbal, M., Mazhar, A., Adil, M., Arif, N., and Ahmad, I. (2019). Aflatoxins Biosynthesis, Toxicity and Intervention Strategies: A Review. Chem. Int. 5, 168–191. doi:10.2139/ssrn.3407341
Kumar, P., Mahato, D. K. K., Kamle, M., Mohanta, T. K. K., and Kang, S. G. G. (2016). Aflatoxins: A Global Concern for Food Safety, Human Health and Their Management. Front. Microbiol. 7, 2170. doi:10.3389/fmicb.2016.02170
Masoero, F., Gallo, A., Moschini, M., Piva, G., and Diaz, D. (2007). Carryover of Aflatoxin From Feed to Milk in Dairy Cows With Low or High Somatic Cell Counts. Animal. 1, 1344–1350. doi:10.1017/s1751731107000663
National Health Commission of the people's Republic of China (2017). National Food Safety Standard for Limit of Mycotoxins in Food: GB 2761-2017. Beijing, China: Standards Press of China.
Natour, R. M., Rabba, J. A., Nowar, M. S., Salhab, A., and Mahasneh, A. (1991). Incidence and Level of Aflatoxin M1 in Liquid and Imported Powdered Milk in Jordan With Special Reference to Aflatoxin B1 in Corresponding Feeds. Environ. Sci. Res. 42, 205–216. doi:10.1007/978-1-4615-3282-8_16
Ostry, V., Malir, F., Toman, J., and Grosse, Y. (2017). Mycotoxins as Human Carcinogens-The IARC Monographs Classification. Mycotoxin Res. 33, 65–73. doi:10.1007/s12550-016-0265-7
State Administration for Market Regulation (2017). Hygienical Standard for Feeds:GB 13078-2017. Beijing, China: Standards Press of China.
Stubblefield, R. D. (1986). Thin-layer and High Performance Liquid Chromatographic Methods for the Analysis of Aflatoxins in Animal Tissues and Fluids. Diagn. Mycotoxicoses. 33, 257–269. doi:10.1007/978-94-009-4235-6_22
Sumantri, I., Murti, T. W., Van, d. P., Boehm, J., and Agus, A. (2012). Carry-Over of Aflatoxin B1-Feed into Aflatoxin M1-Milk in Dairy Cows Treated With Natural Sources of Aflatoxin and Bentonite. J. Indonesian Trop. Anim. Agric. 37, 271–277. doi:10.14710/jitaa.37.4.271-277
Van Eijkeren, J. C. H., Bakker, M. I., and Zeilmaker, M. J. (2006). A Simple Steady-State Model for Carry-Over of Aflatoxins From Feed to Cow's Milk. Food Additives and Contaminants. 23, 833–838. doi:10.1080/02652030600779890
Wong, Z. A., and Hsieh, D. P. H. (1980). The Comparative Metabolism and Toxicokinetics of Aflatoxin B1 in the Monkey, Rat, and Mouse. Toxicol. Appl. Pharmacol. 55, 115–125. doi:10.1016/0041-008x(80)90227-6
Keywords: aflatoxins, in vivo kinetics, biotransformation, dairy cow, UHPLC-MS/MS
Citation: Guo W, Fan Z, Fan K, Meng J, Nie D, Tangni EK, Li Z, Zhao Z and Han Z (2021) In Vivo Kinetics and Biotransformation of Aflatoxin B1 in Dairy Cows Based on the Establishment of a Reliable UHPLC-MS/MS Method. Front. Chem. 9:809480. doi: 10.3389/fchem.2021.809480
Received: 05 November 2021; Accepted: 02 December 2021;
Published: 24 December 2021.
Edited by:
Vinoth Kumar Ponnusamy, Kaohsiung Medical University, TaiwanReviewed by:
Swapnil Gurrani, Kaohsiung Medical University, TaiwanKui Zhu, China Agricultural University, China
Copyright © 2021 Guo, Fan, Fan, Meng, Nie, Tangni, Li, Zhao and Han. This is an open-access article distributed under the terms of the Creative Commons Attribution License (CC BY). The use, distribution or reproduction in other forums is permitted, provided the original author(s) and the copyright owner(s) are credited and that the original publication in this journal is cited, in accordance with accepted academic practice. No use, distribution or reproduction is permitted which does not comply with these terms.
*Correspondence: Zenghe Li, bGl6aEBtYWlsLmJ1Y3QuZWR1LmNu; Zheng Han, aGFuemhlbmdAc2Fhcy5zaC5jbg==