 Liping Kang
 Yan Zhang1
 Jian Yang
 Lanping Guo
- 1State Key Laboratory of Dao-di Herbs Breeding Base, Joint Laboratory of Infinitus (China) Herbs Quality Research, National Resource Center for Chinese Materia Medica, China Academy of Chinese Medical Sciences, Beijing, China
- 2Beijing CACMS-NRC Herbs Testing and Authentication Co., Ltd., Beijing, China
- 3North China University of Science and Technology Affiliated Hospital, Tangshan, China
- 4Infinitus (China) Company Ltd., Guangzhou, China
Morindae officinalis Radix (MOR) is a famous traditional Chinese medicine (TCM) and functional food material for invigorating kidneys and tonifying yang. Processed Morindae officinalis Radix (PMOR) is obtained by steaming MOR. Traditionally, the clinical effects are discrepant between processing and nonprocessing herbal medicines. MOR and PMOR are commonly used in both clinical practice and dietary supplements, and the effect of invigorating kidneys and tonifying yang of PMOR is stronger than MOR. To clarify the overall chemical composition and the difference of MOR and PMOR, a method was developed with an ultrahigh-performance liquid chromatography coupled with quadrupole time-of-flight mass spectrometry (UHPLC-Q-TOF/MS). Among the 110 identified components shared by MOR and PMOR, 55 compounds showed significant differences in contents. Among them, the contents of 29 components, including fructooligosaccharides, monotropein, deacetylasperulosidic acid, geniposide, and anthraquinone glycosides, were higher in MOR than in PMOR; the contents of 26 components, including difructose anhydride sucrose, and iridoid glycoside derivatives, were higher in PMOR than in MOR. Difructose anhydrides and iridoid glycoside derivatives were first discovered in PMOR. These results provided a scientific basis for research on the therapeutic material basis of MOR. It would provide a method for the comparison of processing and nonprocessing in Chinese medicines.
1 Introduction
Morindae officinalis Radix (MOR), the dried root of Morinda officinalis How, is a kind of Chinese herbal medicine widely cultivated in Guangdong, Guangxi, and Fujian provinces of China. MOR is the resource used as both medicine and functional food material with a long history in China. MOR has the effects of invigorating kidneys, tonifying yang, and strengthening bones, and it is used to treat impotence (Zhang, et al., 2018), osteoporosis (He et al., 2019), rheumatoid arthritis (Choi et al., 2005; Zhang et al., 2020), and depression (Cheng et al., 2017). Modern research has reported that MOR has the effects of enhancing immunity, providing antistress and cardiovascular protection, and regulating gut microbiota (Qiu et al., 2016). Processing of TCM is a unique traditional pharmaceutical technique in Chinese medicine. The curative effect of TCM can be improved through processing, the toxic and side effects of the medicine can be eliminated or reduced, the properties and flavor of the medicine can be changed, and new medicinal effects can be produced. Steaming is one of the most common processing methods (Pharmacopoeia of the People’s Republic of China, 2020; Cheng et al., 2019). Processed Morindae officinalis Radix (PMOR) is obtained by steaming MOR. Traditionally, it has been thought that the effect of invigorating kidneys by PMOR is stronger than MOR (Cui et al., 2013), but the change in chemical composition of MOR before and after steaming is not clear. The main components of MOR are polysaccharides, oligosaccharides, iridoid glycosides, anthraquinones, etc. (Wang et al., 1992; Hao et al., 2019; Wang et al., 2019). A report showed that MOR contains a large amount of fructooligosaccharide (GFn, n ≦ 12) (Hao et al., 2019). The antidepressant effect of MOR may be related to the effect of oligosaccharides on intestinal flora (Burokas et al., 2017). At present, no systematic research report is available in the overall chemical composition and difference between MOR and PMOR. Because of its high resolution and accurate ion mass value, UHPLC-Q-TOF/MS, as a powerful qualitative and quantitative analysis method, has been increasingly used in the analysis of the chemical composition of complex systems, such as botanical medicines (Xu et al., 2018).
To clarify the overall chemical composition and the difference of MOR and PMOR, methods were developed with UHPLC-Q-TOF/MS combined with multivariate statistical analysis methods, such as principal component analysis (PCA) and orthogonal partial least-squares discriminant analysis (OPLS-DA) to systematically study the overall chemical composition in MOR and PMOR, and clarify the similarities and differences in the composition of MOR and PMOR. It was expected to provide a material basis for research on the therapeutics of MOR and PMOR, and provide a potentially useful method for other processed and nonprocessed Chinese medicines.
2 Materials and Methods
2.1 Chemicals, Reagents, and Herbal Materials
Methanol and acetonitrile (HPLC grade) were purchased from Fisher Scientific Co. (Loughborough, United Kingdom). Ammonia (HPLC grade) was purchased from Merck KGaA (Darmstadt, Germany). Formic acid (HPLC grade) was purchased from Sigma-Aldrich (St. Louis, MO, United States). Deionized water (18.2 MΩ) was further purified using a Milli-Q system (Millipore, MA, United States). Sucrose, 1-kestose (GF2), nystose (GF3), and 1F-fructofuranosylnyslose (GF4) were purchased from the National Institutes for Food and Drug Control, China. GF5, GF6, GF, GF8, and GF9 were purchased from Chengdu Must Bio-Technology Co., Ltd., Sichuan Province, China. Deacetylasperulosidic acid methylester, asperuloside, physcion, 1,8-dihydroxyanthraquinone, 1-hydroxy-2-methylanthraquinone, rhein, emodin, purpuri, rubiadin, shanzhiside methylester, and apigenin were purchased from Beijing Rongcheng Xinde Technology Development Co., Ltd. Monotropein, deacetylasperulosidic acid (DAA), luteolin, cynaroside, alizarin, and aloeemodin were purchased from Shanghai Yuanye Biotechnology Co., Ltd. The purities of reference substances were all HPLC ≥ 98%. GF10 (69.4% GF10, 9.5% GF9, 17.6% GF11, and 2.7% GF12) and GF11 (75.2% GF11, 16.1% GF10, and 4.1% GF12) were purchased from elicityl-oligotech.com (France). The other reagents were obtained in analytical grade.
MOR and PMOR samples were collected from Guangxi, Fujian, and Guangdong provinces as well as the domestic mainstream Chinese herbal medicine market, with a total of 73 batches, including 41 batches of MOR (wood core removed) and 32 batches of PMOR. MOR and PMOR samples were identified as the rhizome of Morindae officinalis How by Prof. Jinda Hao (China Academy of Chinese Medical Sciences), and the voucher specimens were deposited in the National Resource Center for Chinese Materia Medica (Beijing).
2.2 Sample Preparation
Each sample was freeze dried, crushed into powder with a conventional ball mill (Retsch MM400, GmbH, Haan, Germany), and sifted through a 40-mesh screen. The powder for each sample was weighed at 100 mg (Mettler, Switzerland) and suspended in 2 ml of 70% (v/v) aqueous methanol. Then the extract solution was ultrasonically extracted (KQ-100DE ultrasonic cleaner, Kunshan Ultrasonic Instrument Co., Ltd.) at a 40-kHz frequency for 30 min at room temperature. The extraction was centrifuged at 12,000 rpm for 10 min with a centrifuge (5810R, Eppendorf, Germany). The supernatant was collected and filtered through a 0.22-μm syringe filter (Pall, United States). Each sample solution was stored at room temperature for analysis. The mixed MOR and PMOR extract was the control sample.
2.3 Instruments
The UHPLC separation for secondary metabolites was performed using a Waters Acquity UPLC-I-Class system (Waters Corp., Milford, MA, United States) with an Acquity BEH column (100 mm × 2.1 mm, 1.7 μm) for chromatographic separation. The column temperature was set at 40°C, and the flow rate was 500 μl/min. Mobile phase A consisted of a 0.1% formic acid in acetonitrile, and mobile phase B was 0.1% formic acid aqueous solution. The gradient elution program was as follows: 0–0.2 min, 2.0%→2.0% A; 0.2–0.5 min, 2.0%→5.0% A; 0.5–4.5 min, 5.0%→16.0% A; 4.5–10.0 min, 16.0%→36.0% A; 10.0–14.0 min, 36.0%→40.0% A; 14.0–15.5 min, 40.0%→55.0% A; 15.5–21.5 min, 55.0%→63.0% A; 21.5–22.0 min, 63.0%→98.0% A. The sample injection volume was 5.0 μl.
The UHPLC separation for sugars was performed using a Waters Acquity UPLC-I-Class system (Waters Corp., Milford, MA, United States) with an Acquity BEH amide column (100 mm × 2.1 mm, 1.7 μm) for chromatographic separation. The column temperature was set at 40°C, and the flow rate was 200 μl/min. Mobile phase A consisted of a 0.1% ammonium hydroxide in acetonitrile, and mobile phase B was 0.1% ammonium hydroxide aqueous solution. The gradient elution program was as follows: 0–0.5 min, 98% A; 0.5–0.2 min, 98%→89% A; 2.0–2.5 min, 89%→86% A; 2.5–5.5 min, 86%→80% A; 5.5–6.5 min, 80%→73% A; 6.5–9.5 min, 73%→63% A; 9.5–14 min, 50%→50% A; 14–16 min, 50% A; 16.0–16.5 min, 50.0%→98.0% A; 16.6–20.0 min, 98.0% A. The sample injection volume was 1.0 μl.
The TOF MS experiments were performed using a Xevo G2-S Q-TOF MS system (Waters Corp., Milford, MA, United States) in both the ESI (+) and ESI (−) ionization modes. The data acquisition modes were MSE continuum. The source and desolvation temperatures were 100°C and 450°C, respectively, and the desolvation gas flow rate was 900 L/h. The capillary voltages were 0.5 and 2 kV for the ESI (+) and ESI (−) experiments, respectively. The cone voltage was 40 V. The collision energy was set as 6 eV (trap) for the low-energy scans, and as 20–50 eV ramps in high-energy scans. The data acquisition range was 50–2,500 Da. The mass accuracy was maintained using a lock spray with leucine enkephalin (200 pg/μl) as the reference [m/z 556.2766 ESI (+) and 554.2620 ESI (–)].
2.4 Data Processing and Multivariate Analysis
The instrument was controlled by the Masslynx 4.1 software (Waters Corp., Milford, MA, United States). All the MSE continuum data were processed using the apex peak detection and alignment algorithms in UNIFI 1.8 (Waters Corp., Milford, United States). This processing procedure enables related ions (quasimolecular ion peaks, salt adduct ions, and dehydration fragment ions) to be analyzed as a single entity. Both the TCM library and an inhouse library were employed to characterize the metabolites. All the MSE centroid data were processed using Progenesis QI V2.0 (Waters Corp., Milford, United States). Multiple adduct ions, including [M−H]−, [M+HCOO]−, [M+Cl]−, [2M−H]−, [2M+HCOO]−, [M−2H]2−, [M−H+HCOO]2−, and [M−3H]3−, were selected or self-edited to remove redundant adduct ion species. The data of apex peak detection and alignment algorithms were processed in Progenesis QI. The intensity of each ion was normalized by the total ion count to generate a marker consisting of m/z value, normalized peak area, and the retention time. The normalized peak areas and peak ID (RT and m/z pair) were exported to the EZinfo 3.0 software (Waters Corporation, Milford, MA, United States) for multivariate analysis. Analysis methods of PCA and OPLS-DA were used to analyze the main difference components between MOR and PMOR.
3 Results and Discussion
3.1 Optimization of Operating Conditions
To better characterize the primary and secondary metabolites of MOR and PMOR, the UHPLC-Q-TOF/MS operating conditions were optimized. Base peak ion chromatograms of MOR and PMOR are shown in Figure 1. The Acquity UPLC BEH Amide C18 column could effectively separate fructose, glucose, sucrose, and GF2–GF21 in PMOR (Figure 1A) and MOR (Figure 1B), but it could not well characterize the secondary metabolites in MOR and PMOR. The addition of 0.1% aqueous ammonia helped improve the peak shapes and the resolution. The Acquity UPLC BEH C18 column could effectively separate the components other than sugars in PMOR (Figure 1C) and MOR (Figure 1D). The addition of 0.1% formic acid helped improve the peak shapes and the detection and identification of glycosides. In this study, these two chromatographic separation methods were combined to comprehensively characterize the chemical components of MOR and PMOR, and to find and identify the main compositional differences between these two substances. In the negative ion mode, the responses of sugars and iridoids were better, while in the positive ion mode, the anthraquinone components exhibited rich signals, and so the positive and negative ion modes were selected for UHPLC-Q-TOF/MS data collection.
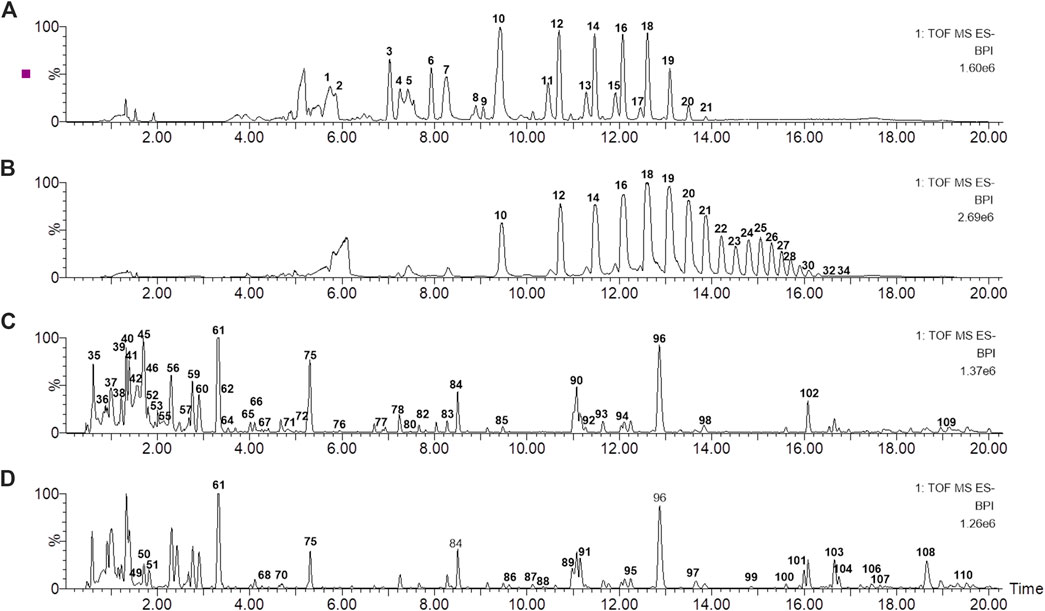
FIGURE 1. Base peak ion chromatograms of processed Morindae officinalis Radix (PMOR) (A,C) and Morindae officinalis Radix (MOR) (B,D) analyzed by ultrahigh-performance liquid chromatography coupled with quadrupole time-of-flight mass spectrometry (UHPLC-Q-TOF MS) in the negative ion mode. (A,B) were analyzed with an Acquity BEH amide column; (C,D) were analyzed with an Acquity BEH column.
3.2 Analysis of the Main Compositional Differences Between Morindae officinalis Radix and Processed Morindae officinalis Radix
The results showed that the chemical compositions of MOR and PMOR were significantly different (Figure 1). The chromatographic peaks of sugars with a higher degree of polymerization, especially the oligosaccharides (GFn, n > 8), were considerably reduced or almost disappeared, but between 6.8 and 9.2 min, new chromatographic peaks were observed, suggesting that new chemical components were generated in PMOR (Figures 1A,B); In Figures 1C,D, it revealed that a significant difference in the strong polar components, with a retention time of less than 3.0 min, and the chromatograms, after the retention time of 3.0 min, were roughly similar in MOR and PMOR.
The UHPLC-Q-TOF MS data were processed by Progenesis QI, and the obtained two-dimensional dataset was input into EZinfo software for multivariate statistical analysis. The results of PCA revealed that the samples within each group of MOR and PMOR were clustered into one group (Figure 2A), and the classification between the two groups was obvious, indicating that the chemical compositions of different batches of samples in each group were relatively similar, and the difference in chemical composition between two group samples was large. To find the markers with high contribution to the difference between MOR and PMOR by OPLS-DA, the result is shown in the S-Plot (Figure 2B). In Figure 2B, it showed that each point represented a marker composed of accurate mass and retention time. The farther the point was from the center, the greater the contribution to the difference between the two groups. The value of VIP (variable importance plot) displays the relative influence that each of the predictors (x variables) has on all the responses combined, from the most to the least influential. The data points with scores of VIP ≥5.0 (red data points in Figure 2B) were selected for analysis of the chemical components that differ greatly between the two groups of samples. The retention times, m/z, and fold change of these data points are shown in Figures 2C,D. In Figure 2C, it indicates the compounds with a higher content in MOR than in PMOR. In Figure 2D, it shows the compounds with a higher content in PMOR than in MOR. According to the retention time and the mass spectrum information of molecular ion peaks, fragment ion, or neutral loss, it was preliminarily concluded that these components with large differences in content were sugars, iridoid glycosides, and anthraquinone glycosides. By identifying these compounds, the structures of the main different compounds whose content differs the most between MOR and PMOR could be determined (Tables 1, 2).
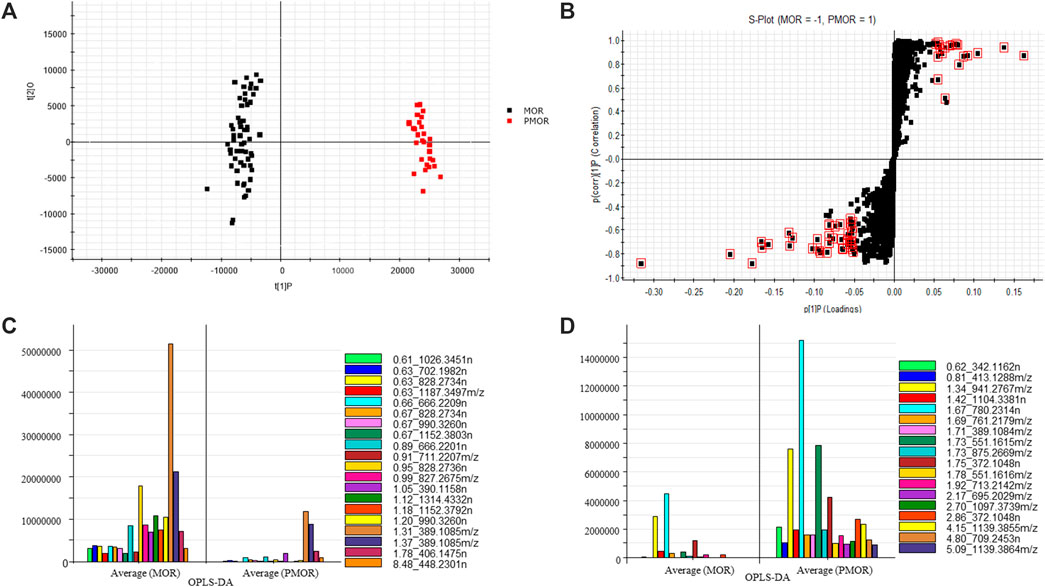
FIGURE 2. Selected potential chemical markers from MOR and PMOR based on principal component analysis (PCA) and orthogonal partial least-squares discriminant analysis (OPLS-DA) (in the negative ion mode with an Acquity BEH column). (A) PCA score plot; (B) S-plot, the compounds with large differences in content (which is marked in red squares) between MOR and PMOR; (C) the selected chemical markers with content in MOR that is higher than that in PMOR; (D) the selected chemical markers with content in PMOR that is higher than that in MOR.
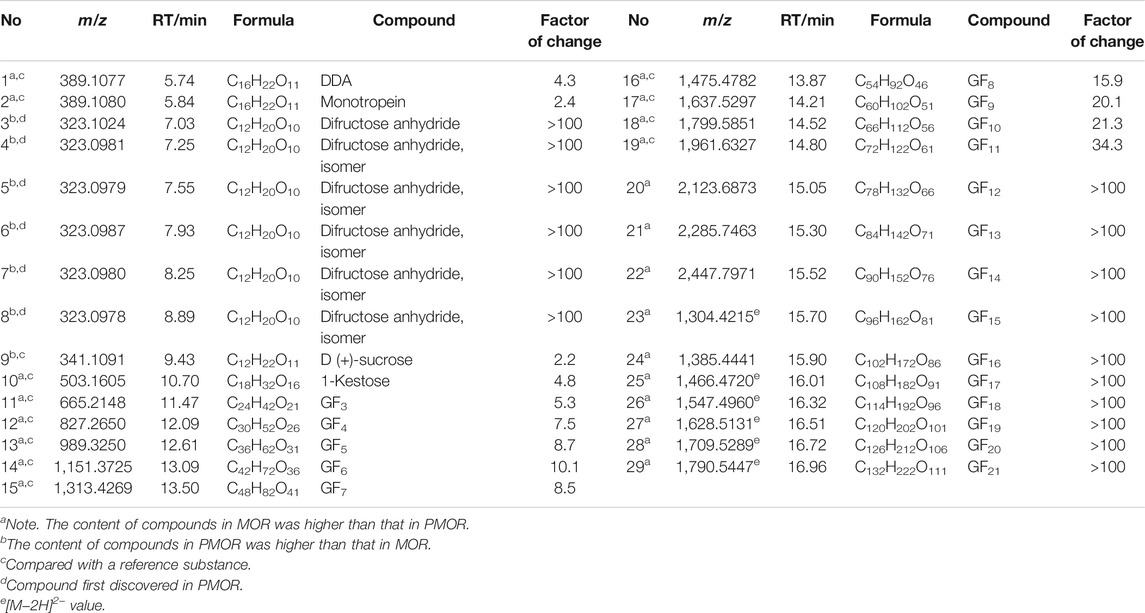
TABLE 1. Chemical components with larger difference in content between the samples of MOR and PMOR (Acquity BEH amide column).
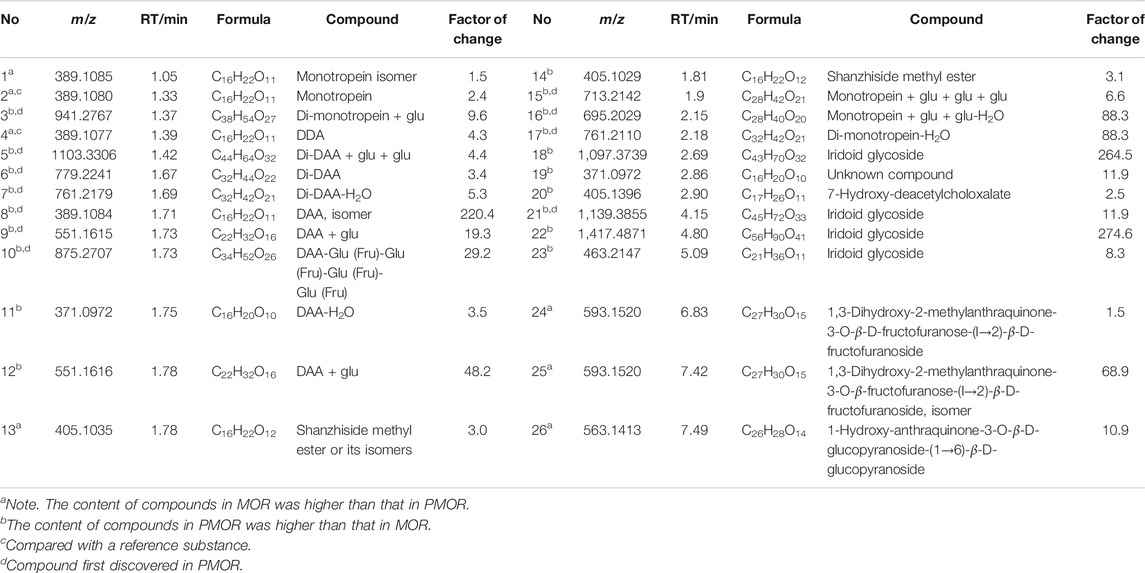
TABLE 2. Chemical components with larger difference in content between the samples of MOR and PMOR (Acquity BEH column).
3.3 Identification of the Main Different Components
3.3.1 Identification of Sugars
By comparing the retention time and fragment ion information with those of the reference substances, the structures of 31 sugars, including difructose anhydrides (DFAs), sucrose, GF2–GF21, and isomers of GF2–GF5, were determined (Supplementary Table S1). Peak 3 in Figure 1A is an example to educate about the fragmentation pathway of DFAs. In the low-energy negative ion mass spectrum (Figure 3A), the ions of m/z 323.1024 [M‒H]−, 369.1101 [M+HCOO]−, 647.2020 [2M‒H]−, 693.2062 [2M+HCOO]−, and 971.2999 [3M‒H]− were observed, indicating that the molecular formula was C12H20O10. In the high-energy mass spectrum (Figure 3B), the fragment ions of m/z 179.0615, 161.0511, and 113.0304 were found, suggesting the structure of a DFA compound. Similarly, the other six DFA compounds could be identified separately, and the results are shown in Supplementary Table S1.
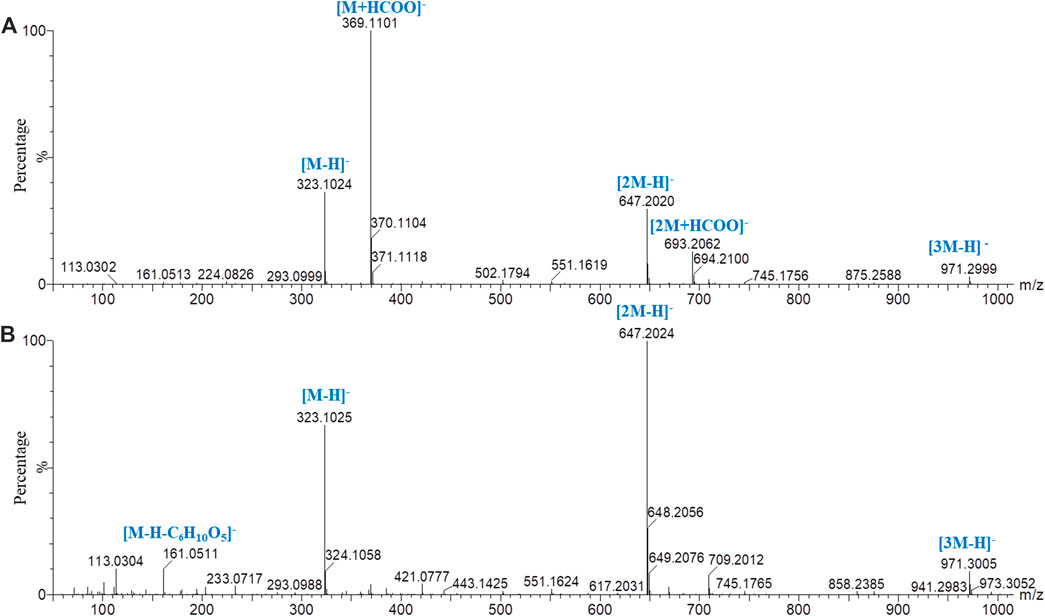
FIGURE 3. Mass spectrometry of peak 3 in PMOR in negative ion mode with chromatographic condition 2. (A) Low-energy mass spectrometry; (B) high-energy mass spectrometry.
For oligosaccharides with molecular mass greater than 2,500 Da, although the [M‒H]‒ and characteristic fragment m/z greater than 2,500 Da could not be accurately detected, the characteristic fragment ions of [M‒2H]2− and [M‒3H]3− could be accurately detected in low-energy mass spectrometry for the reference substance of GFn (n ˃ 5). Therefore, the oligosaccharides with molecular mass greater than 2,500 Da could be detected and identified. With peak 23 as an example, the fragmentation pathway was studied. In the low-energy negative ion mass spectrum (Figure 4A), the ions of m/z 1,799.5851 [M‒H]‒, 899.2849 [M‒2H]2‒, and 599.2222 [M‒3H]3‒ were observed, indicating a molecular formula of C66H112O56. In the high-energy mass spectrum (Figure 4B), a series of fragment ions sequentially lost the fragment of C6H10O5, suggesting that the compound was composed of 11 hexoses (GF10).
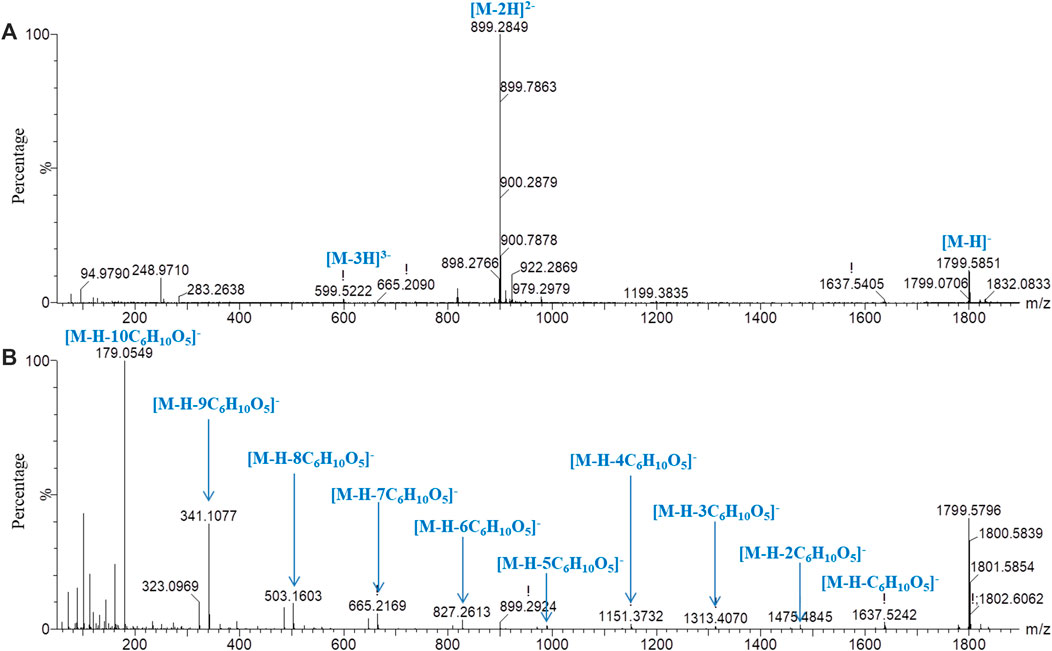
FIGURE 4. Mass spectrometry of peak 23 in negative ion mode with chromatographic condition 2. (A) Low-energy mass spectrometry; (B) high-energy mass spectrometry.
Similarly, the structures of the other sugars could be identified, and the results are shown in Supplementary Table S1.
The results revealed that the contents of GFn (n = 2–21) were higher in MOR than in PMOR, whereas the contents of DFAs and sucrose were higher in PMOR than in MOR. DFAs have a variety of physiological functions, such as enhancing immunity and diuresis and promoting calcium absorption (Mellet and García Fernández, 2010). DFAs are the main components of medicines and certain functional foods (Cheng et al., 2021). The effect of invigorating kidneys and tonifying yang of PMOR may be related to the increased DFA content. Because of the different physiological activities of DFAs of different configurations, further research is needed to determine the exact configurations of DFAs in PMOR.
3.3.2 Identification of Iridoids
Iridoids and their glycosides are the main terpenoids with a cyclopentenoid structure in MOR, and their mass fragment ions are mostly produced after the parent ion has lost its substituents (Li et al., 2008; Wu et al., 2013). Monotropein and DAA are the main iridoid glycosides in MOR. They are isomers that differ structurally in the position of the cyclopentene double bond and the positions of the −OH substituents with the formula C16H22O11. It was effective for separating monotropein and DAA in MOR and PMOR with an Acquity BEH column (Figures 1C,D). In the mass spectrum in low-energy negative, monotropein and DAA showed the quasimolecular ion peaks of m/z 389.1080 [M‒H]−, 425.0844 [M+Cl]−, 435.1136 [M+HCOO]−, and 779.2240 [2M‒H]−. In the mass spectrum in high-energy negative ion, a series of fragment ions of m/z 227.0552, 209.0448, 191.0341, 183.0655, 165.0533, 147.0448, 137.0601, and 135.0449 were found indicating that the molecular ion lost a glycosyl group, H2O, CO2, and CO, and glucose, and its fragment ions of m/z 179.0358, 161.0443, 101.0273, and 71.0128 were also observed (Figure 5). Although the fragment ions of the two compounds were almost identical, their abundance ratios of m/z 227.0552, 209.0448, 191.0341, 183.0655, and 165.0553 were significantly different. In monotropein, the abundance ratio of these five ions was 1:0.2:1.5:0.1:0.8, the signal of m/z 191.0341 was strong, and the signals of m/z 209.0448 and 183.0636 were weak. In DAA, the abundance ratio of the five ions was 1:1.8:0.1:1.5:2.2, the signal of m/z 191.0341 was weak, and the signals of m/z 209.0444 and 183.0655 were strong. The results of the two compounds were just the opposite. According to the characteristics of the abundance ratios of these ions, the corresponding derivatives of monotropein and DAA could be identified. Take peak 47 as an example to analyze the structure identification process. In the high-energy negative ion mode, m/z 875.2709, 713.2138, 551.1614, 389.1075, and 227.0552 corresponded to the [M − H]− ion and the ions after the losses of four consecutive C6H10O5 groups, respectively; m/z 227.0552, 209.0435, 191.0318, 183.0647, and 165.0542 were characteristic fragment ions of iridoids, and the abundance ratio was 1:1.4:0.1:1.5:2.2 (Figure 6). The compound was determined to be the derivative of DAA and identified as DAA-Glu (Fru)-Glu (Fru)-Glu (Fru)-Glu (Fru), which was a new compound in PMOR. In the same way, according to the fragment ions and their abundance ratio under high energy, peaks 40, 47, 52, 54, and 55 were determined to be the derivatives of monotropein; peaks 42, 43, 44, 45, 46, 48, and 49 were the derivatives of DAA. The identification results for iridoid components are listed in Supplementary Table S2. Results showed that the contents of iridoids, including monotropein and DAA, were higher in MOR than in PMOR; the content of iridoid glycoside derivatives was higher in PMOR than in MOR.
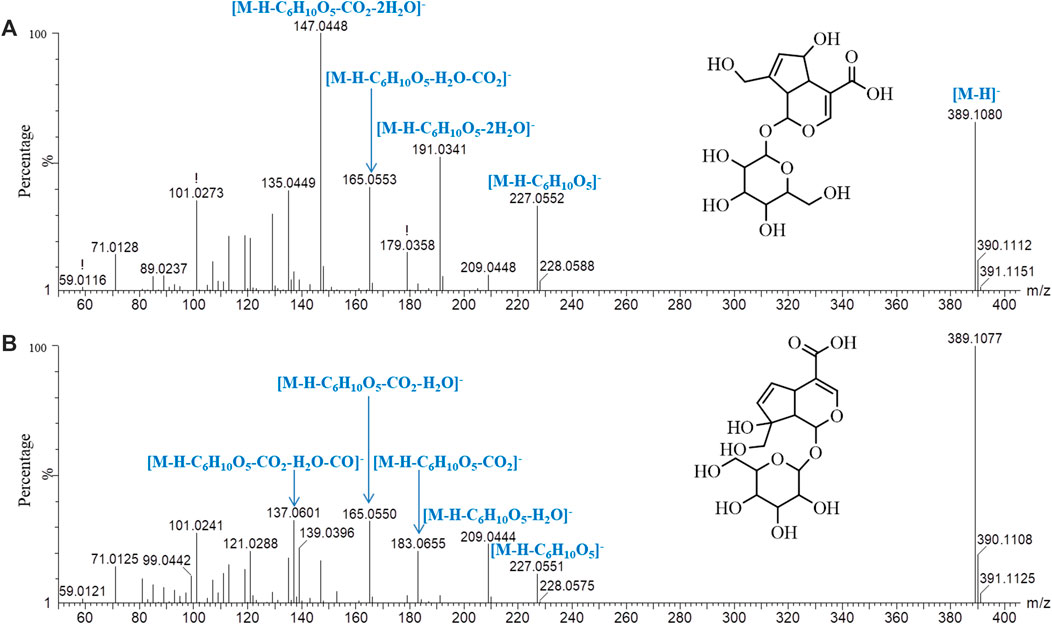
FIGURE 5. Mass spectrograms and major cleavage pathways of monotropein (A) and DDA (B) at high energy in negative ion mode.
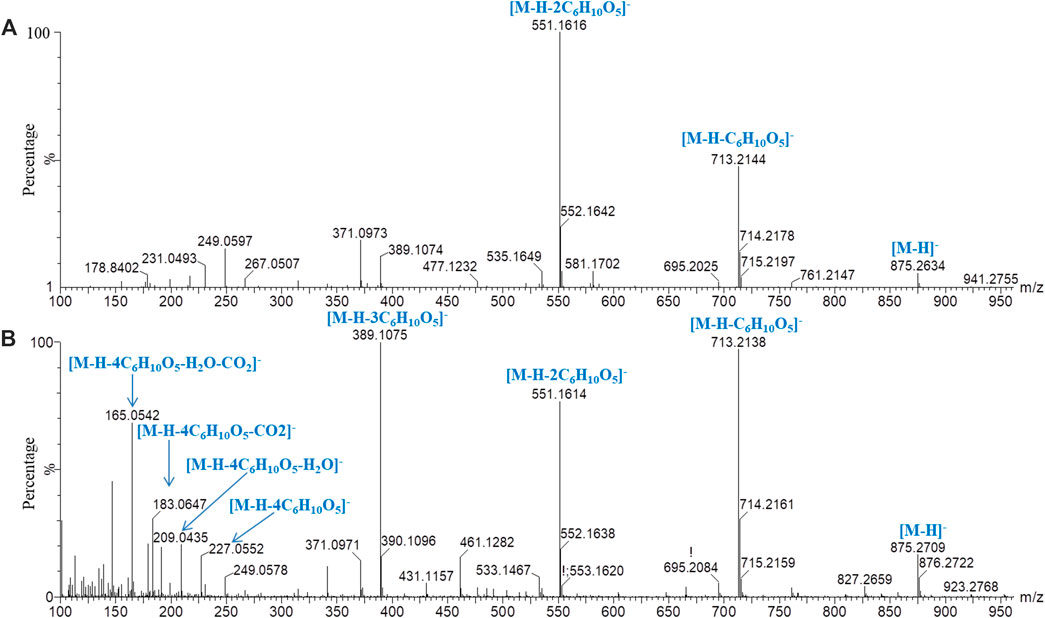
FIGURE 6. Mass spectrograms and major cleavage pathways of peak 47 (m/z 875.2664) in negative ion mode. (A) Low-energy mass spectrometry; (B) high-energy mass spectrometry.
The derivatives of monotropein and DAA were both potential new compounds that were first discovered in PMOR. The generation of these new iridoid glycosides may be related to the addition reaction of iridoid and sugar during the steaming process; in the process of steaming MOR, oligosaccharides are degraded to produce a large amount of glucose, fructose, and sucrose, and these sugars could promote the occurrence of iridoid glycosylation; or during the steaming process, the activity of certain enzymes in MOR changes, resulting in the combination of iridoid glycosides and sugars stored in inactive forms in MOR to produce new iridoid glycosides (Li et al., 2021). Further research on the production mechanism of new iridoid glycosides in PMOR is needed.
3.3.3 Identification of Anthraquinones
Because of the conjugated structure of the anthraquinone compound, the main fragmentation mode is to gradually lose CO and side-chain substituents (‒OH, ‒CH3, ‒OCH3, and ‒COOH) in the core group and retain the conjugated structure (Wang et al., 1992). With peak 96 (rubiadin-1-methyl ether) as an example, the fragmentation pathway of anthraquinone was analyzed (Figure 7). In the low-energy mass spectrum of positive ions, m/z 269.0812 [M+H]+ and 291.0635 [M+Na]+ ions were detected. The high-energy mass spectrum showed fragment ions of m/z 254.0594 [M+H‒CH3]+, 236.0490 [M+H‒CH3‒H2O]+, 226.0630 [M+H‒CH3‒CO]+, 208.0526 [M+H‒CH3‒CO‒H2O]+, 180.0599 [M+H‒CH3‒H2O-2CO]+, and 152.0638 [M+H‒CH3‒H2O‒3CO]+; m/z 197.0608 was the free radical ion formed after [M+H‒CH3‒CO]+• lost HCO•. In the negative ion mode, only the ion of m/z 267.0675 [M‒H]− was detected in the low-energy mass spectrum; the ions of m/z 252.0418 [M‒H‒CH3]−, 224.0391 [M‒H‒CH3‒CO]−, and 195.0429 [M‒H‒CH3‒CO‒HCO]−• were detected in the high-energy mass spectrum. According to the accurate molecular weight, fragmentation pattern, and characteristic fragments, peaks 77, 79, 80, 85, 86, 87, 88, 89, 91, 92, 93, 94, 95, 96, 98, 99, 100, and 102 were determined to be anthraquinone compounds; the identification results are shown in Supplementary Table S2.
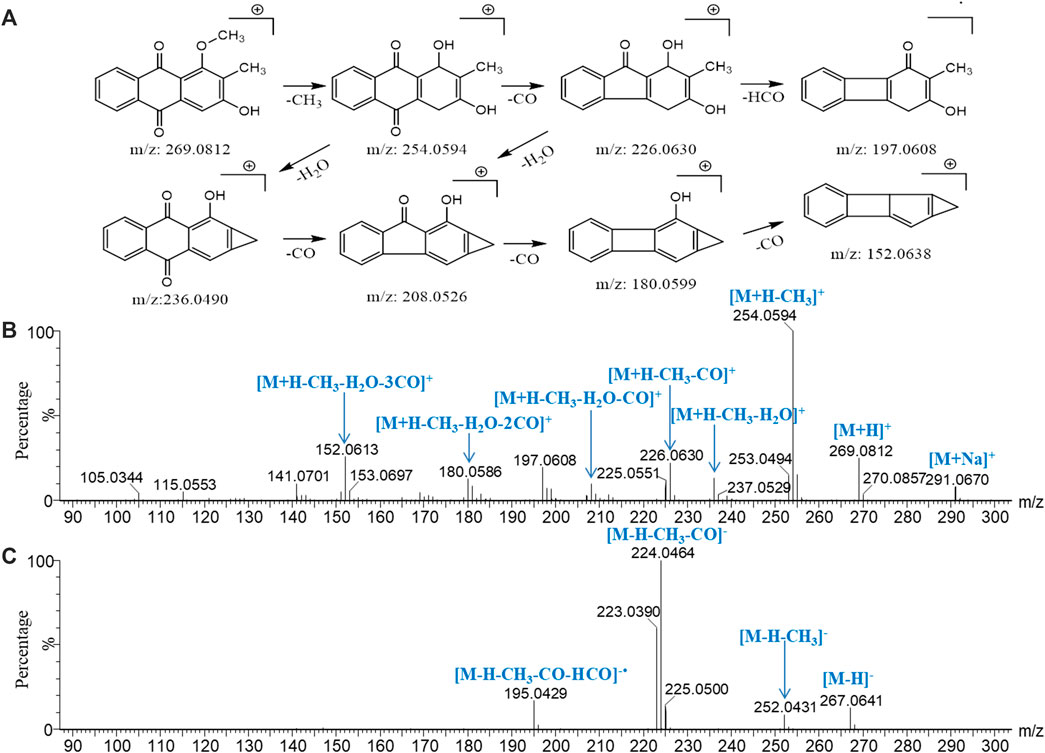
FIGURE 7. Major cleavage pathway (A) and mass spectrogram of rubiadin-1-methyl ether at high energy in positive ion mode (B) and in negative ion mode (C).
The contents of 1,3-dihydroxy-2-methylanthraquinone-3-O-β-D-fructofuranose-(l→2)-β-D- fructofuranoside and 1-hydroxy-anthraquinone-3-O-β-D-fructofuranose-(1→6)-β-D- glucopyranoside (Wang et al., 1992; Wang et al., 2019) were higher in MOR than in PMOR, possibly because the glycoside chain of the anthraquinone glycoside is broken during the steaming process, which causes the relative content of the anthraquinone glycoside to decrease in PMOR.
4 Conclusion
In this study, a method was developed to systematically study the similarities and differences in the overall chemical composition of MOR and PMOR. The structures of 110 compounds were identified, and 55 components were significantly different in content between MOR and PMOR. A total of 29 compounds showed higher contents in MOR than in PMOR, including GF2 to GF21, 1,3-dihydroxy-2-methylanthraquinone-3-O-β-D-fructofuranose-(l→2)-β-D-fructofuranoside and iridoid glycosides, such as monotropein, and DAA. A total of 26 compounds showed higher content in PMOR than in MOR, including DFAs, sucrose, and iridoid glycoside derivatives. DFAs and iridoid glycoside derivatives were found in PMOR for the first time. The changes in its efficacy may be closely related to the substantial changes in these components after MOR is processed by steaming. DFAs have a variety of physiological functions and have received extensive attention in the food and pharmaceutical industries. DFAs and iridoid glycoside derivatives should be purified and identified in a further study, and their activities should be determined. The results would provide a scientific basis for research on the therapeutic material basis of MOR and PMOR, and provide an effective method for the comparison of other processed and nonprocessed Chinese medicines.
Data Availability Statement
The original contributions presented in the study are included in the article/Supplementary Material, further inquiries can be directed to the corresponding authors.
Author Contributions
LK and QH developed the extraction method and performed the data investigation and experiments. YZ, LZ, JY, YH, SY, and GL collected and organized the data. QH wrote the article together with KL, and prepared the figures and tables. QH, YY, and LG supervised the study and the final version of the article. All authors contributed to the writing of the article and approved the submitted version.
Funding
This research was supported by the Scientific and Technological Innovation Project of China Academy of Chinese Medical Sciences (Grant Numbers: CI 2021A04007, C12021A05206) and the National Key Research and Development Project of China (Grant Number: 2020YFC1712704).
Conflict of Interest
YY was employed by the company Infinitus (China) Company Ltd. SY was employed by the company Beijing CACMS-NRC Herbs Testing and Authentication Co., Ltd.
The remaining authors declare that the research was conducted in the absence of any commercial or financial relationships that could be construed as a potential conflict of interest.
The reviewer WG declared a past coauthorship with one of the authors, KL, to the handling editor.
Publisher’s Note
All claims expressed in this article are solely those of the authors and do not necessarily represent those of their affiliated organizations, or those of the publisher, the editors, and the reviewers. Any product that may be evaluated in this article, or claim that may be made by its manufacturer, is not guaranteed or endorsed by the publisher.
Supplementary Material
The Supplementary Material for this article can be found online at: https://www.frontiersin.org/articles/10.3389/fchem.2021.803550/full#supplementary-material
References
Burokas, A., Arboleya, S., Moloney, R. D., Peterson, V. L., Murphy, K., Clarke, G., et al. (2017). Targeting the Microbiota-Gut-Brain Axis: Prebiotics Have Anxiolytic and Antidepressant-like Effects and Reverse the Impact of Chronic Stress in Mice. Biol. Psychiatry 82, 472–487. doi:10.1016/j.biopsych.2016.12.031
Cheng, D., Murtaza, G., Ma, S., Li, L., Li, X., Tian, F., et al. (2017). In Silico Prediction of the Anti-depression Mechanism of a Herbal Formula (Tiansi Liquid) Containing Morinda Officinalis and Cuscuta Chinensis. Molecules 22, 1614. doi:10.3390/molecules22101614
Cheng, M., Wu, H., Zhang, W., and Mu, W. (2021). Difructose Anhydride III: a 50-year Perspective on its Production and Physiological Functions. Crit. Rev. Food Sci. 61, 1–26. Advance online publication. doi:10.1080/10408398.2021.1904823
Cheng, Y. F., Nie, X., Tan, R., Zhang, L., Wu, Y. H., Zhang, J. M., et al. (2019). Evaluation of Chemical Quality Profile of Polygoni Multiflori Radix at Different Processing Degrees Based on its Classic Processing Method "Nine-Steaming and Nine-Sun-Curing". Zhongguo Zhong Yao Za Zhi 44, 5151–5158. doi:10.19540/j.cnki.cjcmm.20190916.304
Choi, J., Lee, K.-T., Choi, M.-Y., Nam, J.-H., Jung, H.-J., Park, S.-K., et al. (2005). Antinociceptive Anti-inflammatory Effect of Monotropein Isolated from the Root of Morinda Officinalis. Biol. Pharm. Bull. 28, 1915–1918. doi:10.1248/bpb.28.1915
Cui, N., Shi, J., and Jia, T. Z. (2013). Comparative Study on Kidney Tonifying and Yang Supporting Effects of Different Processed Products of Morinda Officinalis. Zhongguo Zhong Yao Za Zhi 38, 3898–3901.
Hao, Q., Nan, T., Zhou, L., Kang, L., Guo, L., and Yu, Y. (2019). Rapid Simultaneous Quantification of Fructooligosaccharides in Morinda Officianalis by Ultra‐high Performance Liquid Chromatography. J. Sep. Sci. 42, 2222–2230. doi:10.1002/jssc.201801287
He, J., Li, X., Wang, Z., Bennett, S., Chen, K., Xiao, Z., et al. (2019). Therapeutic Anabolic and Anticatabolic Benefits of Natural Chinese Medicines for the Treatment of Osteoporosis. Front. Pharmacol. 10, 1344. doi:10.3389/fphar.2019.01344
Li, C. M., Zhang, X. L., Xue, X. Y., Zhang, F. F., Xu, Q., and Liang, X. M. (2008). Structural Characterization of Iridoid Glucosides by Ultra-performance Liquid Chromatography/electrospray Ionization Quadrupole Time-Of-Flight Tandem Mass Spectrometry. Rapid Commun. Mass. Spectrom. 22, 1941–1954. doi:10.1002/rcm.3579
Li, J., Halitschke, R., Li, D., Paetz, C., Su, H., Heiling, S., et al. (2021). Controlled Hydroxylations of Diterpenoids Allow for Plant Chemical Defense without Autotoxicity. Science 371 (6526), 255–260. doi:10.1126/science.abe4713
Mellet, C. O., and Fernández, J. M. G. (2010). Difructose Dianhydrides (DFAs) and DFA-Enriched Products as Functional Foods. Toics. Curr. Chem. 294, 49–77. doi:10.1007/128_2010_50
Qiu, Z.-K., Liu, C.-H., Gao, Z.-W., He, J.-L., Liu, X., Wei, Q.-L., et al. (2016). The Inulin-type Oligosaccharides Extract from morinda Officinalis, a Traditional Chinese Herb, Ameliorated Behavioral Deficits in an Animal Model of post-traumatic Stress Disorder. Metab. Brain Dis. 31, 1143–1149. doi:10.1007/s11011-016-9853-7
Pharmacopoeia of the People’s Republic of China (2020). The Pharmacopoeia Commission of P.R.C. Beijing: China Medical Science Press.
Wang, M., Wang, Q., Yang, Q., Yan, X., Feng, S., and Wang, Z. (2019). Comparison of Anthraquinones, Iridoid Glycosides and Triterpenoids in Morinda Officinalis and Morinda citrifolia Using UPLC/Q-TOF-MS and Multivariate Statistical Analysis. Molecules 25, 160. doi:10.3390/molecules25010160
Wang, S. X., Hua, H. M., Wu, L. J., Li, X., and Zhu, T. R. (1992). Studies on Anthraquinones from the Roots of Rubia Cordifolia L. Yao Xue Xue Bao 27, 743–747.
Wu, Z.-J., Wang, J.-H., Fang, D.-M., and Zhang, G.-L. (2013). Analysis of Iridoid Glucosides from Paederia Scandens Using HPLC-ESI-MS/MS. J. Chromatogr. B 923-924, 54–64. doi:10.1016/j.jchromb.2013.01.032
Xu, Y., Cai, H., Cao, G., Duan, Y., Pei, K., Tu, S., et al. (2018). Profiling and Analysis of Multiple Constituents in Baizhu Shaoyao San before and after Processing by Stir-Frying Using UHPLC/Q-TOF-MS/MS Coupled with Multivariate Statistical Analysis. J. Chromatogr. B 1083, 110–123. doi:10.1016/j.jchromb.2018.03.003
Zhang, J. H., Xin, H. L, Xu, Y. M., Shen, Y., He, Y. Q., Chen, H. Y., et al. (2018). Morinda Officinalis How. - A Comprehensive Review of Traditional Uses, Phytochemistry and Pharmacology. J. Ethnopharmacology 213, 230–255. doi:10.1016/j.jep.2017.10.028
Zhang, Q., Zhang, J. H., He, Y. Q., Zhang, Q. L., Zhu, B., Shen, Y., et al. (2020). Iridoid Glycosides from Morinda Officinalis How. Exert Anti-inflammatory and Anti-arthritic Effects through Inactivating MAPK and NF-Κb Signaling Pathways. BMC Complement. Med. Ther. 20, 172. doi:10.1186/s12906-020-02895-7
Keywords: Morindae officinalis radix, processing Morindae officinalis radix, UHPLC-Q-TOF/MS, non-targeted metabolomics, difructose anhydrides, iridoid glycosides
Citation: Kang L, Zhang Y, Zhou L, Yang J, He Y, Yang S, Li G, Hao Q, Yu Y and Guo L (2022) Structural Characterization and Discrimination of Morinda officinalis and Processing Morinda officinalis Based on Metabolite Profiling Analysis. Front. Chem. 9:803550. doi: 10.3389/fchem.2021.803550
Received: 28 October 2021; Accepted: 14 December 2021;
Published: 21 January 2022.
Edited by:
Zhenbin Zhang, Ningbo University, ChinaCopyright © 2022 Kang, Zhang, Zhou, Yang, He, Yang, Li, Hao, Yu and Guo. This is an open-access article distributed under the terms of the Creative Commons Attribution License (CC BY). The use, distribution or reproduction in other forums is permitted, provided the original author(s) and the copyright owner(s) are credited and that the original publication in this journal is cited, in accordance with accepted academic practice. No use, distribution or reproduction is permitted which does not comply with these terms.
*Correspondence: Qingxiu Hao, aGFvcWluZ3hpdUAxNjMuY29t; Yi Yu, WWkuWXVAaW5maW5pdHVzLWludC5jb20=; Lanping Guo, Z2xwMDFAMTI2LmNvbQ==