 Yunhao Sun
 Zhengxing Dai
 Gulou Shen
 Xiaohua Lu
 Xiang Ling1*
 Xiaoyan Ji
95% of researchers rate our articles as excellent or good
Learn more about the work of our research integrity team to safeguard the quality of each article we publish.
Find out more
ORIGINAL RESEARCH article
Front. Chem. , 24 January 2022
Sec. Theoretical and Computational Chemistry
Volume 9 - 2021 | https://doi.org/10.3389/fchem.2021.801551
This article is part of the Research Topic Computational Methods for the Description of Intermolecular Interactions and Molecular Motion in Confining Environments View all 11 articles
To improve the efficiency of electrolyte perturbed-chain statistical associating fluid theory–density functional theory (ePC-SAFT-DFT) calculation of the confined system, in this work, first, the Chebyshev pseudo-spectral collocation method was extended to the spherical pores. Second, it was combined with the Anderson mixing algorithm to accelerate the iterative process. The results show that the Anderson mixing algorithm can reduce the computation time significantly. Finally, based on the accelerated ePC-SAFT-DFT program, a systematic study of the effects of the temperature, pressure, pore size, and pore shape on the CO2 solubilities in the ionic liquids (ILs) confined inside the silica nanopores was conducted. Based on the simulation results, to obtain high CO2 solubilities in the ILs confined in silica, a better option is to use the silica material with a narrow spherical pore, and the IL-anion should be selected specifically considering that it has a more significant impact on the absorption enhancement effect.
Mitigating CO2 emission from fossil-fueled power plants as well as from transports has become an urgent and worldwide research topic, in which CO2 separation is often needed (MacDowell et al., 2010; Boot-Handford et al., 2014). Ionic liquids (ILs) are promising absorbents for CO2 separation due to their extremely low vapor pressure, high CO2 solubility, as well as low-energy usage for solvent regeneration (Brennecke and Gurkan, 2010; Ramdin et al., 2012; Zhang et al., 2012). However, the viscosity of pure ILs is relatively high compared with common organic solvents, causing a significant decrease in the mass and heat-transfer rates. Using supported ILs has been proposed as a promising solution for practical applications. This can take the advantage of high gas selectivity in ILs, and also, the high surface area of the supported materials can reduce the impact of high viscosity, improve the gas transfer, and hence increase the absorption rate (Zhang et al., 2006; Ren et al., 2012; Romanos et al., 2014).
Research has been conducted to address the confinement effect on the gas solubility in ILs via experiments and molecular simulations (Baltus et al., 2005; Ilconich et al., 2007; Ilconich et al., 2007; Zhang et al., 2010; Iarikov et al., 2011; Ren et al., 2012; Banu et al., 2013; Shi and Luebke, 2013; Romanos et al., 2014; Santos et al., 2014; Budhathoki et al., 2017; Shen and Hung, 2017). According to previous research, several factors will affect the CO2 solubility inside the confined ILs, for example, temperature, pressure, pore size, and shape of porous materials (Baltus et al., 2005; Zhang et al., 2006; Ilconich et al., 2007; Zhang et al., 2010; Iarikov et al., 2011; Ren et al., 2012; Banu et al., 2013; Shi and Luebke, 2013; Romanos et al., 2014; Santos et al., 2014; Budhathoki et al., 2017; Shen and Hung, 2017). However, to screen a suitable IL, optimizing the structure of supported material and operation conditions by experiment or molecular simulations is time and cost consuming, considering the fact that the huge number (1018) of possible ILs can be synthesized (Wasserscheid and Thomas, 2008), as well as the wide temperature and/or pressure range in applications. Therefore, it is desirable to develop a theoretical model to predict the properties of confined IL–CO2 systems.
The classical density functional theory (DFT) is considered as an efficient theoretical method for studying the confined properties (Tripathi and Chapman, 2005; Qiao et al., 2018; Shen et al., 2013; Xu et al., 2008; Sauer and Gross, 2017; Camacho Vergara et al., 2019). In addition, in our previous work (Ji et al., 2012; Ji et al., 2014; Shen et al., 2015; Ji and Held, 2016; Sun et al., 2019), electrolyte-perturbed-chain statistical associating fluid theory (ePC-SAFT) (Cameretti et al., 2005) has been developed to represent the thermodynamic properties of IL systems. Moreover, the developed ePC-SAFT has been combined with DFT (ePC-SAFT-DFT) to describe the properties of IL and CO2/IL confined in nanopores with acceptable results (Shen et al., 2018). Recently, in order to calculate the properties of the confined ILs with ePC-SAFT-DFT efficiently, the Chebyshev pseudo-spectral collocation method (Yatsyshin et al., 2012; Nold et al., 2017) was implemented to accelerate the ePC-SAFT-DFT calculation (Sun et al., 2021). However, only the slit-shaped and cylindrical pores have been considered previously, while for the spherical cavity, the corresponding method has not been available. In addition, an advanced iteration method is required for replacing the simple Picard iteration to accelerate ePC-SAFT-DFT calculation further. Anderson mixing is an elaborate iteration method that has been used in the work by Mairhofer and Gross (2017) and Shen et al. (2021), showing desirable performance in accelerating DFT computing. Therefore, replacing the Picard iteration with Anderson mixing can be an effective strategy.
In this work, the Chebyshev pseudo-spectral collocation method was extended to the spherical geometry, where an expression of 9-3 Lennard–Jones potential for the spherical cavity was derived. In addition, Anderson mixing was used to accelerate the ePC-SAFT-DFT calculation further. Based on the modified program, the CO2 solubility of ILs confined in the silica nanopores was chosen as the representative to conduct the investigation, considering silica is a promising supporting material for ILs (Shi and Luebke, 2013), and the effects of temperature, pressure, pore structures, and IL-ions were investigated systematically.
According to DFT, in the presence of a solid surface, the grand potential Ω at grand canonical ensemble is given by the equation:
where A is the Helmholtz free energy,
where
The details of
Minimization of the grand potential with respect to the density profile of component i yields the following Euler–Lagrange equation:
where qi is the charge of component i, and
The expressions of the functional derivatives
where Rc represents the weighting distances, which are:
In Eq. 4b,
For spherical cavities,
In the spherical symmetric distribution, the Poisson’s equation reduces to:
where
For a spherical cavity with diameter R, by solving Eq. 6 with the boundary conditions
According to Eq. 7, the boundary electric potential
The Chebyshev pseudo-spectral collocation method for DFT modeling was developed by Yatsyshin et al. (2012). In the Chebyshev pseudo-spectral collocation method, for one-dimensional DFT calculation with an N-point discretization scheme, the density or the weighted density profile over the whole computation domain is determined from the density or the weighted density at a prescribed set of collocation points {zk}, k = 1,2 … , N using the barycentric form (Baltensperger, 2002; Berrut and Trefethen, 2004):
where the primes indicate that the first and last terms in the sums are divided by 2. The collocation points (zk) can be obtained by a conformal map from the Chebyshev collocation points (xk) (Baltensperger, 2002; Berrut and Trefethen, 2004):
The integrals associated with the DFT calculation can be evaluated with the Clenshaw–Curtis quadrature (Clenshaw and Curtis, 1960).
In the ePC-SAFT-DFT calculation, three domains need to be discretized for interpolation. The first domain is for the density profile, the second one is for the weighted density function profiles in the hard-sphere term, and the third one is for the weighted density function profile in the Debye–Hückel term.
For the spherical cavity with diameter R, we defined a diameter R′ as:
The density profile is considered in the domain (0, R') based on the coordinate system illustrated in Figure 1. In other words, this domain is discretized for interpolating the density profile function. In general, the density profile vibrates dramatically near the wall, which implies that more collocation points are required in these regions compared with the middle of the nanopore. In this work, the conformal map proposed by Bayliss and Turkel was used to map the Chebyshev collocation points

FIGURE 1. Schematic diagram of the domains considered in a spherical cavity.
The
where:
Equation 11a maps the Chebyshev points in the transformed coordinate into the points that cluster in the physical coordinate near
where
Therefore, the collocation points are clustered in the physical coordinate near (
As pointed out by Yatsyshin et al. (2012), the maps (Eq. 4) involved in DFT calculation can be carried out by matrix–vector products with discrete data based on interpolation (Eq. 8) and Clenshaw–Curtis quadrature. In the spherical cavities, for a map with original space discretized into N2 points and the image space discretized into N1 points, the map can be represented by N1 × N2 matrix (Yatsyshin et al., 2012):
with
where ai and bi are the lower and upper limits of integral for the ith discrete point, W is the corresponding integral kernel in Eq. 5, and
For the singularities in the expression of Eq. 13b (i.e.,
Equation 7 can be represented with matrix–vector products with the discrete data:
where
The two N × N matrixes
where
where
with
The elements in (N-1) × N
with
where
In the Chebyshev pseudo-spectral collocation method, the Euler–Lagrange equation (Eq. 3) is transformed into a vector equation that can be solved numerically. In our previous work, the Picard iteration was used. In this work, the Anderson mixing is implemented to solve Eq. 3 iteratively (Anderson, 1965). In the Anderson mixing, the Euler–Lagrange equation can be rewritten as:
where k represents the Boltzmann constant,
Eq. 15a can be solved iteratively by (Anderson, 1965):
where S is the relaxing factor,
The constrained optimization can be transformed to unconstrained optimization (Fang and Saad, 2008; Walker and Ni, 2011):
where
The successive optimization (Eq. 15d) can be solved efficiently by the updating QR factorization, and the necessary Matlab code is given in Walker (2011). In order to avoid divergence, Ns steps of Picard iterations can be performed at the beginning and then switched to the Anderson mixing procedure.
A general scheme for calculating the density profile of confined systems with ionic contribution was proposed in Sun et al. (2021), as illustrated in Scheme 1. In a loop of Scheme 1, the Euler–Lagrange equation needs to be solved twice. For the first time, solving the Euler–Lagrange equation in a loop, Ns (steps of Picard iteration performed before the Anderson mixing procedure) can be set between 1,200 and 1,500, while for the second time, due to the initial guess of density profile being not far away from the equilibrium density profile, we do not perform Picard iterations prior to the Anderson mixing procedure. (i.e., Ns = 0).
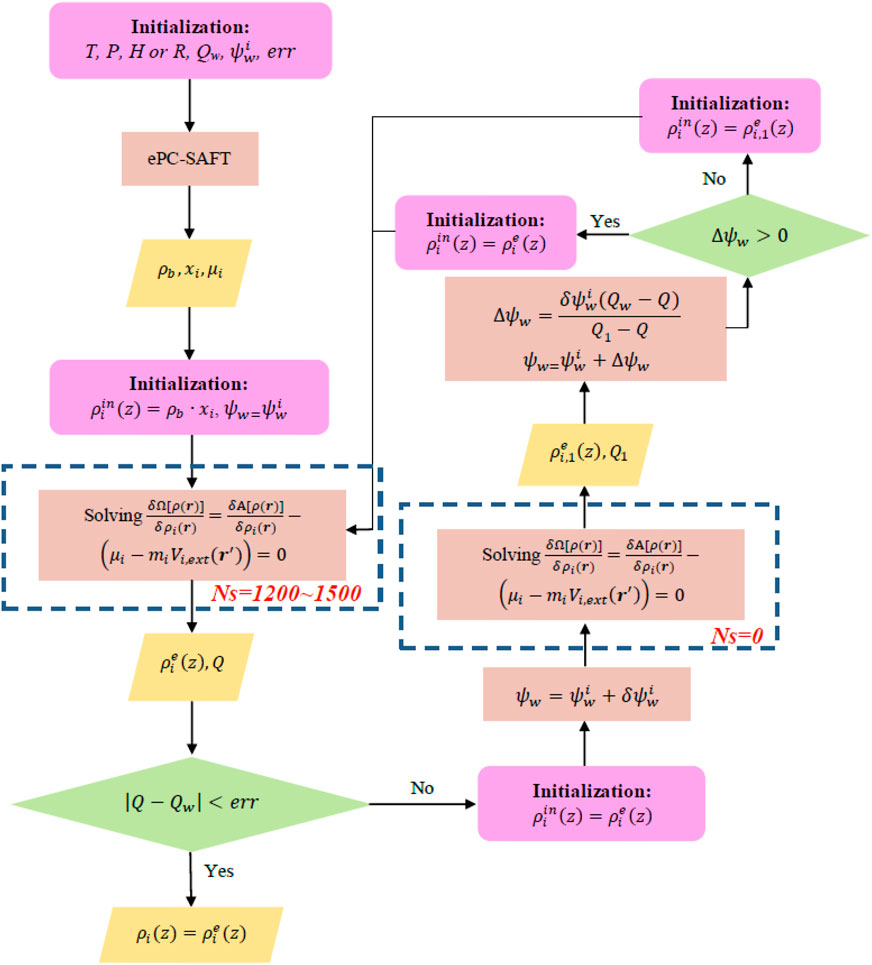
SCHEME 1. Calculating the density profile of ionic liquid (IL)–CO2 system inside nanopores with specific surface charge
In Scheme 1, T, p,
where the amount of component i adsorbed per surface area
for the cylindrical pores:
and for the spherical cavities:
Following ePC-SAFT for the ILs in the bulk systems (Ji et al., 2012), an ionic liquid molecule is composed of one IL cation and one IL anion. Each individual IL ion was modeled as a nonspherical species with repulsion, dispersive attraction, and Coulomb interactions. The 9-3 Lennard–Jones potential was used to represent the nonelectrostatic interaction between silica and fluid. The nanopore was modeled as an infinitely large slit, infinitely long cylinder, or spherical cavity. The 9-3 Lennard–Jones potential for large slit and infinitely long cylinder have already been presented in the literature (Fitzgerald et al., 2003; Siderius and Gelb, 2011; Lee, 2016), while for a spherical cavity with diameter R, the 9-3 Lennard–Jones potential can be obtained from:
where r is the distance of the fluid molecule from the center of the spherical cavity,
where
For the electroneutral silica nanopore, the amount of cation and anion adsorbed per surface area should be equal. The solubility of CO2 in the confined IL with a neutral surface is defined by:
where
Calculating the density profile of [C6mim] [Tf2N]-CO2 confined in electronic neutral silica pore with different structures at 333 K and 16.1 bar was selected as an example here to demonstrate the performance of the general scheme combined with the Anderson mixing, and the calculation efficiency was compared with the general scheme only using the Picard iterations. In the calculation, the width of the slit-shaped pore and the diameters for the cylindrical pore and spherical cavity are 5 nm. We used 120 collocation points to represent the density profile inside the slit-shaped pore (functional derivatives only need to be calculated in half of the collocation points due to the symmetry of the density profile), while 60 collocation points were used for the cylindrical pore and spherical cavity. The relaxing parameters used in all these three cases are 0.001.
The calculations were performed on a computer with an AMD core Ryzen 7 PRO 4750U and X64 processor. The version of the compiler is Matlab 2018b. Figure 2 compares the time required for calculations.
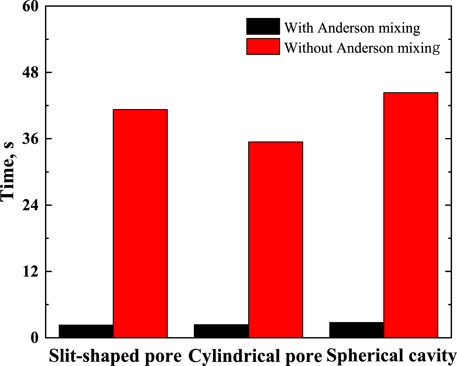
FIGURE 2. Time required for calculating equilibrium density profile (not including the time for calculating the matrices required in the Chebyshev pseudo-spectral collocation method).
As illustrated in Figure 2, using the Anderson mixing can improve the calculation efficiency significantly. The time needed for calculating the matrices required in the Chebyshev pseudo-spectral collocation method is listed in Table 1.

TABLE 1. Time needed for calculating the matrices required in the Chebyshev pseudo-spectral collocation method.
As listed in Table 1, the time required for calculating the matrices for the slit-shaped pore and spherical cavity can be ignored. However, the time for the cylindrical pore is pronounced. The reason is that too much time is used for evaluating the Legendre complete elliptic integral of the first and second kinds. This may be a problem in massive ePC-SAFT-DFT calculations, for example, adjusting the model parameters from experimental data, in which the equilibrium density profile needs to be solved multiple times.
However, for systems at the same temperature and pore diameter (cylindrical pore), the elements of these matrices are the same (Sun et al., 2021). Therefore, for the sake of saving computation time, when modeling systems confined in the cylindrical pore, these matrices can be used repeatedly for the systems at the same temperature and pore diameter.
Based on the efficient algorithm discussed above, ePC-SAFT-DFT can be used in a wide range of IL systems to obtain results efficiently. In this work, several [Cnmim]-based IL-CO2 systems confined in silica nanopore were selected to investigate the effects of temperature, pressure, IL ions, as well as the size and shape of the pore. As the nanopores of different silica materials have been roughly assumed as slit-like (Li et al., 2005; Yang and Yue, 2007), cylindrical (Kresge et al., 1992; Beck et al., 1992; Maddox et al., 1997), and spherical (Nandiyanto et al., 2009) in the previous theoretical work, in this work, these three pore-shape models were adopted.
The calculated density profile of [C6mim] [Tf2N]-CO2 confined in 25 Å slit silica pore at 10 bar and 323.15 K is presented in Figure 3.
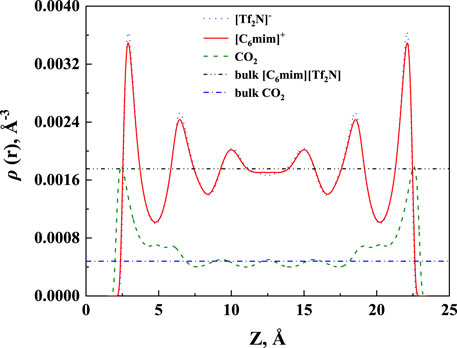
FIGURE 3. The calculated density profiles of [C6mim] [Tf2N]-CO2 system confined in 25 Å slit silica pore at 10 bar and 323.15 K.
As pointed out by Ho et al. (2013), two competitive mechanisms affect the solubility in a nanopore: One is the adsorption near the pore surface, and the other is the absorption inside the IL. These can be seen in the density profile of CO2. According to the results illustrated in Figure 3, the peak in the density profile near the surface of nanopores corresponds to the first mechanism, while in the middle of the nanopore, the density profile of CO2 tends to the bulk density, which is the reflection of the second mechanism. The absorption enhancement in the confined ILs is mainly contributed by the first mechanism. In this work, the additional solubility xa is used to identify the absorption enhancement:
In general, with the temperature increase, the CO2 solubility in the bulk ILs will decrease. According to our calculation results, CO2 solubility in [C6mim] [Tf2N] confined in slit-shaped pore also decreases with the increase in temperature. This is consistent with the observation by Mirzaei et al. (2017). Typical examples are shown in Figures 3A and 4A. However, with the increase in temperature, the solubility of CO2 in [C6mim] [Tf2N] confined in SiO2 decreases greater than that of the bulk IL. For example, at 1 bar, when the temperature increase from 298.15 K to 373.15 K, the solubility of CO2 in the bulk [C6mim] [Tf2N] decreases by about 0.02 mol CO2/mol IL. Under the same condition, the calculated solubilities of CO2 in the confined [C6mim] [Tf2N] reduce by about 0.03 mol CO2/mol IL. It indicates that confined ILs may make it easier to desorb CO2.
FIGURE 4. Calculated CO2 solubility (A) and additional solubilities (B) of ILs confined in 25 Å slit-shaped pore at 1 bar and different temperatures.
In order to study the effect of temperature on the absorption enhancement effect, we analyzed the relation between the additional solubility and temperatures. As illustrated in Figures 4B and 5B, the additional solubility decreases with increasing temperature. In order to interpret this, the calculated density profiles of [C6mim][Tf2N]-CO2 confined in 25 Å slit silica pore at 10 bar and different temperatures are illustrated in Figure 6. To quantitatively describe the effect of the first mechanism, the ratios of the CO2 density at the first peak near the pore surface (which is also the maximum density inside the nanopore) to its bulk density in ILs were calculated as illustrated in Figure 7. According to the results shown in Figure 7, the ratio decreases with the increase in the temperature when the pressure keeps constant, and consequently, the additional solubility decreases. The same phenomenon can be observed at other pressures and in other pore structures, as listed in Supplementary Table S1.
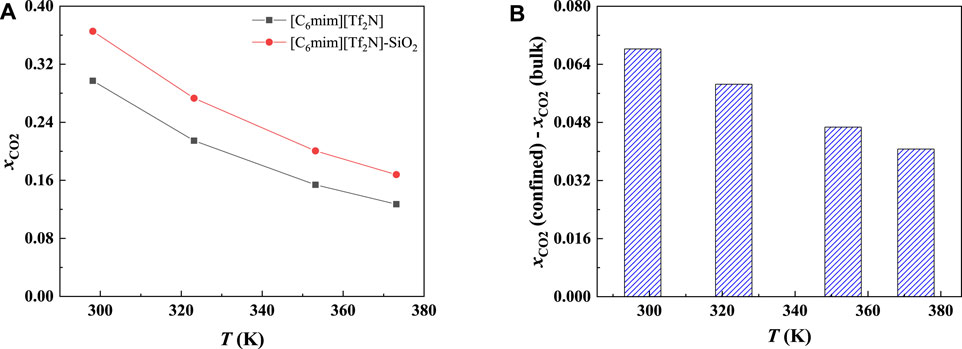
FIGURE 5. Calculated CO2 solubility (A) and additional solubilities (B) of ILs confined in 25 Å slit-shaped pore at 10 bar and different temperatures.
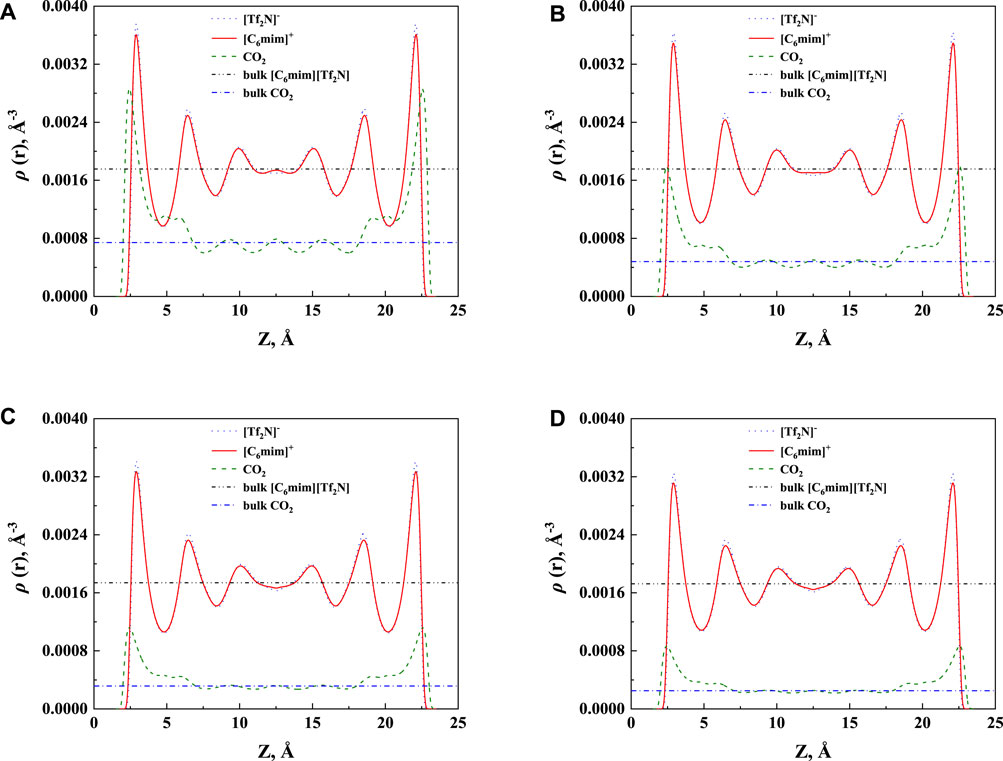
FIGURE 6. The calculated density profiles of [C6mim] [Tf2N]-CO2 confined in 25 Å slit silica pore at 10 bar and (A) 298.15 K, (B) 323.15 K, (C) 353.15 K, and (D) 373.15 K.
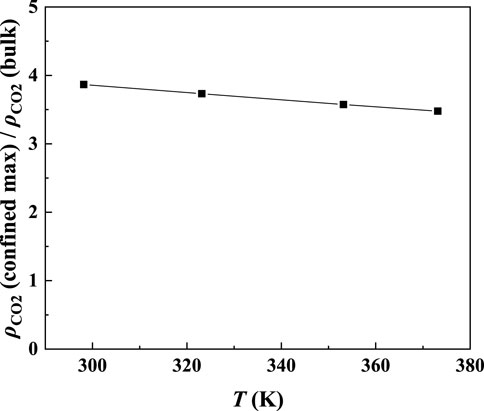
FIGURE 7. Ratios of the maximum density of CO2 in the confined [C6mim] [Tf2N] to its bulk density in [C6mim] [Tf2N].
Most commercial ILs are physical absorbents for CO2. In general, the CO2 solubility in ILs will increase significantly with increasing pressure. Figure 8A illustrates the CO2 solubility at 298.15 K and different pressures in the 25 Å slit-shaped pore. From Figure 8B, The CO2 solubilities in confined ILs also increase with the increase in the pressure. In addition, the increase in CO2 solubility in the confined [C6mim] [Tf2N] is more significant than that of the bulk [C6mim] [Tf2N] under the same condition. For instance, when the pressure increases from 1 to 50 bar, the solubility of CO2 in the confined [C6mim] [Tf2N] increases by about 0.78 mol CO2/mol IL, while that in bulk [C6mim] [Tf2N] increases by about 0.70 mol CO2/mol IL.
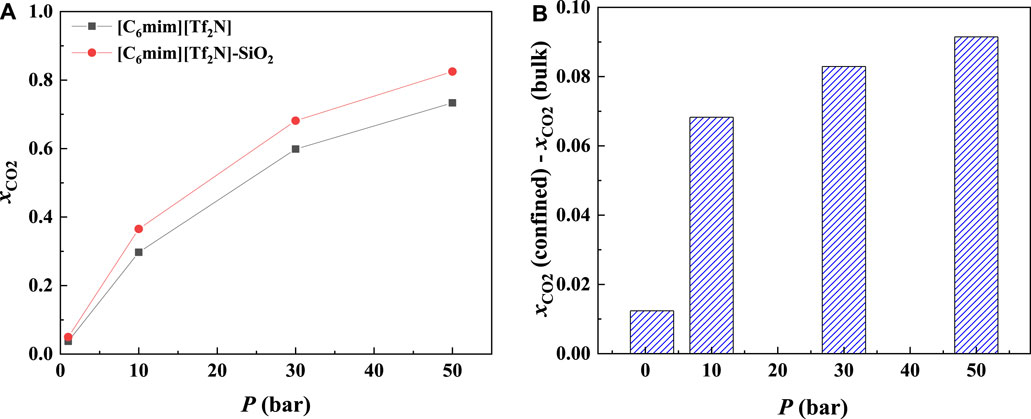
FIGURE 8. Calculated CO2 solubility (A) and additional solubilities (B) of confined ILs in 25 Å slit-shaped pore at 298.15 K and different pressures.
The additional solubility also increases with increasing pressure, as illustrated in Figure 8B. To have a deep insight into this observation, the density profiles of [C6mim] [Tf2N]-CO2 confined in 25 Å slit silica pore at 298.15 K and different pressures illustrated in Figure 9 were taken as one example for the detailed analysis. According to the results shown in Figure 9, with the increase in pressure, the adsorption of CO2 near the pore surface increases, while the adsorption of IL ions near the pore surface decreases. This can be interpreted that at high pressure, a large amount of CO2 inside the nanopore leads to a stronger competitive adsorption capacity of CO2 in the pore surface than that of IL ions. Consequently, the additional solubility increases with the increase in pressure. The same phenomenon can be observed under other conditions, as listed in Supplementary Table S1.
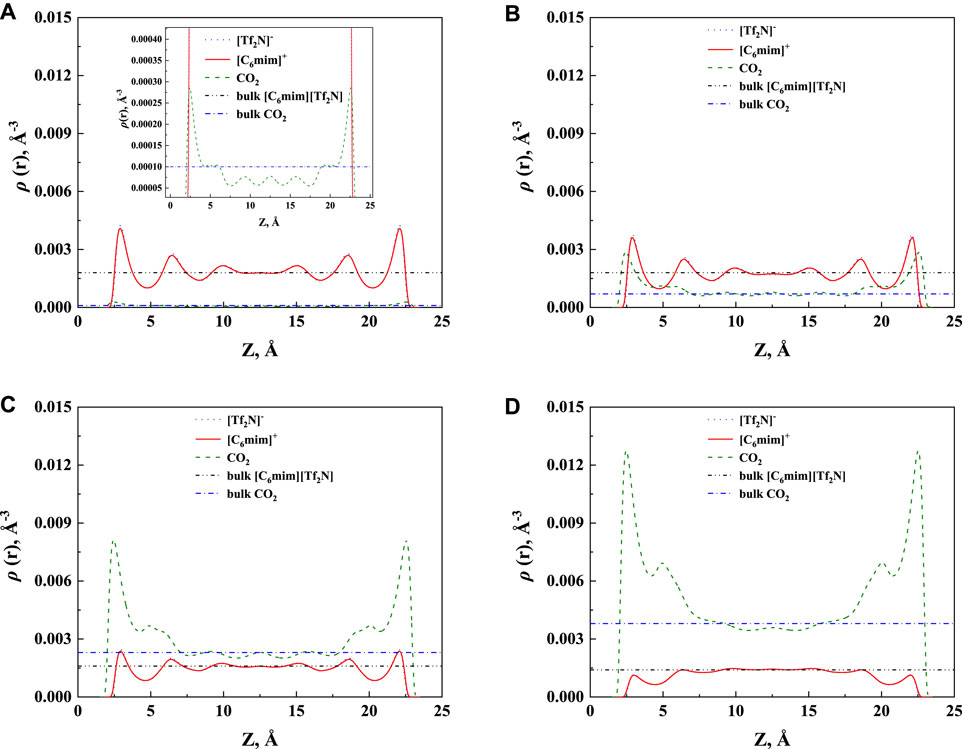
FIGURE 9. Calculated density profiles of [C6mim] [Tf2N]-CO2 system confined in 25 Å slit silica pore at 298.15 K and (A) 1 bar, (B) 10 bar, (C) 30 bar, and (D) 50 bar.
The CO2 solubilities of confined ILs will also be affected by the pore size and shape. According to the calculation results, the adsorption will be enhanced more significantly in the smaller nanopore, which is consistent with the results of Shi and Luebke (2013). Two typical examples are shown in Figure 10. As illustrated in Figure 10, the solubilities of CO2 increase with the decrease in the slit-shaped pore.
FIGURE 10. Calculated CO2 solubility of [C6mim] [Tf2N] at 298.15 K and 1 bar (A) and 30 bar (B) in slit-shaped pores with different widths (solid symbols, data for confined ILs; open symbols, data for bulk ILs.).
The effect of the shape of nanopores was also investigated. According to our calculation results, for nanopores with the same size (i.e., the width for slit-shaped pore and the diameter for cylindrical pore and spherical cavity), ILs confined in the spherical cavity have the highest CO2 solubilities, while those confined in the slit-shaped pore have the lowest. Typical examples are illustrated in Figure 11. This indicates that using supported material with spherical nanopores may lead to better absorption capacity. The calculated density profiles of the three shapes at 298.15 K and 30 bar are presented in Figure 12. It shows that the pore shape affects the density profile near the surface of the pore significantly. For IL ions, the density at the first peak follows the trend that ρ (slit-shaped) > ρ (cylindrical) > ρ (spherical), while for CO2, the opposite trend can be observed. This is because the inward curved surfaces impede the accumulation of large molecules (e.g., IL ions) near the surface. Therefore, under the same situation, the CO2 solubilities (x) follow the trend that x (spherical) > x (cylindrical) > x (slit-shaped).
FIGURE 11. Calculated CO2 solubility of [C6mim] [Tf2N] confined in different-shaped pores at 298.15 K and 1 and 30 bar (the width of slit-shaped pore and the diameter of cylindrical pore and spherical cavity are all 5 nm).
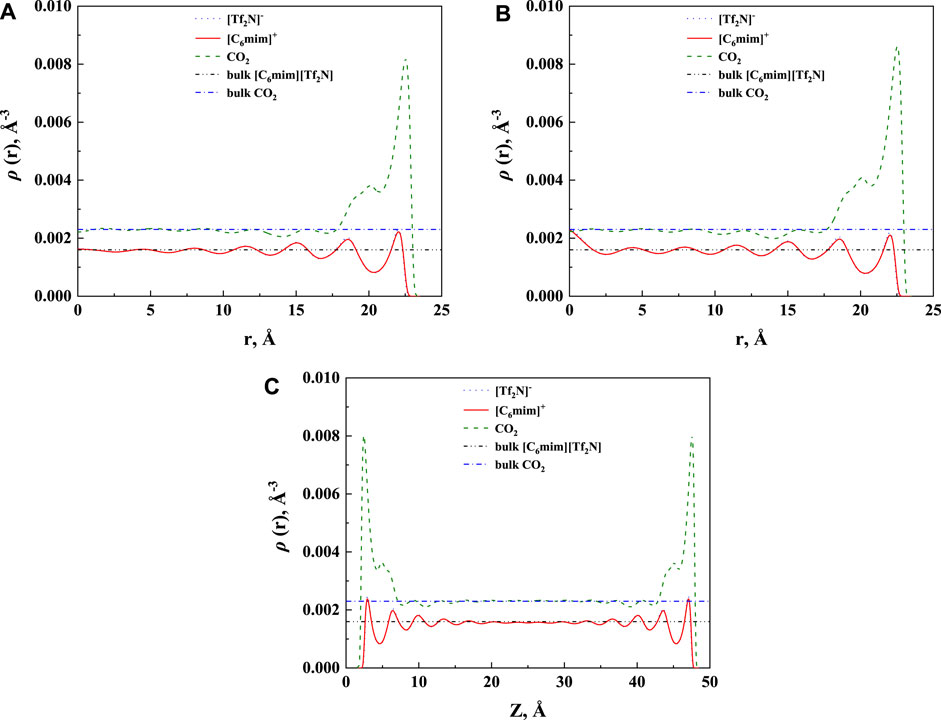
FIGURE 12. Calculated density profiles [C6mim] [Tf2N]-CO2 confined in 50 Å (A) cylindrical, (B) spherical, and (C) slit-shaped silica pore at 298.15 K and 30 bar.
In most cases, the IL-cations are chain-like substances. Therefore, in this part, the effect of alkyl-chain length was studied. Following this, ePC-SAFT-DFT was used to model the CO2 solubilities of [C4mim][Tf2N], [C6mim] [Tf2N], and [C8mim] [Tf2N] inside silica nanopores at different temperatures, pressures, pore widths, and pore shapes. The calculated results are listed in Supplementary Table S1.
As illustrated in Figures 13A and 14A, for the ILs in the same homologous series, the CO2 solubilities in the confined ILs increase with increasing alkyl-chain length in cation, which is the same as that in the bulk ILs. According to Figure 13B and Figure 14B, at low pressures, the additional solubility also increases with the increase in the alkyl-chain length. However, this is not true at high pressures, as illustrated in Figure 14B. This indicates that the absorption enhancement of ILs with longer alkyl-chain decreases faster with the increasing pressure than the ILs with shorter alkyl-chain.
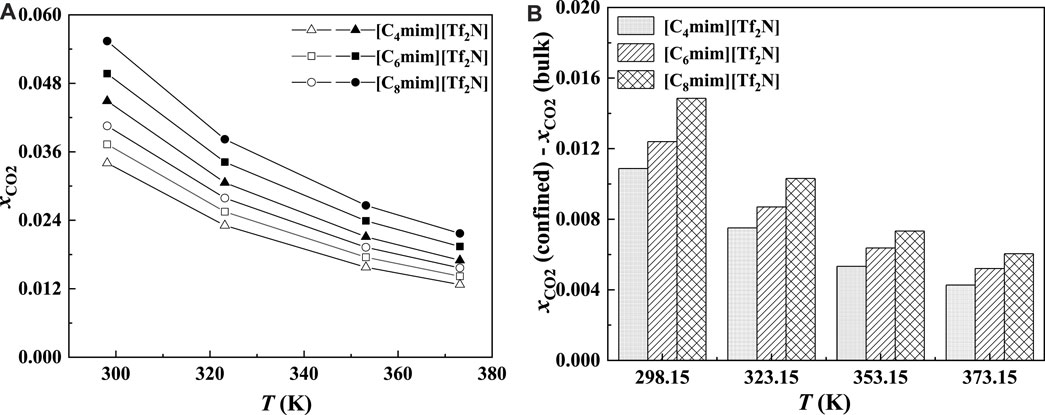
FIGURE 13. Calculated CO2 solubility (A) and additional solubilities (B) of ILs confined in 25 Å slit-shaped pore at 1 bar and different temperatures. (A) Solid symbols, data for confined ILs; open symbols, data for bulk ILs.
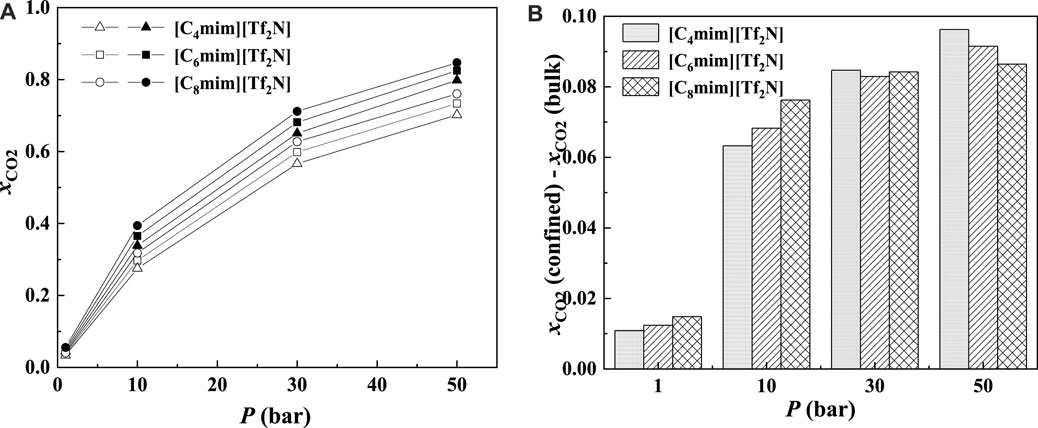
FIGURE 14. Calculated CO2 solubility (A) and additional solubilities (B) of ILs confined in 25 Å slit-shaped pore at 298.15 K and different pressures. (A) Solid symbols, data for confined ILs; open symbols, data for bulk ILs.
As demonstrated in Figure 15, with the increase in pore width, the additional solubility decreases, especially for the IL with longer alkyl-chain length in the IL cation. The additional solubilities of confined ILs in different pore shapes are illustrated in Figure 16. In the spherical cavity, the additional solubilities increase more significantly with increasing alkyl-chain length in IL cation than that in the slit-shaped and cylindrical pores.
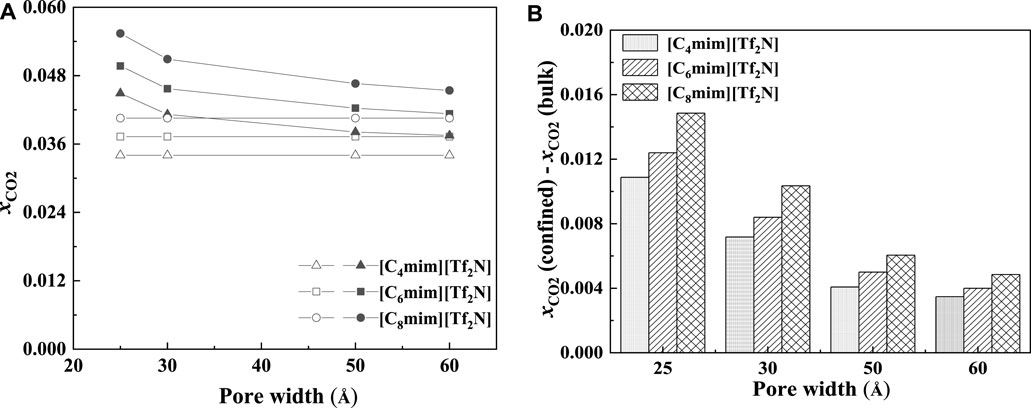
FIGURE 15. Calculated CO2 solubility (A) and additional solubilities (B) of ILs confined in slit-shaped pore with different widths at 298.15 K and 1 bar. (A) Solid symbols, data for confined ILs; open symbols, data for bulk ILs.
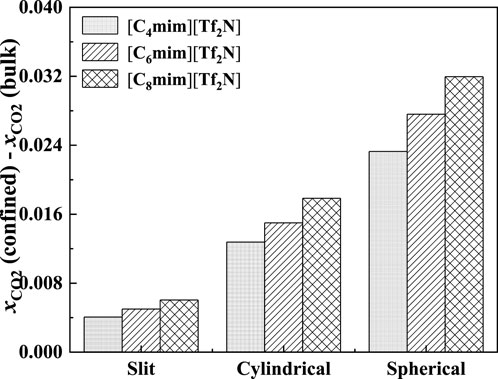
FIGURE 16. Calculated additional solubilities of ILs confined in different shaped pores at 298.15 K and 1 bar in 50 Å. Solid symbols, data for confined ILs; open symbols, data for bulk ILs.
In the bulk phase, the IL anion affects the CO2 solubilities more significantly than IL cation (Anthony et al., 2005). According to Figure 17, the IL anion also has a more significant effect than IL cation in the absorption enhancement. From 1 to 50 bar, the deviation of the calculated additional solubility between [C4mim] [Tf2N] and [C8mim] [Tf2N] changes from 0.003 to 0.009, while for [C6mim] [Tf2N] and [C6mim] [PF6], the deviation of the calculated additional solubility changes from 0.002 to 0.071 from 1 to 50 bar.
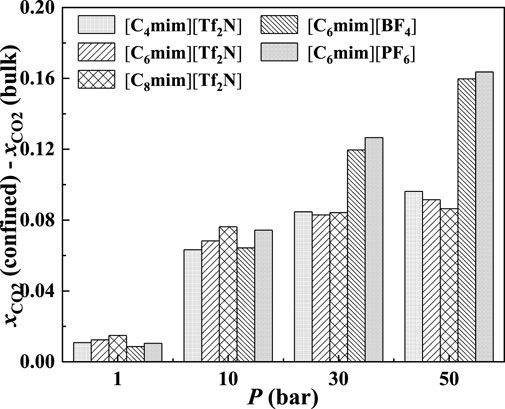
FIGURE 17. Calculated additional solubilities of ILs confined in 25 Å slit-shaped pore at 298.15 K and different pressures.
In Figure 18, the calculated additional solubilities of several confined ILs in different pore shapes are presented. The absorption enhancement of anion is more significant in the spherical cavity as shown in Figure 18. For example, in the slit-shaped pore at 30 bar, the deviation of the calculated additional solubilities between [C4mim] [Tf2N] and [C8mim] [Tf2N] is 0.001, and that between [C6mim] [Tf2N] and [C6mim] [PF6] is 0.007. While in the spherical pore, these two values are 0.007 and 0.086. In addition, for [C6mim] [BF4] and [C6mim] [PF6], the additional solubilities are considerably higher than those of [C6mim] [Tf2N] in the spherical cavity at high pressures. This indicates that changing the IL anion of ILs confined in the spherical cavity may be promising to obtain a large absorption enhancement.
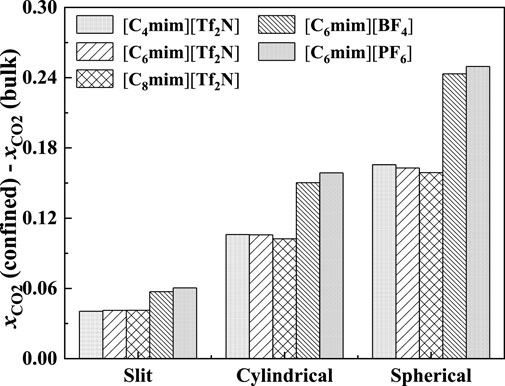
FIGURE 18. Calculated additional solubilities of ILs in different-shaped pores at 298.15 K and 30 bar (the width of slit-shaped pore and the diameter of cylindrical pore and spherical cavity are all 5 nm).
Up to here of this section, the effects of temperature, pressure, IL ions, as well as the size and shape of pores on confined CO2 solubilities were investigated. In order to further improve model performance toward practical applications, the ePC-SAFT-DFT model will be combined with different pore models (pore shape and pore size distribution) with the parameters adjusted from experimental data in our future work based on the newly measured experimental data.
In this work, the Chebyshev pseudo-spectral collocation method was combined with the Anderson mixing algorithm to further accelerate the ePC-SAFT-DFT calculation. The results show that the computing time can be significantly reduced with the Anderson mixing algorithm. This makes the ePC-SAFT-DFT model more effective in screening promising ILs. However, calculating matrices used in the Chebyshev pseudo-spectral collocation method for the cylindrical pores requires a certain computing time, while in a massive computation, these matrices can be reused to save computation time.
Using the ePC-SAF-DFT model, the CO2 solubilities of ionic liquid confined in silica nanopores were studied. The results show that the CO2 solubilities of confined ILs are always higher than that in bulk ILs under the same condition, and the absorption enhancement effect will be significantly affected by pressure, pore widths, pore shapes, and IL anion. Based on the simulation results, to obtain high CO2 solubilities in silica-confined ILs, a better option is to use silica material with a narrow spherical pore. In addition, the IL anion should be selected specifically considering that the category of IL anion has a significant impact on the absorption enhancement effect.
The original contributions presented in the study are included in the article/Supplementary Materials, further inquiries can be directed to the corresponding authors.
GS conceptualized the study. YS formulated the methodology, was in charge of software and investigation, provided the visualization, and wrote the original draft. GS and XLi performed the validation. XLu, XLi, and XJ were in charge of the resources. ZD and XJ reviewed and edited the manuscript. ZD take part in the visualization and wrote the original draft.
This work was supported by the Swedish Research Council (Grant No. 2020-03899), the Joint Research Fund for Overseas Chinese Scholars and Scholars in Hong Kong and Macao Young Scholars (No. 21729601), and the Interreg Nord and Region Norrbotten in Sweden (No. 304-16169-2019).
The authors declare that the research was conducted in the absence of any commercial or financial relationships that could be construed as a potential conflict of interest.
All claims expressed in this article are solely those of the authors and do not necessarily represent those of their affiliated organizations, or those of the publisher, the editors, and the reviewers. Any product that may be evaluated in this article, or claim that may be made by its manufacturer, is not guaranteed or endorsed by the publisher.
The Supplementary Material for this article can be found online at: https://www.frontiersin.org/articles/10.3389/fchem.2021.801551/full#supplementary-material
Anderson, D. G. (1965). Iterative Procedures for Nonlinear Integral Equations. J. Acm 12, 547–560. doi:10.1145/321296.321305
Anthony, J. L., Anderson, J. L., Maginn, E. J., and Brennecke, J. F. (2005). Anion Effects on Gas Solubility in Ionic Liquids. J. Phys. Chem. B 109, 6366–6374. doi:10.1021/jp046404l
Baltensperger, R. (2002). Some Results on Linear Rational Trigonometric Interpolation. Comput. Maths. Appl. 43, 737–746. doi:10.1016/S0898-1221(01)00317-0
Baltus, R. E., Counce, R. M., Culbertson, B. H., Luo, H., DePaoli, D. W., Dai, S., et al. (2005). Examination of the Potential of Ionic Liquids for Gas Separations. Sep. Sci. Tech. 40, 525–541. doi:10.1081/SS-200042513
Banu, L. A., Wang, D., and Baltus, R. E. (2013). Effect of Ionic Liquid Confinement on Gas Separation Characteristics. Energy Fuels 27, 4161–4166. doi:10.1021/ef302038e
Barker, J. A., and Henderson, D. (1967). Perturbation Theory and Equation of State for Fluids. II. A Successful Theory of Liquids. J. Chem. Phys. 47, 4714–4721. doi:10.1063/1.1701689
Bayliss, A., and Turkel, E. (1992). Mappings and Accuracy for Chebyshev Pseudo-spectral Approximations. J. Comput. Phys. 101, 349–359. doi:10.1016/0021-9991(92)90012-N
Beck, J. S., Vartuli, J. C., Roth, W. J., Leonowicz, M. E., Kresge, C. T., Schmitt, K. D., et al. (1992). A New Family of Mesoporous Molecular Sieves Prepared with Liquid crystal Templates. J. Am. Chem. Soc. 114, 10834–10843. doi:10.1021/ja00053a020
Berrut, J.-P., and Trefethen, L. N. (2004). Barycentric lagrange Interpolation. SIAM Rev. 46, 501–517. doi:10.1137/S0036144502417715
Boot-Handford, M. E., Abanades, J. C., Anthony, E. J., Blunt, M. J., Brandani, S., Mac Dowell, N., et al. (2014). Carbon Capture and Storage Update. Energy Environ. Sci. 7, 130–189. doi:10.1039/C3EE42350F
Brennecke, J. F., and Gurkan, B. E. (2010). Ionic Liquids for CO2 Capture and Emission Reduction. J. Phys. Chem. Lett. 1, 3459–3464. doi:10.1021/jz1014828
Budhathoki, S., Shah, J. K., and Maginn, E. J. (2017). Molecular Simulation Study of the Performance of Supported Ionic Liquid Phase Materials for the Separation of Carbon Dioxide from Methane and Hydrogen. Ind. Eng. Chem. Res. 56, 6775–6784. doi:10.1021/acs.iecr.7b00763
Camacho Vergara, E. L., Kontogeorgis, G. M., and Liang, X. (2019). Gas Adsorption and Interfacial Tension with Classical Density Functional Theory. Ind. Eng. Chem. Res. 58, 5650–5664. doi:10.1021/acs.iecr.9b00137
Cameretti, L. F., Sadowski, G., and Mollerup, J. M. (2005). Modeling of Aqueous Electrolyte Solutions with Perturbed-Chain Statistical Associated Fluid Theory. Ind. Eng. Chem. Res. 44, 3355–3362. doi:10.1021/ie0488142
Clenshaw, C. W., and Curtis, A. R. (1960). A Method for Numerical Integration on an Automatic Computer. Numer. Math. 2, 197–205. doi:10.1007/BF01386223
Fang, H.-r., and Saad, Y. (2009). Two Classes of Multisecant Methods for Nonlinear Acceleration. Numer. Linear Algebra Appl. 16, 197–221. doi:10.1002/nla.617
Fitzgerald, J. E., Sudibandriyo, M., Pan, Z., Robinson, R. L., and Gasem, K. A. M. (2003). Modeling the Adsorption of Pure Gases on Coals with the SLD Model. Carbon 41, 2203–2216. doi:10.1016/S0008-6223(03)00202-1
Groh, B., and Mulder, B. (2000). Hard-sphere Solids Near Close Packing: Testing Theories for Crystallization. Phys. Rev. E 61, 3811–3822. doi:10.1103/physreve.61.3811
Gross, J. (2009). A Density Functional Theory for Vapor-Liquid Interfaces Using the PCP-SAFT Equation of State. J. Chem. Phys. 131 (20), 204705. doi:10.1063/1.3263124
Gross, J., and Sadowski, G. (2001). Perturbed-chain SAFT: An Equation of State Based on a Perturbation Theory for Chain Molecules. Ind. Eng. Chem. Res. 40, 1244–1260. doi:10.1021/IE0003887
Iarikov, D. D., Hacarlioglu, P., and Oyama, S. T. (2011). Supported Room Temperature Ionic Liquid Membranes for CO2/CH4 Separation. Chem. Eng. J. 166, 401–406. doi:10.1016/j.cej.2010.10.060
Ilconich, J., Myers, C., Pennline, H., and Luebke, D. (2007). Experimental Investigation of the Permeability and Selectivity of Supported Ionic Liquid Membranes for CO2/He Separation at Temperatures up to 125°C. J. Membr. Sci. 298, 41–47. doi:10.1016/j.memsci.2007.03.056
Ji, X., and Held, C. (2016). Modeling the Density of Ionic Liquids with ePC-SAFT. Fluid Phase Equilibria 410, 9–22. doi:10.1016/j.fluid.2015.11.014
Ji, X., Held, C., and Sadowski, G. (2012). Modeling Imidazolium-Based Ionic Liquids with ePC-SAFT. Fluid Phase Equilibria 335, 64–73. doi:10.1016/j.fluid.2012.05.029
Ji, X., Held, C., and Sadowski, G. (2014). Modeling Imidazolium-Based Ionic Liquids with ePC-SAFT. Part II. Application to H2S and Synthesis-Gas Components. Fluid Phase Equilibria 363, 59–65. doi:10.1016/j.fluid.2013.11.019
Kresge, C. T., Leonowicz, M. E., Roth, W. J., Vartuli, J. C., and Beck, J. S. (1992). Ordered Mesoporous Molecular Sieves Synthesized by a Liquid-crystal Template Mechanism. Nature 359, 710–712. doi:10.1038/359710a0
Lee, L. L. (2016). Molecular Thermodynamics of Nonideal Fluids. Oxford, United Kingdom: Butterworth-Heinemann.
Li, S., Li, Z., Medina, D., Lew, C., and Yan, Y. (2005). Organic-functionalized Pure-Silica-Zeolite MFI Low-K Films. Chem. Mater. 17, 1851–1854. doi:10.1021/cm048171g
Li, Z., and Wu, J. (2006). Density Functional Theory for Planar Electric Double Layers: Closing the gap between Simple and Polyelectrolytes. J. Phys. Chem. B 110, 7473–7484. doi:10.1021/jp060127w
MacDowell, N., Florin, N., Buchard, A., Hallett, J., Galindo, A., Jackson, G., et al. (2010). An Overview of CO2 Capture Technologies. Energ. Environ. Sci. 3, 1645–1669. doi:10.1039/C004106H
Maddox, M. W., Olivier, J. P., and Gubbins, K. E. (1997). Characterization of MCM-41 Using Molecular Simulation: Heterogeneity Effects. Langmuir 13, 1737–1745. doi:10.1021/la961068o
Mairhofer, J., and Gross, J. (2017). Numerical Aspects of Classical Density Functional Theory for One-Dimensional Vapor-Liquid Interfaces. Fluid Phase Equilibria 444, 1–12. doi:10.1016/j.fluid.2017.03.023
Mirzaei, M., Badiei, A. R., Mokhtarani, B., and Sharifi, A. (2017). Experimental Study on CO 2 Sorption Capacity of the Neat and Porous Silica Supported Ionic Liquids and the Effect of Water Content of Flue Gas. J. Mol. Liquids 232, 462–470. doi:10.1016/j.molliq.2017.02.104
Nandiyanto, A. B. D., Kim, S.-G., Iskandar, F., and Okuyama, K. (2009). Synthesis of Spherical Mesoporous Silica Nanoparticles with Nanometer-Size Controllable Pores and Outer Diameters. Microporous Mesoporous Mater. 120, 447–453. doi:10.1016/j.micromeso.2008.12.019
Nold, A., Goddard, B. D., Yatsyshin, P., Savva, N., and Kalliadasis, S. (2017). Pseudospectral Methods for Density Functional Theory in Bounded and Unbounded Domains. J. Comput. Phys. 334, 639–664. doi:10.1016/j.jcp.2016.12.023
Pinilla, C., Del Pópolo, M. G., Lynden-Bell, R. M., and Kohanoff, J. (2005). Structure and Dynamics of a Confined Ionic Liquid. Topics of Relevance to Dye-Sensitized Solar CellsTopics of Relevance to Dye-Sensitized Solar Cells. J. Phys. Chem. B 109, 17922–17927. doi:10.1021/jp052999o
P. Wasserscheid, and W. Thomas (Editors) (2008). Ionic Liquids in Synthesis (John Wiley and SonsWiley-VCH).
Qiao, Y., Lian, C., Lu, B., and Wu, J. (2018). Modeling Selective Ion Adsorption into Cylindrical Nanopores. Chem. Phys. Lett. 709, 116–124. doi:10.1016/j.cplett.2018.08.047
Ramdin, M., de Loos, T. W., and Vlugt, T. J. H. (2012). State-of-the-Art of CO2 Capture with Ionic Liquids. Ind. Eng. Chem. Res. 51, 8149–8177. doi:10.1021/ie3003705
Ren, J., Wu, L., and Li, B.-G. (2012). Preparation and CO2 Sorption/Desorption of N-(3-Aminopropyl)Aminoethyl Tributylphosphonium Amino Acid Salt Ionic Liquids Supported into Porous Silica Particles. Ind. Eng. Chem. Res. 51, 7901–7909. doi:10.1021/ie2028415
Romanos, G. E., Schulz, P. S., Bahlmann, M., Wasserscheid, P., Sapalidis, A., Katsaros, F. K., et al. (2014). CO2 Capture by Novel Supported Ionic Liquid Phase Systems Consisting of Silica Nanoparticles Encapsulating Amine-Functionalized Ionic Liquids. J. Phys. Chem. C 118, 24437–24451. doi:10.1021/jp5062946
Rosenfeld, Y. (1989). Free-energy Model for the Inhomogeneous Hard-Sphere Fluid Mixture and Density-Functional Theory of Freezing. Phys. Rev. Lett. 63, 980–983. doi:10.1103/physrevlett.63.980
Rosenfeld, Y., Schmidt, M., Löwen, H., and Tarazona, P. (1997). Fundamental-measure Free-Energy Density Functional for Hard Spheres: Dimensional Crossover and Freezing. Phys. Rev. E 55, 4245–4263. doi:10.1103/PhysRevE.55.4245
Roth, R., Evans, R., Lang, A., and Kahl, G. (2002). Fundamental Measure Theory for Hard-Sphere Mixtures Revisited: the White Bear Version. J. Phys. Condens. Matter 14, 12063–12078. doi:10.1088/0953-8984/14/46/313
Roth, R. (2010). Fundamental Measure Theory for Hard-Sphere Mixtures: a Review. J. Phys. Condens. Matter 22, 063102. doi:10.1088/0953-8984/22/6/063102
Santos, E., Albo, J., and Irabien, A. (2014). Acetate Based Supported Ionic Liquid Membranes (SILMs) for CO2 Separation: Influence of the Temperature. J. Membr. Sci. 452, 277–283. doi:10.1016/j.memsci.2013.10.024
Sauer, E., and Gross, J. (2017). Classical Density Functional Theory for Liquid-Fluid Interfaces and Confined Systems: A Functional for the Perturbed-Chain Polar Statistical Associating Fluid Theory Equation of State. Ind. Eng. Chem. Res. 56, 4119–4135. doi:10.1021/acs.iecr.6b04551
Shen, G., Held, C., Lu, X., and Ji, X. (2015). Modeling Thermodynamic Derivative Properties of Ionic Liquids with ePC-SAFT. Fluid Phase Equilibria 405, 73–82. doi:10.1016/j.fluid.2015.07.018
Shen, G., Ji, X., and Lu, X. (2013). A Hybrid Perturbed-Chain SAFT Density Functional Theory for Representing Fluid Behavior in Nanopores. J. Chem. Phys. 138, 224706. doi:10.1063/1.482507810.1063/1.4808160
Shen, G., Laaksonen, A., Lu, X., and Ji, X. (2018). Developing Electrolyte Perturbed-Chain Statistical Associating Fluid Theory Density Functional Theory for CO2 Separation by Confined Ionic Liquids. J. Phys. Chem. C 122, 15464–15473. doi:10.1021/acs.jpcc.8b04120
Shen, G., Sun, Y., Zhang, X., Gao, X., Qian, Y., Lu, X., et al. (2021). Partition and Selectivity of Electrolytes in Cylindrical Nanopores with Heterogeneous Surface Charge. J. Mol. Liquids 340, 116839. doi:10.1016/j.molliq.2021.116839
Shen, Y., and Hung, F. R. (2017). A Molecular Simulation Study of Carbon Dioxide Uptake by a Deep Eutectic Solvent Confined in Slit Nanopores. J. Phys. Chem. C 121, 24562–24575. doi:10.1021/acs.jpcc.7b07315
Shi, W., and Luebke, D. R. (2013). Enhanced Gas Absorption in the Ionic Liquid 1-N-Hexyl-3-Methylimidazolium Bis(trifluoromethylsulfonyl)amide ([hmim][Tf2N]) Confined in Silica Slit Pores: A Molecular Simulation Study. Langmuir 29, 5563–5572. doi:10.1021/la400226g
Siderius, D. W., and Gelb, L. D. (2011). Extension of the steele 10-4-3 Potential for Adsorption Calculations in Cylindrical, Spherical, and Other Pore Geometries. J. Chem. Phys. 135, 084703. doi:10.1063/1.3626804
Sun, Y., Lu, X., Shen, G., and Ji, X. (2021). Accelerate the ePC-SAFT-DFT Calculation with the Chebyshev Pseudospectral Collocation Method. Ind. Eng. Chem. Res. 60, 9269–9285. doi:10.1021/acs.iecr.1c01077
Sun, Y., Schemann, A., Held, C., Lu, X., Shen, G., and Ji, X. (2019). Modeling Thermodynamic Derivative Properties and Gas Solubility of Ionic Liquids with ePC-SAFT. Ind. Eng. Chem. Res. 58, 8401–8417. doi:10.1021/acs.iecr.9b00254
Tripathi, S., and Chapman, W. G. (2005). Microstructure of Inhomogeneous Polyatomic Mixtures from a Density Functional Formalism for Atomic Mixtures. J. Chem. Phys. 122, 094506. doi:10.1063/1.1853371
Walker, H. F. (2011). Anderson Acceleration: Algorithms and Implementations. WPI Math. Sciences Dept. Report MS-6-15-50. Available at: https://users.wpi.edu∼walker/Papers/anderson_accn_algs_imps.pdf.
Walker, H. F., and Ni, P. (2011). Anderson Acceleration for Fixed-point Iterations. SIAM J. Numer. Anal. 49, 1715–1735. doi:10.1137/10078356X
Xu, X., Cao, D., and Wang, W. (2008). Orientation of Rod Molecules in Selective Slits: a Density Functional Theory. J. Phys. Condens. Matter 20, 425221. doi:10.1088/0953-8984/20/42/425221
Yang, X., and Yue, X. (2007). Adsorption and Structure of Lennard-Jones Model Fluid in Slit-like Amorphous Silica Nanopores. Colloids Surf. A: Physicochemical Eng. Aspects 301, 166–173. doi:10.1016/j.colsurfa.2006.12.057
Yatsyshin, P., Savva, N., and Kalliadasis, S. (2012). Spectral Methods for the Equations of Classical Density-Functional Theory: Relaxation Dynamics of Microscopic Films. J. Chem. Phys. 136, 124113. doi:10.1063/1.3697471
Yu, Y.-X., and Wu, J. (2002a). Density Functional Theory for Inhomogeneous Mixtures of Polymeric Fluids. J. Chem. Phys. 117, 2368–2376. doi:10.1063/1.1491240
Yu, Y.-X., and Wu, J. (2002b). Structures of Hard-Sphere Fluids from a Modified Fundamental-Measure Theory. J. Chem. Phys. 117, 10156–10164. doi:10.1063/1.1520530
Zhang, J., Zhang, Q., Li, X., Zhang, Q., Li, X., Liu, S., et al. (2010). Nanocomposites of Ionic Liquids Confined in Mesoporous Silica Gels: Preparation, Characterization and Performance. Phys. Chem. Chem. Phys. 12, 1971–1981. doi:10.1039/b920556j
Zhang, J., Zhang, S., Dong, K., Zhang, Y., Shen, Y., and Lv, X. (2006). Supported Absorption of CO2 by Tetrabutylphosphonium Amino Acid Ionic Liquids. Chem. Eur. J. 12, 4021–4026. doi:10.1002/chem.200501015
Keywords: density functional theory, algorithm, ionic liquids, CO2, electrolyte perturbed-chain statistical associating fluid theory (ePC-SAFT)
Citation: Sun Y, Dai Z, Shen G, Lu X, Ling X and Ji X (2022) Accelerate the Electrolyte Perturbed-Chain Statistical Associating Fluid Theory–Density Functional Theory Calculation With the Chebyshev Pseudo-Spectral Collocation Method. Part II. Spherical Geometry and Anderson Mixing. Front. Chem. 9:801551. doi: 10.3389/fchem.2021.801551
Received: 25 October 2021; Accepted: 14 December 2021;
Published: 24 January 2022.
Edited by:
Heribert Reis, National Hellenic Research Foundation, GreeceReviewed by:
Rolf Stierle, University of Stuttgart, GermanyCopyright © 2022 Sun, Dai, Shen, Lu, Ling and Ji. This is an open-access article distributed under the terms of the Creative Commons Attribution License (CC BY). The use, distribution or reproduction in other forums is permitted, provided the original author(s) and the copyright owner(s) are credited and that the original publication in this journal is cited, in accordance with accepted academic practice. No use, distribution or reproduction is permitted which does not comply with these terms.
*Correspondence: Xiang Ling, eGxpbmdAbmp0ZWNoLmVkdS5jbg==; Xiaoyan Ji, eGlhb3lhbi5qaUBsdHUuc2U=
Disclaimer: All claims expressed in this article are solely those of the authors and do not necessarily represent those of their affiliated organizations, or those of the publisher, the editors and the reviewers. Any product that may be evaluated in this article or claim that may be made by its manufacturer is not guaranteed or endorsed by the publisher.
Research integrity at Frontiers
Learn more about the work of our research integrity team to safeguard the quality of each article we publish.