 Sha Yang1,2
 Qinglai Yang
94% of researchers rate our articles as excellent or good
Learn more about the work of our research integrity team to safeguard the quality of each article we publish.
Find out more
REVIEW article
Front. Chem. , 15 November 2021
Sec. Nanoscience
Volume 9 - 2021 | https://doi.org/10.3389/fchem.2021.763495
This article is part of the Research Topic NIR-II Fluorophore and Imaging View all 11 articles
Near-Infrared-II (NIR-II) bioimaging is a newly emerging visualization modality in real-time investigations of biological processes research. Owning to advances in reducing photon scattering and low tissue autofluorescence levels in NIR-II region (1,000–1700 nm), NIR-II bioimaging affords high resolution with increasing tissue penetration depth, and it shows greater application potential for in vivo detection to obtain more detailed qualitative and quantitative parameters. Herein, this review summarizes recent progresses made on NIR-II bioimaging for quantitative analysis. These emergences of various NIR-II fluorescence, photoacoustic (PA), luminescence lifetime imaging probes and their quantitative analysis applications are comprehensively discussed, and perspectives on potential challenges facing in this direction are also raised.
Recent studies have showed that bioimaging in the second near-infrared window (NIR-II, 1,000–1700 nm) can be reduced by photon scattering and tissue autofluorescence, leading to a better spatial-temporal resolution and deeper tissue penetration than that of conventional UV-Vis-NIR window (200–1,000 nm) (Smith et al., 2009; Welsher et al., 2009; Hong et al., 2014; Diao et al., 2015a). NIR-II bioimaging holds tremendous potential for real-time, non-invasive, and multi-dimensional investigations (Hong et al., 2017; Fan et al., 2018; Fu et al., 2021) in vivo biological processes. In recent years, to further understand the mechanisms of biological processes, especially for diseases related systems, researchers have spared no efforts to produce superior NIR-II contrast agents (Cai et al., 2019; Zhu et al., 2019; Yang Q. et al., 2021; Lei and Zhang, 2021), and to develop advanced NIR-II bioimaging technologies (Liu P. et al., 2020; Luo et al., 2020) (Zhao et al., 2020).
The desirable NIR-II contrast agents demand high performance of optical properties, biocompatibility, activatability, and chemical modification. They have gone through the development process from inorganic to organic materials as well as from polymer macromolecules to small molecules. Inorganic materials have been developed, for example, carbon nanotubes (Robinson et al., 2012; Diao et al., 2015b; Hong and Dai, 2016), quantum dots (QDs) (Dong et al., 2013; Zhu et al., 2013; Liu P. et al., 2020; Liu H. et al., 2020; Yang H. et al., 2021), and rare Earth nanoparticles (Naczynski et al., 2013; Villa et al., 2014; Kong et al., 2019), have been employed as NIR-II fluorophores, and NIR-II organic materials have also been synthesized, such as donor-acceptor (D-A) conjugate polymer or molecule (Antaris et al., 2016; Zhang et al., 2016; Jiang et al., 2019; Gao et al., 2020), cyanine/polymethine/bodipy molecule (Zhu et al., 2018a; Shi et al., 2018; Lei et al., 2019; Godard et al., 2020; Bian et al., 2021; Cosco et al., 2021), and organometallic complex (Yang et al., 2018; Shen et al., 2021). Due to the improvement of NIR-II contrast agents and traditional UV-Vis-NIR bioimaging technologies (Fluorescence, Photoacoustic, Fluorescence-Lifetime, etc.), NIR-II bioimaging technology has gained rapid development recently, providing versatile platforms for in vivo bioimaging from macroscopic of tissues (Welsher et al., 2011; Hong et al., 2012; Yang et al., 2018; Kong et al., 2019; Zheng et al., 2019), organs (Zhu et al., 2018b; Kong et al., 2019) and tumors (Zhu et al., 2017; Sheng et al., 2018) to micron-level of vessels (Liu et al., 2020c), lymph (Antaris et al., 2016; Tian et al., 2020), and cells (Chen et al., 2018; Liao et al., 2021)and from two-dimensional (2D) to three-dimensional (3D) with a greater degree of clarity, such as the NIR-II surgical navigation system (Suo et al., 2019; Yu et al., 2019), NIR-II confocal/spinning-disc confocal microscope (Zhu et al., 2018b; Zubkovs et al., 2018), NIR-II light sheet microscope (Wang F. et al., 2019; Wang F. et al., 2021), NIR-II two-photon/multiphoton microscope (Qi et al., 2018), and NIR-II fluorescence lifetime microscope (Yu et al., 2019).
Traditional UV-Vis-NIR bioimaging technologies have been applied in a variety of in vitro quantitative analysis, but such tissue penetration depth is generally impractical in vivo. Fortunately, the combination of superior NIR-II contrasts and advanced NIR-II bioimaging technologies can provide more detailed image parameters, which is suitable for in vivo quantitative analysis to understand biological process. In this review, we have summarized various types of NIR-II probes for in vivo quantitative analysis applications, including NIR-II fluorescence imaging (Welsher et al., 2011; Wang F. et al., 2019; Yu et al., 2019; Liu et al., 2020c; Tian et al., 2020), NIR-II ratiometric fluorescence/photoacoustic imaging (Ye et al., 2020; Wang et al., 2021b; Wang et al., 2021c; Fu et al., 2021), and NIR-II fluorescence-lifetime imaging (Fan et al., 2018; Zhao et al., 2020) for in vivo quantitative analysis, and also raised perspectives on potential challenges facing in this direction (Figure 1).
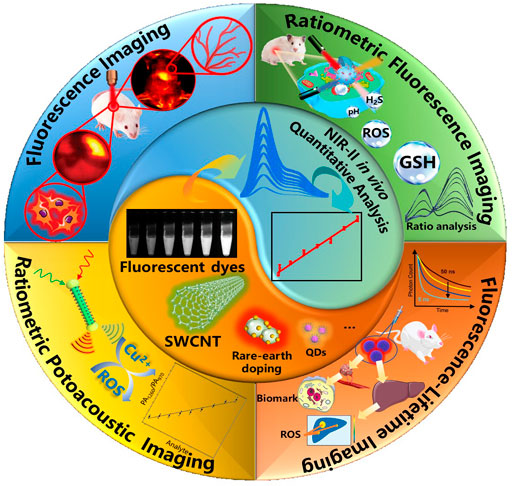
FIGURE 1. Schematic illustration of NIR-II bioimaging for in vivo quantitative analysis.
Compared with NIR-I bioimaging, NIR-II bioimaging has attracted much more attentions in vivo imaging due to its deeper penetration depth (∼cm) and superior imaging resolutions (∼μm) (Monici, 2005; Welsher et al., 2009; Diao et al., 2015a; Cai et al., 2019), especially suitable for in situ imaging of tissues/organs in small animal models for fundamental and preclinical researches. Therefore, NIR-II bioimaging can also be suitable for most of the applications used by UV-Vis-NIR bioimaging in in vitro examination.
Zhu et al. have used a home-built microarray assay screening method and a home-built microscope setup to evaluate the activity of the bioconjugate between NIR-II fluorophore IR-FGP and protein (IR-FGP@protein) in a fluorescence intensity quantitative manner (Zhu et al., 2017). Incubated with IR-FGP@protein or Erbitux@IR-FGP conjugate, the spots showed bright fluorescence emission. The selective binding between serum albumin (SA) and biotin or Erbitux (Erb) and epidermal growth factor receptor (EGFR) proved the IR-FGP molecular selectivity (Figures 2A–C). The cross-sectional line outlines of the fluorescence intensity at the two detection points clearly indicated that the signal-to-background ratio (SBR) had increased significantly after density gradient ultracentrifugation (DGU) purification (Figure 2B). After DGU separation, Erb@IR-FGP conjugates showed increased microarray assay positive/negative (P/N) ratios (EGFR+ and EGFR−) from 1.1 (pre-DGU) to 5.3 (Figure 2D). Molecular imaging of cells labeled with Erb@IR-FGP conjugate showed that the fluorescence from EGFR+ SCC cells was stronger than that of EGFR-U87MG cells (Figures 2E,F), which also showed an excellent selectivity.
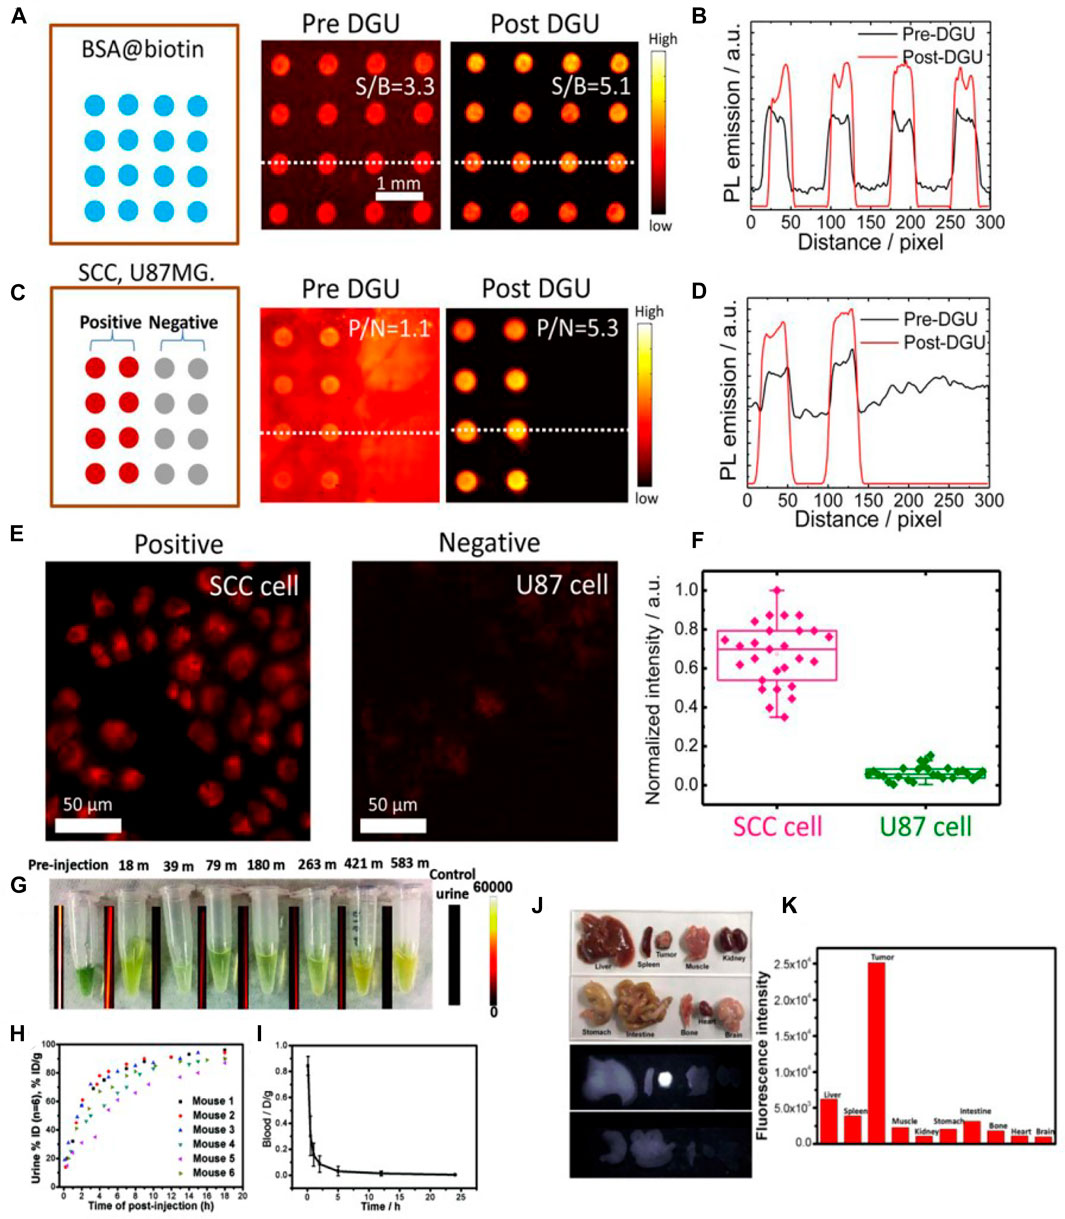
FIGURE 2. The microarray assay screening method developed to test the conjugates. (A) Assay analysis of DGU fraction of SA@IR-FGP. (B) Cross-sectional intensity profile of the spot signal. (C,D) Assay analysis of the DGU fractions of Erb@IR-FGP. SCC and U87 cell lysates were printed on plasmonic fluorescence-enhancing gold slides for testing the conjugate Erb@IR-FGP. (E) Targeted cell staining by Erb@IR-FGP (SCC and U87 cell lines as positive and negative controls) scanned by a home-built microscope with 785 nm excitation and a 1,050 nm long-pass emission filter. (F) PL intensity statistic of SCC and U87 cells (reproduced from (Zhu et al., 2017) with permission from National Academy of Sciences.) (G) Collections of urine of mice injected with NIR-II fluorophore IR-BGP6 and their corresponding fluorescence images. (H) Quantification of renal excretion of IR-BGP6 by calculation of its amount in urine. ≈ 91% IR-BGP6 can be renally excreted within the first 10 h p. i. (I) The blood circulation behavior of IR-BGP6. The fast-renal excretion of IR-BGP6 corresponded to the short blood circulation half-life time (≈24 min). (J) Major organs and tumors taken from mice injected with anti-PD-L1-BGP6 at 24 p. i. and their corresponding fluorescence imaging in the NIR-II window (>1000 nm). (K) Quantification of biodistribution of anti-PD-L1-BGP6 (reproduced from (Wan et al., 2018) with permission from Wiley-VCH Verlag GmbH and Co. KGaA, Weinheim).
Wan et al. have used the NIR-II in vitro fluorescence quantitative method to determine the pharmacokinetics of NIR-II fluorophore IR-BGP6 in normal mice, and also to survey the biodistribution of the conjugate anti-PD-L1-BGP6 in MC38 tumor-bearing mice (Wan et al., 2018). Attribute to the avoidance of NIR-II fluorescence in body fluid’s autofluorescence, the renal excretion kinetics was obtained through collecting urine with the accumulated fluorescence intensity in the NIR-II window after 24 h (Figure 2G). For a better observation, ≈91% of IR-BGP6 was excreted through urine from most mice within the first 10 h p. i. (Figure 2H). Similarly, the examination for blood half-life time, the percentage of IR-BGP6 in blood was ≈84.3% ID g−1at 6 min p. i. and declined to ≈15.8% ID g−1 at 1 h p. i, showing a blood half-life time of ≈24 min, in consistent with the fast renal excretion kinetics (Figure 2I). Quantification of the imaging of in vitro organs taken from mice inoculated with anti-PD-L1-BGP6, the biodistribution at 24 h p. i. showed that most anti-PD-L1-BGP6 accumulated within tumors in contrast to the relatively low remaining within other major organs (Figures 2J,K). Although these methods are derived from the traditional UV-Vis-NIR technology, the uniqueness advantages of NIR-II in vitro quantitative analysis make it indispensable in the NIR-II materials research.
Point of care testing (POCT), known as near-patient testing, includes rapid response to facilitate pathological decisions, as well as ease of use. Fluorescent lateral flow immunoassay (LFA) is a popular diagnostic tool used in POCT. However, body fluid detection using LFA with fluorescent labels is still facing the challenges of autofluorescence interference, light absorption, and scattering in UV-Vis-NIR region. It is clear that NIR-II fluorescence can well be done to solve this problem. Li et al. established an LFA platform using Yb, Er, Ce co-doped core-shell-shell-shell nanoparticles (Er, Ce-CSSS) with 1,550 nm emission as fluorescent labels (Figure 3A) (Li et al., 2021). Er,Ce-CSSS-antibody probe was pre-mixed with AFP antigen, then the complex was trapped by the capture antibody on test (T) line, while the excess Er,Ce-CSSS-antibody probe continued to move until it bound with the second antibody on control (C) line. Then, the strips were placed into the designed imaging system to collect the luminescence signals (Figure 3B). To evaluate the quantitative detection capability of this NIR-II LFA, a calibration curve for AFP detection in hemolysis was established by preparing a series of AFP standard in negative hemolytic samples (Figures 3C,D). As the calibration curve showed that the limit of detection (LOD) of AFP in hemolysis was determined to be 1.00 ng/ml, which was 20 times lower than the clinical cut-off value of 20 ng/ml. To verify the high reliability of NIR-II LFA platform, the assay reproducibility was examined by testing 10 strips with AFP samples at the concentration of 120 ng/ml and 200 ng/ml, respectively. The T/C ratios were highly centralized with a CV of 3.6 and 4.9%, respectively (Figure 3E). To further study the specificity of NIR-II LFA, AFP as well as general clinical biomarkers that were usually detected in blood, such as carcino-embryonic antigen (CEA), C-reactive protein (CRP), procalcitonin (PCT), and serum amyloid protein A (SAA) (Figure 3F). The T/C ratio of AFP was markedly higher than that of other analytes, indicating that NIR-II LFA is a specific POCT method. As these advantages of the above-mentioned in NIR-II materials researches and POCT, NIR-II in vitro quantitative methods are suitable for most application scenarios of the traditional UV-Vis-NIR methods, and form supplements for its deficiencies.
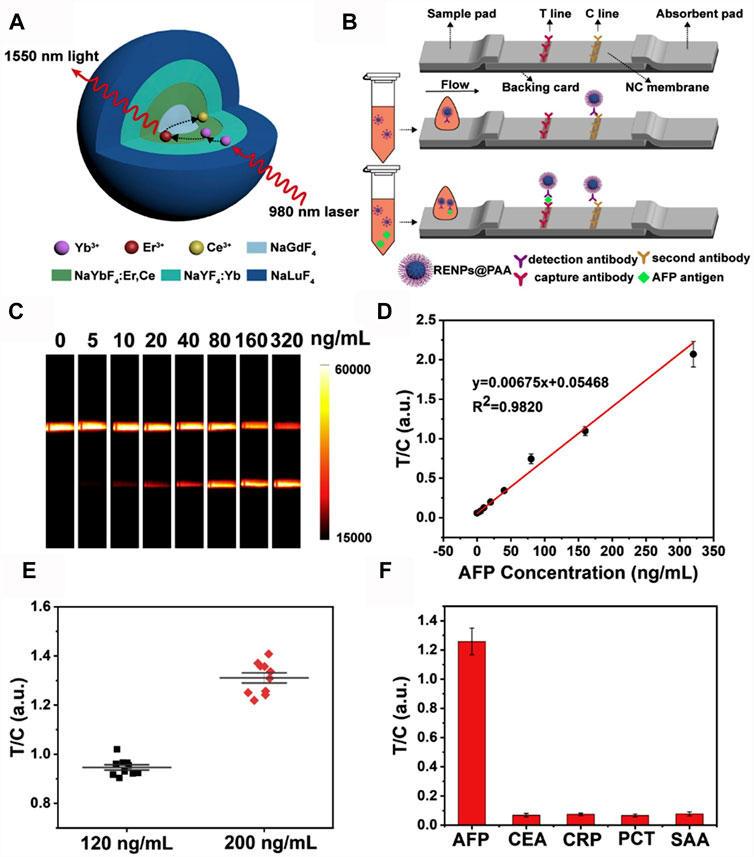
FIGURE 3. NIR-II rare-earth nanoparticles for a lateral flow immunoassay in hemolysis (A) Structural design of the Yb, Er/Ce co-doped NIR-II rare-earth nanoparticles (Er,Ce-CSSS) with 1,550 nm emission under 980 nm excitation. (B) Schematic illustration of NIR-II rare-earth nanoparticles based lateral flow immunoassay platform (NIR-II LFA). (C) Strip images of AFP standards spiked in hemolysis by NIR-II LFA test. Exposure time was 100 ms. (D) The calibration curve for AFP detection in hemolysis. Error bars represent the stand deviations calculated from three separate experiments. (E) Reproducibility of NIR-II LFA for AFP detection at the concentrations of 120 ng/ml and 200 ng/ml. (F) Specificity test of NIR-II LFA using different biomarkers. The concentrations of CEA, CRP, PCT and SAA were 10 times higher than that of AFP (reproduced from (Li et al., 2021) with permission from Elsevier B.V).
A goal of ideal in vivo bioimaging technology is to achieve high-fidelity and real-time quantitative analysis for in situ visualization monitoring. In situ quantitative analysis in vivo can provide the dynamic information of biological processes in real time, which is significance to explore the pathogenesis of diseases (Wan et al., 2019; Liu P. et al., 2020). Compared with the clinical in vivo bioimaging technology, such as PET-CT, MRI, and ultrasound imaging, the tissue penetration depth of NIR-II bioimaging is only centimeter level, but it has the advantages of high temporal resolutions (∼ms) for real-time monitoring and high resolutions (∼μm) for micro-quantitative detections, which can be performed in situ quantitative analysis in vivo of small animal models for fundamental researches, and give opportunities to achieve the above goal. As traditional Vis-NIR bioimaging technologies, the basic primary function of NIR-II in vivo bioimaging is to distinguish the pathological targets from surrounding tissues (signal-to-noise ratio: S/N value) by the fluorescence quantification. With the development of NIR-II probes and instrument technologies as well as the powerful data processing capabilities by computational evaluation, more quantitative information can be obtained through NIR-II in vivo bioimaging.
Welsher et al. have performed in vivo imaging of mice during intravenous injection of single-walled carbon nanotubes (SWNTs), using NIR-II in vivo imaging setup to observe the process of SWNTs circulate through the lungs and kidneys in several seconds (Figure 4A), and the spleen and liver at slightly later time points (Welsher et al., 2011). Dynamic contrast-enhanced imaging through principal component analysis (PCA) was performed to obtain the anatomical resolution of organs as a function of time post-injection (Figure 4B). Importantly, PCA is a common statistical processing method for compressing high-dimensional data into a lower-dimensional form by choosing only the highest variance components of the dataset, which is a powerful tool for analyzing time related activity (Ringner, 2008; Abdi and Williams, 2010). NIR-II in vivo bioimaging combined with PCA analysis has represented a powerful approach to high-resolution optical imaging through deep tissues and been useful for a wide range of applications in biomedical researches. Liu et al. performed NIR-II in vivo imaging and PCA analysis in cerebrovascular diseases with an ischemic stroke model (Liu et al., 2019). Brain vessel imaging with NIR-II gold clusters was gathered via tail intravenous injection. It could be clearly observed the intensity of neovascularization in the left brain, the injured left brain exhibited more arterial vessels compared with the right brain (Figure 4C). PCA analysis could distinguish that the red and blue vessels are arterial and venous vessels, respectively. It showed the significant red signal (red arrow) in the left brain (Figure 4D). The dynamic blood perfusion was also evaluated by normalizing NIR-II fluorescence signal in the arterial vessels of both the left and right brain, and the results showed that blood perfusion rate of the injured left brain was 0.11 s−1, which was two times lower than the normal right brain of 0.24 s−1 (Figure 4E).
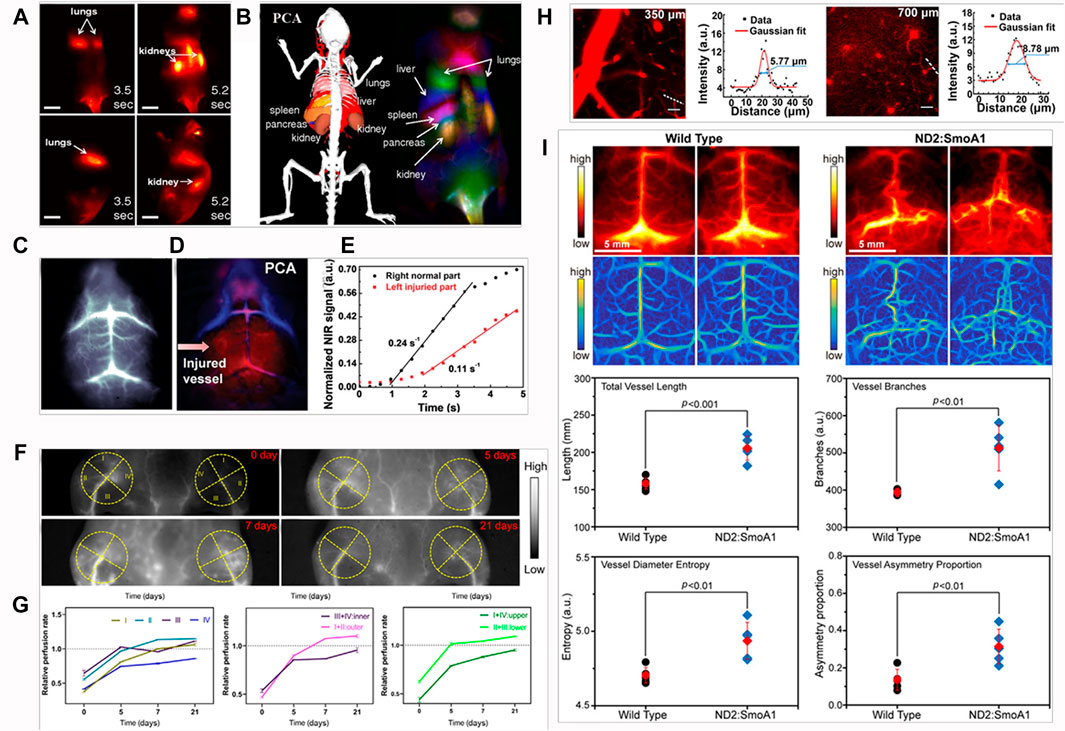
FIGURE 4. Examples of NIR-II fluorescence imaging for in vivo quantitative analysis. (A) Frames from video imaging of mice injected with NIR-II fluorophore SWNTs. (B) Dynamic contrast-enhanced imaging with SWNTs through PCA. This feature is not observable in the raw time-course images (reproduced from (Welsher et al., 2011)with permission from National Academy of Sciences.). (C) Dynamic brain imaging of stroke mouse. (D) PCA overlaid images with arterial (red) and venous (blue) vessels of stroke mouse, indicating more significant injured signal in the left brain. (E) Blood perfusion of stroke mouse, showing slower blood flow in the injured left brain than the health right brain. Errors bars indicate the standard deviation of each group (reproduced from (Liu et al., 2019) with permission from WILEY-VCH Verlag GmbH and Co. KGaA, Weinheim.). (F) NIR-II fluorescence images of hindlimb vessels at 0, 5, 7 and 21 days postischemia. (G) The relative perfusion rate of four quadrants, upper and lower quadrants, inner and outer quadrants (reproduced from (Chen et al., 2020)with permission from Tsinghua University Press and Springer-Verlag GmbH Germany, part of Springer Nature). (H) In vivo NIR-II fluorescence confocal scanning microscopic images of mouse brain vasculature at 350 and 700 μm depth, and the Gaussian fits to the profiles along the capillary vessels indicated by the white-dashed lines (reproduced from (Yu et al., 2019) with permission from Elsevier B.V. and Science China Press.). (I) In vivo NIR-II fluorescence images (top panel) and Hessian-matrix-enhanced images (bottom panel) of cerebral vasculature of wild-type C57BL/6 mice and ND2:SmoA1 mice (n = 5). Red data are reported as mean: standard deviation (reproduced from with permission (Liu et al., 2020c)from Wiley-VCH GmbH.).
NIR-II fluorescence quantitative analysis not just allows us to monitor neovascularization of damaged brain tissue after a stroke, more importantly, it shows a great promise in tracking the pathophysiological process of neovascularization dynamically in vivo. Chen et al. have studied the mechanism of neovascularization in hindlimb vessels, and analyzed the spatial distribution of neovascularization (Chen et al., 2020). NIR-II fluorescence images of hindlimb vessels at 0, 5, 7, and 21 days postischemia, four quadrants were divided as shown in the yellow dots (Figure 4F). The relative perfusion rates were calculated by fluorescence intensity quantification. The results showed that all quadrant rates increased with time, except for that of III quadrants from 5 to 7 days post-ischemia, and the outer quadrant rate was more than that of the inner quadrant from 5 to 21 days postischemia, the lower quadrant rate was more than that of the upper quadrant in 3 weeks postischemia (Figure 4G). This suggested that the restoration of blood flow perfusion was better in these quadrants, possibly because of the higher volume of newly formed blood vessels. Notably, the relative perfusion rates of III and lower quadrants at 5 days post-ischemia, II, outer and lower quadrants at 7 days postischemia, I, II, III, outer and lower quadrants at 21 days postischemia were more than 1. It indicated that the blood flow perfusion of these quadrants at these time points had exceeded that of pre-ischemia due to neovascularization during 3 weeks postischemia.
In terms of the vasculature research, more quantitative information can be obtained via NIR-II in vivo bioimaging. Yu et al. have integrated the advantages of NIR-II fluorescence confocal microscopic with high spatio-temporal resolution and NIR-II aggregation-induced emission (AIE) dots with high brightness, high-resolution in vivo cerebrovascular imaging of a mouse, the spatial resolution at 350 and 700 μm depth could reach 5.77 and 8.78 μm, respectively (Figure 4H) (Yu et al., 2019). Liu et al. have assessed and quantified the vascular morphology of the transgenic brain tumors with vascular segmentation and quantification algorithm (Liu et al., 2020c). Based on a modified Hessian matrix method (Yang et al., 2014), the Hessian-matrix-enhanced images were generated from the original in vivo fluorescence images. By using the extracted enhanced image and identified centerlines, the vascular morphology of transgenic brain tumors in terms of the vessel lengths, vessel branches, and vessel symmetry was quantitatively analyzed, which showed statistically significant differences from the wild type mice (Figure 4I).
In addition to the quantitative research for in vivo target tissues and vasculatures, more interestingly, NIR-II bioimaging can also perform quantitative analyses for target cells fate in vivo. Chen et al. have developed a dual-labeling strategy to in situ visualize the fate of transplanted stem cells in vivo via combining the exogenous NIR-II fluorescence imaging (NIRFL) and endogenous red bioluminescence imaging (BLI) (Chen et al., 2018). The NIR-II Ag2S QDs were employed to dynamically monitor the trafficking and distribution of all transplanted stem cells in vivo, and the BLI of red-emitting firefly luciferase (RfLuc) identified the living stem cells after transplantation in vivo. It was found that both the NIRFI and BLI signal intensities were linearly correlated with the amount of dual-labeled mouse mesenchymal stem cells (mMSCs), with an R2 of 0.985 and 0.989, respectively (Figure 5A). According to the good linear relationship between the number of dual-labeled mMSCs and the NIRFI or BLI signal intensities, the distribution and viability of intravenously transplanted mMSCs were explored in vivo by the combined BLI/NIRFI bioimaging (Figures 5B,C). The amount of accumulated or survived stem cells were quantitatively analyzed after intravenous transplantation, the quantitative results revealed that 32.9% of transplanted mMSCs were accumulated in the lung, and 19.6% of transplanted mMSCs were accumulated in the liver 1 h p.i. (Figure 5D). This facile strategy allows for the quantitative evaluation of cell translocation and viability with a high spatial-temporal resolution.
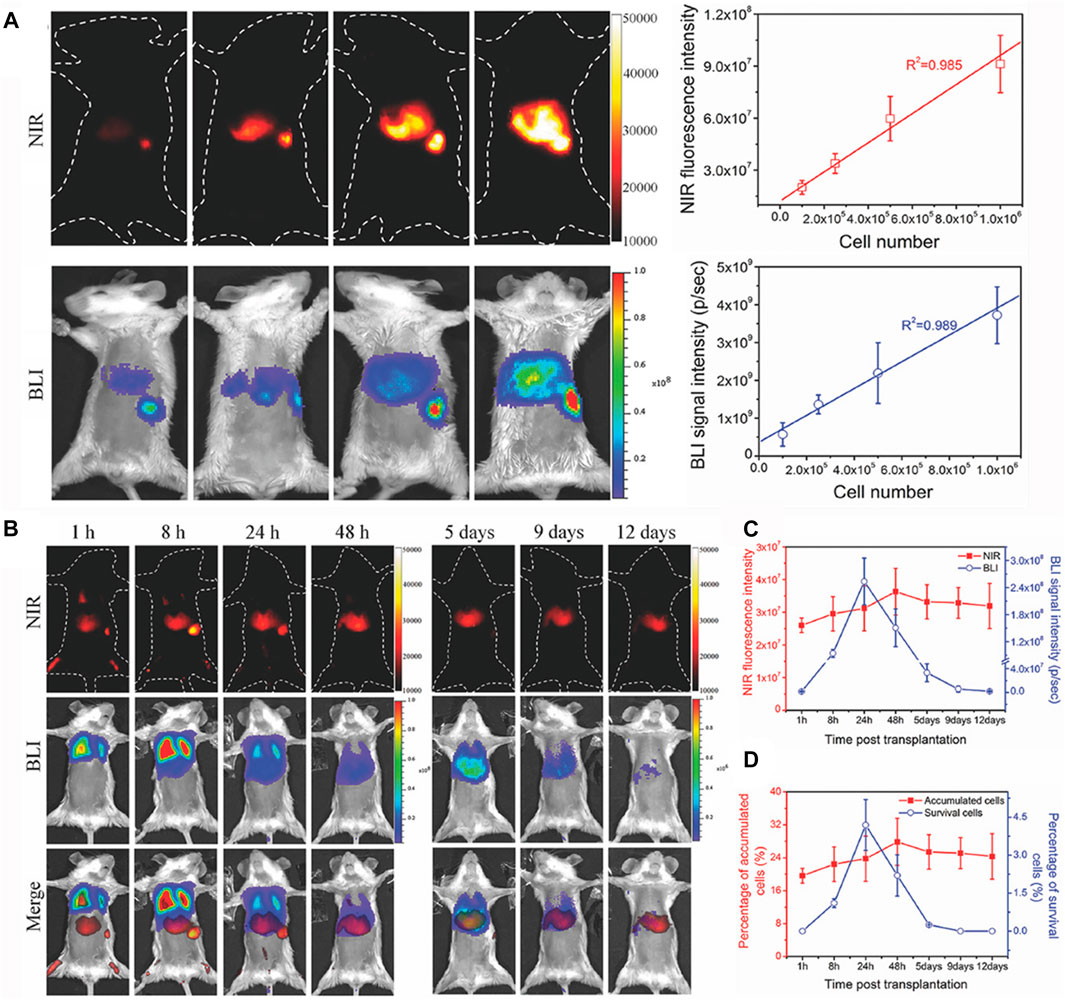
FIGURE 5. In vivo quantitative analysis for cells fate. (A) In vivo imaging and quantifying of RfLuc and Tat-Ag2S QD dual-labeled mMSCs. NIR-II fluorescence images and BLI images of dual-labeled mMSCs after injecting via the spleen in mice, and the linear correlation of the cell numbers of transplanted mMSCs with the NIR-II fluorescence intensities and BLI signals in liver and spleen. (B) In vivo tracking the fate of intravenously transplanted mMSCs for liver regeneration, NIR-II fluorescence images, BLI images, and merged images of mice with acute liver failure. (C) Quantitative analyses of the cell accumulation and survival in liver by the total NIR fluorescence intensities of NIRFI and the total photon flux (photons s−1) of BLI. (D) Quantitative analyses of the accumulation and survival ratios of mMSCs in liver (reproduced from (Chen et al., 2018) with permission from WILEY-VCH Verlag GmbH and Co. KGaA, Weinheim).
Because of high sensitivity, simplicity and fast response time, the application of fluorescent probes in optical imaging and analytical sensing has attracted great attentions (Wu et al., 2017). However, providing only a single emission to quantify a target analyte with fluorescent probes that fraught with challenges due to a variety of analyte-independent factors, such as environmental factors, that interfere with the analysis (Lee et al., 2015). In contrast, ratiometric fluorescence as a potential method has received particular attentions to overcome the limitations of the current intensity-based probes. This technique depends on the changes in the intensity of two or more emission bands that induced by an analyte, leading to an effective internal referencing which improves the sensitivity of the detection. The self-calibration and the unique opto-physical properties of nanoparticles (NPs) that compensates for environmental factors and eliminates most of the fuzziness (Park et al., 2020), which have made the ratiometric fluorescent probes more sensitive and reliable, resulting in more rational detection of the analytes, such as ROS (Wang et al., 2019b), enzymes (Makukhin et al., 2016; Ma et al., 2018) and signal molecules (Bianchi-Smiraglia et al., 2017; Umezawa et al., 2017; Wang et al., 2017), biological ions (Aron et al., 2016; Narayanaswamy et al., 2019) and pH (Gao et al., 2017; Richardson et al., 2017)in vivo or in vitro.
Compared with the traditional NIR-I fluorescence imaging, NIR-II fluorescence imaging can reduce light scattering and background autofluorescence interference to the maximum extent and achieve deeper tissue penetration and higher resolution. Therefore, NIR-II ratiometric fluorescent imaging, based on the advantages of NIR-II fluorescent probes and ratiometric fluorescent probes, can provide a better platform for quantitative analyses in vivo, such as Reactive oxygen species (ROS), GSH, signal molecules and pH responsive quantitative analyses.
ROS is a general term for a class of molecules or ions with active chemical properties and high oxidation activity, including hydrogen peroxide (H2O2), hydroxyl radical (·OH), peroxynitrate (ONOO−), superoxide (O2-), singlet oxygen (1O2) and so on. Excessive ROS can cause damage to some biological macromolecules (such as lipids, nucleic acids and proteins), thereby affecting their normal physiological functions (Trachootham et al., 2009; Brieger et al., 2012). A large number of studies have shown that ROS is closely related to various pathological diseases, such as cancer, atherosclerosis, diabetes, and inflammation (Zhang et al., 2015).
For a NIR-II organic dye and rare Earth nanoparticles (LnNPs) based ratiometric sensing platform, the detection of target species mainly relies on the measurement of the relative intensity ratio change between the fluorescent dyes and nanoparticles. The representative application is to use a specific organic dye that can chromatically respond to the target analytes as energy acceptor or quencher. Liu et al. have synthesized a new type of LnNPs (NaErF4:Ho3+@NaYF4) with three emission bands (1,180, 980, 650 nm). By encapsulating NaErF4:Ho3+@NaYF4 with IR1061 and Fe2+ into a single nanoparticle, a NIR-II ratiometric fluorescence probe (I980/I1180) was synthesized (Liu et al., 2018). The fluorescence quenching of 980 nm was caused by the strong absorption of IR1061 at 800–1100 nm, and the IR1061 dye was decomposed by the localized OH radicals produced by Fe2+ reacted with H2O2. Subsequently, the 980 nm emission (I980) of LnNPs gradually recovered, at the same time, the emission intensity of 1,180 nm (I1180) kept almost unchanged. With the excellent characteristics of ratiometric I980/I1180, the concentration of H2O2 was measured in vivo. In another work, Wang et al. have developed a NIR-II ratiometric fluorescence probe that is an erbium-doped NaYF4@NaYF4@Cy7.5 composite (RENOUEBDeTcuNQ==) (Figure 6A) (Wang et al., 2019b). As expected, the absorbance of RENOUEBDeTcuNQ== at 808 nm would gradually decrease with the titration of 0–30 μM hypochlorous acid (HClO), while the fluorescence of 1,550 nm would gradually recover under the decreasing 808 nm excitation (Figure 6B). With the constant fluorescence excited by 980 nm light as the reference signal (Figure 6C), the fluorescence ratio (F1550Em,808Ex/F1550Em,980Ex) increased linearly with the concentration of HClO in the range of 0–20 μM (the detection limit:0.5 μM) (Figure 6D). Lymphatic drainage in the hindlimb of mice consists of two lymph nodes and two connective lymph vessels were clearly observed with a precise resolution (Figure 6E). Recently, Cao et al. have constructed a NIR-II ratiometric sensing platform based on cyanine dye (Cy925) and NaYbF4:Er@NaYF4:Yb@NaYF4:Nd nanoparticles (Er-CSSNPs) for the detection of HClO (Cao C. et al., 2019). The Cy925 acted as the HClO sensing component with activatable emission signals at 925 nm wavelength, and the emission of Er-CSSNPs at 1,525 nm wavelength was used as the internal reference. The ratiometric nanoprobe relied on the ratio of aforementioned two separated emission peaks (I925 nm/I1525 nm), which has been verified to be highly sensitive and selective to HClO in vivo.
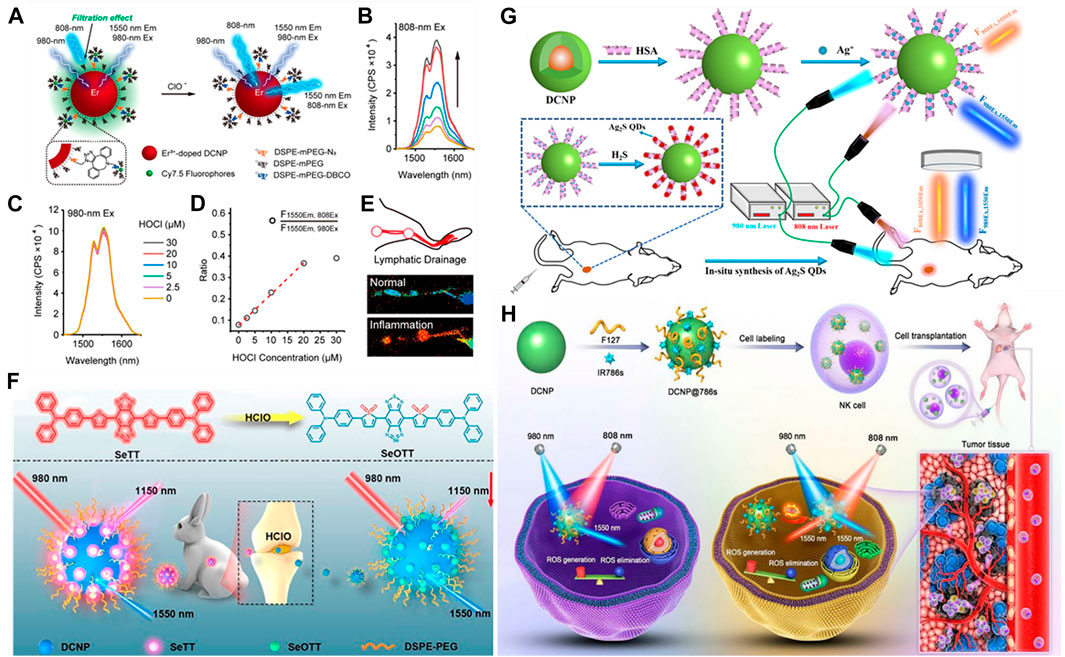
FIGURE 6. Examples of NIR-II ratiometric fluorescence imaging for in vivo quantitative analysis. (A) Schematic illustration showing the ratiometric response of NIR-II fluorophore RENOUEBDeTcuNQ== to HClO based on an ACIE mechanism. Er3+-doped DCNP: NaErxY1-xF4@NaYF4 (x = 0.05, 0.15, 0.5). (B,C) Fluorescence spectra of RENOUEBDeTcuNQ== (10 μM Cy7.5) upon addition of 0–30 μM HClO under 808 and 980 nm excitation, respectively. (D) Plot of fluorescence ratio changes as a function of HClO concentration. (E) Anatomical structures of lymphatic inflammation in ratiometric channel are clearly observed with a precise resolution (reproduced from (Wang et al., 2019b) with permission from American Chemical Society). (F) Schematic illustration showing the ratiometric response of NIR-II fluorophore DCNP@SeTT@PEG: DCNP encapsulated with SeTT and PEG. (reproduced from (Ge et al., 2020) with permission from American Chemical Society). (G) Schematic Illustration of the Design of NIR-II Ratiometric FL Nanoprobe for the Detection of H2S in Colon Cancer Tissues in vivo. (reproduced from (Wang et al., 2021c)with permission from American Chemical Society). (H) Schematic illustration of DCNP@786s with ratiometric NIR-II fluorescent signal for tracking NK cell viability in vivo. (reproduced from (Liao et al., 2021) with permission from WILEY-VCH).
In addition, Ge et al. have designed a novel activated NIR-II fluorescence molecule (SeTT), which was rapid and specific response to hypochlorous acid (HClO) (Ge et al., 2020). In order to obtain a NIR-II ratiometric probe (DCNP@SeTT), SeTT was coated on the surface of Er3+-doped down conversion nanoparticle (DCNP). Under the excitation of 980 nm laser, the ratiometric fluorescence signals of SeTT at 1,150 nm and DCNP at 1,550 nm (I1150/I1550) was linear relationship with HClO level (the detection limit:0.4 μM). The ratiometric nanoprobe successfully studied the concentration of HClO in the process of tumor progression, visualization of anatomical structures of the peritoneal cavity in inflammatory mice model, and quantitatively detected the concentration of HClO in rabbit osteoarthritis model, obtaining rapid response and high selectivity for detection of HClO (Figure 6F).
Interestingly, some researchers have utilized ROS-response for in vivo quantitative analyses for cells fate, for instance, monitoring natural killer cell (NK) cells during adoptive NK cell-based immunotherapy (Guillerey et al., 2016). In NK cells preclinical and clinical studies (Alvarez-Breckenridge et al., 2012), it is still an urgent need to track cell activity to monitor the engraftment efficiency and ultimate fate of NK cells, as well as to evaluate its efficacy and safety during adoptive NK cell immunotherapy. Liao et al. have developed a NIR-II ratiometric fluorescence imaging nanoreporter for real-time quantitative tracking of adoptive NK cells activity in vivo (Liao et al., 2021). As a proof of this concept, the nanoreporter consists of DCNP coated with IR786s (a broad-spectrum ROS sensitive probe) for labeling NK cells and NIR-II imaging in a model of orthotopic hepatocellular carcinoma (HCC) in situ. Once cells death, excessive ROS was occurred in the tumor microenvironment (TME), leading to the increase of NIR-II fluorescence signal (1,550 nm) excited by 808 nm laser (F1550Em,808Ex), and the 1550 nm (F1550Em,980Ex) NIR-II fluorescence signal excited by 980 nm was used as a reference (Figure 6H). By using this ratiometric response signal (Ratio = F1550Em,980Ex/F1550Em,808Ex), they evaluated the production of intracellular excess ROS and tracked the cell activity in vivo for adoptive NK cell-based immunotherapy. This method has a great potential in monitoring the efficiency and safety of NK cell implantation in vivo and accelerating the clinical outcome of adoptive NK cell immunotherapy.
Glutathione (GSH) is the most abundant endogenous antioxidant, and plays an important role in maintaining the balance of redox state in biological system (Chu et al., 2017). Compared with normal tissue cells, the concentration of GSH in cancer cells was much higher, up to 2–10 mM, which was about 1,000 times higher than normal tissues/cells (Barranco et al., 2000). Wang et al. have modified the surface of core-shell down conversion nanoparticle (DCNPs) with 4-nitrophenol Cy7 (Nph) and amphiphilic distearyl phosphatidylethanolamine-polyethylene glycol (DSPE-PEG) (Wang et al., 2021b). Due to the intramolecular photoinduced electron transfer (PET) process, the Nph molecules coated on the surface of DCNPs have no fluorescence. In the presence of GSH, Nph reacted with GSH and formed Cy7-SG, and then the intramolecular PET process was activated and the fluorescence was recovered. Under the irradiation of 808 nm laser, Cy7-SG absorbed the incident light and transferred the excitation energy to Nd3+ of DCNP by means of nonradiative resonance energy transfer (NRET), resulting in sensitizing DCNPs produced an enhanced NIR-II fluorescence signal at 1550 nm (F1550,808Ex). In addition, 980 nm laser could not excite Cy7-SG molecules, but could directly excite DCNPs, so the fluorescence signal (F1550,980Ex) in the NIR-Ⅱ region of 1550 nm remained unchanged, resulting in a ratiometric fluorescence signal (F1550,808Ex/F1550,980Ex). The experimental results showed that there was a linear relationship between F1550,808Ex/F1550,980Ex and GSH concentration. It realizes the accurate quantification and real-time imaging for GSH of colon cancer tissue in situ and played an important role in the early diagnosis of human diseases.
It is well known that hydrogen sulfide (H2S) is the third important endogenous gas signal transduction compound after CO and NO (Szabo, 2007). It plays an important role in cell growth, cardiovascular protection, vasodilation, anti-inflammation, anti-oxidation, anti-apoptosis and other biological processes (Shi et al., 2018). The overexpression of cystathionine-β-synthase (CBS) in colon cancer cells promotes the production of H2S in tumor tissue (Szabo et al., 2013). Taking into account that the shortcomings of traditional detection methods, including colorimetry, surface-enhanced Raman scattering, electrochemical analysis and fluorescence analysis (Deng et al., 2019; Li et al., 2015; Wang et al., 2019c), which are limited to in vitro quantification. Wang et al. have developed an in situ H2S activable ratiometric nanoprobe with two NIR-II emission signals to detect H2S and intelligently illuminated colorectal cancer (Wang et al., 2021c). The nanoprobe consists of a down conversion nanoparticle (DCNP), which emitted NIR-II fluorescence at 1550 nm under the irradiation of a 980 nm laser (F1550Em,980Ex). Furthermore, human serum albumin (HSA) was combined with Ag+ on the surface of DCNP to form DCNP@HSA-Ag+ nanoprobe. Ag2S QDs were formed with the presence of H2S, which emitted fluorescence at approximately 1,050 nm on irradiation with an 808 nm laser (F1050Em, 808Ex) by an H2S-induced chemical reaction between H2S and Ag+. On the other hand, the fluorescence signal of DCNP was stable at 1550 nm (F1550Em,980Ex), resulting in the ratiometic signals (F1050Em,808Ex/F1550Em 980Ex) related to the H2S concentration. Therefore, the NIR-II ratiometric fluorescence nanoprobe could accurately quantify the detection of H2S in colon cancer through an endogenous H2S-induced in situ reduction reaction to form Ag2S QDs (Figure 6G). Recently, Xu et al. have also reported an activatable NIR-II fluorescent probe (NIR-II@Si) for the visualization of colorectal cancer (Xu et al., 2018). The activatable nanoprobes were comprised of two organic fluorophores: a rational designed boron-dipyrromethene (ZX-NIR) dye to generate the NIR-II emission only in the presence of H2S, and an aza-BODIPY (aza-BOD) that inerted to H2S, serving as the internal reference, which made with two steps: first, the two dyes ZX-NIR and aza-BOD were trapped into the hydrophobic interior of self-assembled micellar aggregate based on mPEG-DSPE; Second, in situ shell cross-linking with (N-trimethoxysilylpropyl-N,N,N-tri-n-butylammonium bromide) (TBNBr) to produce water-dispersible core-shell silica nanocomposites (NIR-II@Si) with a covalently cross-linked silica shell. By using this activatable and targeting specific probe for deep tissue imaging of H2S-rich colon cancer cells, colorectal cancers in animal models can be accurately identified.
Recently, Wang et al. have developed a pH-responsive benzothiopyrylium pentamethine cyanine dye (BTC1070) for noninvasively quantitative measurement of gastric pH in vivo (Figure 7A) (Wang et al., 2019c). Because of their anti-quenching properties, these fluorophores showed spectral response to pH in aqueous solution. When pH changed from 5 to 0, the emission peak shifted from 1,065 to 980 nm under 808 nm excitation, and accompanied by a significant intensity change (Figure 7B). Plot of integrated intensity ratio from two wavelength regions (1000–1300 and 900–1300 nm) at pH 0–7.0 was well fitted by a sigmoidal equation (R2 = 0.99), suggesting an optimal pH-sensitive range was 1.0–4.0 (Figure 7C). Based on the calibration results, the ability of BTC1070 to perform ratiometric imaging of gastric pH in vivo was further tested, mice were fed with simulated gastric juice with different pH values (pH1.3 and pH2.5) to simulate the pH environment of human stomach. As shown in Figure 7D, after intragastric administration of BTC1070 micellar solution, non-invasive ratio imaging could not only identify stomach profile from the left side of the abdomen with tissue depth of 2–4 mm, but also distinguish the two pH environments with clear pseudo-color contrast. Similar results were found in invasive ratiometric imaging of gastric juice wrapped in thin gastric wall (1 mm depth, Figure 7E) and exposed gastric juice imaging (0 mm depth, Figure 7F). The ratio was converted to pH value using calibration curve, which was consistent with the result measured by a standard pH meter (Figure 7G). BTC1070 can noninvasively detect gastric pH in a wide range of pH by a high contrast deep tissue ratiometric imaging, and achieve non-invasive gastric pH measurement at the depth of ∼4 mm, and its accuracy is reliable.
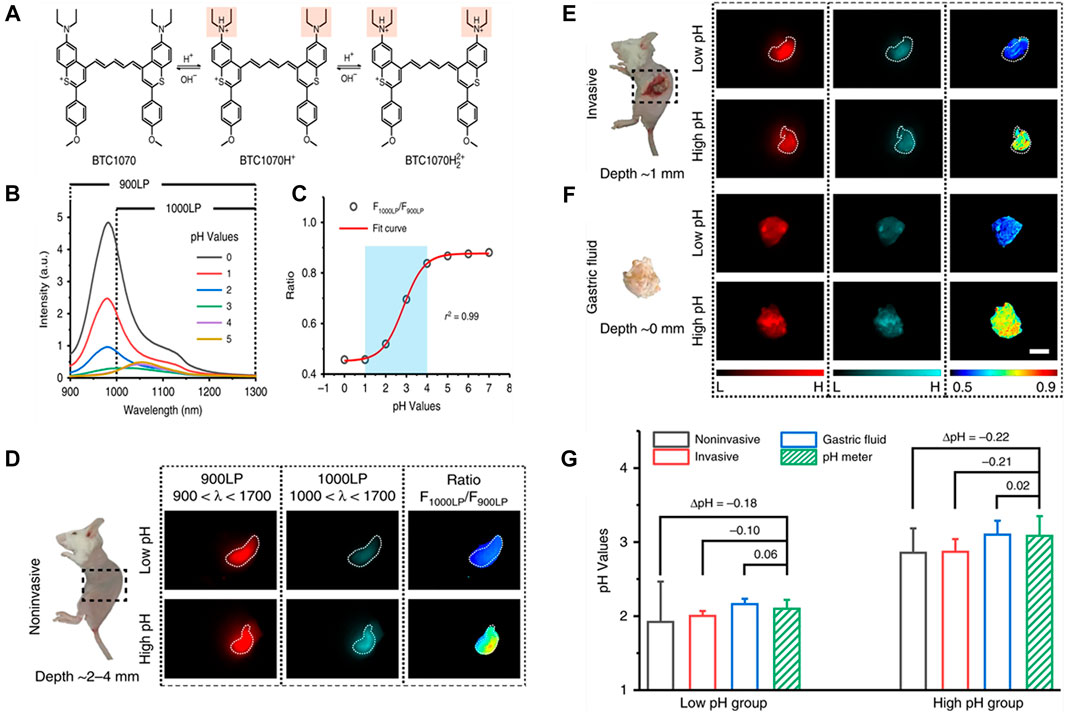
FIGURE 7. Protonation of BTC1070 and the corresponding spectra changes. (A) Protonation mechanism of NIR-II fluorophore BTC1070 showing stepwise protonation on nitrogen atoms. (B) The corresponding fluorescence spectra excited at 808 nm at various pH values. (C) Plot of fluorescence ratio changes as a function of pH values. Ratio = F1000LP/F900LP, F1000LP and F900LP denote the integrated intensity at wavelength of 1,000–1,300 nm and 900–1,300 nm, respectively. (D–G) In vivo ratiometric fluorescence imaging of gastric pH. (D,F) Left: digital photographs of mice and dissected stomach denote three imaging modes. (D) noninvasive imaging at ∼ 2–4 mm tissue depth; (E) invasive imaging of gastric fluid covered by ∼ 1 mm thickness of gastric wall; (F) imaging of exposed gastric fluid. (G) Comparison of pH values in mice stomach measured by ratiometric fluorescence imaging and standard pH meter. Data point with its error bar stands for mean ± s.d. derived from n = 3 biologically independent mice (reproduced from (Wang et al., 2019c) with permission from Springer Nature Publishing Group).
Photoacoustic imaging (PAI) technology combines with the advantages of optical imaging and ultrasonic imaging to achieve high spatial resolution and good tissue penetration depth (∼cm depth) (Fu et al., 2019; Upputuri and Pramanik, 2019; Li et al., 2020) In particular, the photoacoustic imaging (PA) in NIR-II window has deeper tissue penetration depth and higher SBR(Zhou J. et al., 2018; Cai et al., 2019; Lyu et al., 2019). Therefore, NIR-II ratiometric PA is a suitable tool for in vivo quantitative analysis.
Ye et al. have reported a novel type of H2O2-responsive theranostic nanoplatform composed of Ag shells coated with Pd-tipped gold nanorods (Au-Pd@Ag NR) (Figure 8A) (Ye et al., 2020). The etching and oxidation of Ag shells by Ag+ ions released in the presence of H2O2, which effectively killed the bacteria in the body and triggered the absorption variation at 700 and 1260 nm. Ratiometric PA imaging (PA1260/PA700) at 1,260 and 700 nm accurately quantified H2O2 in models of bacterial infection, abdominal inflammation and osteoarthritis. Au-Pd@Ag nanoparticles have high PA signal (PA700) at 700 nm and relatively low signal (PA1260) at 1260 nm. Once exposure to H2O2, Au-Pd@Ag triggered PA700 decrease and PA1260 increase in a concentration-dependent manner. In addition, there was a linear correlation between PA1260/PA700 ratio and H2O2 concentration (Figure 8B). They first analyzed whether Au-Pd@Ag nanoprobes can quantitatively detect endogenous H2O2 in E. coli mouse model by PAI modality (Figure 8C). Au-Pd@Ag nanoparticles were injected into the infected area 24 h later, PA700 and PA1260 signals were recorded in real time by LAZR PA Imaging System (Figure 8D). The signal intensity of PA700 in the infected area decreased in a time-dependent manner, at the same time, that of PA1260 increased along with time (Figure 8E). As a result, the PA1260/PA700 ratio in the inflammatory area gradually increased and peaked at 150 min post-injection with 3.5 times higher than the baseline (Figure 8F). In addition, further testing revealed that the PA1260/PA700 values remained unchanged in noninfected regions, but the level of inflammatory factors (including TNF-a, IL-12, IL-6) in the differentially treated animals were significantly decreased (Figure 8G). Therefore, Au-Pd@Ag nanoprobe can be used as a therapeutic platform to quantify H2O2 in situ and kills infiltrating bacteria as well as reduce inflammation.
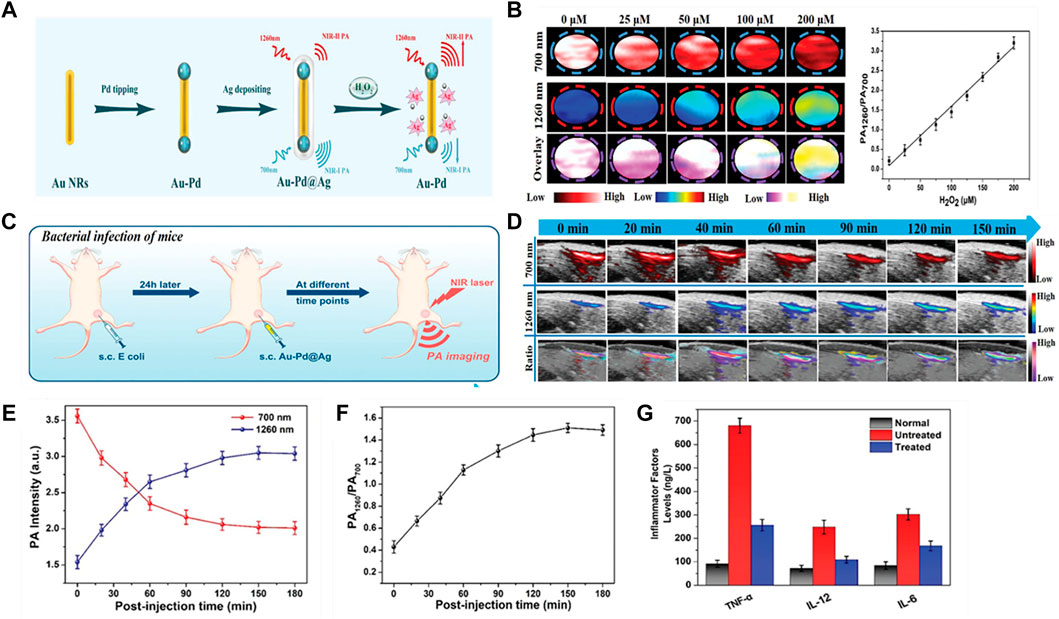
FIGURE 8. ROS-responsive ratiometric NIR PA imaging (A) Schematic illustration of the synthetic route of Au–Pd@Ag nanoprobe. (B) PA images at 700 and 1,260 nm of Au–Pd@Ag before and after incubated with different concentration of H2O2, and the ratiometric PA intensity (PA1260/PA700) as a function of the concentration of H2O2. (C) Schematic illustration showing detection of H2O2 in the inflamed region of mice infected subcutaneously with E. coli using the Au–Pd@Ag nanoprobe. (D) Representative PA images of the infected region before and after subcutaneous (s.c) injection of Au@Ag–Pd nanoprobe. (E) Time-dependent changes in PA700 and PA1260 intensities following Au–Pd@Ag injection. (F) Ratiometric PA1260/PA700 as a function of time in the above. (G) The level of inflammatory factors (including TNF-a, IL-12, IL-6) in the differentially treated animals (reproduced from (Ye et al., 2020) with permission from WILEY-VCH Verlag GmbH and Co. KGaA, Weinheim).
NIR-II PA imaging can be used not only in the detection of ROS in vivo, but also in the quantitative analysis for disorders of metal metabolism, such as Cu2+ disorder in hereditary hepatolenticular degeneration, that is Wilson’s disease (WD). Excessive Cu2+in the liver can lead to a variety of liver diseases, such as liver injury and inflammation (Czlonkowska et al., 2018). Fu et al. have designed an activable ratiometric NIR-II PA imaging probe (AuNR-Pd@PIR970/PEG) (Fu et al., 2021). The AuNR-Pb@PIR970/PEG consisted of a NIR PA contrast agent named IR970, at 970 nm that selectively reacted with Cu2+, and the AuNR-Pd was with a strong absorption peak of 1,260 nm as a reference, which could be achieved the detection of Cu2+ by proportional PA (PA970/PA1260) (Figure 9A). As shown in Figure 9B, the absorption peak of AuNR-Pd@PIR970/PEG nanoprobe at 970 nm increased with the increase of Cu2+ concentration, while the absorption peak of AuNR-Pd at 1260 nm was almost unchanged. Subsequently, the PA imaging signals of the nanoprobes treated with different concentrations of Cu2+ at 970 and 1260 nm were recorded respectively (Figure 9C), the ratio of PA970/PA1260 increased significantly and had a good linear relationship with the concentration of Cu2+. The quantitative detection and visualization of Cu2+ in liver was feasible in mouse models of WD mice and healthy mice. The intensity of PA in WD mice at 970 nm (Δ PA970) and 1260 nm (ΔPA1260) were gradually increased until it reached a plateau at 4 h (Figure 9D). For healthy mice, the plateau period was reached within 2 h (Figure 9E), which was ascribed to the higher metabolic rate and better liver function of healthy mice than that of WD mice. The ΔPA970/ΔPA1260 in healthy mice was relied on the accumulation of probes in the liver (Figure 9F). WD mice were not only dominated by probes accumulation, but also by the activation of Cu2+ (Figure 9G). In general, the ratio PA detection method provides an accurate, rapid and simple non-invasive technique, and can be regarded as a promising tool for the early diagnosis of WD.
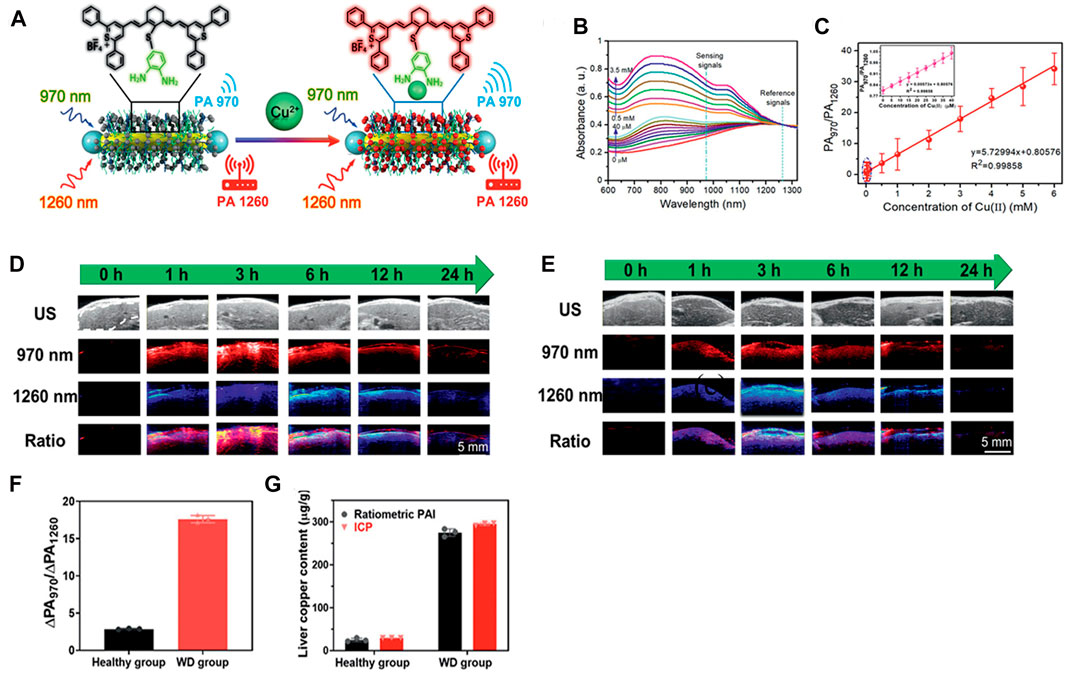
FIGURE 9. Cu2+-responsive ratiometric NIR PA imaging. (A) Illustration of design of Cu2+ -responsive ratiometric photoacoustic probe (AuNR-Pd@PIR970/PEG). (B) UV-vis spectrum of nanoprobe in different concentration of Cu2+. (C) PA970/PA1260 signal ratios of nanoprobe measured under various concentration of Cu2+. (D) Ultrasonic (B-mode) and PA images of mice liver with WD and (E) healthy mice. (F) Corresponding PA970/PA1260 value of WD and healthy group. (G) Liver Cu2+ contents measured by liver biopsy and ratiometric PA imaging of healthy and WD mice (reproduced from (Fu et al., 2021) with permission from Wiley-VCH GmbH).
Fluorescence lifetime imaging is a time-resolved measurement technique for analysis and imaging by collecting different fluorescence lifetime signals. Moreover, the fluorescence lifetime is not affected by excited light power and tissue penetration depth, and it does not need to be calibrated at different depths, thereby it is often used as a quantitative probe, which lays a foundation for multi-coding quantitative detection of molecules or biomarkers in vitro and in vivo (Sarder et al., 2015). For example, the rare Earth fluorescence lifetime probe has a great application prospect in the fields of biological imaging, biosensor, multi-channel composite imaging and high-throughput detection analysis (Johnson et al., 2017; Zhou L. et al., 2018; Fan et al., 2018; Kong et al., 2019; Tan et al., 2020; Zhao et al., 2020).
Recently, Zhao et al. have synthesized a new type of TME response NIR-II fluorescence nanosensor (NaYF4@NaYF4:1%Nd3+-MY1057), in which Nd3+ absorbed the excited light energy of 808 nm and produced NIR-II fluorescence of 1060 nm (Zhao et al., 2020). In response to ONOO− at tumor, the structure of energy acceptor MY-1057 degrades, resulting in the lifetime recovery of nanosensor (Figure 10A). In order to obtain high luminous intensity and stable lifetime of in vivo imaging, lanthanide downshift nanoparticles (DSNPs) with β-NaYF4@NaYF4:1%Nd as NIR-II FRET donor with 1060 nm emission were synthesized (Figure 10B). The absorption of MY-1057 at 1057 nm gradually decreased with ONOO− treatment due to structural degradation (Figure 10C), accompanied by the nanosensor’s luminous intensity recovery (Figure 10D), and along with lifetime of the nanosensor recovered from 203 ± 2 μs to 298 ± 2 μs (Figure 10E). Then, the humanized mouse HCC model was intravenously injected with DSNP@MY1057-GPC-3 nanosensor (15 mg/kg) (Figure 10F). Three tumor lesions with a survival time of 215 ± 27–249 ± 43 μs and the normal liver tissue of 204 ± 10 μs were accurately distinguished, respectively (Figures 10G,H). The novel composite probe opens a new way for the specific response of ultra-precision cancer diagnosis, and provides a new idea for the quantitative study of pathological parameters and real-time dynamic imaging in vivo.
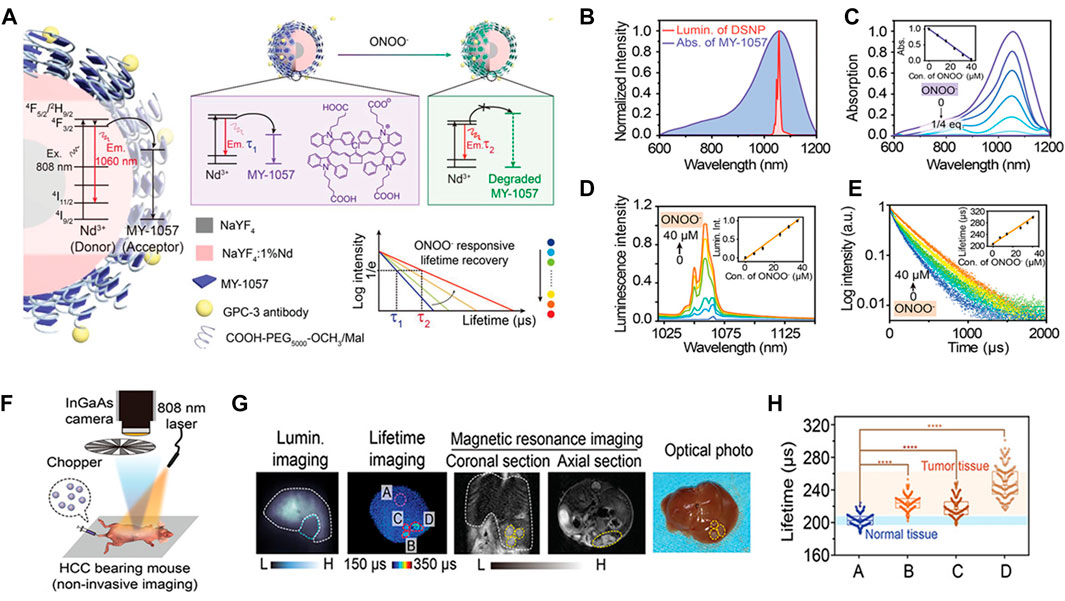
FIGURE 10. Lifetime-resolved imaging for ONOO− dectection. (A) Schematic illustration of the ONOO−-responsive nanosensor DSNP@MY-1057-GPC-3. In the presence of ONOO−, the structure of the energy acceptor MY-1057 degrades sensitively, leading to the lifetime recovery in NIR-II region. (B) Overlap of the MY-1057 absorption and DSNP luminescence emission spectra. (C) Absorption of MY-1057 as a function of ONOO− (0–1/4 equiv.). (D) Luminescence emission intensity and (e) lifetime response of DSNP@MY-1057-GPC-3 at 1,060 nm as a function ONOO− concentration. (F) In situ HCC tumor detection by noninvasive imaging setup after administration of DSNP@MY-1057-GPC-3 nanosensor. (G) Noninvasive intensity-based imaging, lifetime-based imaging of a mouse bearing multiple HCC lesions and optical photo of the dissected liver. ROI A: normal hepatic tissue; ROI B–D: tumor lesions distinguished from lifetime imaging. (H) Lifetime extracted from ROI A–D of (G) (reproduced from (Zhao et al., 2020) with permission from WILEY-VCH Verlag GmbH and Co., KGaA, Weinheim).
In 2018, Fan et al. have synthesized a NIR-II fluorescence-lifetime nanoparticles doped with lanthanides that feasibly designed the luminescence time for quantitative analysis in vivo imaging with multiplexing in the time domain (Fan et al., 2018). Taking the fluorescence probe doped with Er as an example, the fluorescence lifetime control across three orders (μs-ms) of magnitude were realized by adjusting the thickness of the second energy transfer layer and the doping amount of Er3+. In this fluorescence mode, the lifetime remained unchanged even if the SNR was less than 1.5, the fluorescence lifetime of the fluorescence probe has nothing to do with the tissue depth, so it can be used for quantitative researches without calibration at different depths. In nude mice models with bearing xenografts of MCF-7or BT-474 cells, the biomarker expressions of the tumor subtypes were quantified by resolving the three lifetime components simultaneously with a pattern recognition algorithm (Niehorster et al., 2016) (Figure 11A). It was worth noting that the expression patterns of the three biomarkers in different tumors were obviously different for the two tumor subtypes (Figure 11B). MCF-7 tumors expressed a large number of ER (62.3%), PR (17.9%) and HER2 (19.8%) at moderate levels. In BT-474 tumors, the expression rate of HER2 was the highest (46.6%), followed by PR (28%) and ER (25.4%). These expression patterns obtained by in vivo multiplexing (IVM) method were highly consistent with the Western blot (WB) results (Figure 11C). The IVM method was also compared with the traditional in vitro immunohistochemical (IHC) method. Three mice were used by IHC for each tumor subtype, and the images were analyzed with IHC (Figure 11D). There was a good correlation between the two methods for the expression patterns of biomarkers in the two tumor subtypes. Traditional IHC examines only one biomarker per tissue section. In contrast, IVM allows simultaneous quantification of all biomarkers to minimize uncertainty caused by biopsies, sample processing and scoring processes.
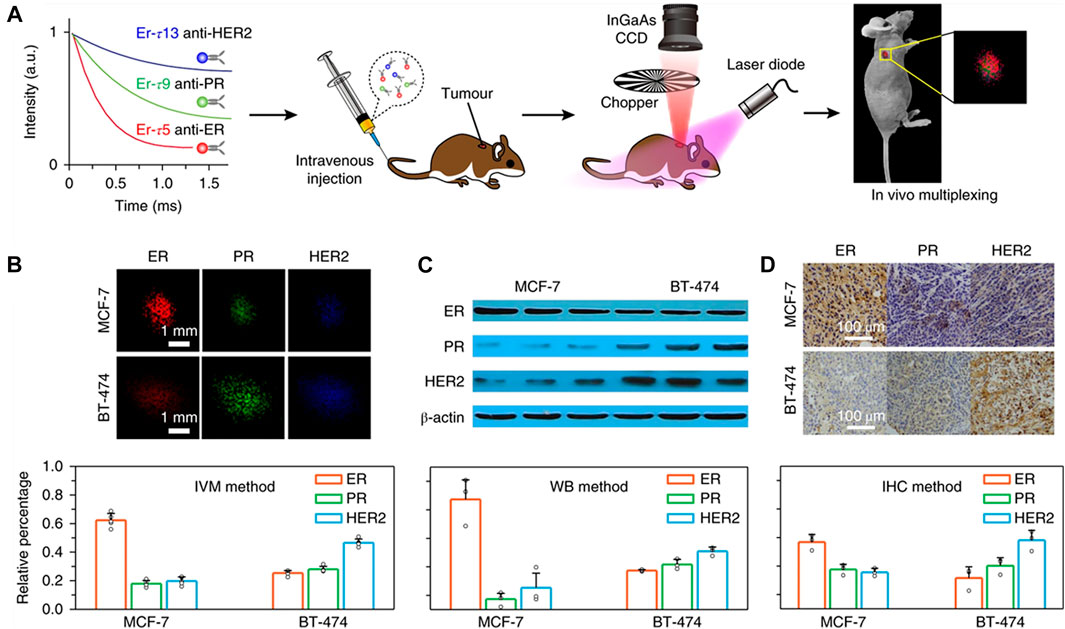
FIGURE 11. Lifetime-resolved imaging for in vivo multiplexing (IVM) of tumor biomarkers. (A) Schematics illustrating animal experiment procedures. Three batches of Er nanoparticles exhibiting distinct lifetimes are conjugated to three antibodies (anti-ER, anti-PR and anti-HER2), respectively, and intravenously injected into the mouse via tail vein. Lifetime-resolved imaging is then performed to quantify the biomarker expressions on the tumor via IVM. CCD, charge-coupled device. (B) Lifetime-resolved images for the MCF-7 and BT-474 tumors are decomposed into the three lifetime channels, represented by the red, green and blue monochromatic image sets. (C,D) In vitro western blot (C) and ex vivo immunohistochemistry assay (D) results and calculated biomarker expression patterns of the two tumors subtypes IVM: in vivo multiplexing; WB: western blot; IHC: immunohistochemistry (reproduced from (Fan et al., 2018) with permission from Springer Nature Publishing Group).
Overall, NIR-II bioimaging have studied in the past decades for various in vivo quantitative applications, such as NIR-II fluorescence, PA and luminescence lifetime imaging for in vivo quantitative analysis, which not only influences fundamental biomedical research studies in NIR-II probes and NIR-II imaging technologies, but also presents a great potential for clinical translational researches in the future. However, there are some challenges need to be overcome to expand the NIR-II in vivo quantitative imaging from its current stage to a higher level, which could help researchers to further understand the complex systems and pathways of living organisms. In the following points, we envisage the main concerns regarding NIR-II probes and imaging techniques, and give some advices and prospects for NIR-II in vivo quantitative analyses in future biomedical applications.
First, making in vivo quantification more comprehensive and accurate. Due to the integral inhomogeneity caused by the complexity of the tissue structure, and the current quantitative analyses are mostly based on the 2D plane of fluorescence imaging. Therefore, it is difficult to achieve “a glimpse to know the whole panther” based on a single 2D plane of imaging results. It is still facing challenges to acquire the regional morphological quantitation and total moles of substance. With the 3D scanning function of NIR-II imaging technology can make more accurate morphological quantitative information. The application of the NIR-II laser confocal and the 3D tissue scanning function of the light sheet intravital microscope to the in vivo quantification can solve aforementioned problems to a certain extent. Nevertheless, the scanning speed and the data processing speed of the computer are still facing challenges. The application of 3D scanning functional NIR-II imaging technology provides more comprehensive and accurate quantitative information for living tissue morphology. For example, NIR-II confocal and light-sheet microscopy have shown corresponding advantages in 3D imaging of living tissues (Zhu et al., 2018b; Wang F. et al., 2019; Wang F. et al., 2021), but the higher scanning speed and the huger data processing required for in vivo quantification still are troubles to be settled urgently.
Second, simultaneously acquiring more different quantitative properties. Due to the complexity and dynamic characteristics of organisms, static single-source signal acquisition cannot give a complete overview of physiological and pathological changes. Therefore, the multi-channel imaging techniques and multi-response probes should be developed for NIR-II in vivo quantitative analysis. Multi-response NIR-II probes can respond to different analytes and have differentiable signals for various analytes, and the real-time multi-channel NIR-II imaging techniques can simultaneously record multiple events (Fan et al., 2018; Cao J. et al., 2019; Wang T. et al., 2021; Shinn et al., 2021), providing more in vivo quantitative properties for understanding the physiological and pathological processes of living bodies.
Last but not least, the application and development of NIR-II in vivo quantitative researches can draw lessons from the experience of traditional UV-Vis-NIR techniques, but it will also face the same challenges as traditional techniques, which is mainly limited by the lack of suitable NIR-II probes. Up to now, there are no FDA-approved NIR-II probes available for clinical use, so it is a challenge to realize NIR-II in vivo quantitative researches in clinical translation. NIR-II ratiometric and lifetime probes have showed excellent performance in in vivo quantification. However, due to the lack of superior biocompatible probes, the current reported studies mostly use inorganic materials, such as QDs [Ag2S(Chen et al., 2018)], noble metals [Au-Pb (Ye et al., 2020)], and rare-earth [NaErxY1-xF4@NaYF4 (Wang F. et al., 2019)], that possess potential biological toxicity. Following the rule that “taken from nature, used in nature”, obtaining probe materials with NIR-II optical properties from nature of biological source is a desirable approach to retrieve biocompatible probes (Saif et al., 2020; Shang et al., 2020). More importantly, it is worth drawing on the successful experience of FDA-approved NIR molecular probes indocyanine green (ICG) and methylene blue (MB) (Polom et al., 2014; Carr et al., 2018), committing to prepare NIR-II molecular probes. The application range of NIR-II in vivo quantitative researches is also limited by NIR-II probes. Currently, there is a lack of high-performance NIR-II probes for quantitative analyses in in vivo of gene expressions and neuroscience researches. In situ visualization of gene expressions in living bodies requires the development of genetically encoded fluorescent proteins with NIR-II longer emission wavelengths in NIR-II region. This would require to identify a NIR-II fluorescent protein, and to engineer the protein structures as well as to identify the encoding gene that are responsible for the NIR-II fluorescence emission in the bacteria, contributing to further study the expression of NIR-II fluorescent proteins in mammalian cells (Qian et al., 2019; Shen et al., 2020). The membrane potential-sensitive NIR-II probes may offer the possibility to simultaneously monitor neural activities of large numbers of nerve cell populations in living tissues (Liu et al., 2020d; Shemetov et al., 2021). This would require to the use of activable NIR-II probes that can specifically sense bio-voltage changes, ions (Ca2+, K+) and neurotransmitters (dopamine).
SY and XT wrote the manuscript. LT and QY commented and revised the final version.
This work was financially supported by the National Science Foundation of China (81801749), the “Huxiang Young Talents Plan” Project of Hunan Province (2021RC3106), and the Key Research and Development Program of Hunan Province, China (No. 2022SK2053).
The authors declare that the research was conducted in the absence of any commercial or financial relationships that could be construed as a potential conflict of interest.
All claims expressed in this article are solely those of the authors and do not necessarily represent those of their affiliated organizations, or those of the publisher, the editors and the reviewers. Any product that may be evaluated in this article, or claim that may be made by its manufacturer, is not guaranteed or endorsed by the publisher.
Abdi, H., and Williams, L. J. (2010). Principal Component Analysis. Wires Comp. Stat. 2, 433–459. doi:10.1002/wics.101
Alvarez-Breckenridge, C. A., Yu, J., Price, R., Wojton, J., Pradarelli, J., Mao, H., et al. (2012). NK Cells Impede Glioblastoma Virotherapy Through NKp30 and NKp46 Natural Cytotoxicity Receptors. Nat. Med. 18, 1827–1834. doi:10.1038/nm.3013
Antaris, A. L., Chen, H., Cheng, K., Sun, Y., Hong, G., Qu, C., et al. (2016). A Small-Molecule Dye for NIR-II Imaging. Nat. Mater. 15, 235–242. doi:10.1038/nmat4476
Aron, A. T., Loehr, M. O., Bogena, J., and Chang, C. J. (2016). An Endoperoxide Reactivity-Based FRET Probe for Ratiometric Fluorescence Imaging of Labile Iron Pools in Living Cells. J. Am. Chem. Soc. 138, 14338–14346. doi:10.1021/jacs.6b08016
Barranco, S. C., Perry, R. R., Durm, M. E., Quraishi, M., Werner, A. L., Gregorcyk, S. G., et al. (2000). Relationship Between Colorectal Cancer Glutathione Levels and Patient Survival. Dis. Colon Rectum. 43, 1133–1140. doi:10.1007/BF02236562
Bian, H., Ma, D., Zhang, X., Xin, K., Yang, Y., Peng, X., et al. (2021). Tailored Engineering of Novel Xanthonium Polymethine Dyes for Synergetic PDT and PTT Triggered by 1064 Nm Laser Toward Deep‐Seated Tumors. Small. 17, 2100398. doi:10.1002/smll.202100398
Bianchi-Smiraglia, A., Rana, M. S., Foley, C. E., Paul, L. M., Lipchick, B. C., Moparthy, S., et al. (2017). Internally Ratiometric Fluorescent Sensors for Evaluation of Intracellular GTP Levels and Distribution. Nat. Methods. 14, 1003–1009. doi:10.1038/nmeth.4404
Brieger, K., Schiavone, S., Miller, J., and Krause, K. (2012). Reactive Oxygen Species: from Health to Disease. Swiss Med. Wkly. 142, w13659. doi:10.4414/smw.2012.13659
Cai, Y., Wei, Z., Song, C., Tang, C., Han, W., and Dong, X. (2019). Optical Nano-Agents in the Second Near-Infrared Window for Biomedical Applications. Chem. Soc. Rev. 48, 22–37. doi:10.1039/c8cs00494c
Cao, C., Zhou, X., Xue, M., Han, C., Feng, W., and Li, F. (2019a). Dual Near-Infrared-Emissive Luminescent Nanoprobes for Ratiometric Luminescent Monitoring of ClO- in Living Organisms. ACS Appl. Mater. Inter. 11, 15298–15305. doi:10.1021/acsami.9b02008
Cao, J., Zhu, B., Zheng, K., He, S., Meng, L., Song, J., et al. (2019b). Recent Progress in NIR-II Contrast Agent for Biological Imaging. Front. Bioeng. Biotechnol. 7, 487. doi:10.3389/fbioe.2019.00487
Carr, J. A., Franke, D., Caram, J. R., Perkinson, C. F., Saif, M., Askoxylakis, V., et al. (2018). Shortwave Infrared Fluorescence Imaging With the Clinically Approved Near-Infrared Dye Indocyanine Green. Proc. Natl. Acad. Sci. USA. 115, 4465–4470. doi:10.1073/pnas.1718917115
Chen, G., Lin, S., Huang, D., Zhang, Y., Li, C., Wang, M., et al. (2018). Revealing the Fate of Transplanted Stem Cells In Vivo With a Novel Optical Imaging Strategy. Small. 14, 1702679. doi:10.1002/smll.201702679
Chen, M., Feng, S., Yang, Y., Li, Y., Zhang, J., Chen, S., et al. (2020). Tracking the In Vivo Spatio-Temporal Patterns of Neovascularization via NIR-II Fluorescence Imaging. Nano Res. 13, 3123–3129. doi:10.1007/s12274-020-2982-7
Chu, C., Lin, H., Liu, H., Wang, X., Wang, J., Zhang, P., et al. (2017). Tumor Microenvironment-Triggered Supramolecular System as an In Situ Nanotheranostic Generator for Cancer Phototherapy. Adv. Mater. 29, 1605928. doi:10.1002/adma.201605928
Cosco, E. D., Arús, B. A., Spearman, A. L., Atallah, T. L., Lim, I., Leland, O. S., et al. (2021). Bright Chromenylium Polymethine Dyes Enable Fast, Four-Color In Vivo Imaging With Shortwave Infrared Detection. J. Am. Chem. Soc. 143, 6836–6846. doi:10.1021/jacs.0c11599
Członkowska, A., Litwin, T., Dusek, P., Ferenci, P., Lutsenko, S., Medici, V., et al. (2018). Wilson Disease. Nat. Rev. Dis. Primers. 4, 21. doi:10.1038/s41572-018-0018-3
Deng, Z., Jiang, M., Li, Y., Liu, H., Zeng, S., and Hao, J. (2019). Endogenous H2S-Triggered In Situ Synthesis of NIR-II-Emitting Nanoprobe for In Vivo Intelligently Lighting up Colorectal Cancer. iScience. 17, 217–224. doi:10.1016/j.isci.2019.06.034
Diao, S., Hong, G., Antaris, A. L., Blackburn, J. L., Cheng, K., Cheng, Z., et al. (2015a). Biological Imaging Without Autofluorescence in the Second Near-Infrared Region. Nano Res. 8, 3027–3034. doi:10.1007/s12274-015-0808-9
Diao, S., Blackburn, J. L., Hong, G., Antaris, A. L., Chang, J., Wu, J. Z., et al. (2015b). Fluorescence Imaging In Vivo at Wavelengths beyond 1500 Nm. Angew. Chem. Int. Ed. 54, 14758–14762. doi:10.1002/anie.201507473
Dong, B., Li, C., Chen, G., Zhang, Y., Zhang, Y., Deng, M., et al. (2013). Facile Synthesis of Highly Photoluminescent Ag2Se Quantum Dots as a New Fluorescent Probe in the Second Near-Infrared Window for In Vivo Imaging. Chem. Mater. 25, 2503–2509. doi:10.1021/cm400812v
Fan, Y., Wang, P., Lu, Y., Wang, R., Zhou, L., Zheng, X., et al. (2018). Lifetime-Engineered NIR-II Nanoparticles Unlock Multiplexed In Vivo Imaging. Nat. Nanotech. 13, 941–946. doi:10.1038/s41565-018-0221-0
Fu, Q., Ye, J., Wang, J., Liao, N., Feng, H., Su, L., et al. (2021). NIR‐II Photoacoustic Reporter for Biopsy‐Free and Real‐Time Assessment of Wilson's Disease. Small. 17, 2008061. doi:10.1002/smll.202008061
Fu, Q., Zhu, R., Song, J., Yang, H., and Chen, X. (2019). Photoacoustic Imaging: Contrast Agents and Their Biomedical Applications. Adv. Mater. 31, 1805875. doi:10.1002/adma.201805875
Gao, D., Hu, D., Liu, X., Zhang, X., Yuan, Z., Sheng, Z., et al. (2020). Recent Advances in Conjugated Polymer Nanoparticles for NIR-II Imaging and Therapy. ACS Appl. Polym. Mater. 2, 4241–4257. doi:10.1021/acsapm.0c00679
Gao, J.-x., Li, P., Du, X.-j., Han, Z.-h., Xue, R., Liang, B., et al. (2017). A Negative Regulator of Cellulose Biosynthesis, bcsR, Affects Biofilm Formation, and Adhesion/Invasion Ability of Cronobacter Sakazakii. Front. Microbiol. 8, 1839. doi:10.3389/fmicb.2017.01839
Ge, X., Lou, Y., Su, L., Chen, B., Guo, Z., Gao, S., et al. (2020). Single Wavelength Laser Excitation Ratiometric NIR-II Fluorescent Probe for Molecule Imaging In Vivo. Anal. Chem. 92, 6111–6120. doi:10.1021/acs.analchem.0c00556
Godard, A., Kalot, G., Pliquett, J., Busser, B., Le Guével, X., Wegner, K. D., et al. (2020). Water-Soluble Aza-BODIPYs: Biocompatible Organic Dyes for High Contrast In Vivo NIR-II Imaging. Bioconjug. Chem. 31, 1088–1092. doi:10.1021/acs.bioconjchem.0c00175
Guillerey, C., Huntington, N. D., and Smyth, M. J. (2016). Targeting Natural Killer Cells in Cancer Immunotherapy. Nat. Immunol. 17, 1025–1036. doi:10.1038/ni.3518
Hong, G., Antaris, A. L., and Dai, H. (2017). Near-Infrared Fluorophores for Biomedical Imaging. Nat. Biomed. Eng. 1, 0010. doi:10.1038/s41551-016-0010
Hong, G., and Dai, H. (2016). In Vivo Fluorescence Imaging in the Second Near-Infrared Window Using Carbon Nanotubes. Methods Mol. Biol. 1444, 167–181. doi:10.1007/978-1-4939-3721-9_15
Hong, G., Diao, S., Chang, J., Antaris, A. L., Chen, C., Zhang, B., et al. (2014). Through-skull Fluorescence Imaging of the Brain in a New Near-Infrared Window. Nat. Photon. 8, 723–730. doi:10.1038/nphoton.2014.166
Hong, G., Robinson, J. T., Zhang, Y., Diao, S., Antaris, A. L., Wang, Q., et al. (2012). In Vivo Fluorescence Imaging With Ag2S Quantum Dots in the Second Near-Infrared Region. Angew. Chem. Int. Ed. 51, 9818–9821. doi:10.1002/anie.201206059
Jiang, Y., Upputuri, P. K., Xie, C., Zeng, Z., Sharma, A., Zhen, X., et al. (2019). Metabolizable Semiconducting Polymer Nanoparticles for Second Near‐Infrared Photoacoustic Imaging. Adv. Mater. 31, 1808166. doi:10.1002/adma.201808166
Johnson, N. J. J., He, S., Diao, S., Chan, E. M., Dai, H., and Almutairi, A. (2017). Direct Evidence for Coupled Surface and Concentration Quenching Dynamics in Lanthanide-Doped Nanocrystals. J. Am. Chem. Soc. 139, 3275–3282. doi:10.1021/jacs.7b00223
Kong, M., Gu, Y., Liu, Y., Shi, Y., Wu, N., Feng, W., et al. (2019). Luminescence Lifetime-Based In Vivo Detection With Responsive Rare Earth-Dye Nanocomposite. Small. 15, 1904487. doi:10.1002/smll.201904487
Lee, M. H., Kim, J. S., and Sessler, J. L. (2015). Small Molecule-Based Ratiometric Fluorescence Probes for Cations, Anions, and Biomolecules. Chem. Soc. Rev. 44, 4185–4191. doi:10.1039/c4cs00280f
Lei, Z., Sun, C., Pei, P., Wang, S., Li, D., Zhang, X., et al. (2019). Stable, Wavelength‐Tunable Fluorescent Dyes in the NIR‐II Region for In Vivo High‐Contrast Bioimaging and Multiplexed Biosensing. Angew. Chem. Int. Ed. 58, 8166–8171. doi:10.1002/anie.201904182
Lei, Z., and Zhang, F. (2021). Molecular Engineering of NIR‐II Fluorophores for Improved Biomedical Detection. Angew. Chem. Int. Ed. 60, 16294–16308. doi:10.1002/anie.202007040
Li, D.-W., Qu, L.-L., Hu, K., Long, Y.-T., and Tian, H. (2015). Monitoring of Endogenous Hydrogen Sulfide in Living Cells Using Surface-Enhanced Raman Scattering. Angew. Chem. Int. Ed. 54, 12758–12761. doi:10.1002/anie.201505025
Li, Q., Li, S., He, S., Chen, W., Cheng, P., Zhang, Y., et al. (2020). An Activatable Polymeric Reporter for Near‐Infrared Fluorescent and Photoacoustic Imaging of Invasive Cancer. Angew. Chem. Int. Ed. 59, 7018–7023. doi:10.1002/anie.202000035
Li, Y., Ke, J., Liu, Q., Yuan, W., Su, Q., Kong, M., et al. (2021). NIR-II Emitting Rare-Earth Nanoparticles for a Lateral Flow Immunoassay in Hemolysis. Sensors Actuators B: Chem. 345, 130380. doi:10.1016/j.snb.2021.130380
Liao, N., Su, L., Zheng, Y., Zhao, B., Wu, M., Zhang, D., et al. (2021). In Vivo Tracking of Cell Viability for Adoptive Natural Killer Cell‐Based Immunotherapy by Ratiometric NIR‐II Fluorescence Imaging. Angew. Chem. Int. Ed. 60, 20888–20896. doi:10.1002/anie.202106730
Liu, H., Hong, G., Luo, Z., Chen, J., Chang, J., Gong, M., et al. (2019). Atomic‐Precision Gold Clusters for NIR‐II Imaging. Adv. Mater. 31, 1901015. doi:10.1002/adma.201901015
Liu, L., Wang, S., Zhao, B., Pei, P., Fan, Y., Li, X., et al. (2018). Er3+ Sensitized 1530 Nm to 1180 Nm Second Near-Infrared Window Upconversion Nanocrystals for In Vivo Biosensing. Angew. Chem. Int. Ed. 57, 7518–7522. doi:10.1002/anie.201802889
Liu, P., Mu, X., Zhang, X.-D., and Ming, D. (2020a). The Near-Infrared-II Fluorophores and Advanced Microscopy Technologies Development and Application in Bioimaging. Bioconjug. Chem. 31, 260–275. doi:10.1021/acs.bioconjchem.9b00610
Liu, H., Li, C., Qian, Y., Hu, L., Fang, J., Tong, W., et al. (2020b). Magnetic-Induced Graphene Quantum Dots for Imaging-Guided Photothermal Therapy in the Second Near-Infrared Window. Biomaterials. 232, 119700. doi:10.1016/j.biomaterials.2019.119700
Liu, Y., Liu, J., Chen, D., Wang, X., Zhang, Z., Yang, Y., et al. (2020c). Fluorination Enhances NIR‐II Fluorescence of Polymer Dots for Quantitative Brain Tumor Imaging. Angew. Chem. Int. Ed. 59, 21049–21057. doi:10.1002/anie.202007886
Liu, Y., Lu, Y., Chen, G., and Wang, Q. (2020d). Recent Progress of Hybrid Optical Probes for Neural Membrane Potential Imaging. Biotechnol. J. 15, 2000086. doi:10.1002/biot.202000086
Luo, X., Chen, M., and Yang, Q. (2020). Research Progress on Near Infrared II Technology for In Vivo Imaging. Acta Chim. Sinica. 78, 373–381. doi:10.6023/a20020045
Lyu, Y., Li, J., and Pu, K. (2019). Second Near‐Infrared Absorbing Agents for Photoacoustic Imaging and Photothermal Therapy. Small Methods. 3, 1900553. doi:10.1002/smtd.201900553
Ma, T., Hou, Y., Zeng, J., Liu, C., Zhang, P., Jing, L., et al. (2018). Dual-Ratiometric Target-Triggered Fluorescent Probe for Simultaneous Quantitative Visualization of Tumor Microenvironment Protease Activity and pH In Vivo. J. Am. Chem. Soc. 140, 211–218. doi:10.1021/jacs.7b08900
Makukhin, N., Tretyachenko, V., Moskovitz, J., and Míšek, J. (2016). A Ratiometric Fluorescent Probe for Imaging of the Activity of Methionine Sulfoxide Reductase A in Cells. Angew. Chem. Int. Ed. 55, 12727–12730. doi:10.1002/anie.201605833
Monici, M. (2005). Cell and Tissue Autofluorescence Research and Diagnostic Applications. Biotechnol. Annu. Rev. 11, 227–256. doi:10.1016/S1387-2656(05)11007-2
Naczynski, D. J., Tan, M. C., Zevon, M., Wall, B., Kohl, J., Kulesa, A., et al. (2013). Rare-Earth-Doped Biological Composites as In Vivo Shortwave Infrared Reporters. Nat. Commun. 4, 2199. doi:10.1038/ncomms3199
Narayanaswamy, N., Chakraborty, K., Saminathan, A., Zeichner, E., Leung, K., Devany, J., et al. (2019). A pH-Correctable, DNA-Based Fluorescent Reporter for Organellar Calcium. Nat. Methods. 16, 95–102. doi:10.1038/s41592-018-0232-7
Niehörster, T., Löschberger, A., Gregor, I., Krämer, B., Rahn, H.-J., Patting, M., et al. (2016). Multi-target Spectrally Resolved Fluorescence Lifetime Imaging Microscopy. Nat. Methods. 13, 257–262. doi:10.1038/nmeth.3740
Park, S.-H., Kwon, N., Lee, J.-H., Yoon, J., and Shin, I. (2020). Synthetic Ratiometric Fluorescent Probes for Detection of Ions. Chem. Soc. Rev. 49, 143–179. doi:10.1039/c9cs00243j
Polom, W., Markuszewski, M., Soo Rho, Y., and Matuszewski, M. (2014). Usage of Invisible Near Infrared Light (NIR) Fluorescence With Indocyanine green (ICG) and Methylene Blue (MB) in Urological Oncology. Part 1. Cent. European. J. Urol. 67, 142–148. doi:10.5173/ceju.2014.02.art5
Qi, J., Sun, C., Li, D., Zhang, H., Yu, W., Zebibula, A., et al. (2018). Aggregation-Induced Emission Luminogen With Near-Infrared-II Excitation and Near-Infrared-I Emission for Ultradeep Intravital Two-Photon Microscopy. ACS Nano. 12, 7936–7945. doi:10.1021/acsnano.8b02452
Qian, Y., Piatkevich, K. D., Mc Larney, B., Abdelfattah, A. S., Mehta, S., Murdock, M. H., et al. (2019). A Genetically Encoded Near-Infrared Fluorescent Calcium Ion Indicator. Nat. Methods. 16, 171–174. doi:10.1038/s41592-018-0294-6
Richardson, D. S., Gregor, C., Winter, F. R., Urban, N. T., Sahl, S. J., Willig, K. I., et al. (2017). SRpHi Ratiometric pH Biosensors for Super-Resolution Microscopy. Nat. Commun. 8, 577. doi:10.1038/s41467-017-00606-4
Ringnér, M. (2008). What Is Principal Component Analysis? Nat. Biotechnol. 26, 303–304. doi:10.1038/nbt0308-303
Robinson, J. T., Hong, G., Liang, Y., Zhang, B., Yaghi, O. K., and Dai, H. (2012). In Vivo Fluorescence Imaging in the Second Near-Infrared Window With Long Circulating Carbon Nanotubes Capable of Ultrahigh Tumor Uptake. J. Am. Chem. Soc. 134, 10664–10669. doi:10.1021/ja303737a
Saif, M., Kwanten, W. J., Carr, J. A., Chen, I. X., Posada, J. M., Srivastava, A., et al. (2020). Non-Invasive Monitoring of Chronic Liver Disease via Near-Infrared and Shortwave-Infrared Imaging of Endogenous Lipofuscin. Nat. Biomed. Eng. 4, 801–813. doi:10.1038/s41551-020-0569-y
Sarder, P., Maji, D., and Achilefu, S. (2015). Molecular Probes for Fluorescence Lifetime Imaging. Bioconjug. Chem. 26, 963–974. doi:10.1021/acs.bioconjchem.5b00167
Shang, L., Shao, C., Chi, J., and Zhao, Y. (2020). Living Materials for Life Healthcare. Acc. Mater. Res. 2, 59–70. doi:10.1021/accountsmr.0c00084
Shemetov, A. A., Monakhov, M. V., Zhang, Q., Canton-Josh, J. E., Kumar, M., Chen, M., et al. (2021). A Near-Infrared Genetically Encoded Calcium Indicator for In Vivo Imaging. Nat. Biotechnol. 39, 368–377. doi:10.1038/s41587-020-0710-1
Shen, J., Karges, J., Xiong, K., Chen, Y., Ji, L., and Chao, H. (2021). Cancer Cell Membrane Camouflaged Iridium Complexes Functionalized Black-Titanium Nanoparticles for Hierarchical-Targeted Synergistic NIR-II Photothermal and Sonodynamic Therapy. Biomaterials. 275, 120979. doi:10.1016/j.biomaterials.2021.120979
Shen, Y., Nasu, Y., Shkolnikov, I., Kim, A., and Campbell, R. E. (2020). Engineering Genetically Encoded Fluorescent Indicators for Imaging of Neuronal Activity: Progress and Prospects. Neurosci. Res. 152, 3–14. doi:10.1016/j.neures.2020.01.011
Sheng, Z., Guo, B., Hu, D., Xu, S., Wu, W., Liew, W. H., et al. (2018). Bright Aggregation-Induced-Emission Dots for Targeted Synergetic NIR-II Fluorescence and NIR-I Photoacoustic Imaging of Orthotopic Brain Tumors. Adv. Mater. 30, 1800766. doi:10.1002/adma.201800766
Shi, B., Yan, Q., Tang, J., Xin, K., Zhang, J., Zhu, Y., et al. (2018). Hydrogen Sulfide-Activatable Second Near-Infrared Fluorescent Nanoassemblies for Targeted Photothermal Cancer Therapy. Nano Lett. 18, 6411–6416. doi:10.1021/acs.nanolett.8b02767
Shinn, J., Lee, S., Lee, H. K., Ahn, J., Lee, S. A., Lee, S., et al. (2021). Recent Progress in Development and Applications of Second Near‐Infrared (NIR-II) Nanoprobes. Arch. Pharm. Res. 44, 165–181. doi:10.1007/s12272-021-01313-x
Smith, A. M., Mancini, M. C., and Nie, S. (2009). Second Window for In Vivo Imaging. Nat. Nanotech. 4, 710–711. doi:10.1038/nnano.2009.326
Suo, Y., Wu, F., Xu, P., Shi, H., Wang, T., Liu, H., et al. (2019). NIR‐II Fluorescence Endoscopy for Targeted Imaging of Colorectal Cancer. Adv. Healthc. Mater. 8, 1900974. doi:10.1002/adhm.201900974
Szabo, C., Coletta, C., Chao, C., Modis, K., Szczesny, B., Papapetropoulos, A., et al. (2013). Tumor-Derived Hydrogen Sulfide, Produced by Cystathionine- -Synthase, Stimulates Bioenergetics, Cell Proliferation, and Angiogenesis in colon Cancer. Proc. Natl. Acad. Sci. 110, 12474–12479. doi:10.1073/pnas.1306241110
Szabó, C. (2007). Hydrogen Sulphide and its Therapeutic Potential. Nat. Rev. Drug Discov. 6, 917–935. doi:10.1038/nrd2425
Tan, M., Li, F., Wang, X., Fan, R., and Chen, G. (2020). Temporal Multilevel Luminescence Anticounterfeiting Through Scattering Media. ACS Nano. 14, 6532–6538. doi:10.1021/acsnano.9b08326
Tian, R., Ma, H., Zhu, S., Lau, J., Ma, R., Liu, Y., et al. (2020). Multiplexed NIR‐II Probes for Lymph Node‐Invaded Cancer Detection and Imaging‐Guided Surgery. Adv. Mater. 32, 1907365. doi:10.1002/adma.201907365
Trachootham, D., Alexandre, J., and Huang, P. (2009). Targeting Cancer Cells by ROS-Mediated Mechanisms: a Radical Therapeutic Approach? Nat. Rev. Drug Discov. 8, 579–591. doi:10.1038/nrd2803
Umezawa, K., Yoshida, M., Kamiya, M., Yamasoba, T., and Urano, Y. (2017). Rational Design of Reversible Fluorescent Probes for Live-Cell Imaging and Quantification of Fast Glutathione Dynamics. Nat. Chem. 9, 279–286. doi:10.1038/nchem.2648
Upputuri, P. K., and Pramanik, M. (2019). Photoacoustic Imaging in the Second Near-Infrared Window: a Review. J. Biomed. Opt. 24, 1–20. doi:10.1117/1.JBO.24.4.040901
Villa, I., Vedda, A., Cantarelli, I. X., Pedroni, M., Piccinelli, F., Bettinelli, M., et al. (2014). 1.3 μm Emitting SrF2:Nd3+ Nanoparticles for High Contrast In Vivo Imaging in the Second Biological Window. Nano Res. 8, 649–665. doi:10.1007/s12274-014-0549-1
Wan, H., Du, H., Wang, F., and Dai, H. (2019). Molecular Imaging in the Second Near‐Infrared Window. Adv. Funct. Mater. 29, 1900566. doi:10.1002/adfm.201900566
Wan, H., Ma, H., Zhu, S., Wang, F., Tian, Y., Ma, R., et al. (2018). Developing a Bright NIR‐II Fluorophore With Fast Renal Excretion and its Application in Molecular Imaging of Immune Checkpoint PD‐L1. Adv. Funct. Mater. 28, 1804956. doi:10.1002/adfm.201804956
Wang, F., Ma, Z., Zhong, Y., Salazar, F., Xu, C., Ren, F., et al. (2021a). In Vivo NIR-II Structured-Illumination Light-Sheet Microscopy. Proc. Natl. Acad. Sci. USA. 118, e2023888118. doi:10.1073/pnas.2023888118
Wang, C., Lin, H., Ge, X., Mu, J., Su, L., Zhang, X., et al. (2021b). Dye‐Sensitized Downconversion Nanoprobes With Emission Beyond 1500 Nm for Ratiometric Visualization of Cancer Redox State. Adv. Funct. Mater. 31, 2009942. doi:10.1002/adfm.202009942
Wang, C., Niu, M., Wang, W., Su, L., Feng, H., Lin, H., et al. (2021c). In Situ Activatable Ratiometric NIR-II Fluorescence Nanoprobe for Quantitative Detection of H2S in Colon Cancer. Anal. Chem. 93, 9356–9363. doi:10.1021/acs.analchem.1c00427
Wang, N., Yu, X., Zhang, K., Mirkin, C. A., and Li, J. (2017). Upconversion Nanoprobes for the Ratiometric Luminescent Sensing of Nitric Oxide. J. Am. Chem. Soc. 139, 12354–12357. doi:10.1021/jacs.7b06059
Wang, F., Wan, H., Ma, Z., Zhong, Y., Sun, Q., Tian, Y., et al. (2019a). Light-Sheet Microscopy in the Near-Infrared II Window. Nat. Methods. 16, 545–552. doi:10.1038/s41592-019-0398-7
Wang, S., Liu, L., Fan, Y., El-Toni, A. M., Alhoshan, M. S., Li, D., et al. (2019b). In Vivo High-resolution Ratiometric Fluorescence Imaging of Inflammation Using NIR-II Nanoprobes With 1550 Nm Emission. Nano Lett. 19, 2418–2427. doi:10.1021/acs.nanolett.8b05148
Wang, S., Fan, Y., Li, D., Sun, C., Lei, Z., Lu, L., et al. (2019c). Anti-Quenching NIR-II Molecular Fluorophores for In Vivo High-Contrast Imaging and pH Sensing. Nat. Commun. 10, 1058. doi:10.1038/s41467-019-09043-x
Wang, T., Wang, S., Liu, Z., He, Z., Yu, P., Zhao, M., et al. (2021d). A Hybrid Erbium(III)-Bacteriochlorin Near-Infrared Probe for Multiplexed Biomedical Imaging. Nat. Mater. 31. doi:10.1038/s41563-021-01063-7
Welsher, K., Liu, Z., Sherlock, S. P., Robinson, J. T., Chen, Z., Daranciang, D., et al. (2009). A Route to Brightly Fluorescent Carbon Nanotubes for Near-Infrared Imaging in Mice. Nat. Nanotech. 4, 773–780. doi:10.1038/nnano.2009.294
Welsher, K., Sherlock, S. P., and Dai, H. (2011). Deep-tissue Anatomical Imaging of Mice Using Carbon Nanotube Fluorophores in the Second Near-Infrared Window. Proc. Natl. Acad. Sci. 108, 8943–8948. doi:10.1073/pnas.1014501108
Wu, D., Sedgwick, A. C., Gunnlaugsson, T., Akkaya, E. U., Yoon, J., and James, T. D. (2017). Fluorescent Chemosensors: the Past, Present and Future. Chem. Soc. Rev. 46, 7105–7123. doi:10.1039/c7cs00240h
Xu, G., Yan, Q., Lv, X., Zhu, Y., Xin, K., Shi, B., et al. (2018). Imaging of Colorectal Cancers Using Activatable Nanoprobes with Second Near-Infrared Window Emission. Angew. Chem. Int. Ed. 57, 3626–3630. doi:10.1002/anie.201712528
Yang, Q., Ma, H., Liang, Y., and Dai, H. (2021a). Rational Design of High Brightness NIR-II Organic Dyes With S-D-A-D-S Structure. Acc. Mater. Res. 2, 170–183. doi:10.1021/accountsmr.0c00114
Yang, H., Li, R., Zhang, Y., Yu, M., Wang, Z., Liu, X., et al. (2021b). Colloidal Alloyed Quantum Dots with Enhanced Photoluminescence Quantum Yield in the NIR-II Window. J. Am. Chem. Soc. 143, 2601–2607. doi:10.1021/jacs.0c13071
Yang, Y., Wang, P., Lu, L., Fan, Y., Sun, C., Fan, L., et al. (2018). Small-Molecule Lanthanide Complexes Probe for Second Near-Infrared Window Bioimaging. Anal. Chem. 90, 7946–7952. doi:10.1021/acs.analchem.8b00603
Yang, Z., Chen, J., Yao, J., Lin, R., Meng, J., Liu, C., et al. (2014). Multi-Parametric Quantitative Microvascular Imaging With Optical-Resolution Photoacoustic Microscopy In Vivo. Opt. Express. 22, 1500–1511. doi:10.1364/OE.22.001500
Ye, J., Li, Z., Fu, Q., Li, Q., Zhang, X., Su, L., et al. (2020). Quantitative Photoacoustic Diagnosis and Precise Treatment of Inflammation In Vivo Using Activatable Theranostic Nanoprobe. Adv. Funct. Mater. 30, 2001771. doi:10.1002/adfm.202001771
Yu, W., Guo, B., Zhang, H., Zhou, J., Yu, X., Zhu, L., et al. (2019). NIR-II Fluorescence In Vivo Confocal Microscopy With Aggregation-Induced Emission Dots. Sci. Bull. 64, 410–416. doi:10.1016/j.scib.2019.02.019
Zhang, D., Wei, Y., Chen, K., Zhang, X., Xu, X., Shi, Q., et al. (2015). Biocompatible Reactive Oxygen Species (ROS)-Responsive Nanoparticles as Superior Drug Delivery Vehicles. Adv. Healthc. Mater. 4, 69–76. doi:10.1002/adhm.201400299
Zhang, X.-D., Wang, H., Antaris, A. L., Li, L., Diao, S., Ma, R., et al. (2016). Traumatic Brain Injury Imaging in the Second Near-Infrared Window With a Molecular Fluorophore. Adv. Mater. 28, 6872–6879. doi:10.1002/adma.201600706
Zhao, M., Li, B., Wu, Y., He, H., Zhu, X., Zhang, H., et al. (2020). A Tumor‐Microenvironment‐Responsive Lanthanide-Cyanine FRET Sensor for NIR‐II Luminescence‐Lifetime In Situ Imaging of Hepatocellular Carcinoma. Adv. Mater. 32, 2001172. doi:10.1002/adma.202001172
Zheng, Z., Li, D., Liu, Z., Peng, H. Q., Sung, H. H. Y., Kwok, R. T. K., et al. (2019). Aggregation‐Induced Nonlinear Optical Effects of AIEgen Nanocrystals for Ultradeep In Vivo Bioimaging. Adv. Mater. 31, 1904799. doi:10.1002/adma.201904799
Zhou, J., Jiang, Y., Hou, S., Upputuri, P. K., Wu, D., Li, J., et al. (2018a). Compact Plasmonic Blackbody for Cancer Theranosis in the Near-Infrared II Window. ACS Nano. 12, 2643–2651. doi:10.1021/acsnano.7b08725
Zhou, L., Fan, Y., Wang, R., Li, X., Fan, L., and Zhang, F. (2018b). High-Capacity Upconversion Wavelength and Lifetime Binary Encoding for Multiplexed Biodetection. Angew. Chem. Int. Ed. 57, 12824–12829. doi:10.1002/anie.201808209
Zhu, C.-N., Jiang, P., Zhang, Z.-L., Zhu, D.-L., Tian, Z.-Q., and Pang, D.-W. (2013). Ag2Se Quantum Dots With Tunable Emission in the Second Near-Infrared Window. ACS Appl. Mater. Inter. 5, 1186–1189. doi:10.1021/am303110x
Zhu, S., Hu, Z., Tian, R., Yung, B. C., Yang, Q., Zhao, S., et al. (2018a). Repurposing Cyanine NIR-I Dyes Accelerates Clinical Translation of Near-Infrared-II (NIR-II) Bioimaging. Adv. Mater. 30, 1802546. doi:10.1002/adma.201802546
Zhu, S., Herraiz, S., Yue, J., Zhang, M., Wan, H., Yang, Q., et al. (2018b). 3D NIR‐II Molecular Imaging Distinguishes Targeted Organs with High‐Performance NIR‐II Bioconjugates. Adv. Mater. 30, 1705799. doi:10.1002/adma.201705799
Zhu, S., Tian, R., Antaris, A. L., Chen, X., and Dai, H. (2019). Near‐Infrared‐II Molecular Dyes for Cancer Imaging and Surgery. Adv. Mater. 31, 1900321. doi:10.1002/adma.201900321
Zhu, S., Yang, Q., Antaris, A. L., Yue, J., Ma, Z., Wang, H., et al. (2017). Molecular Imaging of Biological Systems With a Clickable Dye in the Broad 800- to 1,700-nm Near-Infrared Window. Proc. Natl. Acad. Sci. USA. 114, 962–967. doi:10.1073/pnas.1617990114
Keywords: NIR-II bioimaging, In vivo quantitative analysis, ratiometric, fluorescence, photoacoustic, lifetime
Citation: Yang S, Tan X, Tang L and Yang Q (2021) Near-Infrared-II Bioimaging for in Vivo Quantitative Analysis. Front. Chem. 9:763495. doi: 10.3389/fchem.2021.763495
Received: 24 August 2021; Accepted: 11 October 2021;
Published: 15 November 2021.
Edited by:
Xiaodong Zhang, Tianjin University, ChinaReviewed by:
Zuhai Lei, Fudan University, ChinaCopyright © 2021 Yang, Tan, Tang and Yang. This is an open-access article distributed under the terms of the Creative Commons Attribution License (CC BY). The use, distribution or reproduction in other forums is permitted, provided the original author(s) and the copyright owner(s) are credited and that the original publication in this journal is cited, in accordance with accepted academic practice. No use, distribution or reproduction is permitted which does not comply with these terms.
*Correspondence: Li Tang, dGFuZ2xpY3FAb3V0bG9vay5jb20=; Qinglai Yang, cWluZ3l1NTEzQHVzYy5lZHUuY24=
Disclaimer: All claims expressed in this article are solely those of the authors and do not necessarily represent those of their affiliated organizations, or those of the publisher, the editors and the reviewers. Any product that may be evaluated in this article or claim that may be made by its manufacturer is not guaranteed or endorsed by the publisher.
Research integrity at Frontiers
Learn more about the work of our research integrity team to safeguard the quality of each article we publish.