 Fereshteh Emami
 Hamid Abdollahi2
 Tsyuoshi Minami
- 1Department of Chemistry and Physics, Southeastern Louisiana University, Hammond, LA, United States
- 2Department of Chemistry, Institute for Advanced Studies in Basic Sciences, Zanjan, Iran
- 3Institute of Industrial Science, The University of Tokyo, Meguro-ku, Japan
The power of sensing molecules is often characterized in part by determining their thermodynamic/dynamic properties, in particular the binding constant of a guest to a host. In many studies, traditional nonlinear regression analysis has been used to determine the binding constants, which cannot be applied to complex systems and limits the reliability of such calculations. Supramolecular sensor systems include many interactions that make such chemical systems complicated. The challenges in creating sensing molecules can be significantly decreased through the availability of detailed mathematical models of such systems. Here, we propose uncovering accurate thermodynamic parameters of chemical reactions using better-defined mathematical modeling-fitting analysis is the key to understanding molecular assemblies and developing new bio/sensing agents. The supramolecular example we chose for this investigation is a self-assembled sensor consists of a synthesized receptor, DPA (DPA = dipicolylamine)-appended phenylboronic acid (1) in combination with Zn2+(1.Zn) that forms various assemblies with a fluorophore like alizarin red S (ARS). The self-assemblies can detect multi-phosphates like pyrophosphate (PPi) in aqueous solutions. We developed a mathematical model for the simultaneous quantitative analysis of twenty-seven intertwined interactions and reactions between the sensor (1.Zn-ARS) and the target (PPi) for the first time, relying on the Newton-Raphson algorithm. Through analyzing simulated potentiometric titration data, we describe the concurrent determination of thermodynamic parameters of the different guest-host bindings. Various values of temperatures, initial concentrations, and starting pHs were considered to predict the required measurement conditions for thermodynamic studies. Accordingly, we determined the species concentrations of different host-guest bindings in a generalized way. This way, the binding capabilities of a set of species can be quantitatively examined to systematically measure the power of the sensing system. This study shows analyzing supramolecular self-assemblies with solid mathematical models has a high potential for a better understanding of molecular interactions within complex chemical networks and developing new sensors with better sensing effects for bio-purposes.
1 Introduction
The capability to precisely detect a target system and monitor its variation over time is highly desirable in various fields, including biological studies, diagnosis, and quality control. Some sensor-target combinations include equilibrium, kinetic, or intertwined equilibrium-kinetic chemical interactions like supramolecular sensors (Johnson-Buck et al., 2015). Other sensor interactions with targets may trigger chemical, electrical, and mechanical changes like hydrogel sensors (Gladman et al., 2016). Supramolecular chemistry is an emergent research field taking its roots in chemistry. Its combination with biology opens a new direction in the study of life and its origin (Vicens and Vicens, 2011). The last several years have seen substantial growth in the field, and many detection efforts have focused on the use of fluorescent supramolecular sensors in cells and tissues (Lim et al., 2005; Palmer and Tsien, 2006; Que et al., 2008; Wong et al., 2009). In many chemical and biological processes, including molecular self-assembly and protein-protein or protein-substrate recognition, noncovalent interactions are critically important (Mugridge, 2010). Drawing inspiration from such natural systems, supramolecular chemists seek to use these weak, nonbonding interactions to mediate the formation and reactivity of host-guest complexes. Sensing applications of supramolecular chemistry rely on exploiting the forces involved in the formation of non-covalent “host-guest” complexes. In all cases, having a binding site that is highly specific for an analyte “guest” in a measurable form is the critical key for the “host” molecules (Lehn, 1994; Goral et al., 2001; Boul et al., 2005; Pérez-Fuertes et al., 2006, 2007; Ayme et al., 2012; You et al., 2015). The continued development of improved sensors depends on achieving a thorough understanding of the underlying chemical properties of the available constructs.
The determination of accurate binding constants is an important prerequisite for the development of many host-guest complexes, which range from sensing to drug discovery and development (Giri et al., 2011; Meier and Beeren, 2014). Unfortunately, in current analyses of supramolecular self-assemblies, no efficient mathematical modeling is applied to obtain these constants. Regular 1:1 or 1:2 complexes, an indicator displacement assay, or an enantioselective indicator displacement assay are usually considered, and the apparent binding constants are determined (Connors, 1987; Hargrove et al., 2010; Sheff et al., 2011). While many assemblies are produced from the reactions/interactions among different species.
The pH has a crucial role in most chemical processes, and many reactions in aqueous solutions show a strong pH dependence (Maeder et al., 2003; Wilkins, 1991). Protonation equilibria are particularly complex with multidentate ligands. Several differently protonated forms of the ligand usually coexist in solution; all of these forms show different reactivities towards each other. As a result, the observed equilibria are strongly pH dependent. Therefore, pH-metric is a practical tool to gain insight into the reactivities of the supramolecular sensors. In this study, we use a simple potentiometric pH method to simultaneously determine thermodynamic constants of the interactions among a self-assembled sensor prepared from ZnII–DPA (DPA = dipicolylamine)-attached phenylboronic acid (1·Zn) and catechol-type dye, alizarin red S (ARS) towards pyrophosphate (PPi). We have previously used these self-assemblies to detect oligophosphates in aqueous solutions (Minami et al., 2016). We considered an indicator displacement assay and determined the apparent binding constants of ARS toward 1.Zn and phosphates toward the sensor ARS-1.Zn. However, different analytical measurements displayed the presence of multiple intertwined equilibria, including twenty-seven equilibrium interactions and reactions. A mixture of such complicated combinations makes it impossible for the simple curve fitting to reproduce the observed progression. We chose 1.Zn-ARS-PPi sensing system because, according to our previous studies, this self-assembly includes many interactions that make it very complicated. So, it is a great candidate to walk the readers through the mathematical equations. Although, this study can be generalized to any other self-assembly examples.
Here, to address this problem and avoid as many assumptions as possible, we develop iterative methods that allow for the rigorous modeling of binding equations with the help of the Newton-Raphson algorithm in MATLAB, describing the complete molecular behaviors. We highlight how the extraction of binding data from a network of equilibria with the help of well-defined mathematical modeling led to having equilibria information of all recognized species to study interactions in chemical systems. This method should be generally applicable so long as the supramolecular system is pH-dependent.
2 Computational Details
We start with an introduction to the theory of equilibria in solution, the law of mass action, the notations required for the quantitative description of the interactions, which can be rather complex, particularly in aqueous solutions. This is followed by a discussion of the types of measurements that can be carried out and the nature of the data that are delivered. Next, we introduce the computational methods are required for the analysis of the measurements. To give the reader the possibility to apply all the above concepts, we use three practical examples: the potentiometric investigation of the interactions of 1.Zn-ARS-PPi. A suite of MATLAB programs that perform the analysis of the above data sets is available from the authors.
To introduce the mathematical modeling concept, consider a species formed by only three components
where
Computer programs written for the analysis of measurements for equilibrium investigations contain two parts that require specific attention. The more obvious one is the algorithm for parameter fitting. Its task is to determine the optimal values for the parameters for a given measurement and model. In a titration experiment, the parameters to be fitted are usually the formation constants and, in the case of a spectrophotometric titration, additionally the molar absorption spectra of all-absorbing species. The other important part is computing all species concentrations for a given set of total component concentrations and formation constants. This calculation has to be performed for the solution after each addition of reagent during the complete titration. This second task forms the core of the data fitting and, therefore, we will discuss it first.
2.1 The Newton-Raphson Algorithm
The quantitative analysis of chemical equilibria is achieved using the Newton-Raphson algorithm that computes the species concentrations for a given set of formation constants and total concentrations of the components
The quantitative relationship between the concentrations of free components and species is defined by the formation constants:
Each species concentration is computed from the formation constants and the free component concentrations as given in Eq. 2 for the general equilibrium (Eq. 1. For each of the components,
In a titration process,
By substituting Eq. 2 in Eq. 3, each total component concentration can be calculated as below and stored in the matrix
where
where R is the ideal gas constant and equals 8.31 J/mol/K.
There are many ways of solving such a system of equations. The Newton-Raphson algorithm is usually well behaved and is relatively straightforward to implement. however, there is no guarantee for conversion and thus informative data measurements need to be introduced to deal with such cases. These computations are usually complex, and iterative algorithms have to be employed (Maeder and Neuhold, 2007). The algorithm starts with initial guesses for the free component concentrations to compute all species concentrations, and subsequently, mass conservation is checked. If there are any discrepancies, the iterative algorithm is continued. The explanations given here are insufficient for complete understanding, and more extensive definitions are beyond the scope of this study. For more details, we refer the readers to (Maeder and Neuhold, 2007). Analyzing the MATLAB codes supplied by the authors, see the end of this paper, can also assist the comprehension of the methods discussed.
2.2 The Newton-Gauss Algorithm
The next step is to obtain the correct
The non-linear parameters
The measure for the quality of the fit is the sum of squares, ssq, which is the sum over the squares of all elements of the vector
Eq. 9 demonstrates that
3 Results and Discussion
3.1 Plausible Mechanism of the Supramolecular Assembly
Most examples of chemical equilibria can be seen as interactions between Lewis acids and Lewis bases. In an aqueous solution, the protons are always present, and more importantly, they are also Lewis acids, which can compete with any other Lewis acid present. The protonation equilibrium can be described analogously as
The investigated supramolecular sensing system has been first introduced by Nonaka and his coworkers (Nonaka et al., 2008) to detect multi-phosphates in aqueous solutions. The synthesized receptor, DPA (DPA = dipicolylamine)-appended phenylboronic acid (1) in combination with Zn2+ (1·Zn) forms various assemblies with alizarin dye in a wide range of pHs. Among the existed complexes, ARS binds favorably to the coordinated zinc (II) in the Zn2+–DPA moiety. When PPi is added to the solution, it causes reorganization of the complex to produce an alternative boronate ester assembly. Traditionally, an indicator displacement assay is considered, and the apparent binding constants of ARS to 1·Zn and PPi to ARS-1·Zn are determined. However, analytical evidence (Nonaka et al., 2008; Tomsho and Benkovic, 2012) displayed the presence of multiple intertwined equilibria shown in Scheme 1. ARS and PPi act as two- and four-protonated weak acids,
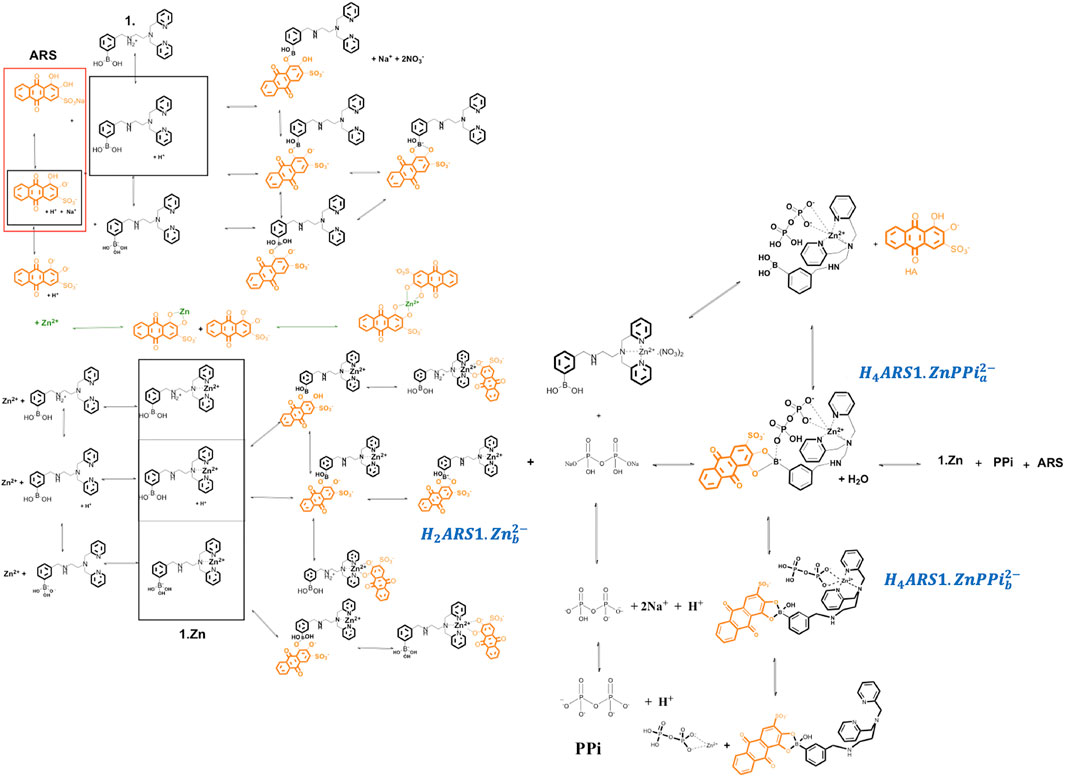
SCHEME 1. Plausible mechanism related to different interactions among 1.Zn, ARS and PPi.
3.2 Separable Interactions/Reactions of ARS-1·Zn-PPi Assemblies
It is important to develop a nomenclature that uniquely describes all the species formed in solution with their appropriate equilibrium constants. Let us concentrate on the example of ARS-1.Zn-PPi equilibrium study in aqueous solution. After having reviewed the chemical mechanism of ARS-1.Zn-PPi assemblies, the next step is to determine the key chemical players and how they will interact. This step is particularly important, as it sets the stage for how complex our model will ultimately become. Using the nomenclature commonly employed in coordination chemistry, here, five components,
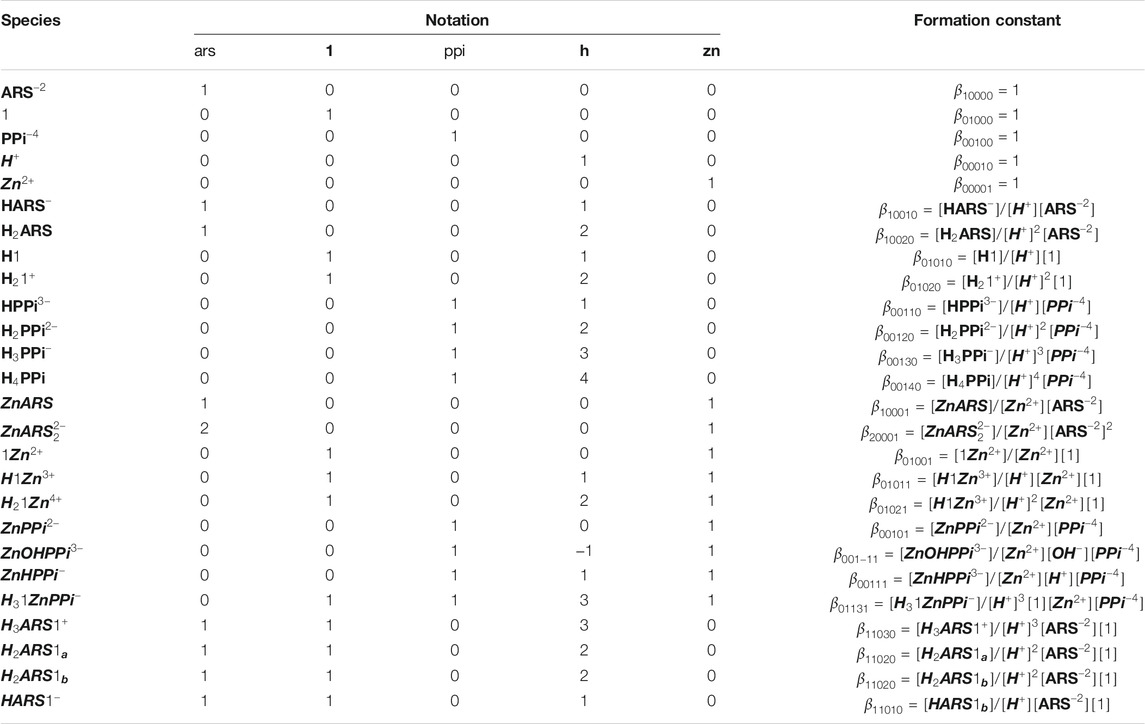
TABLE 1. Notation for equilibrium modeling of the investigated mechanism in Scheme 1.
To have a model that can be generalized to any new complex molecular mechanism, we assumed none of the thermodynamic constants associated with the combinations/dissociations among these components are known. The first step is recognizing the interactions/reactions that can be modeled independently. In this case, some of the parameters of interest to the study can be obtained separately, which makes fitting the final model simpler by decreasing the number of unknown parameters. Accordingly, we broke the mechanism shown in Scheme 1 into ten sub mechanisms for independent investigations, Sections 3.2.1–3.2.9. Each sub-model is then followed by Eqs 3–6 to simulate the concentration profiles of the species and Eqs 7–9 to fit the thermodynamic parameters.
3.2.1 Equilibria of ARS/1
For the components
Simulation of the species concentration profiles based on the above mathematical model is done using initial concentrations for
3.2.2 Pyrophosphate Protonation Equilibria
PPi can exists in four protonated forms
The mass balances regarding
3.2.3 Assemblies of Zinc-Pyrophosphate
The combination of PPi with
The equations of conservation mass of this equilibria system used in the algorithm during the titration of pyrophosphate and zinc with HCl are:
3.2.4 Interactions of Zinc and ARS
Zinc ions are capable of interacting with ARS in two steps to have 1:2 coordination complexes. The core structure of ARS—1,2-dihydroxyanthraquinone—serves as new lead structures for ratiometric probes for zinc ions (Kaushik et al., 2015; Zhang et al., 2007). According to the Newton-Raphson algorithm language, the reactions between
Mass equations corresponding to ARS equilibria and its combinations with
3.2.5 Zinc and 1 Complexes
The three nitrogens of the DPA ligand can coordinate strongly to
The corresponding mass equations are:
3.2.6
The other event from Scheme 1 that can be considered separately is the interaction of
Here we have four components and their related mass balances are as:
3.2.7 Assemblies of ARS and 1
The next consideration was the study of the binding affinities of 1 for ARS (Tomsho and Benkovic, 2012) in solutions of varying pHs. The corresponding mass balances are
As can be seen in Scheme 1, 1 and ARS interactions led to ten different forms of species.
3.2.8 Assemblies of ARS and 1·Zn
The existence of zinc in the structure of 1 makes a new moiety for a binding competition of anions like ARS. We assumed the actual binding ability of boronic acid in 1 with ARS to form
According to Scheme 1, the species that are new and should be taken into account here are
3.2.9
The final consideration is the interactions between PPi and the formed sensor
We mathematically defined the entire interactions with any order in Scheme 1 using the concept in Table 1. Each species concentration is computed from the notation in Table 1, the formation thermodynamic constants, and the free component concentrations of H-PPi–ARS–1-Zn.
3.3 Guidance on the Interaction Between Mathematical Models and Experiments
With the mathematical models in place, it is now time to begin the process of using them in concert with experiments to study the molecular sensing system. Unknown thermodynamic parameters are fit by comparing model output with data, and the model itself can be assessed by predicting an unexpected experimental outcome (Banwarth-Kuhn and Sindi, 2020). To show how this step works, we simulated different data using the model and thermodynamic parameters mentioned as “used to construct data” in Tables 2, 3, 6 with noise as a proxy to measured data for each separated part of the mechanism in Scheme 1. For each recognized sub mechanism, we optimized the physicochemical conditions of the simulated potentiometric data so that any species of the considered interactions exists at some minimal concentrations in the data. For some sub-mechanisms, regardless of initial guesses of the thermodynamic parameters being far from the used ones, we reached the results with low precision and accuracy errors like equilibria of ARS/1. However, for cases that required fitting more parameters, we had to come up with initial guesses closer to the real ones, which led to a longer fitting process. One way to avoid this problem is to collect less noisy, more informative data about all species present in the equilibria. The designed experiments for the investigation of the equilibrium network consist of a series of sample solutions with different known total concentrations of the components. The samples are titrated with a strong acid (HCl) at different temperatures to produce pH data under various conditions. There is no limit to the number of possible experiments. Apart from simple cases, pH titration will always include more data than minimally required to determine a particular parameter. It increases the robustness of the analysis and help deliver statistical information about the results, such as standard deviations of the fitted parameters. Here, the hydroxide ion is defined as negative proton concentration

TABLE 2. Obtained thermodynamic constants for the simulated pH datasets corresponding to ARS, 1 and PPi.
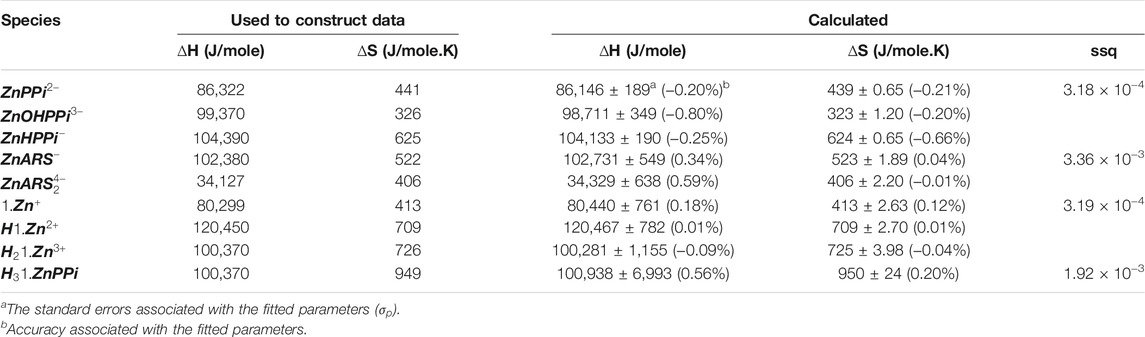
TABLE 3. Obtained affinity thermodynamic constants for the simulated pH datasets corresponding to binding affinities of
3.3.1 Fitting Thermodynamic Parameters of ARS/1 Equilibria
Concentration profiles were simulated based on the equilibrium model (Eqs 1–11), different initial concentrations for
3.3.2 Fitting Thermodynamic Parameters of Pyrophosphate Protonation Equilibria
According to the equilibria for PPi and vant’s Hoff definition, there are eight thermodynamic constants corresponding to the species to be determined. The enhanced number of unknown parameters needs finding experiment conditions that have sufficient equilibrium information. Similar to the previous section, simulation of concentration profiles based on the mathematical model (Eqs 1–9, 12–13) requires initial concentrations for the components (
3.3.3 Fitting Thermodynamic Parameters of Assemblies of Zinc-Pyrophosphate
Having the total concentrations of
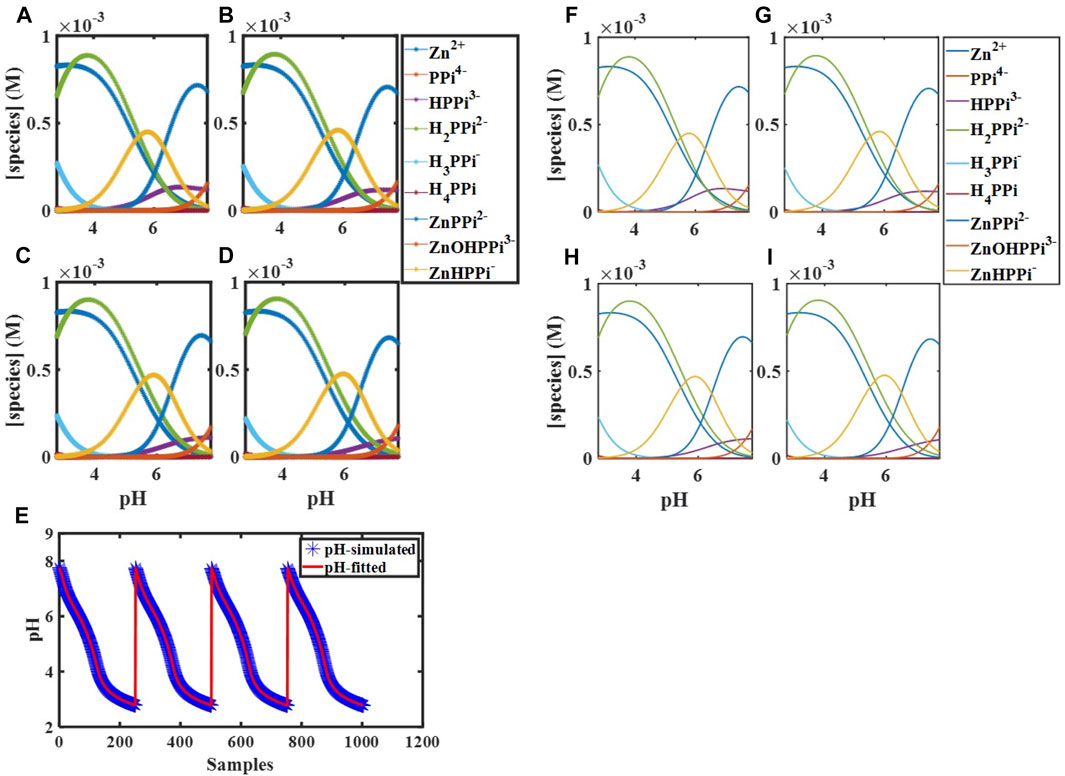
FIGURE 1. Simulated concentration profiles for
3.3.4 Fitting Thermodynamic Parameters of Zinc and ARS Interactions
Concentration profiles were simulated based on the generalized equilibrium model (Eqs 16, 17) at the same temperatures and initial concentrations we used for ARS (Section 3.3.1) along with
3.3.5 Fitting Thermodynamic Parameters of Zinc and 1 Complexes
Using the total concentrations of
3.3.6 Fitting Thermodynamic Parameters of
Concentration profiles were simulated based on the equilibrium model for two different initial concentrations of components,
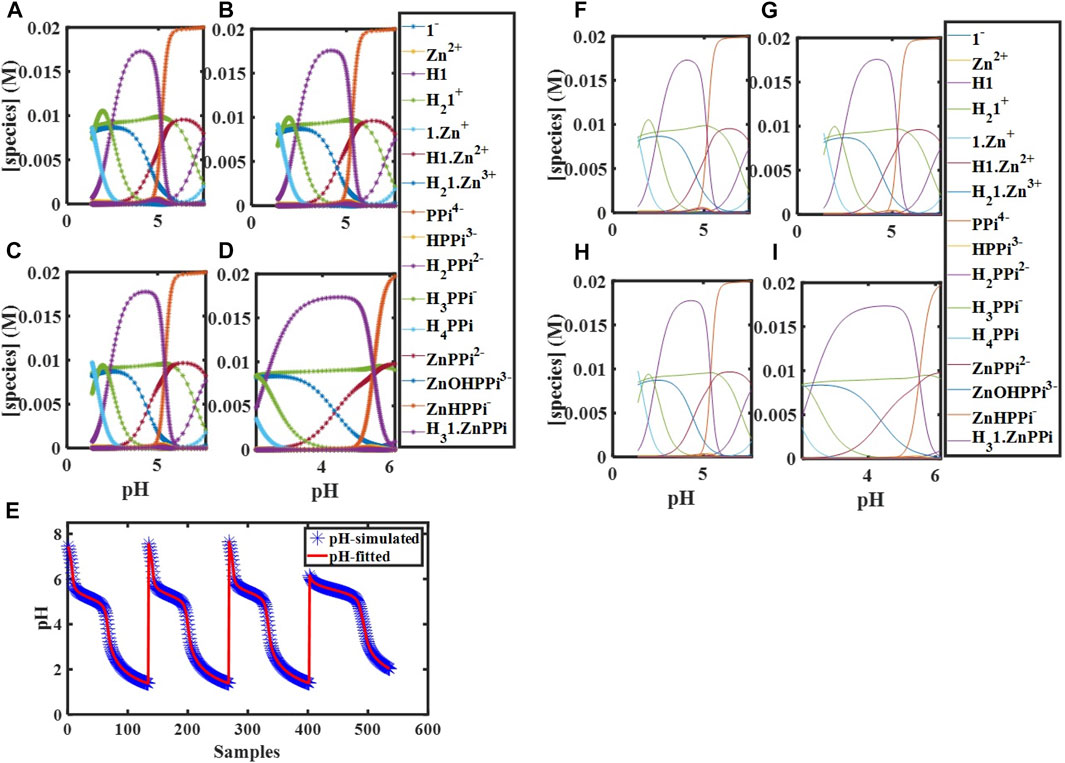
FIGURE 2. Simulated concentration profiles for
3.3.7 Fitting Thermodynamic Parameters of Assemblies of ARS and 1
The next consideration was the determination of the binding affinities of 1 to ARS in solutions of varying pHs. As can be seen in Scheme 1, ten different forms (species and components) are involved in their interactions. The thermodynamic parameters associated with
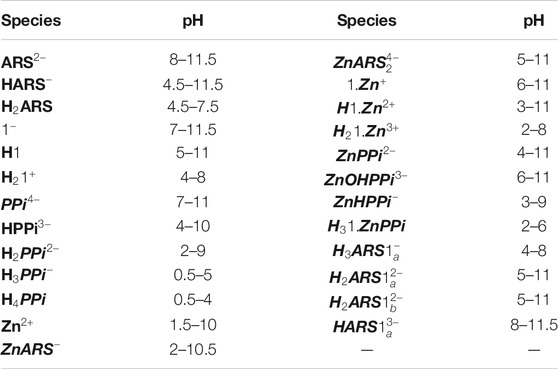
TABLE 4. The pH presence window for the species of Scheme 1.
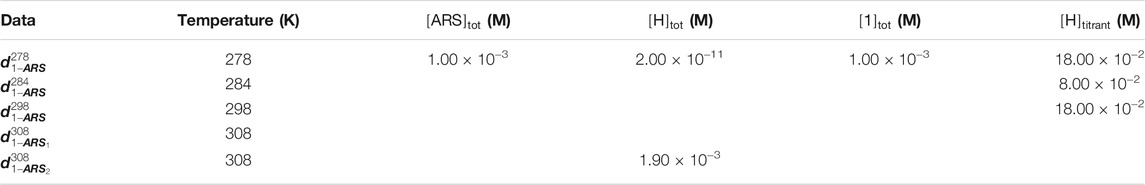
TABLE 5. Conditions of the simulated datasets related to ARS and 1 titration with a strong acid.
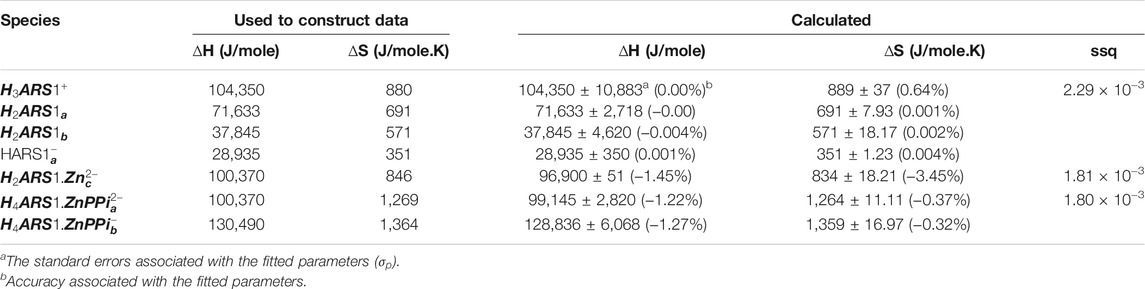
TABLE 6. Obtained affinity thermodynamic constants for the simulated pH datasets corresponding to binding affinities of ARS, 1, Zn, and PPi.
3.3.8 Fitting Thermodynamic Parameters of Assemblies of ARS and 1·Zn
According to Scheme 1, the species that are new and should be considered here are
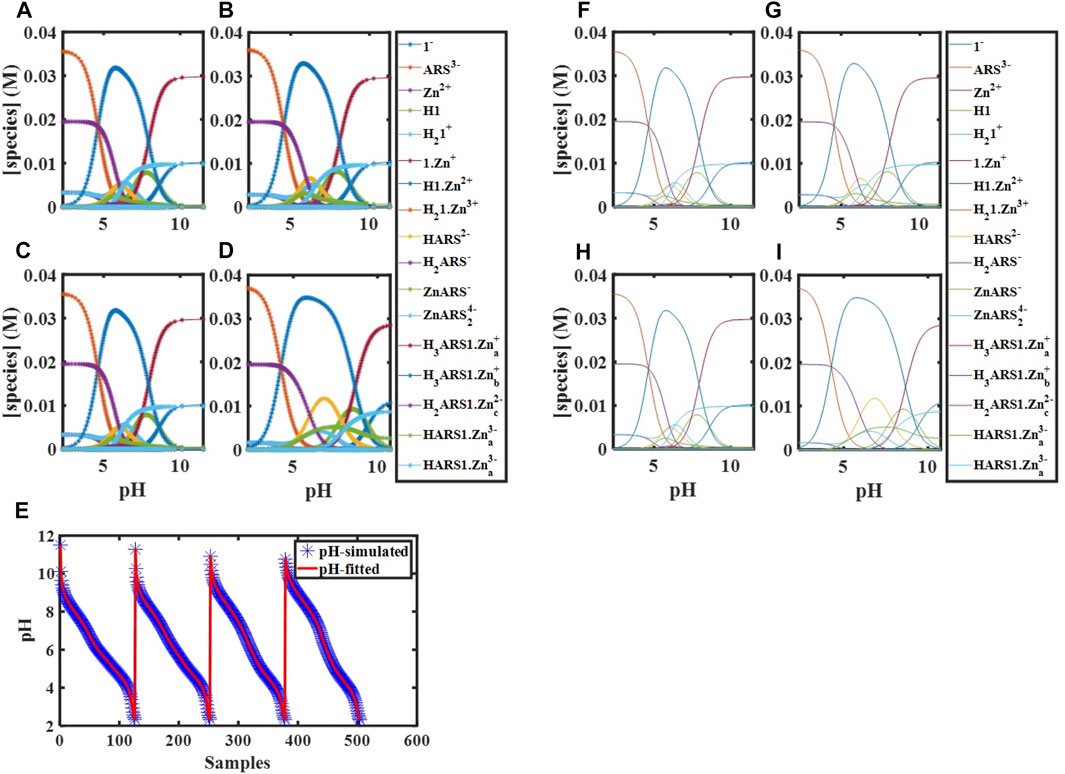
FIGURE 3. Simulated concentration profiles for
3.3.9
With the thermodynamic values for the species considered before in hand, further pH titrations were performed to determine the
3.4 Predict Optimum Conditions for Pyrophosphate Monitoring Using the Developed Mathematical Model
With fit thermodynamic parameters, the mathematical model could be probed for parameter sensitivity and can predict what should happen under particular initial conditions. When we measure data, it is often only possible to experimentally observe a subset of the state variables of interest. For example, here, only the proton concentration in the form of pH can be visualized. The mathematical model can reveal the “hidden” concentrations of all other species too.
We performed computer simulations at fitted values of binding constants, different temperatures, initial concentrations, and starting pHs using the constructed mathematical model, which describes the complete molecular behavior. These simulations enabled the visualization of the experimental variables’ effects on the desired combination (
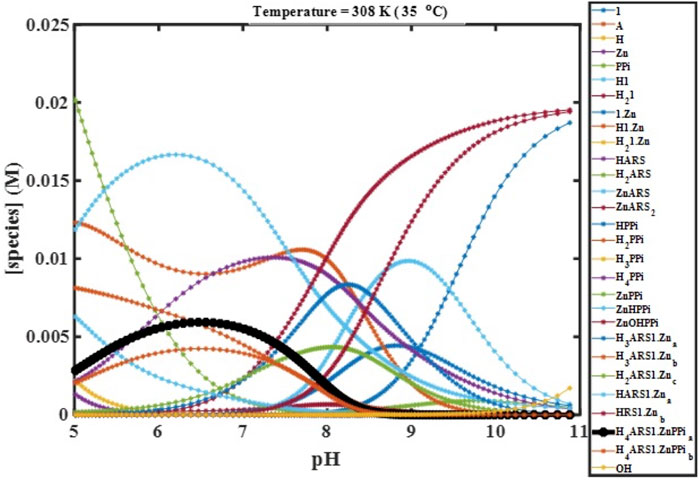
FIGURE 4. Concentration profiles of all species in the reaction mechanism (Scheme 1) at different pHs obtained using the developed model and Newton-Raphson Algorithm.
4 Conclusion
Using mathematical modeling and the proposed stepwise experiment design, we showed how to quantitatively determine the association of the entire identified interactions among 1 Zn, ARS, PPi and their combinations. After the mathematical algorithm is written in MATLAB, we determined the thermodynamic parameters constants,
Our results demonstrate the power of potentiometric titrations when used in conjunction with mathematical modeling methods to reveal details of the mechanisms of the complex fluorescent sensors used widely in biological chemistry. The significance of this subject can be very much enhanced by the possibility of easily describing mathematically the behavior of complex systems and fine-tuning them for different applications. The very important point in gaining potentiometric data is the pH changes related to the presence region of each species should have adequate titration points. Based on these insights, we highlight how the extraction of binding data from a network of equilibria using mathematical modeling can produce optimum conditions for real-time oligophosphate monitoring. General speaking, the results represent a significant step forward in elucidating the chemistry of complex fluorescent probes and provide a paradigm for future work in this area.
Data Availability Statement
The original contributions presented in the study are included in the article/Supplementary Material, further inquiries can be directed to the corresponding author.
Author Contributions
FE developed the model, performed the calculations, wrote the manuscript, and directed the research. HA advised on developing the model. TM advised on figuring the details of the supramolecular mechanism. BP and SR helped to achieve the simulations and analyze the data.
Funding
We gratefully acknowledge research reported in this publication is based upon work supported by the National Institute of General Medical Sciences of the National Institutes of Health under Award Number R15GM134492. The content is solely the responsibility of the authors and does not necessarily represent the official views of the National Institutes of Health.
Conflict of Interest
The authors declare that the research was conducted in the absence of any commercial or financial relationships that could be construed as a potential conflict of interest.
Publisher’s Note
All claims expressed in this article are solely those of the authors and do not necessarily represent those of their affiliated organizations, or those of the publisher, the editors and the reviewers. Any product that may be evaluated in this article, or claim that may be made by its manufacturer, is not guaranteed or endorsed by the publisher.
Supplementary Material
The Supplementary Material for this article can be found online at: https://www.frontiersin.org/articles/10.3389/fchem.2021.759714/full#supplementary-material
References
Alberty, R. A. (1969). Standard Gibbs Free Energy, Enthalpy, and Entropy Changes as a Function of pH and pMg for Several Reactions Involving Adenosine Phosphates. J. Biol. Chem., 244(12), 3290–3302. doi:10.1016/S0021-9258(18)93127-3
Anslyn, E. V. (2007). Supramolecular Analytical Chemistry. J. Org. Chem. 72 (3), 687–699. doi:10.1021/jo0617971
Ayme, J.-F., Beves, J. E., Leigh, D. A., McBurney, R. T., Rissanen, K., and Schultz, D. (2012). A Synthetic Molecular Pentafoil Knot. Nat. Chem 4 (1), 15–20. doi:10.1038/NCHEM.1193
Banwarth-Kuhn, M., and Sindi, S. (2020). How and Why to Build a Mathematical Model: A Case Study Using Prion Aggregation. J. Biol. Chem. 295 (15), 5022–5035. doi:10.1074/jbc.REV119.009851
Bevington, P. R., Robinson, D. K., Blair, J. M., Mallinckrodt, A. J., and McKay, S. (1993). Data Reduction and Error Analysis for the Physical Sciences. Comput. Phys. 7 (4), 415–416. doi:10.1063/1.4823194
Boul, P. J., Reutenauer, P., and Lehn, J.-M. (2005). Reversible Diels−Alder Reactions for the Generation of Dynamic Combinatorial Libraries. Org. Lett. 7 (1), 15–18. doi:10.1021/ol048065k
Connors, K. A. (1987). Binding Constants: The Measurement of Molecular Complex Stability. Wiley-Interscience.
Emami, F., Maeder, M., and Abdollahi, H. (2015). Model-based Analysis of Coupled Equilibrium-Kinetic Processes: Indirect Kinetic Studies of Thermodynamic Parameters Using the Dynamic Data. Analyst 140 (9), 3121–3135. doi:10.1039/C4AN02279C
Giri, J., Diallo, M. S., Simpson, A. J., Liu, Y., Goddard, W. A., Kumar, R., et al. (2011). Interactions of Poly(amidoamine) Dendrimers with Human Serum Albumin: Binding Constants and Mechanisms. Acs Nano 5 (5), 3456–3468. doi:10.1021/nn1021007
Goral, V., Nelen, M. I., Eliseev, A. V., and Lehn, J.-M. (2001). Double-level "orthogonal" Dynamic Combinatorial Libraries on Transition Metal Template. Proc. Natl. Acad. Sci. 98 (4), 1347–1352. doi:10.1073/pnas.98.4.1347
Gruenwedel, D. W. (1968). Multidentate Coordination Compounds. Chelating Properties of Aliphatic Amines Containing .alpha.-pyridyl Residues and Other Aromatic Ring Systems as Donor Groups. Inorg. Chem. 7 (3), 495–501. doi:10.1021/ic50061a022
Hargrove, A. E., Zhong, Z., Sessler, J. L., and Anslyn, E. V. (2010). Algorithms for the Determination of Binding Constants and Enantiomeric Excess in Complex Host : Guest Equilibria Using Optical Measurements. New J. Chem. 34 (2), 348–354. doi:10.1039/B9NJ00498J
Johnson-Buck, A., Su, X., Giraldez, M. D., Zhao, M., Tewari, M., and Walter, N. G. (2015). Kinetic Fingerprinting to Identify and Count Single Nucleic Acids. Nat. Biotechnol. 33 (7), 730–732. doi:10.1038/nbt.3246
Kaushik, R., Kumar, P., Ghosh, A., Gupta, N., Kaur, D., Arora, S., et al. (2015). Alizarin Red S-Zinc(ii) Fluorescent Ensemble for Selective Detection of Hydrogen Sulphide and Assay with an H2S Donor. RSC Adv. 5 (97), 79309–79316. doi:10.1039/C5RA11901D
Lehn, J.-M. (1994). Supramolecular Chemistry. Proc. Indian Acad. Sciences-Chemical Sci. 106, 915–922.
Lim, N. C., Freake, H. C., and Brückner, C. (2005). Illuminating Zinc in Biological Systems. Chem. - A Eur. J. 11 (1), 38–49. doi:10.1002/chem.200400599
Maeder, M., and Neuhold, Y.-M. (2007). Practical Data Analysis in Chemistry, Vol. 26. (Newcastle, Australia: Elsevier).
Maeder, M., Neuhold, Y.-M., Puxty, G., and King, P. (2003). Analysis of Reactions in Aqueous Solution at Non-constant pH: No More Buffers? Phys. Chem. Chem. Phys. 5 (13), 2836–2841. doi:10.1039/B301488F
Martínez‐Máñez, R. (2014). Virtual Issue:Molecular Sensors. Wiley Online Library. Nicosia, New Jersey
Meier, S., and Beeren, S. R. (2014). Simultaneous Determination of Binding Constants for Multiple Carbohydrate Hosts in Complex Mixtures. J. Am. Chem. Soc. 136 (32), 11284–11287. doi:10.1021/ja506130q
Minami, T., Emami, F., Nishiyabu, R., Kubo, Y., and Anzenbacher, P. (2016). Quantitative Analysis of Modeled ATP Hydrolysis in Water by a Colorimetric Sensor Array. Chem. Commun. 52 (50), 7838–7841. doi:10.1039/C6CC02923J
Moe, O. A., and Wiest, S. A. (1977). Determination of Stability Constants for Zinc-Pyrophosphate Complexes. Anal. Biochem. 77 (1), 73–78. doi:10.1016/0003-2697(77)90291-3
Mugridge, J. S. (2010). Supramolecular Host-Guest Interactions, Dynamics And Structure [PhD Thesis]. UC Berkeley.
Nonaka, A., Horie, S., James, T. D., and Kubo, Y. (2008). Pyrophosphate-induced Reorganization of a Reporter-Receptor Assembly via Boronate Esterification; a New Strategy for the Turn-On Fluorescent Detection of Multi-Phosphates in Aqueous Solution. Org. Biomol. Chem. 6 (19), 3621–3625. doi:10.1039/B808027E
O’Neil, E. J., and Smith, B. D. (2006). Anion Recognition Using Dimetallic Coordination Complexes. Coord. Chem. Rev. 250 (23–24), 3068–3080. doi:10.1016/j.ccr.2006.04.006
Palmer, A. E., and Tsien, R. Y. (2006). Measuring Calcium Signaling Using Genetically Targetable Fluorescent Indicators. Nat. Protoc. 1 (3), 1057–1065. doi:10.1038/nprot.2006.172
Parczewski, A., and Kateman, G. (1994). Prediction and Visualization of Correlations between Parameters of the Mathematical Models of Processes. Chemometrics Intell. Lab. Syst. 25 (2), 265–283. doi:10.1016/0169-7439(94)85047-X
Pérez-Fuertes, Y., Kelly, A. M., Johnson, A. L., Arimori, S., Bull, S. D., and James, T. D. (2006). Simple Protocol for NMR Analysis of the Enantiomeric Purity of Primary Amines. Org. Lett. 8 (4), 609–612. doi:10.1021/ol052776g
Que, E. L., Domaille, D. W., and Chang, C. J. (2008). Metals in Neurobiology: Probing Their Chemistry and Biology with Molecular Imaging. Chem. Rev. 108 (5), 1517–1549. doi:10.1021/cr078203u
Sheff, J. T., Lucius, A. L., Owens, S. B., and Gray, G. M. (2011). Generally Applicable NMR Titration Methods for the Determination of Equilibrium Constants for Coordination Complexes: Syntheses and Characterizations of Metallacrown Ethers with α,ω-Bis(phosphite)-polyether Ligands and Determination of Equilibrium Binding Constants to Li+. Organometallics 30 (21), 5695–5709. doi:10.1021/om200580t
Sydney Gladman, A., Matsumoto, E. A., Nuzzo, R. G., Mahadevan, L., and Lewis, J. A. (2016). Biomimetic 4D Printing. Nat. Mater 15 (4), 413–418. doi:10.1038/NMAT4544
Tomsho, J. W., and Benkovic, S. J. (2012). Elucidation of the Mechanism of the Reaction between Phenylboronic Acid and a Model Diol, Alizarin Red S. J. Org. Chem. 77 (5), 2098–2106. doi:10.1021/jo202250d
Vicens, J., and Vicens, Q. (2011). Emergences of Supramolecular Chemistry: From Supramolecular Chemistry to Supramolecular Science. J. Incl Phenom Macrocycl Chem. 71 (3), 251–274. doi:10.1007/s10847-011-0001-z
Wilkins, R. G. (1991). Kinetics and Mechanisms of Reactions of Transition Metal Complexes. (VeinHeim (Federal Republic of Germany): VCH Publishers). doi:10.1002/3527600825
Wong, B. A., Friedle, S., and Lippard, S. J. (2009). Solution and Fluorescence Properties of Symmetric Dipicolylamine-Containing Dichlorofluorescein-Based Zn2+ Sensors. J. Am. Chem. Soc. 131 (20), 7142–7152. doi:10.1021/ja900980u
You, L., Zha, D., and Anslyn, E. V. (2015). Recent Advances in Supramolecular Analytical Chemistry Using Optical Sensing. Chem. Rev. 115 (15), 7840–7892. doi:10.1021/cr5005524
Keywords: mathematical modeling, supramolecules, molecular sensing, pyrophosphate, intertwined equilibria, thermodynamic parameter fitting, enthalpy, entropy
Citation: Emami F, Abdollahi H, Minami T, Peco B and Reliford S (2021) Mathematical Modeling of a Supramolecular Assembly for Pyrophosphate Sensing. Front. Chem. 9:759714. doi: 10.3389/fchem.2021.759714
Received: 16 August 2021; Accepted: 08 November 2021;
Published: 21 December 2021.
Edited by:
Valeria Conte, University of Rome Tor Vergata, ItalyReviewed by:
Giovanni La Penna, National Research Council (CNR), ItalyUtpal Sarkar, Assam University, India
Copyright © 2021 Emami, Abdollahi, Minami, Peco and Reliford. This is an open-access article distributed under the terms of the Creative Commons Attribution License (CC BY). The use, distribution or reproduction in other forums is permitted, provided the original author(s) and the copyright owner(s) are credited and that the original publication in this journal is cited, in accordance with accepted academic practice. No use, distribution or reproduction is permitted which does not comply with these terms.
*Correspondence: Fereshteh Emami, ZmVyZXNodGVoLmVtYW1pQHNlbHUuZWR1