 Xiaoqun Li
 Xin Lin
 Ying Li
 Wei-Tao Liu
94% of researchers rate our articles as excellent or good
Learn more about the work of our research integrity team to safeguard the quality of each article we publish.
Find out more
ORIGINAL RESEARCH article
Front. Chem. , 17 August 2021
Sec. Chemical Physics and Physical Chemistry
Volume 9 - 2021 | https://doi.org/10.3389/fchem.2021.717167
This article is part of the Research Topic Interfacial Water: A Physical Chemistry Perspective, Volume II View all 11 articles
The behavior of liquid water molecules near an electrified interface is important to many disciplines of science and engineering. In this study, we applied an external gate potential to the silica/water interface via an electrolyte-insulator-semiconductor (EIS) junction to control the surface charging state. Without varying the ionic composition in water, the electrical gating allowed an efficient tuning of the interfacial charge density and field. Using the sum-frequency vibrational spectroscopy, we found a drastic enhancement of interfacial OH vibrational signals at high potential in weakly acidic water, which exceeded that from conventional bulk-silica/water interfaces even in strong basic solutions. Analysis of the spectra indicated that it was due to the alignment of liquid water molecules through the electric double layer, where the screening was weak because of the low ion density. Such a combination of strong field and weak screening demonstrates the unique tuning capability of the EIS scheme, and would allow us to investigate a wealth of phenomena at charged oxide/water interfaces.
The oxides/water interfaces are ubiquitous in nature, and are important to an enormous range of fields including environmental science, geoscience, catalysis, etc (Putnis, 2014; Covert and Hore, 2016; Schaefer et al., 2018). At these interfaces, oxide surface lattices react with vicinal water molecules, forming charged surface groups that may only be stable in aqueous environments, and lead to the formation of electric double layers (EDL) (Brown, 2001; Gaigeot et al., 2012; Sulpizi et al., 2012; Brown et al., 2016; Boily et al., 2019). The rich phenomena and functionalities of oxide/water interfaces are largely based on their interfacial charging states and properties of EDLs (Brown, 2001; Putnis, 2014; Covert and Hore, 2016; Ohno et al., 2016; Schaefer et al., 2018). For example, the water electric dipole moment can be aligned by the electrostatic field in EDL and affect the interfacial chemistry (Brown, 2001; Nihonyanagi et al., 2004; Aragones et al., 2011; Saitta et al., 2012; Brown et al., 2016; Montenegro et al., 2021). In the case of ice, such field alignment could give rise to a ferroelectric state of highly oriented water molecules, which was readily probed using the surface-sensitive sum-frequency vibrational spectroscopy (SFVS) (Miranda et al., 1998; Verdaguer et al., 2006; Anim-Danso et al., 2016). Whether similar states exist or not in the liquid phase has remained unclear. One problem is that, to achieve a strong polar ordering of water in EDLs, it requires a large electrostatic field thus a high surface charge density on the solid surface. Meanwhile, the surface charge density was usually tuned through protonation/deprotonation of surface lattices by varying the water pH value (Brown et al., 2016). Unfortunately, many oxide/water interfaces have their point-zero-charge (pzc) near neutral pH (Kosmulski, 2002; Backus et al., 2020), hence cannot reach very high surface charge density. The amorphous silicon dioxide (SiO2, silica) in water has a low pzc value of around pH 2∼3, thus can reach a high density of negative charges in strong basic solutions. However, the ion concentration in water is then inevitably large, which screens the surface field and reduces the EDL thickness (Jena et al., 2011; DeWalt-Kerian et al., 2017). In our previous study (Wang et al., 2019), we demonstrated a new scheme to control the oxide surface charging state utilizing an electrolyte-insulator-semiconductor (EIS) junction (Waleed Shinwari et al., 2007). The scheme allowed us to tune the surface charge and field without varying the electrolyte ionic composition, which provided a new dimension to control the charged solid/liquid interfaces. Nonetheless, the native oxide used before withstood only small gate potential and exhibited large leak current due to defects, which limited its tunability of the surface charging state.
In the present work, we utilized a much thicker SiO2 film of ∼100 nm that allowed the application of +/−50 V of gate potential, in contrast to the +/−1 V in the previous case. The thicker film also had a much smaller capacitance, leading to a much greater potential drop and stronger electric polarization across the film, as well as a higher net surface charge density. We used SFVS to investigate OH stretching vibrational spectra from the SiO2 interface in neutral water (exposed to the atmosphere). From zero potential to −50 V on the silicon electrode, we observed a drastic enhancement of the interfacial OH signal, which even exceeded that observed at the bulk-silica/water interfaces in strong basic solutions (Ostroverkhov et al., 2004, 2005; DeWalt-Kerian et al., 2017). The silica/water interface can be strongly negatively charged at high pH, which supposedly would induce a highly ordered interfacial water structure (Ostroverkhov et al., 2004; 2005). The greater OH intensity in our case suggested that external gating can lead to an even higher degree of polar ordering in the OH structure. Toward more positive gate potential, the OH signal dropped asymmetrically, exhibiting similar spectral profiles to those from bulk-silica/water interfaces at low pH values. Combined with fitting results, we attributed the observation to an effective field alignment of water molecules inside the diffuse layer. Because the ion density remained low in our case, the electrostatic screening of the surface field was poor, and the long-range alignment of water molecules could be readily detected. Basically, our study demonstrated the unique tuning capability of aqueous oxide interfaces by externally gating the EIS junction, and allowed us to achieve an overall greater polar alignment of interfacial water molecules compared to that achievable via conventional means.
The experimental and sample geometries were sketched in Figure 1A. The silicon (Si) substrate was in contact with a copper ring as the gate electrode, and a platinum wire in water serving as the ground (GND). A silicon dioxide (SiO2) thin film of about ∼100 nm-thick was deposited through magnetron sputtering procedure (DE500 Sputter) on the silicon wafer (0.5 mm-thick Si (100), n-doped, resistivity: 1–10 Ω cm). A source meter (Keithley 2400) was used to control the gate potential (Ug) and measure the leak current between the two electrodes. Figure 1B shows the leak current versus Ug from a test sample. Within Ug of −50 ∼ +50 V, the leak current was small and almost increased linearly with Ug, without any sudden jump indicating breakdown of the oxide film. We thus limited Ug between −50 and +50 V in the present study.
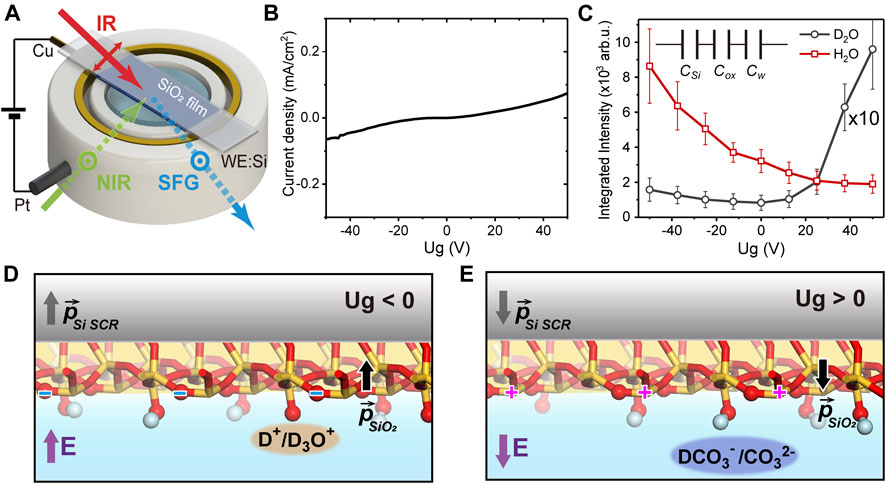
FIGURE 1. (A) Sketch of the experimental geometry. (B) The leak current versus the gate potential (Ug). (C) The gate-dependent spectrally-integrated SFVS signal in D2O (black, magnified by 10 times) and H2O (red). Inset: the capacitor-in-series model of the junction. Sketches of the interfacial structure in D2O experiments at (D)Ug< 0 and (E)Ug> 0.
Prior to all SF measurements, the thin-film sample was calcinated in UV ozone (BZS250GF-TC) for ∼1 h, then soaked in nonchromix/H2SO4 mixture (4 g nonchromix/100 ml H2SO4) for ∼0.5 h and rinsed thoroughly with deionized water (18.2 MΩ cm, Thermo Scientific Barnstead MicroPure UV). Besides, the Teflon cell was ultrasonicated successively in acetone, ethanol, and deionized water. Ultrapure deionized water and deuterated water (Sigma Aldrich, 99.9 atom % D) were used in the experiment.
A regenerative amplifier (Spitfire, Spectra-Physics) seeded by a Ti:sapphire oscillator (MaiTai SP, Spectra-Physics) was used to produce about 7 W of 800 nm, 35 fs pulses at a 2 kHz repetition rate. Around 40% output beam was used to generate a broadband IR beam (∼500 cm−1) centered at about 3,300 cm−1 by pumping an TOPAS-C/DFG system (Spectra-Physics), while the rest of the output beam was used to generate a narrowband beam (NIR) of ∼3 nm bandwidth by passing through an interference filter (LL01-808-25, Semrock). The NIR and IR beams were then focused and overlapped at the silica/water interface with incident angles of 45° and 60° (in air), respectively. The generated SFG signal was detected by a spectrograph (Acton SP300i, Princeton Instruments) and CCD camera (PyLoN: 400BR eXcelon, Princeton Instruments). All SF experiments were conducted in the atmosphere and room temperature. The beam polarization combination used was SSP (S for the SF beam, S for NIR, and P for IR).
The operation principle of the electrolyte-insulator-semiconductor junction was described elsewhere (Waleed Shinwari et al., 2007; Wang et al., 2019). In a simplified representation, the Si/SiO2/water EIS junction can be modelled as three capacitors in series [CSi, Cox and Cw (water), see insert of Figure 1C], with the respective capacitances per unit area being Ci∼ ε0εri/di (i = Si, ox, w). ε0 is the vacuum permittivity, εri and di are the dielectric constant and effective thickness of the ith layer, respectively. The charge density on each plate of the capacitors can be estimated via σ ∼ UgCtot = ∆ϕiCi, from which the potential drop on the ith layer (∆ϕi) could be obtained. The electrostatic field across each layer is then Ei ∼ ∆ϕi/di. Compared to our previous study (Wang et al., 2019), the SiO2 film in this case was much thicker, leading to a much smaller Cox. The potential drop was then mostly on the oxide film (∼64%) instead of mostly on Si (Wang et al., 2019), which caused the electrostatic field as well as the dielectric polarization in the oxide layer to be much greater. The large polarization further led to a high surface density of bound charges that distributed on both oxygen and silicon sites (Jackson, 1999). This is also different from the previous case, where all surface charges were assumed to result from the protonation/deprotonation reactions (Wang et al., 2019). With CSi ∼ 0.065 μF/cm2, Cw ∼ 12 μF/cm2 [effective capacitances deduced from (Wang et al., 2019)], and dox = 100 nm, εrSi ∼ 12, εrox = 3.9, and εrw ∼ 80, we estimated that at Ug ∼ 50 V, the total surface charge density on oxide is ∼0.07 e/nm2 (e refers to the elementary charge), and the electrostatic field within the interfacial water layer is about 4–16 mV/nm (between the two extreme cases when all charges are assumed to be reactive or bounded). Both were much greater than those achieved before, thus allowed us to investigate a much broader range of phenomena.
The basic principle of SFG was described elsewhere (Tian and Shen, 2014). As in a typical SFVS experiment, an infrared (IR) and a near infrared (NIR) beam are overlapped at the interface and generate a sum-frequency (SF) signal with a frequency of ωSF= ωNIR+ ωIR. The total SF signal intensity is:
where
with Aq, ωq, Γq corresponding to the amplitude, frequency and the damping coefficient of the qth resonance mode, respectively.
As mentioned above, the total SF response consisted of both non-resonant and resonant contributions. For references, we first filled the cell with D2O and took SF spectra in the OH stretching vibrational range. Since D2O yields negligible signal within this range (Nihonyanagi et al., 2011; Myalitsin et al., 2016), we could therefore single out the non-resonant response (Wang et al., 2019). Figure 1C presented the gate-dependent, spectrally-integrated SF signal with D2O. In the previous study, for Ug between −1 and +1 V, the integrated non-resonant signal exhibited a quadratic dependence on Ug as expected for the electric-field-induced response from Si SCR (Lüpke, 1999; Wang et al., 2019), which almost vanished near the flat-band potential, and grew symmetrically around it (Wang et al., 2019). Yet here, within a much greater potential range between −50 and +50 V, the non-resonant SF signal was no longer quadratic, nor symmetric, with respect to Ug (Figure 1C) (Bian et al., 2018). The minimum still appeared near Ug ∼ 0, but the signal grew faster toward positive Ug compared to negative Ug. This obvious deviation from a pure electric-field-induced behavior indicated that the non-resonant signal from other parts of the junction must be taken into accounts. Since the polarization of the SiO2 film and the charge density at SiO2/water interface are both much greater than those in the previous study, they can also contribute to the overall non-resonant response. We then attribute the deviation from quadratic response to the asymmetric interaction between the SiO2 surface and ionic species in the electrolyte at positive/negative Ug. The water solution we used is weakly acidic (pH 5.8) due to the atmospheric carbon dioxide, so the major ionic species reacting with SiO2 are the positively charged hydroniums (H3O+/D3O+) or protons (H+/D+). At Ug < 0, the Si SCR, SiO2 film, and the SiO2/D2O interface were all polarized along the “upward” direction (defined to be pointing water to oxide) (Figure 1D). This led to a negative net charge density, including bound charges on bridging oxygen sites and SiO− moieties. The latter could be protonated by above cations accumulating at the interface, thus partly compensated the overall polarization and the non-resonant signal strength. While at Ug > 0, the polarization of the SiO2 film was “downward” (Figure 1E), which resulted in a positive density of bound charges, most likely on silicon sites. The major anions (HCO3−/DCO3− or CO32−) attracted to the surface could not react with such silicon sites, and could not compensate for the surface charges as cations did. Combined this could cause the non-resonant signal to be weaker at Ug < 0, and stronger at Ug > 0.
We then filled the cell with H2O and took OH spectra, which are presented in Figure 2A with varying Ug. To correct for the variation in the infrared input energy, spectra were normalized to the intensity profile of non-resonant SiO2/D2O spectra. And since the non-resonant spectra profiles were not sensitive to the potential, we use the averaged spectra at all potentials for normalization to increase the signal-noise-ratio. In the previous study for Ug between −1 and +1 V, the non-resonant signal from Si SCR was comparable to the OH resonances from H2O, and spectra were from the interference between the two components (Wang et al., 2019). Here with a much thicker film, and at much greater Ug, the spectra became dominated by OH resonances (Figures 1C, 2A). We first discuss the overall intensity variation of OH spectra versus potential. The integrated spectral intensity was the lowest at the most positive potential, grew slowly as approaching the neutral potential, but started to increase rapidly toward more negative potential (Figure 1C). Since the ionic composition remained unchanged in our case, so did the Debye length and beam coherence length, change in the spectral intensity directly reflected the degree of polar orientation of contributing OH moieties. From the features mentioned above, we concluded that the OH bonds were less (more) ordered when the surface was covered by positive (negative) bound charges. The overall trend agreed with that observed for the bulk-SiO2/H2O interfaces, that OH intensity is greater at higher pH value (Ostroverkhov et al., 2004; 2005; DeWalt-Kerian et al., 2017), as well as at lower ion concentrations (Jena and Hore, 2009; Yang et al., 2009; Jena et al., 2011; Li et al., 2015; Hore and Tyrode, 2019). Without extra buffer ions, the highest OH peak intensity recorded was near pH 11.5, and was roughly twice of that at pH 5.8 at the SiO2/H2O interface (Ostroverkhov et al., 2004; 2005; DeWalt-Kerian et al., 2017). While in our case, the peak intensity at Ug = −50 V was over three times greater than that at Ug = 0 V. The zero potential spectrum corresponded to the usual pH 5.8 spectrum for a bulk-SiO2/H2O interface (Wang et al., 2019). That means we achieved an even higher degree of polar orientation of interfacial OH bonds than that achievable at the bulk-SiO2/H2O interface. At pH 11.5, the SiO2 surface is often regarded as highly deprotonated with a surface charge density being ∼ −1.4 e/nm2; meanwhile, the Debye length is about 5.3 nm (without additional buffer ions), and the SF signal in the OH range is considered mostly from the topmost layer of water molecules directly adsorbed to the interface, or equivalently, in the bonded interfacial layer (Figures 2C,D) or topmost EDL layer (Urashima et al., 2018). In our system, at pH 5.8 and Ug = −50 V, the net charge density was lower than that at pH 11.5, but the Debye length is as long as 240 nm due to the low ion concentration (the beam coherence length was 50–60 nm). Therefore, the strong SF signal at negative Ug could contain a large contribution from water molecules in the diffuse layer (Figures 2C,D). According to the classical dynamic simulation, an electrostatic field as strong as 101 mV/nm was needed to appreciably reorient the interfacial water molecules (Wang et al., 2019). The gating field in our case is strong enough to make the above scenario possible.
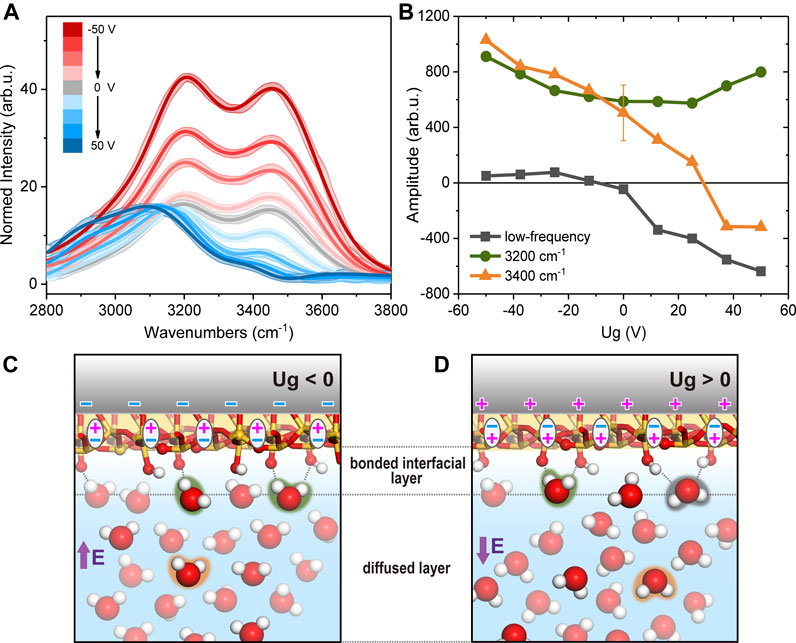
FIGURE 2. (A) Normalized SFVS spectra in H2O. Solid curves are fits. (B) Fitted amplitudes of the low frequency mode (black square), 3,200 cm−1 (green circle) and 3,400 cm−1 (orange triangle) modes. Sketches of the interfacial structures in H2O when (C)Ug< 0 and (D)Ug> 0.
Before we go on with detailed analysis of OH spectra, we would like to emphasize again that in the present study with a thick silica film, a large portion of the surface charges was due to the polarization of oxide film. As we mentioned above, the distribution of bound charges is not necessarily the same with that from surface chemistry. For example, when pH is low, the positive charge centers are on SiOH2+ moieties at the bulk-silica/water interface due to protonation of SiOH species; while upon gating, positive surface charges could be simply due to the polarization of Si-O bonds. With only interfacial OH spectra, we could not distinguish between the two cases at this stage, thus only qualitative interpretations would be provided as follows. Here we discuss the overall variation in the spectral profile. Like those from bulk-SiO2/H2O interfaces, our spectra exhibited two major resonance features (Ostroverkhov et al., 2004; 2005; Myalitsin et al., 2016): the one at ∼3,200 cm−1 and another at ∼3,400 cm−1. The exact origin of the two peaks is still being investigated (Sovago et al., 2008; Myalitsin et al., 2016), but it is generally agreed that the lower the OH stretching frequency is, the stronger, and/or more ordered, H-bonding environment the corresponding moieties sense. On the bulk-SiO2/H2O interfaces, the 3,200 cm−1 mode (assigned to the topmost water layer (Urashima et al., 2018)) was found to grow more rapidly than the 3,400 cm−1 one (H-bonded to bulk-like water molecules (Montenegro et al., 2021)) at increasing pH, which suggested a more ordered water structure near the more negatively charged surface. In contrast, in our case, when the SiO2 surface bound charge evolved from positive to negative, the 3,400 cm−1 mode appeared to increase more rapidly. This agreed with our discussion above, that the polar ordered OH signal detected at strongly negative Ug had a large contribution from the diffuse layer composed of bulk liquid water, and thus exhibited a greater 3,400 cm−1 contribution.
Since there was no direct information about the spectral phase and exact field distribution in the EDL, we could not separate the double layer contributions as in Refs (Tian and Shen, 2014; Urashima et al., 2018). Therefore, we tentatively fitted the spectra in the conventional means by using Equations (1) and (2) (Figures 2A,B), which yielded reasonable results for qualitative understanding (Ostroverkhov et al., 2004; Myalitsin et al., 2016). Fitting parameters are also tabulated in Table 1. The fitting involved a low frequency mode ∼2,800–3,000 cm−1 besides the 3,200 cm−1 and 3,400 cm−1 modes, as in previous studies (Ostroverkhov et al., 2004; 2005; Nihonyanagi et al., 2011; Pezzotti et al., 2019; Wang et al., 2019; Rehl and Gibbs, 2021). When the surface charge varied from negative to positive, the 3,400 cm−1 mode changed from a large positive amplitude to a negative one. This corresponds to our discussion above, that water molecules inside diffuse layer made a major contribution to the 3,400 cm−1 peak and reoriented at varying Ug. This also defined that the positive amplitude from fitting corresponded to an “upward” polarization. For the lowest frequency mode, it had a negligible amplitude at negative Ug, and increased negatively toward more positive potential. This agreed with previous observations on neutral or positively charged SiO2 surfaces, and the mode could be attributed to “downward” OH groups accepting H-bonds with SiOH species (highlighted in black color in Figure 2D). The 3,200 cm−1 mode did not exhibit as much amplitude change as the other two modes, and remained positive in the whole potential range. We attributed this mode to “upward” OH groups donating H-bonds to the SiO2 surface (highlighted in green in Figures 2C,D), similarly to the findings in Refs (Urashima et al., 2018; Rehl and Gibbs, 2021). Combining the fitting results and discussions above, we summarized the microscopic pictures of the interface. At negative Ug (Figure 2C), the SiO2 film was polarized “upward”, and the surface held negative bound charges centered at oxygen sites. These sites could accept H-bonds from vicinal water molecules and caused an upward OH dipole orientation. Meanwhile, the gating field penetrating into the bulk water also rendered water molecules in diffuse layer to be aligned “upward”. The two polarizations superimposed constructively, leading to an enhancement of SF intensity at negative Ug. And due to the long Debye length in our case, the SF intensity was even stronger than that achieved at pH 11.5 for a bulk-SiO2/H2O interface. At positive Ug, the SiO2 film was polarized “downward”, and the surface held positive bound charges, presumably centered at silicon sites. Meanwhile, it was still the surface SiOH groups that form H-bonds with vicinal water molecules. As SiOH can be both H-bond donors and acceptors, they led to both upward (highlighted in green) and downward (highlighted in black) alignments of water OH groups as shown in Figure 2D. The former conflicted with the preferred downward field induced alignment (highlighted in orange) in diffuse layer (Figure 2D), and therefore the overall polar orientation was not as strong as that observed at negative Ug.
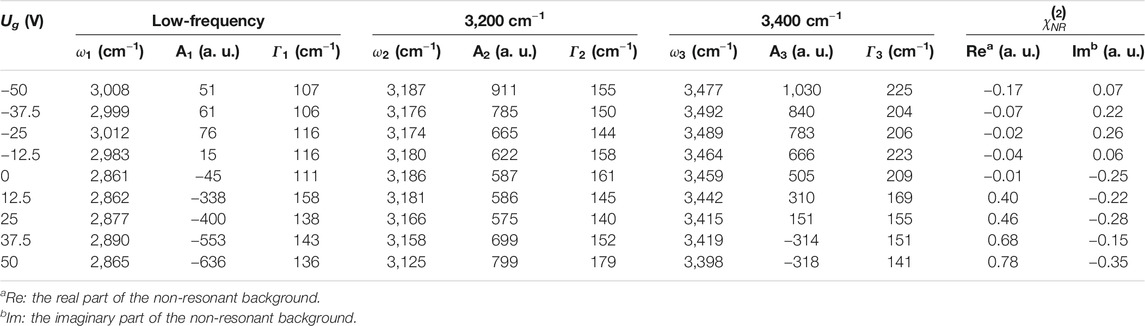
TABLE 1. The fitting parameters of the normalized SFVS spectra in H2O.
To conclude, by applying an electrostatic gate potential to a silica thin film in neutral water, we observed a prominent enhancement of interfacial OH sum-frequency vibrational signals, with even greater relative intensity than that achieved at bulk-silica/water interfaces in strong basic solution. By fitting and analyzing the spectra, we attributed this observation to an effective field alignment of water molecules throughout the diffuse layer, which was resultant from the small number of ions and weak screening in our case. This demonstrates the unique tuning capability of the EIS structure as we previously reported (Wang et al., 2019). On the other hand, as we mentioned above, we could not distinguish between bound charges and surface charges from protonation/deprotonation reactions at this stage, and only qualitative interpretations were provided based on assumptions on the SiO2 surface structures. Further studies on the SiO2 side, for example the in situ detection of its surface phonon spectra in water, would be essential for us to fully understand the phenomenon and the entire aqueous interface at the molecular level.
The original contributions presented in the study are included in the article/supplementary material, further inquiries can be directed to the corresponding author.
WL conceived the project and supervised the lab works. XqL, XL, and YL conducted the experiments. WL and XqL did the data analysis, and drafted the manuscript. All authors agreed to this manuscript.
National Key Research and Development Program of China and National Natural Science Foundation of China (2019YFA0308404, 11991062); Science and Technology Commission of Shanghai Municipality (Grant No. 20JC1415900); National Program for Support of Top-Notch Young Professionals (W03070062); Shu Guang Project by Shanghai Education Development Foundation (18SG02).
The authors declare that the research was conducted in the absence of any commercial or financial relationships that could be construed as a potential conflict of interest.
All claims expressed in this article are solely those of the authors and do not necessarily represent those of their affiliated organizations, or those of the publisher, the editors and the reviewers. Any product that may be evaluated in this article, or claim that may be made by its manufacturer, is not guaranteed or endorsed by the publisher.
The part of sample fabrication was conducted at Fudan Nano-fabrication Lab.
Anim-Danso, E., Zhang, Y., and Dhinojwala, A. (2016). Surface Charge Affects the Structure of Interfacial Ice. J. Phys. Chem. C 120 (7), 3741–3748. doi:10.1021/acs.jpcc.5b08371
Aragones, J. L., MacDowell, L. G., Siepmann, J. I., and Vega, C. (2011). Phase Diagram of Water Under an Applied Electric Field. Phys. Rev. Lett. 107 (15), 155702. doi:10.1103/PhysRevLett.107.155702
Backus, E. H. G., Schaefer, J., and Bonn, M. (2020). Probing the Mineral-Water Interface with Nonlinear Optical Spectroscopy. Angew. Chem. Int. Ed. 60, 10482–10501. doi:10.1002/anie.202003085
Bian, H.-T., Guo, Y., and Wang, H.-F. (2018). Non-Parabolic Potential Dependence of Optical Second Harmonic Generation from the Si(111) Electrode/Electrolyte Interface. Phys. Chem. Chem. Phys. 20 (46), 29539–29548. doi:10.1039/C8CP05621H
Boily, J.-F., Fu, L., Tuladhar, A., Lu, Z., Legg, B. A., Wang, Z. M., et al. (2019). Hydrogen Bonding and Molecular Orientations across Thin Water Films on Sapphire. J. Colloid Interf. Sci. 555, 810–817. doi:10.1016/j.jcis.2019.08.028
Brown, G. E. (2001). Surface Science: How Minerals React with Water. Science 294 (5540), 67–69. doi:10.1126/science.1063544
Brown, M. A., Goel, A., and Abbas, Z. (2016). Effect of Electrolyte Concentration on the Stern Layer Thickness at a Charged Interface. Angew. Chem. Int. Ed. 55 (11), 3790–3794. doi:10.1002/anie.201512025
Covert, P. A., and Hore, D. K. (2016). Geochemical Insight from Nonlinear Optical Studies of Mineral-Water Interfaces. Annu. Rev. Phys. Chem. 67 (1), 233–257. doi:10.1146/annurev-physchem-040215-112300
DeWalt-Kerian, E. L., Kim, S., Azam, M. S., Zeng, H., Liu, Q., and Gibbs, J. M. (2017). pH-Dependent Inversion of Hofmeister Trends in the Water Structure of the Electrical Double Layer. J. Phys. Chem. Lett. 8 (13), 2855–2861. doi:10.1021/acs.jpclett.7b01005
Gaigeot, M.-P., Sprik, M., and Sulpizi, M. (2012). Oxide/water Interfaces: How the Surface Chemistry Modifies Interfacial Water Properties. J. Phys. Condens. Matter 24 (12), 124106. doi:10.1088/0953-8984/24/12/124106
Hore, D. K., and Tyrode, E. (2019). Probing Charged Aqueous Interfaces Near Critical Angles: Effect of Varying Coherence Length. J. Phys. Chem. C 123 (27), 16911–16920. doi:10.1021/acs.jpcc.9b05256
Jena, K. C., Covert, P. A., and Hore, D. K. (2011). The Effect of Salt on the Water Structure at a Charged Solid Surface: Differentiating Second- and Third-Order Nonlinear Contributions. J. Phys. Chem. Lett. 2 (9), 1056–1061. doi:10.1021/jz200251h
Jena, K. C., and Hore, D. K. (2009). Variation of Ionic Strength Reveals the Interfacial Water Structure at a Charged Mineral Surface. J. Phys. Chem. C 113 (34), 15364–15372. doi:10.1021/jp905475m
Kosmulski, M. (2002). The pH-Dependent Surface Charging and the Points of Zero Charge. J. Colloid Interf. Sci. 253 (1), 77–87. doi:10.1006/jcis.2002.8490
Li, X., Feng, R.-J., Wang, J.-J., Zhang, Z., Lu, Z., and Guo, Y. (2015). Role of Refractive index in Sum Frequency Generation Intensity of Salt Solution Interfaces. Chin. Chem. Lett. 26 (12), 1542–1546. doi:10.1016/j.cclet.2015.10.020
Liu, X., Yang, D., Li, Y., Gao, Y., and Liu, W.-T. (2019). Anisotropic Adsorption of 2-Phenylethyl Alcohol on a Rutile (110) Surface. J. Phys. Chem. C 123 (49), 29759–29764. doi:10.1021/acs.jpcc.9b09209
Lüpke, G. (1999). Characterization of Semiconductor Interfaces by Second-Harmonic Generation. Surf. Sci. Rep. 35 (3), 75–161. doi:10.1016/S0167-5729(99)00007-2
Miranda, P. B., Xu, L., Shen, Y. R., and Salmeron, M. (1998). Icelike Water Monolayer Adsorbed on Mica at Room Temperature. Phys. Rev. Lett. 81 (26), 5876–5879. doi:10.1103/PhysRevLett.81.5876
Montenegro, A., Dutta, C., Mammetkuliev, M., Shi, H., Hou, B., Bhattacharyya, D., et al. (2021). Asymmetric Response of Interfacial Water to Applied Electric fields. Nature 594 (7861), 62–65. doi:10.1038/s41586-021-03504-4
Myalitsin, A., Urashima, S.-H., Nihonyanagi, S., Yamaguchi, S., and Tahara, T. (2016). Water Structure at the Buried Silica/Aqueous Interface Studied by Heterodyne-Detected Vibrational Sum-Frequency Generation. J. Phys. Chem. C 120 (17), 9357–9363. doi:10.1021/acs.jpcc.6b03275
Nihonyanagi, S., Ishiyama, T., Lee, T.-K., Yamaguchi, S., Bonn, M., Morita, A., et al. (2011). Unified Molecular View of the Air/Water Interface Based on Experimental and Theoretical χ(2)Spectra of an Isotopically Diluted Water Surface. J. Am. Chem. Soc. 133 (42), 16875–16880. doi:10.1021/ja2053754
Nihonyanagi, S., Ye, S., Uosaki, K., Dreesen, L., Humbert, C., Thiry, P., et al. (2004). Potential-Dependent Structure of the Interfacial Water on the Gold Electrode. Surf. Sci. 573 (1), 11–16. doi:10.1016/j.susc.2004.04.059
Ohno, P. E., Saslow, S. A., Wang, H.-F., Geiger, F. M., and Eisenthal, K. B. (2016). Phase-Referenced Nonlinear Spectroscopy of the α-Quartz/Water Interface. Nat. Commun. 7 (1), 13587. doi:10.1038/ncomms13587
Ostroverkhov, V., Waychunas, G. A., and Shen, Y. R. (2005). New Information on Water Interfacial Structure Revealed by Phase-Sensitive Surface Spectroscopy. Phys. Rev. Lett. 94 (4), 46101–46102. doi:10.1103/PhysRevLett.94.046102
Ostroverkhov, V., Waychunas, G. A., and Shen, Y. R. (2004). Vibrational Spectra of Water at Water/α-Quartz (0001) Interface. Chem. Phys. Lett. 386 (1-3), 144–148. doi:10.1016/j.cplett.2004.01.047
Pezzotti, S., Galimberti, D. R., and Gaigeot, M.-P. (2019). Deconvolution of BIL-SFG and DL-SFG Spectroscopic Signals Reveals Order/Disorder of Water at the Elusive Aqueous Silica Interface. Phys. Chem. Chem. Phys. 21 (40), 22188–22202. doi:10.1039/c9cp02766a
Putnis, A. (2014). Why mineral Interfaces Matter. Science 343 (6178), 1441–1442. doi:10.1126/science.1250884
Rehl, B., and Gibbs, J. M. (2021). Role of Ions on the Surface-Bound Water Structure at the Silica/water Interface: Identifying the Spectral Signature of Stability. J. Phys. Chem. Lett. 12 (11), 2854–2864. doi:10.1021/acs.jpclett.0c03565
Saitta, A. M., Saija, F., and Giaquinta, P. V. (2012). Ab InitioMolecular Dynamics Study of Dissociation of Water Under an Electric Field. Phys. Rev. Lett. 108 (20), 207801. doi:10.1103/PhysRevLett.108.207801
Schaefer, J., Backus, E. H. G., and Bonn, M. (2018). Evidence for Auto-Catalytic Mineral Dissolution from Surface-Specific Vibrational Spectroscopy. Nat. Commun. 9 (1), 3316. doi:10.1038/s41467-018-05762-9
Sovago, M., Campen, R. K., Wurpel, G. W. H., Müller, M., Bakker, H. J., and Bonn, M. (2008). Vibrational Response of Hydrogen-Bonded Interfacial Water Is Dominated by Intramolecular Coupling. Phys. Rev. Lett. 100 (17), 173901. doi:10.1103/PhysRevLett.100.173901
Sulpizi, M., Gaigeot, M.-P., and Sprik, M. (2012). The Silica-Water Interface: How the Silanols Determine the Surface Acidity and Modulate the Water Properties. J. Chem. Theor. Comput. 8 (3), 1037–1047. doi:10.1021/ct2007154
Tian, C. S., and Shen, Y. R. (2014). Recent Progress on Sum-Frequency Spectroscopy. Surf. Sci. Rep. 69 (2-3), 105–131. doi:10.1016/j.surfrep.2014.05.001
Urashima, S.-h., Myalitsin, A., Nihonyanagi, S., and Tahara, T. (2018). The Topmost Water Structure at a Charged Silica/aqueous Interface Revealed by Heterodyne-Detected Vibrational Sum Frequency Generation Spectroscopy. J. Phys. Chem. Lett. 9 (14), 4109–4114. doi:10.1021/acs.jpclett.8b01650
Verdaguer, A., Sacha, G. M., Bluhm, H., and Salmeron, M. (2006). Molecular Structure of Water at Interfaces: Wetting at the Nanometer Scale. Chem. Rev. 106 (4), 1478–1510. doi:10.1021/cr040376l
Waleed Shinwari, M., Jamal Deen, M., and Landheer, D. (2007). Study of the Electrolyte-Insulator-Semiconductor Field-Effect Transistor (EISFET) with Applications in Biosensor Design. Microelectronics Reliability 47 (12), 2025–2057. doi:10.1016/j.microrel.2006.10.003
Wang, H., Xu, Q., Liu, Z., Tang, Y., Wei, G., Shen, Y. R., et al. (2019). Gate-Controlled Sum-Frequency Vibrational Spectroscopy for Probing Charged Oxide/Water Interfaces. J. Phys. Chem. Lett. 10 (19), 5943–5948. doi:10.1021/acs.jpclett.9b01908
Keywords: oxide interface, water interface, electric double layer, electrochemical gating, sum frequency vibrational spectroscopy, field alignment of water
Citation: Li X, Lin X, Li Y and Liu W-T (2021) Gate Alignment of Liquid Water Molecules in Electric Double Layer. Front. Chem. 9:717167. doi: 10.3389/fchem.2021.717167
Received: 30 May 2021; Accepted: 02 August 2021;
Published: 17 August 2021.
Edited by:
Hideki Seto, High Energy Accelerator Research Organization, JapanReviewed by:
Satoshi Nihonyanagi, RIKEN, JapanCopyright © 2021 Li, Lin, Li and Liu. This is an open-access article distributed under the terms of the Creative Commons Attribution License (CC BY). The use, distribution or reproduction in other forums is permitted, provided the original author(s) and the copyright owner(s) are credited and that the original publication in this journal is cited, in accordance with accepted academic practice. No use, distribution or reproduction is permitted which does not comply with these terms.
*Correspondence: Wei-Tao Liu, d3RsaXVAZnVkYW4uZWR1LmNu
Disclaimer: All claims expressed in this article are solely those of the authors and do not necessarily represent those of their affiliated organizations, or those of the publisher, the editors and the reviewers. Any product that may be evaluated in this article or claim that may be made by its manufacturer is not guaranteed or endorsed by the publisher.
Research integrity at Frontiers
Learn more about the work of our research integrity team to safeguard the quality of each article we publish.