- 1Department of Chemical Engineering and Materials Science, Doshisha University, Kyoto, Japan
- 2Department of Chemical Engineering, Osaka Prefecture University, Osaka, Japan
The motion of the contact line at the oil/water interface caused by chemical reactions is well known as a typical example of artificial active matter in the field of nonlinear science. When water (containing trimethylstearylammonium chloride) and nitrobenzene (containing iodide anion) phases are in contact, the regulated traveling-wave patterns appear along the inner wall of the glass container. In this study, we demonstrate a new dynamical mode of the contact line, an up-and-down motion, which becomes dominant with the decrease in the size of a glass tube, and the probability of occurrence is extremely high when the diameter of the glass tube is below 1 mm. A physicochemical model of the contact line motion that incorporates the spatiotemporal variation of the surfactant concentration on a glass surface is proposed, and its effect on the wettability of oil/water phases on the walls of the glass tubes is studied. The present model can reproduce the mode bifurcation of the dynamical motion depending on the inner diameter of the glass tubes.
Introduction
Recently, active matter has become a common topic in mechanical engineering, biology, and nonlinear science (Ramaswamy, 2010; Marchetti et al., 2013; Nakata, 2019; Zhou et al., 2019; Gompper et al., 2020). Active matter exhibits autonomous motion by direct conversion of chemical into kinetic energy in the absence of an external force. It contains not only biological systems (e.g., microorganisms and living cells) but also non-living systems such as camphor boats (Nakata et al., 1997; Suematsu et al., 2010; Kitahata and Koyano, 2020), catalytic particles in solution (Paxton et al., 2004; Yamamoto and Shioi, 2015), and vesicles under a pH gradient (Nawa et al., 2013; Nawa et al., 2015). Since non-living active matter is easier to handle experimentally, a deeper understanding of active matter systems may be gained and used in engineering applications for innovative isothermal high-efficiency energy conversion. For this purpose, a physicochemical model of an artificial active matter system that exhibits biomimetic behavior needs to be constructed, using an experimental setup as simple as possible.
A typical example of an artificial active matter system is the motion of the oil/water interface (nitrobenzene/water) on a glass surface, which was reported in the 1970s (Dupeyrat and Nakache, 1978). Research on the motion of oil/water interfaces has been performed in nonlinear science, which is mainly divided into two types of experimental systems. One type is the motion of an oil droplet on a glass plate placed in the water phase (Sumino et al., 2005a; Sumino et al., 2005b; Sumino and Yoshikawa, 2008). Recently, we reported new applications of such motile oil droplets, such as in active transport (Goto et al., 2015) and synchronization (Kasai et al., 2020). The other type is the motion of the contact line between the inner wall of a cylindrical glass container and the oil/water interface (Kai et al., 1991; Shioi et al., 2003). The contact line forms a spatiotemporal wave that propagates in the circumferential direction of the container while maintaining its waveform (called traveling-wave motion). These motions are caused by repetitive adsorption/desorption of the surfactant and the consequent change in wettability of the oil/water phases on the glass surface (Shioi et al., 2008a; Shioi et al., 2008b; Sumino and Yoshikawa, 2008).
In this study, we focused on the motion of an oil/water contact line. By devising an experimental setup, we demonstrate a new dynamical mode instead of a traveling-wave motion, that is, an up-and-down motion. Furthermore, we propose a physicochemical model that considers the spatiotemporal variation in the adsorption/desorption process of the surfactants on the glass surface.
Experiments
Chemicals
Trimethylstearylammonium chloride (C18TAC, 98.0%) was purchased from Tokyo Chemical Industry Co., Ltd., Iodine (I2, 99.8%), potassium iodide (KI, 99.5%), and nitrobenzene (99.5%) were purchased from Wako Pure Chemical Industries, Ltd., All chemicals were used without further purification. A C18TAC aqueous solution (10 mM) was prepared as the water phase. Nitrobenzene saturated with KI was used as the oil phase, and 20 mM of I2 were dissolved in the oil phase.
Observation of the Motion of Oil/Water Contact Line
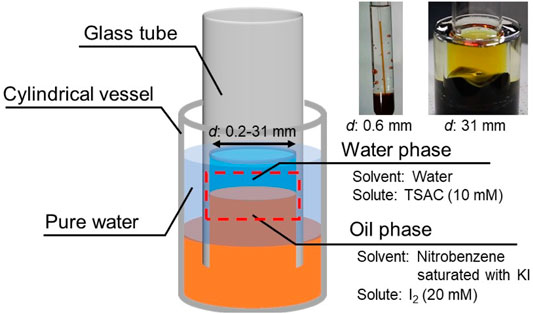
In this study, we focused on the effect of the contact line length on its dynamical motion. A previous simple experimental setup with a glass container is not available because the volume preservation of the bottom oil phase significantly affects the contact line motion. This effect inhibits the contact line motion if the diameter of the glass container is considerably small. To eliminate the effect of volume preservation on the contact line motion, we used cylindrical glass tubes with open ends (open tube), instead of a glass container, to form a motile oil/water contact line (Figure 1).
Open tubes with various inner diameters (d = 0.2–31 mm) were tested. Each open tube was vertically inserted into the reservoir oil contained in a cylindrical vessel. Pure water was then poured into the space between the open tube and the cylindrical vessel to raise the surface level of the oil phase inside the open tube. Then, the water phase was poured into the open tube to form a motile oil/water contact line along the inner wall of the tube (see the red dashed area in Figure 1). The contact line motion was monitored using a digital single-lens reflex camera (Canon EOS Kiss X9) at a frame rate of 60 fps. All experiments were performed at room temperature (20–25°C).
Experimental Results and Discussion
Figures 2A–1 shows the contact line motion in an open tube with an inner diameter of 0.6 mm (= d) (circumferential length L (= πd) = 1.89 mm). The contact line moved up and down periodically for several minutes. (See Supplementary Video 1 for a smaller tube). Figures 2A–2 shows a space–time plot of the repetitive up-and-down motion along the red line shown in Figure 2A. The average of period T and the height change ∆h for the up-and-down motion were estimated to be 2.5 s and 2.3 mm, respectively. The waveform of the space–time plot is asymmetric, which indicates that the rising speed of the contact line is faster than that of the falling contact line. Moreover, the waveform is convex for the rise and concave for the fall of the contact line. Hence, both rising and falling speeds decelerate as the contact line approaches the peak. Such an up-and-down motion was also observed for the glass tubes with intermediate inner diameters (d = 0.6–6.0 mm). However, a tube with a much larger inner diameter [d = 31 mm (L = 97.3 mm)] forms a regulated traveling wave (in this case, ∆h is measured to 5.9 mm) (Figure 2B), as reported by several researchers including us (Dupeyrat and Nakache, 1978; Kai et al., 1991; Shioi et al., 2003). (See Supplementary Video 2 for a larger tube) These results demonstrate that the mode bifurcation on the contact line dynamics depends on the contact line length (the inner diameter of the glass tube). To investigate this mode bifurcation between the up-and-down and traveling-wave motions, we evaluated the ratio of each mode of open tubes with various inner diameters. The observed contact line motions are easily classified into the two modes in each experiment as follows. Briefly, when the traveling wave appears, the maximum and minimum of the height of the contact line is observed independent of time. Otherwise, the up-and-down motion keeps the almost same height at whole circumference in one snapshot. The experiments were repeated a minimum of four times for each inner diameter and the results obtained are shown in Figure 3A. In the tubes with diameter over 8.0 mm, only the traveling-wave motion was observed, while the up-and-down motion became dominant with a decrease in the diameter. In the tubes with intermediate diameters (d = 1.6–6.0 mm), either mode is observed in each experiment. (See Supplementary Video 3 for middle tubes). Once one mode appeared, it rarely changed to the other mode during the experiment. Actually, the larger tube tends to cause dynamical modes of longer duration (from several minutes to ten). In addition, the deviations of each Δh is almost zero while the mode remains stable for several tens of cyclic periods. Such a bifurcation may be attributed to an initial fluctuation in the contact line. We confirmed that the two modes switched between each other by stimulating the motile contact line. To investigate the factors causing the bifurcation, the average ∆h was measured for each trial (Figure 3B). As shown in Figure 3B, for the up-and-down motion, ∆h decreases with an increase in the inner diameter. A plot of log (∆h) vs. log(d) for up-and-down motion gives a straight line with slope of roughly −1.0, although the distribution of ∆h for the same inner diameter is large (probably due to surface condition of each glass tube we used). The slope of −1.0 can be explained by capillary action. When a capillary tube is dipped into liquid, the height h from the liquid interface is given by Jurin’s law (
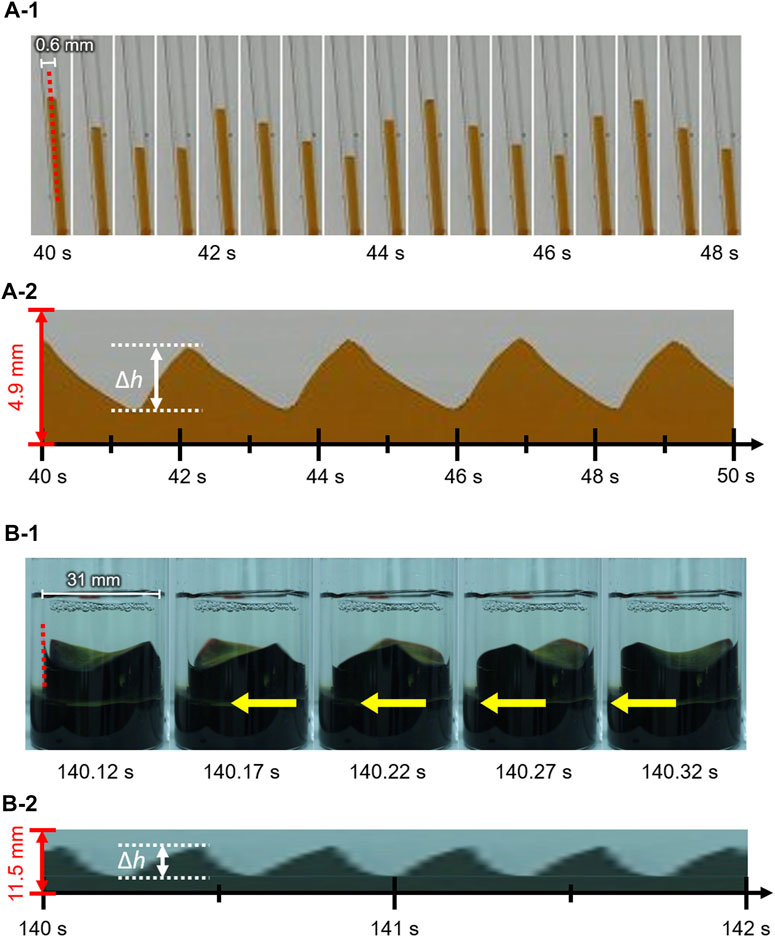
FIGURE 2. Snapshots and space–time plots of oil/water contact line motions in an open tube with an inner diameter of (A) 0.6 mm and (B) 31 mm. The contact line of (A) and (B) exhibits up-and-down motion and traveling-wave motion, respectively.
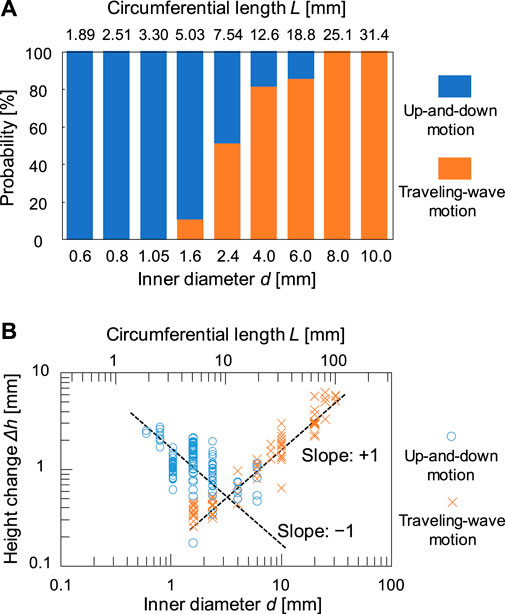
FIGURE 3. (A) Relationship between probability of occurrence of the two modes and the inner diameter d of tubes and (B) double logarithmic plot of height change Δh and d.
Physicochemical Model for the Bifurcation
We have already proposed a mathematical model for traveling-wave motion (Shioi et al., 2008a; Shioi et al., 2008b). However, the previous model hardly considered any concrete physicochemical processes for the adsorption/desorption of surfactants. In this study, we propose a model that incorporates the spatiotemporal variation of the surfactant concentration on a glass surface and its effect on the wettability of oil/water phases on the walls of glass tubes. The equation for the contact line motion is expressed as follows:
As shown in Figure 4A, h(t, x) denotes the height of the contact line at the coordinate x (the circumferential displacement in our system) at time t. The first term (−μ∂h/∂t) on the right-hand side is the dissipation caused by the viscous drag force, where μ is the dumping coefficient. The second term (Γ∂2h/∂x2) works as the vibration control term, leading to a reduction in the roughness of the contact line shape due to interfacial tension (Shioi et al., 2008a). The third term (χ[h−h0]) is a restoring term owing to the density difference between the oil and water phases, which works as an elastic force that h(t, x) returns to the initial height of the contact line h0. The term is one of the most significant effects to reproduce the periodic motion. We confirmed in advance that the contact line maintains translation toward one direction when the term is negligible, which mimics our previous experimental results (Kasai et al., 2020). Here, Γ and χ denote proportional constants for each term. The fourth term (
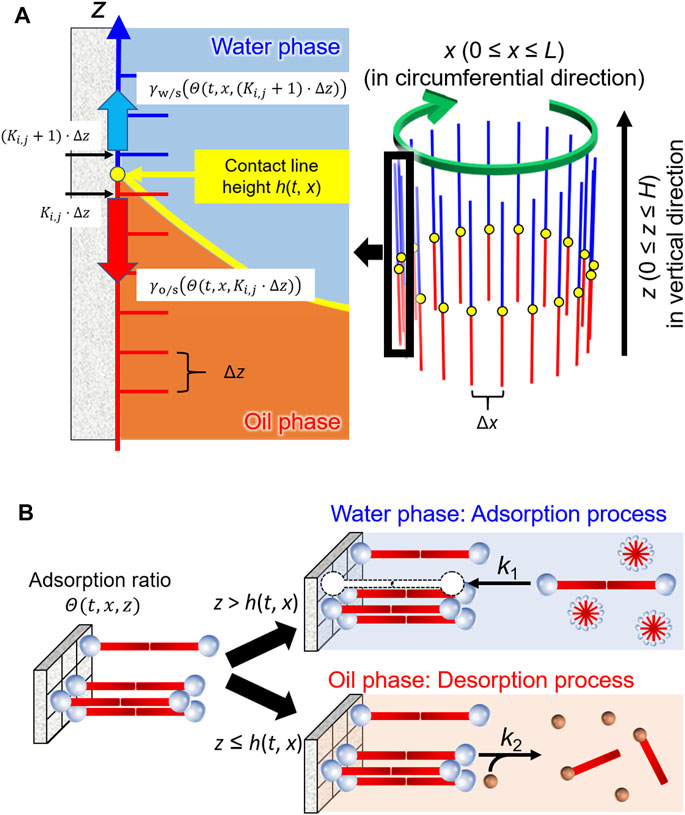
FIGURE 4. Schematic illustrations of the model for (A) the contact line motion along inner wall of a glass tube and (B) adsorption/desorption processes of the surfactants in water and oil phases.
In the present system, the water and oil phases are placed as layers at the upper and lower positions, respectively. Thus, the driving force caused by the solid–liquid interfacial energy is expressed as follows:
Figure 4B illustrates the adsorption/desorption processes in this model. Most of the C18TAC dissolved in water forms micelles because the initial concentration is much higher than the CMC (critical micelle concentration = 0.3 mM). The resultant micelles were then adsorbed onto the glass surface as a bilayer (Atkin et al., 2003). Assuming that the micelle may be treated as a dimer of the cationic surfactant C18TA+, the absorption onto the site of the glass surface S, is described as follows:
Here, we ignore the reverse reaction to simplify the model because the concentration of C18TAC is sufficiently high. In the oil phase, the desorption of the surfactant occurs because of the chemical reaction with oil-soluble anions, for example, the polyiodide anion In−.
From the above two equations, the reaction rate for the adsorption ratio can be expressed as:
Here, k1 and k2 are the reaction rate constants for adsorption/desorption. CA0 is the C18TAC concentration in the water phase, which is divided by two to approximate the bilayer state. CI0 is the anion concentration in the oil phase. According to the Cassie model (Cassie, 1948),
When this series of calculation processes (Equations 1, 2, 5, 6, 7, 8) is performed for all displacements x in the circumferential direction at time t, the time course of the contact line shape is obtained. Here, we preset the maximum height H for the contact line height (h). For the circumferential length L (= πd), a periodic boundary condition was applied.
The numerical calculation was performed using the finite-difference method. ∆t, ∆x, and ∆z, step width of t, x, and z, are 0.001, 0.01, and 0.001, respectively. Here, it is difficult to calculate the accurate value of
In the calculation,
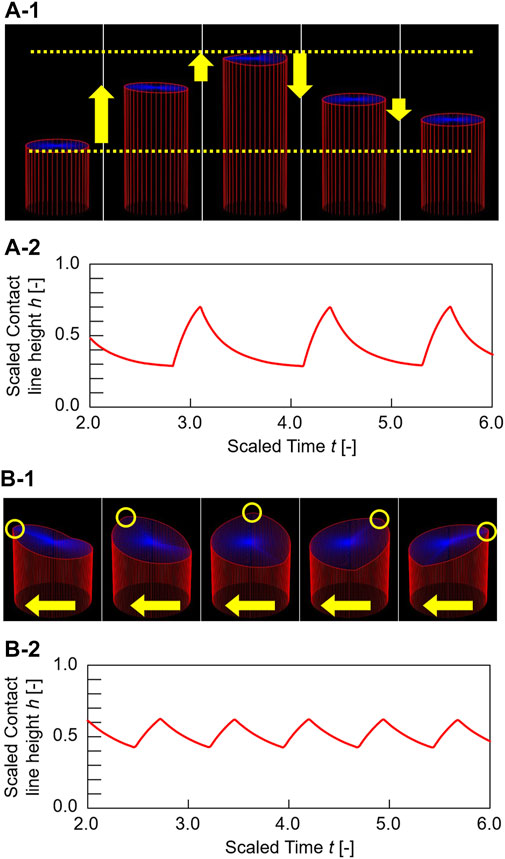
FIGURE 5. Calculation results. Three-dimensional graphs and time course of contact line height change ∆h of the oil/water contact line motions for (A)L = 0.4 and (B)L = 1.5. The contact lines of (A) and (B) exhibit up-and-down motion and traveling-wave motion, respectively. Blue top surfaces in the three-dimensional graphs represent oil/water interfaces. The curved surfaces were drawn by connecting between the oil/water interfacial height at center hc(t) and the contact line height at arbitrary circumferential displacement. hc(t) was estimated by calculating the average of the contact line height at each time < h(t)> (hc(t) = ∫0L h(t,x)dx/L).
In the calculation, the dynamical mode is changed by the initial condition and the random force term, even in the same conditions (See Supplementary Video 4 for the simulation results). Once the contact line exhibits one mode, the mode remains stable for several cyclic periods. Therefore, we investigated the probability of the occurrence of the two modes by calculating 1,000 trials for each circumferential length (Figure 6). As shown in Figure 6, a remarkable mode bifurcation depending on L is observed. The up-and-down motion is dominant for L = 0.1–0.15, while the traveling-wave motion dominates for L = 20.0. In addition, a transition region exists for L = 0.2–10.0, which means that both motions are observed depending on the initial conditions and the random force term. This result reproduces the mode bifurcation qualitatively, similar to that shown in Figure 3A. These results demonstrated the validity of our physicochemical mechanism.

FIGURE 6. Calculation results. (A) Relationship between probability of occurrence of the two modes and scaled circumferential length L and (B) double logarithmic plot of height change Δh and L. For the traveling-wave motion, the number of formed waves (nTW) is different for each trial. Thus, the plots of (B) are divided into three marks depending on nTW for the traveling-wave motion. The plot for nTW ≥ 4 was eliminated.
Finally, we compare the experimental and calculation results to investigate the bifurcation mechanism. The probability depending on the size is scaled appropriately and superposed in Supplementary Figure 2. A plot of probability vs. logarithm of the size in experiments has much larger slope than that in calculation, which means that the actual bifurcation is sharp depending on the inner diameter. This is because our model ignores the long-range effect that the height of the contact line is affected by that at the opposite side. The effect will become dominant for smaller tubes. In order to examine the contribution of the long-range effect, we investigated the height change Δh for each circumferential length L in our model (Figure 6B). Because we neglect the interaction with the contact line at opposite side through capillary effect in our model, Δh is almost constant regardless of the circumferential length for the up-and-down motion. The actual sharp bifurcation may be reproduced when the long-range effect is added in our model, whereas the calculation result predicts that the mode bifurcation can appear without the effect (for instance, by using flat plates with a different width).
On the other hand, a plot of log (Δh) vs. log(L) for the traveling wave motion gives a straight line with slope of +1.0, which agrees with experimental results in Figure 3B. The reason why the larger tube gives the higher Δh for the traveling-wave motion may be because the rate of adsorption/deadsorption is comparable to the traveling speed. We confirmed that traveling speed of the wave is almost the same regardless to the circumferential length for both experiment and simulation. Thus, when the same number of waves appears, the larger circumferential length leads to the longer period of the traveling-wave motion. This delay of arrival of the next wave affects time evolution of adsorption/deadsorption, which may result in the larger driving force deriving from the interfacial energy.
In the present stage, the detailed mechanism of the bifurcation is not elucidated completely because there are many parameters in our model. However, we need to note the contribution of elasticity of fringe (Gennes et al., 2010) and driving force, which correspond to second and fourth terms on the right-hand side in Equation 1. Both terms are derived from interfacial energy. We think that the balance between the amplitude of the two terms determines the bifurcation point. The physical kinetics of our system may be similar to other chemical systems such as size-depending bifurcation of Belousov–Zhabotinsky (BZ) patterns (Aihara and Yoshikawa, 2001), where the diffusion and growth rate of chemical wave.
Conclusion
In this study, we demonstrated that the contact line motion at oil/water on a glass surface has two types of dynamical modes depending on the inner diameters of the glass tubes. That is, smaller inner diameters tend to originate up-and-down motion, while larger diameters tend to result in traveling-wave motion. Furthermore, to investigate the bifurcation mechanism, we proposed a physicochemical model of the contact line motion that considers the spatiotemporal variation of the adsorption/desorption process of the surfactants on the glass surface. The present model can reproduce the dynamics of both motion and mode bifurcation depending on the contact line length. However, our model has several parameters. The quantitative measurement of the reaction rate constants for adsorption/desorption and interfacial tension is desirable.
Data Availability Statement
The original contributions presented in the study are included in the article/Supplementary Material, further inquiries can be directed to the corresponding author.
Author Contributions
JM and YM performed all experiments and calculations. DY, YO, EO, and AS conceived the study. DY, JM, YM, and AS used a physicochemical model. All authors have discussed this research.
Funding
YO and AS acknowledges the financial support from JSPS KAKENHI Grant Number 20K22335 and 16H04189, respectively. DY and AS also acknowledge the MEXT-Supported Program for the Strategic Research Foundation at Private Universities.
Conflict of Interest
The authors declare that the research was conducted in the absence of any commercial or financial relationships that could be construed as a potential conflict of interest.
Publisher’s Note
All claims expressed in this article are solely those of the authors and do not necessarily represent those of their affiliated organizations, or those of the publisher, the editors and the reviewers. Any product that may be evaluated in this article, or claim that may be made by its manufacturer, is not guaranteed or endorsed by the publisher.
Acknowledgments
We thank Tatsuya Taguchi and Kazuhiro Ogata for carrying out the experiments and simulations.
Supplementary Material
The Supplementary Material for this article can be found online at: https://www.frontiersin.org/articles/10.3389/fchem.2021.708633/full#supplementary-material
References
Aihara, R., and Yoshikawa, K. (2001). Size-Dependent Switching of the Spatiotemporal Structure between a Traveling Wave and Global Rhythm. J. Phys. Chem. A. 105, 8445–8448. doi:10.1021/jp010908r
Atkin, R., Craig, V. S. J., Wanless, E. J., and Biggs, S. (2003). Mechanism of Cationic Surfactant Adsorption at the Solid-Aqueous Interface. Adv. Colloid Interf. Sci. 103, 219–304. doi:10.1016/s0001-8686(03)00002-2
Dupeyrat, M., and Nakache, E. (1978). 205 - Direct Conversion of Chemical Energy into Mechanical Energy at an Oil Water Interface. Bioelectrochemistry Bioenerg. 5, 134–141. doi:10.1016/0302-4598(87)87013-7
Gennes, P. G. D., Brochard-Wyart, F., and Quéré, D. (2010). Capillarity and Wetting Phenomena : Drops, Bubbles, Pearls, Waves. New York, United States: Springer.
Gompper, G., Winkler, R. G., Speck, T., Solon, A., Nardini, C., Peruani, F., et al. (2020). The 2020 Motile Active Matter Roadmap. J. Phys. Condens. Matter 32, 193001. doi:10.1088/1361-648x/ab6348
Goto, Y., Kanda, M., Yamamoto, D., and Shioi, A. (2015). An Abiotic Glass-Bead Collector Exhibiting Active Transport. Sci. Rep. 5, 14348. doi:10.1038/srep14348
Kai, S., Muller, S. C., Mori, T., and Miki, M. (1991). Chemically Driven Nonlinear Waves and Oscillations at an Oil-Water Interface. Physica D: Nonlinear Phenomena 50, 412–428. doi:10.1016/0167-2789(91)90008-w
Kasai, M., Yamamoto, D., Nawa-Okita, E., and Shioi, A. (2020). Synchronization of Chemo-Mechanical Oscillators. AIP Adv. 10, 065007. doi:10.1063/5.0006387
Kitahata, H., and Koyano, Y. (2020). Spontaneous Motion of a Camphor Particle with a Triangular Modification from a Circle. J. Phys. Soc. Jpn. 89, 094001. doi:10.7566/jpsj.89.094001
Marchetti, M. C., Joanny, J. F., Ramaswamy, S., Liverpool, T. B., Prost, J., Rao, M., et al. (2013). Hydrodynamics of Soft Active Matter. Rev. Mod. Phys. 85, 1143–1189. doi:10.1103/revmodphys.85.1143
Nakata, S., Iguchi, Y., Ose, S., Kuboyama, M., Ishii, T., and Yoshikawa, K. (1997). Self-Rotation of a Camphor Scraping on Water: New Insight into the Old Problem. Langmuir 13, 4454–4458. doi:10.1021/la970196p
Nakata, S. (2019). Self-organized Motion : Physicochemical Design Based on Nonlinear Dynamics. London: Royal Society of Chemistry.
Nawa, E., Nishigaki, Y., Yamamoto, D., and Shioi, A. (2013). Rhythmic Shape Change of a Vesicle under a pH Gradient. Soft Matter 9, 7832–7842. doi:10.1039/c3sm51100f
Nawa, E., Yamamoto, D., and Shioi, A. (2015). Chemotactic Amoeboid-like Shape Change of a Vesicle under a pH Gradient. Bcsj 88, 1536–1544. doi:10.1246/bcsj.20150190
Paxton, W. F., Kistler, K. C., Olmeda, C. C., Sen, A., St. Angelo, S. K. S. K., Cao, Y., et al. (2004). Catalytic Nanomotors: Autonomous Movement of Striped Nanorods. J. Am. Chem. Soc. 126, 13424–13431. doi:10.1021/ja047697z
Ramaswamy, S. (2010). The Mechanics and Statistics of Active Matter. Annu. Rev. Condens. Matter Phys. 1, 323–345. doi:10.1146/annurev-conmatphys-070909-104101
Shioi, A., Ban, T., and Suzuki, S. (2008a). Model of Traveling Wave Formed by Autonomous Motion of Contact Line with Oil/water Interface. Chem. Phys. Lett. 467, 210–215. doi:10.1016/j.cplett.2008.11.037
Shioi, A., Ban, T., and Suzuki, S. (2008b). Noise-induced Kinetic Model for Autonomous Motion of the Contact Line in Oil-Water Systems with Chemical Reactions. Phys. Rev. E 77, 036208. doi:10.1103/physreve.77.036208
Shioi, A., Katano, K., and Onodera, Y. (2003). Effect of Solid walls on Spontaneous Wave Formation at Water/oil Interfaces. J. Colloid Interf. Sci. 266, 415–421. doi:10.1016/s0021-9797(03)00672-6
Suematsu, N. J., Ikura, Y., Nagayama, M., Kitahata, H., Kawagishi, N., Murakami, M., et al. (2010). Mode-Switching of the Self-Motion of a Camphor Boat Depending on the Diffusion Distance of Camphor Molecules. J. Phys. Chem. C 114, 9876–9882. doi:10.1021/jp101838h
Sumino, Y., Kitahata, H., Yoshikawa, K., Nagayama, M., Nomura, S.-I. M., Magome, N., et al. (2005a). Chemosensitive Running Droplet. Phys. Rev. E 72, 041603. doi:10.1103/physreve.72.041603
Sumino, Y., Magome, N., Hamada, T., and Yoshikawa, K. (2005b). Self-Running Droplet: Emergence of Regular Motion from Nonequilibrium Noise. Phys. Rev. Lett. 94, 068301. doi:10.1103/physrevlett.94.068301
Sumino, Y., and Yoshikawa, K. (2008). Self-motion of an Oil Droplet: A Simple Physicochemical Model of Active Brownian Motion. Chaos 18, 026106. doi:10.1063/1.2943646
Yamamoto, D., and Shioi, A. (2015). Self-Propelled Nano/Micromotors with a Chemical Reaction: Underlying Physics and Strategies of Motion Control. Kona 32, 2–22. doi:10.14356/kona.2015005
Keywords: contact line, interfacial energy, active matter, bifurcation, traveling-wave motion, up-and-down motion, oil/water interface
Citation: Yamamoto D, Maeno J, Manabe Y, Okamoto Y, Nawa-Okita E and Shioi A (2021) Mode Bifurcation on Contact Line Dynamics at Oil/Water Interface Depending on the Contact Line Length. Front. Chem. 9:708633. doi: 10.3389/fchem.2021.708633
Received: 12 May 2021; Accepted: 13 July 2021;
Published: 26 July 2021.
Edited by:
Motomu Tanaka, Heidelberg University, GermanyReviewed by:
Jerzy Gorecki, Institute of Physical Chemistry (PAN), PolandNobuhiko J. Suematsu, Meiji University, Japan
Copyright © 2021 Yamamoto, Maeno, Manabe, Okamoto, Nawa-Okita and Shioi. This is an open-access article distributed under the terms of the Creative Commons Attribution License (CC BY). The use, distribution or reproduction in other forums is permitted, provided the original author(s) and the copyright owner(s) are credited and that the original publication in this journal is cited, in accordance with accepted academic practice. No use, distribution or reproduction is permitted which does not comply with these terms.
*Correspondence: Daigo Yamamoto, ZHlhbWFtb3RAbWFpbC5kb3NoaXNoYS5hYy5qcA==
 Daigo Yamamoto
 Jumpei Maeno1
 Yasunao Okamoto
 Erika Nawa-Okita
 Akihisa Shioi