 Xin-yuan Wang1
 Qi-peng Yang1
 Shi-jie Tian1Fan-hao Song2Fei Guo2Nan-nan Huang2Wei-qiang Tan1*
 Ying-chen Bai1,2*
- 1School of Environmental and Municipal Engineering, Qingdao University of Technology, Qingdao, China
- 2State Key Laboratory of Environmental Criteria and Risk Assessment, Chinese Research Academy of Environmental Sciences, Beijing, China
The photochemical reactivity of humic substances plays a critical role in the global carbon cycle, and influences the toxicity, mobility, and bioavailability of contaminants by altering their molecular structure and the mineralization of organic carbon to CO2. Here, we examined the simulated irradiation process of Chinese standard fulvic acid (FA) and humic acid (HA) by using excitation-emission matrix fluorescence combined with fluorescence regional integration (FRI), parallel factor (PARAFAC) analysis, and kinetic models. Humic-like and fulvic-like materials were the main materials (constituting more than 90%) of both FA and HA, according to the FRI analysis. Four components were identified by the PARAFAC analysis: fulvic-like components composed of both carboxylic-like and phenolic-like chromophores (C1), terrestrial humic-like components primarily composed of carboxylic-like chromophores (C2), microbial humic-like overwhelming composed of phenolic-like fluorophores (C3), and protein-like components (C4). After irradiation for 72 h, the maximum fluorescence intensity (Fmax) of C1 and C2 of FA was reduced to 36.01–58.34%, while the Fmax of C3 of both FA and HA also decreased to 0–9.63%. By contrast, for HA, the Fmax of its C1 and C2 increased to 236.18–294.77% when irradiated for 72 h due to greater aromaticity and photorefractive tendencies. The first-order kinetic model (R2 = 0.908–0.990) fitted better than zero-order kinetic model (R2 = 0–0.754) for the C1, C2, and C3, of both FA and HA, during their photochemical reactivity. The photodegradation rate constant (k1) of C1 had values (0.105 for FA; 0.154 for HA) that surpassed those of C2 (0.059 for FA, 0.079 for HA) and C3 (0.079 for both FA and HA) based on the first-order kinetic model. The half-life times of C1, C2, and C3 ranged from 6.61–11.77 h to 4.50–8.81 h for FA and HA, respectively. Combining an excitation-emission matrix with FRI and PARAFAC analyses is a powerful approach for elucidating changes to humic substances during their irradiation, which is helpful for predicting the environmental toxicity of contaminants in natural ecosystems.
Introduction
Humic substances (HSs) are mixture of heterogeneous organic molecules that are ubiquitous in terrestrial and aquatic ecosystems, playing an essential role in biogeochemical and ecological processes (Du et al., 2016). HSs can be categorized as fulvic acid (FA), humic acid (HA), and humin according to their degree of water solubility (Bai et al., 2015). HSs are significant portion of aquatic dissolved organic matter (DOM), which are isolated and purified by ruling out hydrophilic acid, lipids, proteins etc. (Kitis et al., 2001). The photochemical reactivity of DOM produces dissolved inorganic carbon (Gao, 1998), in addition to organic molecules of low molecular weight (Kulovaara, 1996; Gonsior et al., 2014) and complex aromatic structures (Timko et al., 2015), all of which could influence the toxicity, mobility, and transformation of aquatic contaminants (Kida et al., 2019). Many previous studies have focused on the photodegradation of non-purified DOM in natural water (Zhu et al., 2017; Kida et al., 2019). Recently, the photochemical reactivity of DOM samples varying in molecular mass from Yangtze River and its coastal area were examined by excitation-emission matrix (EEM) spectroscopy, which revealed that the highly aromatic humic-like materials exhibited greater photochemical reactivity than did the non-humic-like materials (Zhu et al., 2017). Photodegradation was confirmed to be the major external factor driving the compositional diversity of DOM in Antarctic lakes and streams, as assessed using the spectral slope S275–279 for the distribution of its fluorescence components (Kida et al., 2019). Nonetheless, how photochemical reactivity variously acts upon the structures and functions of HSs is still not well understood; hence, the proper isolation and purification of HSs is critical to elucidate photochemical reactivity mechanisms.
Fluorescence regional integration (FRI), a powerful method to determine the volume integral under each region, has been widely utilized to characterize the composition spatiotemporal changes of DOM from various environments, including rivers, wastewaters, and soils (Chen et al., 2003; Xie et al., 2017; Wang et al., 2019). For example, when used with EEM, FRI was successful at distinguishing the decrease of protein-like materials and increase of humic-like materials across the wastewater treatment plant–river–lake continuum (Wang et al., 2019). Also, EEM coupled with a parallel factor (PARAFAC) analysis has been widely used to study the photodegradation of DOM in different aquatic systems (Ishii and Boyer, 2012; Du et al., 2016; Retelletti Brogi et al., 2020). For example, this EEM-PARAFAC approach was able to reveal the effect of light on PARAFAC components by exposing the DOM from a sub-alpine lake to three different light sources (Du et al., 2016). Seven PARAFAC components were identified by (Kida et al., 2019), who studied the photodegradation of DOM from 47 lakes and two streams on the ice-free area at Lützow-Holm Bay and Amundsen Bay in East Antarctica. Five primary components in the Yangtze River and two primary components in the Western Pacific Ocean were identified by PARAFAC analysis during irradiation of DOM measured by EEM, the relative abundance of photo-refractory UVC humic-like components was increased during irradiation (Zhu et al., 2017). But the possible applications of using EEM in tandem with both FRI and PRAFAC to characterize the variation in HSs during irradiation have yet to widely reported on.
First-order and zero-order kinetic models are powerful ways of describing the photochemical reactivity of DOM, or of organic contaminants in the presence of DOM (Filipe et al., 2020). For instance, the first-order kinetic was used to describe the photodegradation dynamics of DOM in the Lake Biwa watershed in Japan and during two characteristic seasons in the Negro River (Rodríguez-Zúñiga et al., 2008; Mostofa et al., 2010), and also applied to leaf litter-derived humic substances after irradiation for 0–12 days (Hur et al., 2011). The first-order kinetic was also used to model the photodegradation of DOM with TiO2 as a catalyst in stormwater runoff (Zhao et al., 2018). The zero-kinetic model was used describe the degradation of propranolol by photo-Fenton in the presence of humic substances (López-Vinent et al., 2020). However, such suitable kinetic models have not been adequately studied to further explore the photodegradation of FA and HA.
Accordingly, this study aimed to 1) investigate the variation in EEM of both FA and HA during irradiation; 2) distinguish the changed PARAFAC components in the photochemical reactivity process, and; 3) determine the kinetic model that best describes the photochemical reactivity dynamics of FA and HA.
Materials and Methods
Samples Pretreatment and Characterization
Soil samples were collected from Jiufeng Mountain in Beijing, China. Both FA and HA were isolated and purified by the XAD-8 resin adsorption technique according to the International Humic Substances Society (IHSS, http://humic-substances.org). Detailed information was previously reported by Bai et al. (2015) on the collection and isolation of Chinese Standard FA and HA. A certain amount of sieved of soil was dissolved by water, the FA and HA were separated from the soil after a series of acidification, alkalization and centrifuge at high speed. The FA solution was adsorbed on XAD-8 resin column, and the FA sample was obtained by freeze drying after elution with NaOH solution, rinsing with water, removal impurity by HF and purification with H+-saturated cation exchange resin. Redissolved the HA fraction by adding KOH under N2, add solid KCl and centrifuge at high speed to remove the suspended solids. Reprecipitate the humic acid by adding HCl with constant stirring and allow the suspension to stand again. Centrifuge and discard the supernatant. Suspend the HA precipitate in HF solution and shake. Centrifuge and repeat the HCl/HF treatment, until the ash content is below 1%. Transfer the precipitate to a Visking dialysis tube and dialyze against distilled water, freeze dry the HA. The data of UV-Vis, NMR, and elemental compositions for FA and HA was provided in the supporting information (Supplementary Figure S1; Supplementary Tables S1–S3). All the chemicals used here were of analytical reagent grade, unless otherwise mentioned. All the solutions were prepared in Milli-Q water and filtered through a 0.45-µm glass fiber membrane (Whatman, United Kingdom).
Photochemical Experiments
To carry out the photochemical reaction of HSs, photochemical reactor equipped with a 1000 W xenon lamp was used to provide the simulated radiation of the solar spectrum. Its quartz tubes were soaked in 10% HNO3 for 12 h before rinsing them with Milli-Q water and then drying them at 100°C for 2 h prior to their use. Light intensity was measured to be 0.78 mW/cm2, at 290–420 nm, on the surface of the quartz tubes. The schematic diagram of the photochemical reactor was shown in Supplementary Figure S2
Both FA and HA were prepared separately at a concentration of 10.0 mg/L in a 0.02 mol/L NaOH solution, to effectively dissolve each. The ionic strength of FA and HA solutions were adjusted to 0.01 M NaCl (Wang et al., 2015). The pH of each solution was adjusted to 6.0 ± 0.02, by injecting minimal amounts of HCl or NaOH as needed, with 15 min allowed for equilibration. Next, 50 ml of these HSs’ solutions were transferred to cleaned quartz tubes, these then sealed with Teflon caps to minimize possible evaporation and absorption. During the irradiation experiments, photochemical reactor’s temperature was maintained at 25°C by circulated cooling water. The samples of HSs were determined after illumination for 0, 2, 4, 8, 12, 22, 32, 52, and 72 h, respectively with fluorescence spectroscopy. All the experiments were carried out in duplicate including UV illumination and determination with fluorescence spectroscopy.
Fluorescence Measurement
The EEM spectra of the HSs samples were recorded on a Hitachi F-7000 fluorescence spectrometer, using quartz cuvettes with a 1-cm path length, at room temperature. Its scanning emission (Em) wavelength spanned 250–550 nm (increments of 2 nm) and excitation (Ex) wavelength ranged from 200 to 400 nm (increments of 2 nm). For FA, the Ex and Em slit widths were both 5 nm but for HA they were 5 and 10 nm, respectively. The scanning speed was set to 2,400 nm/min and the photomultiplier voltage was set to 600 V. The EEM of 0.1 M NaCl blank was subtracted from EEMs of FA and HA. The Rayleigh scattering of FA and HA with time was shown in Supplementary Figure S3. Rayleigh scattering values did not change significantly with increasing irradiation time.
FRI Analysis
FRI as a quantitative analysis technique used to divide the EEM into five regions (i.e., Region I–V) (Chen et al., 2003; Song et al., 2018). Here, FRI parameters of fluorescence responses (
where
PARAFAC Analysis
Through PARAFAC modeling, the three-way data of an EEM can be statistically reduced to trilinear terms and a residual array, expressed as follows:
where
A total of 36 EEMs of FA and HA were used for the PARAFAC analysis by the DOMFluor toolbox (version 1.7) in MATLAB software. Importantly, the EEMs of the NaCl blank were subtracted from each EEMs of FA and HA, to eliminate any water Raman scattering peaks from arising, with a series of zero values inserted to the region of no fluorescence (i.e., Ex << Em) to minimize the effects of scattering lines of EEMs. Any residual Rayleigh and Raman scattering that appeared was regulated by the interpolation method derived from Bahram et al. (2006), Song et al. (2017). The 2–7 components model of PARAFAC was applied to the EEMs of both FA and HA. The split-half analysis, residual analysis, and visual inspection were all used to determine the correct number of final components (Stedmon and Bro, 2008; Wu et al., 2011; Zhang et al., 2020). The maximum fluorescence intensity (Fmax) derived by the PARAFAC model represented the relative intensity or concentration of the PARAFAC components (Guo et al., 2015; Maqbool and Hur, 2016). The model loadings obtained from the PARAFAC analysis were uploaded into OpenFluor (https://openfluor.lablicate.com), in which a query was conducted to match the spectral properties from our loadings with existing data available from other studies.
Apparent Kinetic Model of Photochemical Reactivity
To establish the changes of HSs during irradiation, the apparent kinetic models were used to research the photochemical reactivity of HSs. The possible rate equation of photochemical reactivity of HSs follows the zero-order kinetic model (n = 0) and the first-order kinetic model (n = 1), whose equations are expressed as follows:
where
All parameter values of k,
Result and Discussion
General EEMs of HSs
Before the photochemical reaction, the general EEMs exhibited three main peaks for FA, these named Peak A (Ex/Em: 308–312/422–434 nm), Peak B (Ex/Em: 254–260/430–446 nm), Peak C (Ex/Em: 228–234/424–444 nm), respectively (Figure 1; Supplementary Table S1). One main peak for HA was located at Ex/Em: 272/484 nm, here named Peak D, before the irradiation (Figure 1; Supplementary Table S1). According to previous research, Peak A, Peak B, and Peak D are attributable to humic-like materials, while Peak C corresponds to fulvic-like materials (Sun et al., 2016; Song et al., 2017). Specifically, the Em of Peak D of HA was longer than that of Peak B of FA (Figure 1, Supplementary Table S1). A longer Ex/Em of soil humic acid may indicate greater aromaticity and a larger scale of the π-electron system (Yu et al., 2020). This longer Ex/Em of HA could also arise from it harboring a higher amount of conjugated aromatic π-electron systems with electron-withdrawing functional groups when compared with FA.
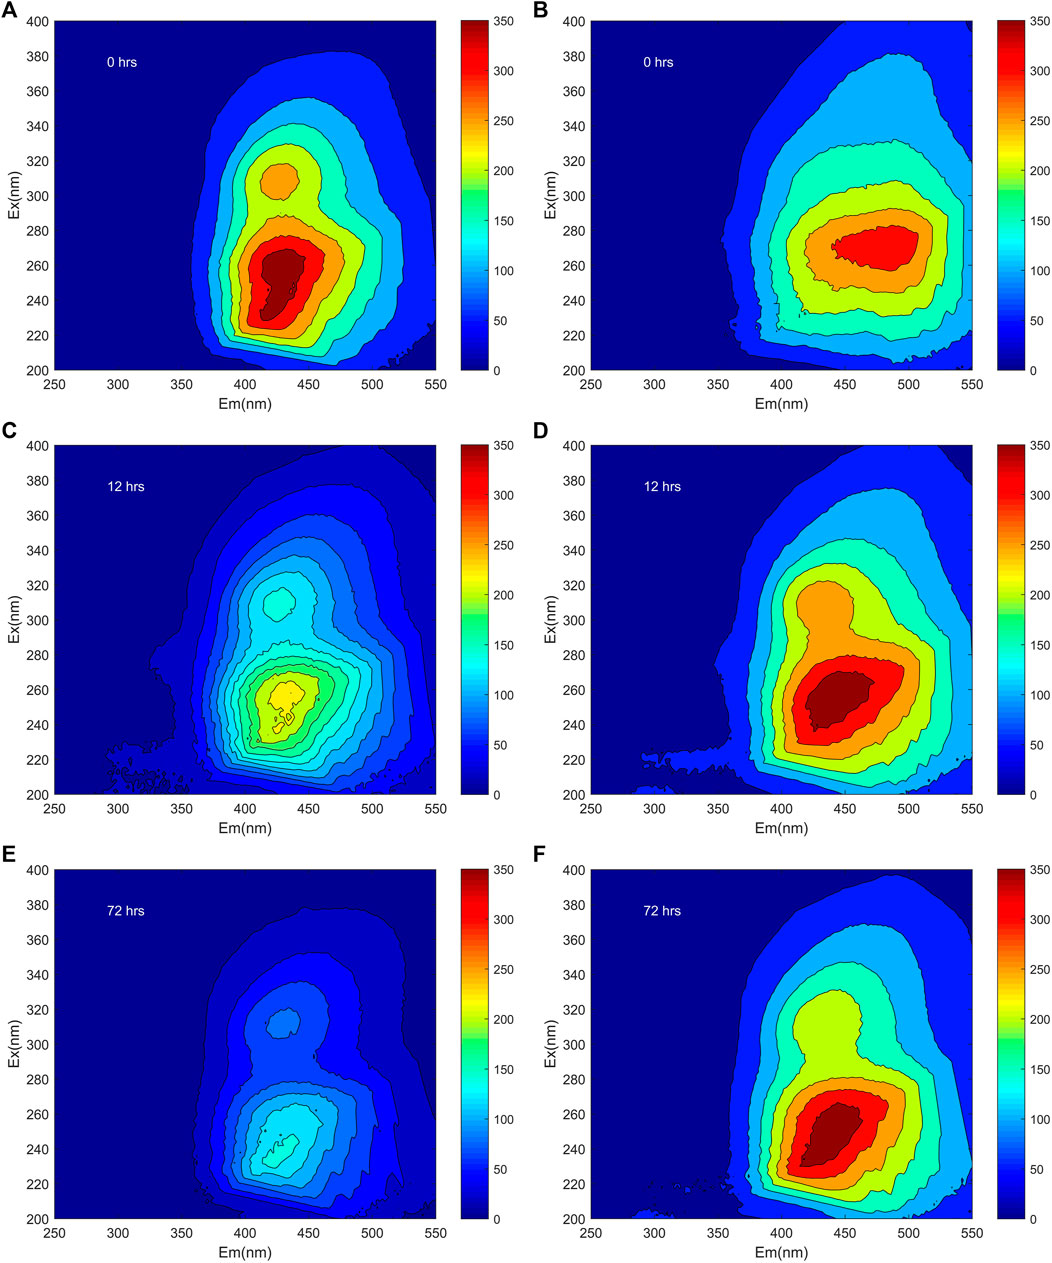
FIGURE 1. The EEMs of both FA (A,C,E) and HA (B,D,F) at pH 6 after their irradiation for 0, 12, and 72 h, respectively.
The fluorescence intensities both of Peak A, B, and C for FA decreased during irradiation. In detail, the fluorescence intensity of Peak A, Peak B, and Peak C decreased to 54.6, 61.2, and 59.6% rapidly during irradiation of 0–12 h, respectively, and the fluorescence intensity of Peak A and Peak C decreased to 31.6 and 43.3% gradually during irradiation of 12–72 h, while, the Peak B of FA was disappeared at the end of irradiation (Figure 1; Supplementary Table S1). Declines in fluorescence intensity during irradiation were also obtained during the photodegradation of DOM in Lake Baihua and Lake Hongfeng (Zhang et al., 2020). Interestingly, during the irradiation the Peak D of HA split into Peak A, B, and C. Photolysis of humic substances in this study was firstly considered to be carried out by direct photolysis, which involves energy and electron transfer after absorption of photons by humic substances (Xu et al., 2011). In the study of photodegradation of Suwannee River fulvic acid and eutrophic lake-derived DOM, it was suggested that the reduction in fluorescence intensity can be explained by the removal of aromatic chromophores and/or the degradation of aromatic compounds to produce humic substances photoproducts that do not absorb UV light (Hur et al., 2011; Xu and Jiang, 2013). Previous research has shown that photodegradation of DOM in sub-alpine lake resulted in increase in fluorescence intensity, the increase of fluorescent substances may be due to some aromatic chromophores with resistance to photodegradation or the formation of aromatic humic substances compounds during irradiation experiments (Du et al., 2016).
The positions of peaks changed in varying degrees, for both FA and HA, across the irradiation time 0–72 h. The clear red shifts of Em for Peak C in FA were observed at 6 and 8 nm after irradiation for 12 and 72 h, respectively (Figure 1A; Supplementary Table S1). After irradiation, a red shift was also found for the Ex/Em of Peak A, the Em of Peak B, and the Em of Peak C for HA (Figure 1B; Supplementary Table S1). Red shifts were also reported during the irradiation of DOM in Lake Hongfeng and colloidal organic matter in Yangtze River (Zhu et al., 2017; Zhang et al., 2020), in those cases being related to more carbonyl, hydroxyl, alkoxy, and amino groups in the DOM molecules (Yu et al., 2020). The slight red shifts for both FA and HA likely arose from possible changes in conformation that occurred during irradiation with simulating solar energy.
FRI Analysis of HSs
FRI was utilized here to quantitatively analyze the EEM spectra and identify different fluorescence materials, with EEM of the HSs then classified into five regions (Regions I–V) according to the previous reports (Chen et al., 2003). Both Region I (Ex/Em: 200–250/250–330 nm) and Region II (Ex/Em: 200–250/330–380 nm) were related to simple aromatic proteins, namely tyrosine-like and tryptophan-like materials, respectively. Additionally, Region III (Ex/Em: 200–250/380–550 nm), Region IV (Ex/Em: 250–450/250–380 nm), and Region V (Ex/Em: 250–450/380–550 nm) were respectively classified as fulvic-like, soluble microbial byproduct-like, and humic-like materials (Chen et al., 2003; Song et al., 2018). Peak A (Ex/Em: 308–312/428–434 nm), Peak B (Ex/Em: 254–260/432–446 nm), and Peak D (Ex/Em: 272/484 nm) were all located in Region V, thus corresponding to humic-like materials, while Peak C (Ex/Em: 227–237/424–444 nm), located in Region III, corresponded to fulvic-like materials.
Figure 2 shows the regional distributions of FA and HA as boxplots. For FA, the Pi,n of regions I–V had values of 1.16 ± 0.19%, 2.59 ± 0.18%, 29.44 ± 1.57%, 5.01 ± 0.28%, and 61.81 ± 1.54%, respectively (Figure 2A), while those of HA were 1.22 ± 0.35%, 2.12 ± 0.17%, 27.00 ± 2.08%, 4.40 ± 0.35%, and 65.26 ± 2.15%, respectively (Figure 2B). The sum of PIII,n and PV,n was more than 90%, indicating that fulvic-like and humic-like were the main materials of FA and HA. Mean Pi,n and its interquartile range were used to compare the contents of specific materials in the HSs (Wei et al., 2016). In this way, the contents of fluorescent materials were ranked as humic-like > fulvic-like > soluble microbial byproduct-like > tryptophan-like > tyrosine-like materials, for both FA and HA.
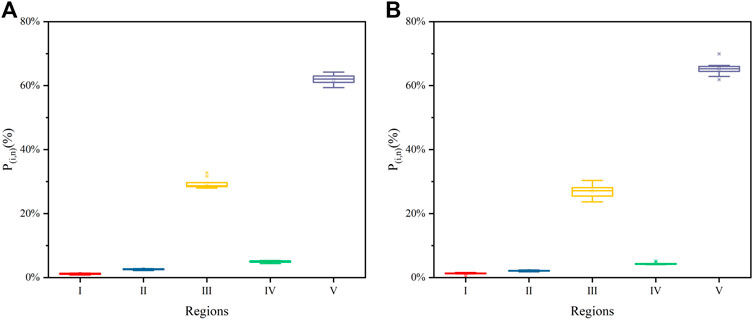
FIGURE 2. Boxplots of fluorescence response parameter’s (Pi,n) distributions in the EEMs regions of both FA (A) and HA (B)
Distributions of Pi,n of both FA and HA with irradiation time are shown in Figure 3. For FA, the values of PI,n, PII,n, and PIII,n increased from 0.81 to 1.02%, from 2.21 to 2.49%, and from 27.97 to 32.76%, respectively, while those of PIV,n, and PV,n decreased from 4.79 to 4.37% and from 64.24 to 59.37% during 0–72 h of irradiation (Figures 3A,B). For HA, over the same irradiation period, the PI,n, PII,n, and PIII,n values increased from 0.29 to 1.38%, from 1.78 to 2.31%, and from 23.67 to 30.38%, respectively, while PIV,n, and PV,n respectively decreased from 4.33 to 4.05% and from 69.93 to 61.88% (Figures 3C,D). The maximum increase of PIII,n related to fulvic-like materials was less than 6.8%, while the maximum decrease of PV,n related to humic-like materials was less than 8.1%, for both FA and HA. By contrast, maximal changes in PI,n,PII,n, and PIV,n that were related to protein-like materials were less than 0.2–1.1%, for both FA and HA. Although irradiation significantly affected the original EEM of FA and HA, slight changes to the distributions of Pi,n (<10%) were discernible for both. Such slight variation in the distributions of Pi,n were also observed in previous studies, related there to the photodegradation of dissolved organic matter in lakes (Zhang et al., 2020). Hence, a PARAFAC analysis was carried out to further investigate the fluorescence properties of FA and HA during irradiation.
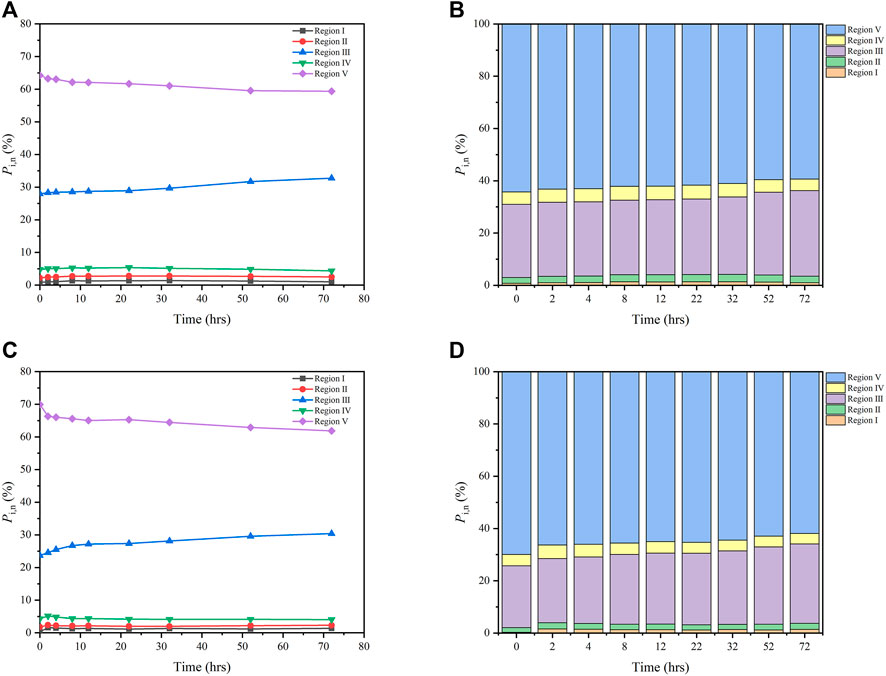
FIGURE 3. Distributions of Pi,n of for FA (A,B) and HA (C,D) as a function of irradiation time, from 0 to 72 h (Region I: tyrosine-like materials; Region II, tryptophan-like materials; Region III, fulvic-like materials; Region IV, soluble microbial byproduct-like materials; Region V, humic-like materials).
PARAFAC Analysis of HSs
The spectra of individual components were successfully deconvoluted via the PARAFAC analysis of EEMs of all FA and HA samples during their irradiation. Using the PARAFAC models’ residual analysis and split-half analysis (Maqbool and Hur, 2016; Song et al., 2017), the appropriate number of components was determined to be four (Figure 4).
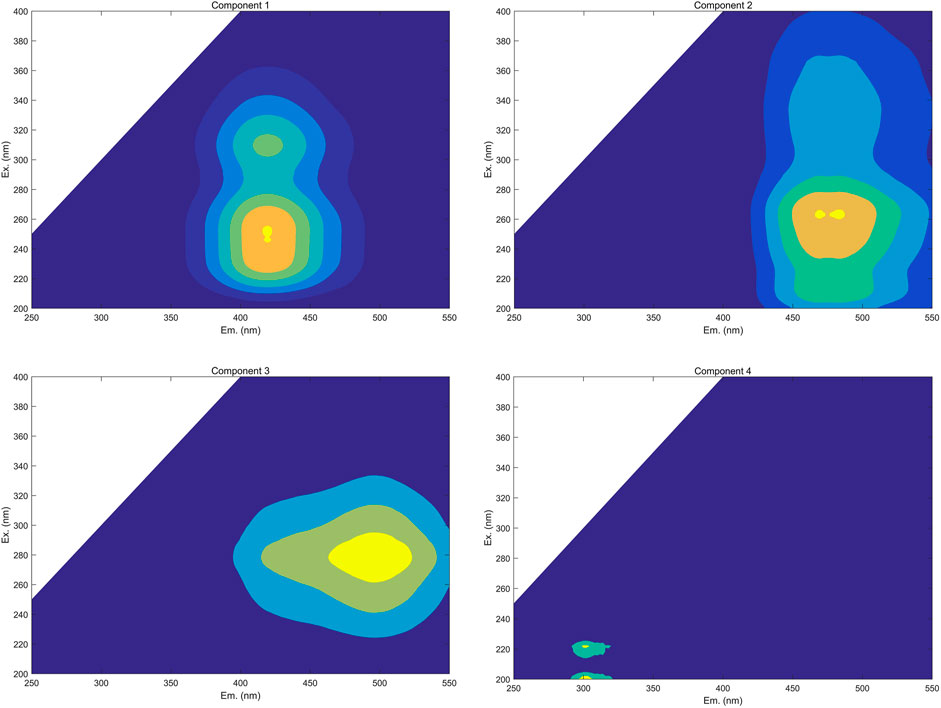
FIGURE 4. Identified PARAFAC components of FA and HA that were isolated from forest soil (Component 1, fulvic-like components composed of both carboxylic-like and phenolic-like chromophores; Component 2, terrestrial humic-like components primarily composed of carboxylic-like chromophores; Component 3, microbial humic-like components overwhelming composed of phenolic-like fluorophores; Component 4, protein-like components).
To identify these four components generated by the PARAFAC analysis, model loadings were uploaded into OpenFluor and compared with the previous research. The Tucker congruence coefficient (TCC) was used to evaluate the consistency of spectra between components derived from different samples and models (Murphy et al., 2011). Multiple strong matches (i.e., TCC >0.95) for all of the components were detected (20, 13, 9, and 3 matches for the components C1, C2, C3, and C4, respectively) in the OpenFluor database. Some information, including the locations of peaks, the maximum intensity of fluorescence, components’ categories, and primary compounds of PARAFAC components are summarized in Table 1. Through their comparison with the OpenFluor database, C1 (Ex/Em: 250–310/420 nm), C2 (Ex/Em: 262/470 nm), C3 (Ex/Em: 280/496 nm), and C4 (Ex/Em: 222/302 nm) were categorized here, respectively, as a fulvic-like component composed of both carboxylic-like and phenolic-like chromophores, a terrestrial humic-like component primarily composed of carboxylic-like chromophores, a microbial humic-like component mostly composed of phenolic-like fluorophores, and a protein-like component (Murphy et al., 2011; Yan et al., 2013; Derrien et al., 2019; Kida et al., 2019). The Em wavelength was longer for C3 than C2, which meant the microbial humic-like components harbored greater aromaticity and a larger scale for the
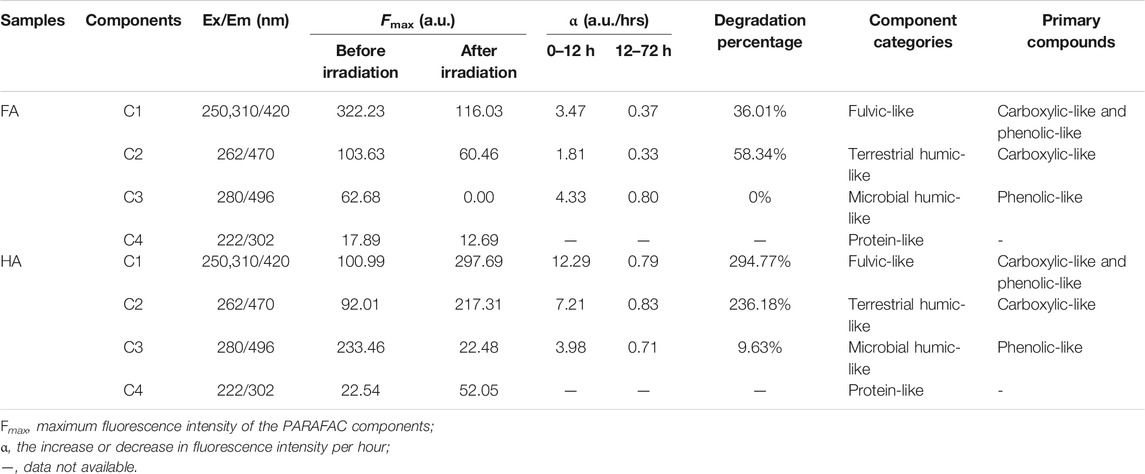
TABLE 1. Parameters and categories of the individual PARAFAC components for FA and HA during irradiation.
Before irradiation, for FA, the Fmax of C1 (322.23 a.u.) was greater than that of C2 (103.63 a.u.), followed by C3 (62.68 a.u.), and it was least in C4 (17.89 a.u.), while for HA, the Fmax was greatest for C3 (233.46 a.u.), followed by C1 (100.99 a.u.), C2 (92.01 a.u.), and then C4 (22.54 a.u.) (Table 1). The C4 component, however, is not discussed here due to its Fmax being negligible (Supplementary Figure S4; Table 1); this phenomenon was also reported by Yamashita and Jaffe (2008), who instead focused on differences in metal binding among individual PARAFAC components. The initial Fmax values of those components suggested the fulvic-like and humic-like components were the major components for both FA and HA, a result consistent with our analysis of the original EEM using FRI (Figure 2). The variation in the Fmax of components for both FA and HA during the irradiation process is shown in Figure 5. After irradiation for 72 h, for FA, the Fmax of C1–C3 decreased respectively to 36.01, 58.34, and 0%, whereas for HA the Fmax of C1 and C2 increased to 294.77 and 236.18%, respectively, but that of its C3 decreased to 9.63% (Table 1). In comparison with both C1 and C2, a greater decrease of C3 was obtained, indicating a greater change in chemical structure and/or configuration for microbial humic-like components than either the terrestrial humic-like or fulvic-like components during the irradiation of FA. A faster decline in the humic-like than fulvic-like component was also reported by Zhang et al. (2020), who had focused on the irradiation of DOM from artificial reservoirs on a krastic plateau. A greater reduction in the microbial humic-like component than terrestrial humic-like component was also found during an investigation of the influence of pH on DOM’s photodegradation in the Suwannee River (Timko et al., 2015). In our study, the Fmax of C1 and C2 of HA increased, which is inconsistent with its dynamics in FA during the irradiation process (Figure 5). That increased PARAFAC component was also observed for irradiated DOM from a sub-alpine lake (Du et al., 2016), a finding attributable to a greater aromaticity and photorefractive tendency. The fluorescence intensity of each component in FA was significantly decreased under light conditions, which was thought to be related to the direct disruption of the structure of high molecular weight polyaromatic compounds. In the study of photodegradation of aquatic humic substances isolated from Negro river, the irradiation caused the decrease in fluorescence by dissociating conjugates and double bonds and reduced the π electronic density (Rodriguez-Zuniga et al., 2008). The enhanced fluorescence intensity of C1 and C2 in HA can be explained by the breakage of hydrogen bonds Patel-Sorrentino et al. (2004) studied the effect of UV-vis light on the fluorescence of DOM in the Amazon basin, they conclude that the release of H+ leads to a more dispersed conformation of the distribution, which promotes the activation of the initially hidden fluorophores in the aggregates. Plausible mechanisms underpinning the increase of both C1 and C2 during the irradiation of HA should be further investigated and discussed in future work. The change ratio (α) was defined here as the decrease/increase of fluorescence intensity per hour during the irradiation of HSs. For FA, the α of C1–C3 was 1.81–4.33 a.u./h during its irradiation for 0–12 h, and 0.33–0.80 a.u./h when irradiate for 12–72 h (Table 1). For HA, the α of C1–C3 had a range of 3.98–12.29 a.u./h during 0–12 h of irradiation, and 0.71–0.83 a.u./hrs under irradiation for 12–72 h (Table 1). This variation inferred from α indicated a higher photodegradation rate in the early than late stage of irradiation. An apparent two stage-effect of irradiation was also reported by (Lou and Xie, 2006), who investigated the effects of photodegradation on the molecular weight of DOM. We discuss this phenomenon in the next section.
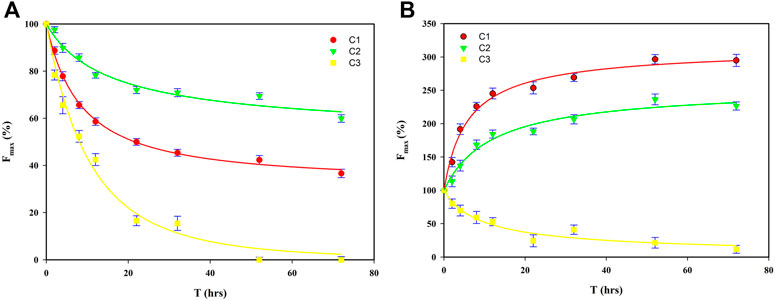
FIGURE 5. Fitted regressions of Fmax of C1–C3 for FA (A) and HA (B) for the first-order kinetic model (C1, fulvic-like component; C2, terrestrial humic-like component, C3, microbial humic-like component).
Kinetic Characteristics of Photochemical of HSs
Kinetic models are powerful methods to evaluate the photochemical reactivity process (Hur et al., 2011; Zhao et al., 2018). For instance, the photochemical reactivity of HSs derived from leaf litter and the Suwannee River’s fulvic acid were estimated by the first-order kinetic model fitted to fluorescence spectroscopy data (Hur et al., 2011). The photodegradation process of aquatic DOM derived from cyanobacterial blooms has been evaluated by the first-order kinetic model with UV irradiation (Xu and Jiang, 2013). The zero-order and first-order kinetic models were both used to evaluate the photodegradation process of DOM from Lake Hongfeng and Baihua (Zhang et al., 2020). Here, zero-order and first-order kinetic models were also applied to fit the change of Fmax during the entire photochemical reactivity process for FA and HA from forest soil. We used R2 (the fitting parameter adjusted square of correlation coefficient) to examine the fitness of the kinetic models to the data. Some basic information, including rate constant (k), R2, Fend, and half-life (
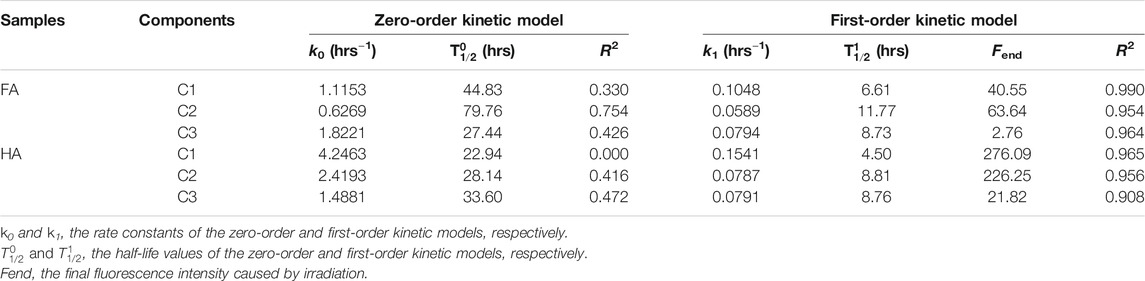
TABLE 2. Estimated parameters from the zero-order and first-order kinetic simulations of the photochemical reactivity of FA and HA.
Conclusion
The photochemical reactivity of HSs was investigated by EEM combined with FRI and PARAFAC and kinetic models. Three main peaks of Peak A (Ex/Em: 308–312/422–434 nm), Peak B (Ex/Em: 254–260/430–446 nm), Peak C (Ex/Em: 228–234/424–444 nm) for FA, and another one, Peak D (Ex/Em: 272/484 nm) for HA, were observed in the EEMs before apply the irradiation treatment. The positioning of those peaks underwent a differential red shift during the irradiation process, this related to the changed structural composition of the FA and HA components. Their regional distributions indicated that the humic-like and fulvic-like were the main components of the FA and HA samples. Humic-like materials were distinguished by the greatest changes, followed by the fulvic-like materials and minimal changes of protein-like materials while irradiated. We determined four components of HSs via the PARAFAC analysis, namely a fulvic-like one composed of both carboxylic-like and phenolic-like chromophores (C1), terrestrial humic-like one primarily composed of carboxylic-like chromophores (C2), microbial humic-like one overwhelmingly composed of phenolic-like fluorophores (C3), and protein-like one (C4). During the photochemical reactivity process, the Fmax of C1 and C2 of FA decreased to 36.01 and 58.34%, while that of C3 for FA and HA fell to 0 and 9.63%, respectively; in contrast, the Fmax of C1 and C2 of HA increased to 294.77 and 236.18%, respectively. The increased Fmax of C1 and C2 in HA implied greater aromaticity and photorefractive tendencies. The R2 values (R2 = 0.908–0.990) for the fitted first-order kinetic model significantly exceeded those of the zero-order kinetic model for the photochemical reactivity process of both FA and HA. According to the obtained parameters k and T1/2, the stability of the major components (C1–C3) could be ranked as terrestrial humic-like > microbial humic-like > fulvic-like, for both FA and HA.
Data Availability Statement
The original contributions presented in the study are included in the article/Supplementary Material, further inquiries can be directed to the corresponding authors.
Author Contributions
X-YW, S-JT, F-HS, and N-NH contributed to the experiments’ operation, data analysis, and writing of the draft manuscript; W-QT, FG, Q-PY, and Y-CB contributed to the planning and design of both the project and the manuscript.
Funding
This work was financially supported by the National Natural Science Foundation of China (grant number 41703123) and the Fundamental Research Funds for the Central Public-interest Scientific Institution (grant number 2019YSKY-006).
Conflict of Interest
The authors declare that the research was conducted in the absence of any commercial or financial relationships that could be construed as a potential conflict of interest.
Supplementary Material
The Supplementary Material for this article can be found online at: https://www.frontiersin.org/articles/10.3389/fchem.2021.679286/full#supplementary-material
References
Bahram, M., Bro, R., Stedmon, C., and Afkhami, A. (2006). Handling of Rayleigh and Raman Scatter for PARAFAC Modeling of Fluorescence Data Using Interpolation. J. Chemometrics 20, 99–105. doi:10.1002/cem.978
Bai, Y., Wu, F., Xing, B., Meng, W., Shi, G., Ma, Y., et al. (2015). Isolation and Characterization of Chinese Standard Fulvic Acid Sub-fractions Separated from forest Soil by Stepwise Elution with Pyrophosphate Buffer. Sci. Rep. 5, 8723. doi:10.1038/srep08723
Chen, W., Westerhoff, P., Leenheer, J. A., and Booksh, K. (2003). Fluorescence Excitation−Emission Matrix Regional Integration to Quantify Spectra for Dissolved Organic Matter. Environ. Sci. Technol. 37, 5701–5710. doi:10.1021/es034354c
Derrien, M., Shin, K.-H., and Hur, J. (2019). Assessment on Applicability of Common Source Tracking Tools for Particulate Organic Matter in Controlled End Member Mixing Experiments. Sci. Total Environ. 666, 187–196. doi:10.1016/j.scitotenv.2019.02.258
Du, Y., Zhang, Y., Chen, F., Chang, Y., and Liu, Z. (2016). Photochemical Reactivities of Dissolved Organic Matter (DOM) in a Sub-alpine lake Revealed by EEM-PARAFAC: An Insight into the Fate of Allochthonous DOM in alpine Lakes Affected by Climate Change. Sci. Total Environ. 568, 216–225. doi:10.1016/j.scitotenv.2016.06.036
Filipe, O. M. S., Santos, E. B. H., Otero, M., Gonçalves, E. A. C., and Neves, M. G. P. M. S. (2020). Photodegradation of Metoprolol in the Presence of Aquatic Fulvic Acids. Kinetic Studies, Degradation Pathways and Role of Singlet Oxygen, OH Radicals and Fulvic Acids Triplet States. J. Hazard. Mater. 385, 121523. doi:10.1016/j.jhazmat.2019.121523
Gao, H., and Zepp, R. G. (1998). Factors Influencing Photoreactions of Dissolved Organic Matter in a Coastal River of the southeastern united states. Environ. Sci. Technol. 32, 2940–2946. doi:10.1021/es9803660
Gonsior, M., Hertkorn, N., Conte, M. H., Cooper, W. J., Bastviken, D., Druffel, E., et al. (2014). Photochemical Production of Polyols Arising from Significant Photo-Transformation of Dissolved Organic Matter in the Oligotrophic Surface Ocean. Mar. Chem. 163, 10–18. doi:10.1016/j.marchem.2014.04.002
Guo, X.-j., Zhu, N.-m., Chen, L., Yuan, D.-h., and He, L.-s. (2015). Characterizing the Fluorescent Properties and Copper Complexation of Dissolved Organic Matter in saline-alkali Soils Using Fluorescence Excitation-Emission Matrix and Parallel Factor Analysis. J. Soils Sediments 15, 1473–1482. doi:10.1007/s11368-015-1113-7
He, X.-S., Xi, B.-D., Li, X., Pan, H.-W., An, D., Bai, S.-G., et al. (2013). Fluorescence Excitation-Emission Matrix Spectra Coupled with Parallel Factor and Regional Integration Analysis to Characterize Organic Matter Humification. Chemosphere 93, 2208–2215. doi:10.1016/j.chemosphere.2013.04.039
Hur, J., Jung, K.-Y., and Jung, Y. M. (2011). Characterization of Spectral Responses of Humic Substances upon UV Irradiation Using Two-Dimensional Correlation Spectroscopy. Water Res. 45, 2965–2974. doi:10.1016/j.watres.2011.03.013
Ishii, S. K. L., and Boyer, T. H. (2012). Behavior of Reoccurring PARAFAC Components in Fluorescent Dissolved Organic Matter in Natural and Engineered Systems: A Critical Review. Environ. Sci. Technol. 46, 2006–2017. doi:10.1021/es2043504
Kida, M., Kojima, T., Tanabe, Y., Hayashi, K., Kudoh, S., Maie, N., et al. (2019). Origin, Distributions, and Environmental Significance of Ubiquitous Humic-like Fluorophores in Antarctic Lakes and Streams. Water Res. 163, 114901. doi:10.1016/j.watres.2019.114901
Kitis, M., Kilduff, J. E., and Karanfil, T. (2001). Isolation of Dissolved Organic Matter (Dom) from Surface Waters Using Reverse Osmosis and its Impact on the Reactivity of Dom to Formation and Speciation of Disinfection By-Products. Water Res. 35, 2225–2234. doi:10.1016/S0043-1354(00)00509-1
Kulovaara, M. (1996). Light-induced Degradation of Aquatic Humic Substances by Simulated Sunlight. Int. J. Environ. Anal. Chem. 62, 85–95. doi:10.1080/03067319608027056
López-Vinent, N., Cruz-Alcalde, A., Gutiérrez, C., Marco, P., Giménez, J., and Esplugas, S. (2020). Micropollutant Removal in Real WW by Photo-Fenton (Circumneutral and Acid pH) with BLB and LED Lamps. Chem. Eng. J. 379, 122416. doi:10.1016/j.cej.2019.122416
Lou, T., and Xie, H. (2006). Photochemical Alteration of the Molecular Weight of Dissolved Organic Matter. Chemosphere 65, 2333–2342. doi:10.1016/j.chemosphere.2006.05.001
Maie, N., Pisani, O., and JaffÉ, R. (2008). Mangrove Tannins in Aquatic Ecosystems: Their Fate and Possible Influence on Dissolved Organic Carbon and Nitrogen Cycling. Limnol. Oceanogr. 53, 160–171. doi:10.4319/lo.2008.53.1.0160
Maqbool, T., and Hur, J. (2016). Changes in Fluorescent Dissolved Organic Matter upon Interaction with Anionic Surfactant as Revealed by EEM-PARAFAC and Two Dimensional Correlation Spectroscopy. Chemosphere 161, 190–199. doi:10.1016/j.chemosphere.2016.07.016
Mostofa, K. M. G., Yoshioka, T., Konohira, E., and Tanoue, E. (2007). Photodegradation of Fluorescent Dissolved Organic Matter in River Waters. Geochem. J. 41, 323–331. doi:10.2343/geochemj.41.323
Murphy, K. R., Hambly, A., Singh, S., Henderson, R. K., Baker, A., Stuetz, R., et al. (2011). Organic Matter Fluorescence in Municipal Water Recycling Schemes: toward a Unified PARAFAC Model. Environ. Sci. Technol. 45, 2909–2916. doi:10.1021/es103015e
Patelsorrentino, N., Mounier, S., Lucas, Y., and Benaim, J. (2004). Effects of UV-Visible Irradiation on Natural Organic Matter from the Amazon basin. Sci. Total Environ. 321, 231–239. doi:10.1016/j.scitotenv.2003.08.017
Retelletti Brogi, S., Balestra, C., Casotti, R., Cossarini, G., Galletti, Y., Gonnelli, M., et al. (2020). Time Resolved Data Unveils the Complex DOM Dynamics in a Mediterranean River. Sci. Total Environ. 733, 139212. doi:10.1016/j.scitotenv.2020.139212
Rodríguez-Zúñiga, U. F., Milori, D. M. B. P., da Silva, W. T. L., Silva, L., Oliveira, L. C., Rocha, J. C., et al. (2008). Changes in Optical Properties Caused by UV-Irradiation of Aquatic Humic Substances from the Amazon River basin: Seasonal Variability Evaluation. Environ. Sci. Technol. 42, 1948–1953. doi:10.1021/es702156n
Rodríguez-Zúñiga, U. F., Milori, D. M. B. P., da Silva, W. T. L., Martin-Neto, L., Oliveira, L. C., and Rocha, J. C. (2008). Changes in Optical Properties Caused by UV-Irradiation of Aquatic Humic Substances from the Amazon River basin: Seasonal Variability Evaluation. Environ. Sci. Technol. 42, 1948–1953. doi:10.1021/es702156n
Scully, N. M., Maie, N., Dailey, S. K., Boyer, J. N., Jones, R. D., and Jaffé, R. (2004). Early Diagenesis of Plant-Derived Dissolved Organic Matter along a Wetland, Mangrove, Estuary Ecotone. Limnol. Oceanogr. 49, 1667–1678. doi:10.4319/lo.2004.49.5.1667
Song, F., Wu, F., Feng, W., Tang, Z., Giesy, J. P., Guo, F., et al. (2018). Fluorescence Regional Integration and Differential Fluorescence Spectroscopy for Analysis of Structural Characteristics and Proton Binding Properties of Fulvic Acid Sub-fractions. J. Environ. Sci. 74, 116–125. doi:10.1016/j.jes.2018.02.015
Song, F., Wu, F., Guo, F., Wang, H., Feng, W., Zhou, M., et al. (2017). Interactions between Stepwise-Eluted Sub-fractions of Fulvic Acids and Protons Revealed by Fluorescence Titration Combined with EEM-PARAFAC. Sci. Total Environ. 605-606, 58–65. doi:10.1016/j.scitotenv.2017.06.164
Stedmon, C. A., and Bro, R. (2008). Characterizing Dissolved Organic Matter Fluorescence with Parallel Factor Analysis: a Tutorial. Limnol. Oceanogr. Methods 6, 572–579. doi:10.4319/lom.2008.6.572
Sun, J., Guo, L., Li, Q., Zhao, Y., Gao, M., She, Z., et al. (2016). Three-dimensional Fluorescence Excitation-Emission Matrix (EEM) Spectroscopy with Regional Integration Analysis for Assessing Waste Sludge Hydrolysis at Different Pretreated Temperatures. Environ. Sci. Pollut. Res. 23, 24061–24067. doi:10.1007/s11356-016-7610-4
Timko, S. A., Gonsior, M., and Cooper, W. J. (2015). Influence of pH on Fluorescent Dissolved Organic Matter Photo-Degradation. Water Res. 85, 266–274. doi:10.1016/j.watres.2015.08.047
Wang, Y., Hu, Y., Yang, C., Wang, Q., and Jiang, D. (2019). Variations of DOM Quantity and Compositions along WWTPs-River-lake Continuum: Implications for Watershed Environmental Management. Chemosphere 218, 468–476. doi:10.1016/j.chemosphere.2018.11.037
Wang, Z., Cao, J., and Meng, F. (2015). Interactions between Protein-like and Humic-like Components in Dissolved Organic Matter Revealed by Fluorescence Quenching. Water Res. 68, 404–413. doi:10.1016/j.watres.2014.10.024
Wei, Z., Wang, X., Zhao, X., Xi, B., Wei, Y., Zhang, X., et al. (2016). Fluorescence Characteristics of Molecular Weight Fractions of Dissolved Organic Matter Derived from Composts. Int. Biodeterioration Biodegradation 113, 187–194. doi:10.1016/j.ibiod.2016.03.010
Wu, J., Zhang, H., He, P.-J., and Shao, L.-M. (2011). Insight into the Heavy Metal Binding Potential of Dissolved Organic Matter in MSW Leachate Using EEM Quenching Combined with PARAFAC Analysis. Water Res. 45, 1711–1719. doi:10.1016/j.watres.2010.11.022
Xie, W., Zhang, S., Ruan, L., Yang, M., Shi, W., Zhang, H., et al. (2017). Evaluating Soil Dissolved Organic Matter Extraction Using Three-Dimensional Excitation-Emission Matrix Fluorescence Spectroscopy. Pedosphere 27, 968–973. doi:10.1016/s1002-0160(17)60466-1
Xu, H., Cooper, W. J., Jung, J., and Song, W. (2011). Photosensitized Degradation of Amoxicillin in Natural Organic Matter Isolate Solutions. Water Res. 45, 632–638. doi:10.1016/j.watres.2010.08.024
Xu, H., and Jiang, H. (2013). UV-induced Photochemical Heterogeneity of Dissolved and Attached Organic Matter Associated with Cyanobacterial Blooms in a Eutrophic Freshwater lake. Water Res. 47, 6506–6515. doi:10.1016/j.watres.2013.08.021
Yamashita, Y., and Jaffé, R. (2008). Characterizing the Interactions between Trace Metals and Dissolved Organic Matter Using Excitation−Emission Matrix and Parallel Factor Analysis. Environ. Sci. Technol. 42, 7374–7379. doi:10.1021/es801357h
Yan, M., Fu, Q., Li, D., Gao, G., and Wang, D. (2013). Study of the pH Influence on the Optical Properties of Dissolved Organic Matter Using Fluorescence Excitation-Emission Matrix and Parallel Factor Analysis. J. Lumin. 142, 103–109. doi:10.1016/j.jlumin.2013.02.052
Yu, J., Xiao, K., Xue, W., Shen, Y.-x., Tan, J., Liang, S., et al. (2020). Excitation-emission Matrix (EEM) Fluorescence Spectroscopy for Characterization of Organic Matter in Membrane Bioreactors: Principles, Methods and Applications. Front. Environ. Sci. Eng. 14. doi:10.1007/s11783-019-1210-8
Zhang, J., Song, F., Li, T., Xie, K., Yao, H., Xing, B., et al. (2020). Simulated Photo-Degradation of Dissolved Organic Matter in Lakes Revealed by Three-Dimensional Excitation-Emission Matrix with Regional Integration and Parallel Factor Analysis. J. Environ. Sci. 90, 310–320. doi:10.1016/j.jes.2019.11.019
Zhao, C., Wang, Z., Wang, C., Li, X., and Wang, C.-C. (2018). Photocatalytic Degradation of DOM in Urban Stormwater Runoff with TiO2 Nanoparticles under UV Light Irradiation: EEM-PARAFAC Analysis and Influence of Co-existing Inorganic Ions. Environ. Pollut. 243, 177–188. doi:10.1016/j.envpol.2018.08.062
Keywords: humic substance, photochemical reactivity, excitation-emission matrix fluorescence, fluorescence regional integration, parallel factor analysis, kinetic model
Citation: Wang X-y, Yang Q-p, Tian S-j, Song F-h, Guo F, Huang N-n, Tan W-q and Bai Y-c (2021) Photochemical Reactivity of Humic Substances in an Aquatic System Revealed by Excitation-Emission Matrix Fluorescence. Front. Chem. 9:679286. doi: 10.3389/fchem.2021.679286
Received: 11 March 2021; Accepted: 14 May 2021;
Published: 28 May 2021.
Edited by:
Hualin Jiang, Nanchang Hangkong University, ChinaReviewed by:
Fei Wang, University of Science and Technology Beijing, ChinaShipeng Yang, Tsinghua University, China
Copyright © 2021 Wang, Yang, Tian, Song, Guo, Huang, Tan and Bai. This is an open-access article distributed under the terms of the Creative Commons Attribution License (CC BY). The use, distribution or reproduction in other forums is permitted, provided the original author(s) and the copyright owner(s) are credited and that the original publication in this journal is cited, in accordance with accepted academic practice. No use, distribution or reproduction is permitted which does not comply with these terms.
*Correspondence: Wei-qiang Tan, dGFud2VpcWlhbmdAcXV0LmVkdS5jbg==; Ying-chen Bai, YmFpeWNAY3JhZXMub3JnLmNu