
94% of researchers rate our articles as excellent or good
Learn more about the work of our research integrity team to safeguard the quality of each article we publish.
Find out more
ORIGINAL RESEARCH article
Front. Chem. , 25 March 2021
Sec. Chemical Physics and Physical Chemistry
Volume 9 - 2021 | https://doi.org/10.3389/fchem.2021.630074
This article is part of the Research Topic Gas, Liquid and Solid Nanoparticles in Aqueous Media and their Possible Applications in Medicine and Biology View all 20 articles
 Nikolai F. Bunkin1,2*
 Alexey V. Shkirin2,3
 Nikita V. Penkov4
 Mikhail V. Goltayev4Pavel S. Ignatiev5
 Sergey V. Gudkov2,6Andrey Yu. Izmailov6
The dependence of the volume number density of ion-stabilized gas nanobubbles (bubstons) on the type of gas and the pressure created by this gas in deionized water and saline solution has been investigated. The range of external pressures from the saturated water vapor (17 Torr) to 5 atm was studied. It turned out that the growth rate of the volume number density of bubstons is controlled by the magnitude of the molecular polarizability of dissolved gases. The highest densities of bubstons were obtained for gases whose molecules have a dipole moment. At fixed external pressure and the polarizability of gas molecules, the addition of external ions leads to a sharp increase in the content of bubstons.
Recently, there has been an increased interest in nanobubbles (gas bubbles with a size of 100–200 nm) in the volume of a liquid, see review (Alheshibri et al., 2016) and the references therein. The interest in these objects is primarily due to a wide range of their applications, mainly in medicine and adjacent areas. Nanobubbles are an interdisciplinary topic that connects physics, chemistry, life sciences, and engineering. Currently, new technologies related to the use of nanobubbles are rapidly developing. We note right away that the size 100–200 nm refers rather to the submicron than to the nanoscale. Therefore, it is necessary to clarify what we mean by a nanobubble. The authors of the study (Agarwal et al., 2011) define nanobubbles as bubbles with a diameter of less than 200 nm. However, they also define microbubbles as bubbles with a diameter in the range of 10–50 μm, which leaves a huge gap between the upper boundary of nanobubbles (200 nm) and the lower boundary of microbubbles (10 µm). The authors of the study (Wu et al., 2012) use the term “submicron sized bubbles” as a synonym for “nanobubbles” to describe bubbles several hundred nanometres in diameter. At the same time, in (Cho et al., 2005) the authors use the term nanobubbles for bubbles with a diameter of less than 1000 nm (1 μm). Tsuge in his monography (Tsuge, 2015) argued that for bubbles to be considered nanobubbles, they must have a diameter of less than 100 nm, but the author acknowledged the fact that most researchers set a 1 μm boundary for the diameter of nanobubbles. It is also worth noting that in accordance with ISO/TS 80004-2:2015, the nano prefix used in nanotechnologies must be reserved for objects with at least one characteristic length less than 100 nm. In the case of nanobubbles, the objects are always spherical thus characteristic size is always the diameter. In a number of recent works devoted to nanobubbles [see, for example (Köse et al., 2020)], it is generally accepted that nanobubbles are gas particles with a gas core diameter of less than 1 μm, while for microbubbles this diameter is in the range of 1–10 µm. In the future, we will adhere to this particular classification.
Since nanobubbles are compressed by enormous surface tension forces, the question of their stability always arises. Epstein and Plesset studied the dynamic evolution of bubbles (Epstein and Plesset, 1950) and indicated that bubbles in solution will shrink or expand depending on whether the dissolved gas in the solution is supersaturated or not. The time required for complete bubble dissolution can be determined using the Epstein and Plesset (E-P) equation (Yasui, 2015), which predicts that the survival time for nanosized bubbles should be less than 0.02 s. In contrast to both thermodynamic and kinetic arguments indicating the instability of bulk nanobubbles, numerous experimental works reported on the existence of bulk nanobubbles (Thorpe et al., 1982; Ohgaki et al., 2010; Ushikubo et al., 2010; Oh and Kim, 2017). More importantly, the observed nanobubbles have a lifetime of several minutes to weeks, which is significantly longer than the theoretical prediction. Various hypotheses have been proposed for the interpretation of unexpected observations (Seddon et al., 2012; Nirmalkar et al., 2018; Yasui et al., 2018), although there has not yet been a single conclusion (Häbich et al., 2010; Sedlák and Rak, 2013; Kononov, 2015). Below we give a brief overview of our current understanding of the unexpected stability of bulk nanobubbles.
Several mechanisms have been proposed for stabilizing gas nanobubbles, but for most of them there is experimental evidence to the contrary. We should mention here four main mechanisms for nanobubble stability: the contaminant mechanism (Jin et al., 2007; Sedlák and Rak, 2014; Nirmalkar et al., 2019), the “skin” mechanism (Fox and Herzfeld, 1954; Strasberg, 1959; Ohgaki et al., 2010; Weijs et al., 2012; Zhang et al., 2016), the surface zeta potential mechanism (Ushikubo et al., 2010; Oh and Kim, 2017; Millare and Basilia, 2018) and the high-density mechanism (Huang et al., 2013; Zhang et al., 2013). We however will not describe these mechanisms in detail here.
An alternative mechanism for stabilizing nanobubbles in the bulk of liquid free from foreign solid impurities is the adsorption of ions of the same sign (cations or anions) on the inner surface of nanobubbles. Owing to ionic adsorption, nanobubbles acquire a surface electric charge, and the stabilization is realized due to a balance between surface tension forces and negative electrostatic pressure caused by the repulsion of adsorbed ions. Such nanobubbles are called bubstons (abbreviation for bubbles stabilized by ions). Since the surface tension for bubstons is compensated by the negative electrostatic pressure of adsorbed ions, the gas pressure inside the bubstons is equal to atmospheric, i.e., bubstons are stable both mechanically and diffusionally. Theoretical aspects of the stabilization of bubstons are presented in (Bunkin and Bunkin, 2016); the bubstons themselves were first mentioned in (Bunkin and Bunkin, 1992). Papers (Bunkin et al., 2012; Bunkin et al., 2016; Yurchenko et al., 2016) are devoted to the experimental study of bubstons using various laser techniques.
This work is devoted to the study of the effect of pressure and type of gas on the nucleation process of bubstons. Note that nucleation of the bubble phase occurs when the liquid is supersaturated with a dissolved gas. Experimental works on a topic related to the study of supersaturation state, were started in the seventies of the last century, see (Hemmingsen, 1975). In this work, it was initially assumed that there are no long-lived nucleation centers in the liquid. At the same time, it was shown that exerting high pressure of various gases to water can significantly increase the supersaturation threshold for cavitation. This was interpreted as a consequence of the pre-existing small cavities (cavitation nuclei): the high pressure increases the solubility of the gas in water and thus forces the gas confined in small cavities to dissolve. The maximum supersaturation tension without cavitation, which is the minimum possible limit of spontaneous bubble formation, was 140 atm for O2, and Ar, 190 atm for N2 and 300 atm for He, while massive cavitation occurred at higher supersaturations by 20–30 atm. It is interesting that in this work, in the case of helium, the regime of massive cavitation was not obtained at all, which points to the peculiarities of the nucleation regime of nuclei of the nanobubble phase for helium. At the same time, helium-containing nanobubbles were observed on the surface of a hydrophobized silicon substrate, see (Van Limbeek and Seddon, 2011). As was shown in this work, gas type is a key parameter in the nucleation of surface nanobubbles; all experiments were carried out under equilibrium conditions, i.e., far from the supersaturation state. Since the surface of the substrate was hydrophobized and, apparently, was not absolutely smooth, the nucleation of nanobubbles arose on local roughness (spikes, crevices, and cracks) of the hydrophobic substrate, i.e., in this case, we are dealing with the stabilization of nanobubbles due to the contaminant mechanism. It turned out that there exists an optimal temperature for nanobubble nucleation between ∼35 and ∼40°C that appears to be weakly dependent on gas type. Surprisingly, nanobubble nucleation does not directly depend either on the solubility of a specific gas in water or the relative adsorption strength of the gas to the substrate. This indicates that nanobubbles do not form solely because of the amount of gas available in the bulk.
Experiments related to the realization of a supersaturated state of a dissolved gas in water are rather complicated, while the measurements of the bubble nucleation threshold require cumbersome saturation at high pressures. In (Rubin and Noyes, 1987), the method of chemical reactions at ambient temperature and normal pressure was used instead to obtain supersaturated solutions. The degree of supersaturation is then measured as the amount of gas released when rapid stirring or sonication is suddenly initiated; according to (Rubin and Noyes, 1987), sonication/stirring increased the rate of chemical reactions. The threshold for nucleation is the limit beyond which it is impossible to reach the supersaturation level. The nucleation thresholds for the diatomic gases H2, N2, O2, CO, and NO in aqueous solutions lie between 0.012 and 0.07 M, while for CO2 it is at least 0.4 M. Note that the absence of long-lived nucleation centers of nanobubbles was assumed in (Rubin and Noyes, 1987). The fact that the generation of bubbles requires not only supersaturation with dissolved gas, but also the application of an external force as sonication/stirring, indicates that this force appears to lead to the formation of nanometer cavities, which are filled with dissolved gas, and thus, the supersaturation state is effectively depleted.
It is necessary to mention works in which supersaturation is created in liquids, where nuclei of the nanobubble phase are obviously present. For example, in recent work (Azevedo et al., 2016) a ‘‘new” technique was developed to generate highly loaded dispersions of nanobubbles about 300 nm in size after depressurizing air that saturated water at low pressures (<3 bar) and decreasing the air/water surface tension to approximately 49 mN/m. As a result, a high density of aqueous bulk nanobubbles was created (1.6⋅109 NBs mL/1), which lasted for at least 2 weeks. We should also refer to works (Jin et al., 2019; Wang et al., 2019), in which the efficient generation of nanobubbles was obtained by periodical pressurization - depressurization of water sample in a sealed cell with the help of different gases: the authors of (Wang et al., 2019) investigated N2, O2, and CO2, while in (Jin et al., 2019) the hydrophobic gas SF6 was studied. In (Wang et al., 2019), in particular, the technique of freeze-fracture transmission electron microscope [see, e.g., (Uchida, et al., 2011)] was applied to study the nanobubbles arising due to supersaturation. In works (Azevedo et al., 2016; Jin et al., 2019; Wang et al., 2019), it was found that the volume number density of nanobubbles in a supersaturated state is significantly higher than that for water under normal conditions. The effects of gas concentration and species on the coalescence and growth of nanobubbles were systematically investigated in theoretical study (Li et al., 2018), where, using molecular dynamics simulations, it was shown that with increasing gas concentration, not only surface nanobubbles but also bulk nanobubbles are formed.
Apparently, the most reliable data on the nucleation threshold of nanobubbles in solutions supersaturated with various dissolved gases and free from long-lived nucleation centers, can be obtained in electrophoresis experiments with the use of platinum nanoelectrodes. For example, in (Chen et al., 2014) the critical surface concentration of dissolved H2 required for nanobubble nucleation was measured to be ∼ 0.25 M; this value is ∼ 310 times greater than the saturation concentration at room temperature and pressure and does not depend on the nanoelectrode size. In (Chen et al., 2015), the critical surface concentration of dissolved N2 was measured to be ∼0.11 M, which is ∼160 times higher than the N2 saturation concentration at room temperature and atmospheric pressure. The results of this work suggest that the size of stable gas bubble nuclei depends only on the local concentration of N2 near the electrode surface. Similar results were obtained in (Ren et al., 2017) for oxygen: a single bubble nucleated when the concentration of dissolved O2 on the surface of the Pt electrode reaches ∼0.17 M. This nucleation concentration is ∼130 times higher than the equilibrium saturation concentration of O2 and is independent of the electrode size. Finally, in (Ren et al., 2020), the controlled formation of individual CO2 nanobubbles on Pt nanoelectrodes was reported. It turned out that CO2 bubbles nucleate when the concentration of CO2 at the Pt electrode was exceeds ∼ 0.6 M, which means 18-fold supersaturation.
Summarizing this section, we conclude that the nucleation of gas nanobubbles depends on the type of gas molecules. Furthermore, there is nothing unusual in the fact that the nucleation of nanobubbles must occur should conditions of supersaturation of the liquid with a dissolved gas. However, the question of the mechanism of nanobubble nucleation under normal conditions (i.e., far from the supersaturation point) remains open and requires special consideration. If we assume that the nucleation centers of bubstons are gas molecules dissolved in a liquid then it would seem that the volume number density of nanobubbles should be determined by the partial pressure of a given gas above the liquid surface and the solubility of this gas in the liquid. It should be noted that for atmospheric air under normal conditions the volume number density of molecules of dissolved gas in water can be estimated as ng = L⋅R, where L = 2.7⋅1019 cm−3 is the Loschmidt number, R ∼ 10−2 is the solubility constant [Henry's constant, see, e.g., (Sander, 2015)], i.e., ng ∼ 1017 cm−3 << nl = 3.3⋅1022 cm−3, where nl is the number density of water molecules.
Note that, as shown in (Bunkin et al., 2012; Bunkin et al., 2016; Yurchenko et al., 2016), the volume number density of bubstons grows with an increase in the content of dissolved ions. Thus, when considering the mechanism of nanobubble nucleation, we must take into account the concentration and, possibly, the specific properties of dissolved ions in relation to their hydration ability; here, we are talking about the so-called cosmotropic (structure-making) and chaotropic (structure-breaking) cations and anions, see, for example (Ninham et al., 2011; Duignan et al., 2014a; Duignan et al., 2014b), and references therein. Thus, when studying the nucleation mechanism of nanobubbles, it is necessary to take into account, first, the local interaction of gas molecules with the molecular environment of water, and, second, the interaction of gas molecules with ions, taking into account their chaotropic/cosmotropic properties. In our previous work (Yurchenko et al., 2016) the ion-specific effects in the stabilization of bubstons were theoretically and experimentally studied for univalent and divalent anions and cations. Concluding this section, it is pertinent to note that if we are dealing with an ionic solution, then, as shown in our theoretical work (Bunkin and Shkirin, 2012) the effect of clustering of bubstons is possible: dimers and more intricate complexes with fractal properties can be formed, see our works (Bunkin et al., 2012; Bunkin and Shkirin, 2012) for more details.
The question of nucleation of nanobubbles can be reformulated as follows: how can mesoscopic cavities arise in water far from the boiling point? Since in this work, in particular, the bubston phase in physiological saline solution (0.14 M NaCl) will be studied, we assume that we are dealing with an equilibrium solution of Na+ and Cl− ions, in which gas molecules are dissolved. The process of the formation of bubston nuclei is identical to the process of the nucleation of ionic crystals of NaCl salt in aqueous solutions of Na+ and Cl− ions. The crystallization of NaCl starts with the formation of droplets of ionic condensate, i.e., ionic crystals of NaCl with mesoscopic (nanometer) sizes. Having arisen with some probability, a droplet of ionic condensate can remain quasi-stable only at a sufficiently high concentration of dissolved Na+ and Cl− ions. In supersaturated solutions, further growth of such a droplet results in the formation of macroscopic NaCl crystals. In solutions far from saturation, such droplets cannot remain stable; these droplets eventually decay, which has the character of a “Coulomb explosion.” This leads to the formation of mesoscopic cavities with radius ro. Below, the mechanism of the formation of a mesoscopic droplet of ionic condensate will be considered at a qualitative level.
First of all, it is necessary to answer the question of where the growth of ionic droplets starts from. We assume that there are no stable inhomogeneities in the solution (for example, in the form of foreign solid particles) and, therefore, the only “defects” in the structure of an aqueous ionic solution are neutral gas particles. Ionic droplets begin to grow on such defects as a result of the diffusion of dissolved ions onto the droplet surface. The first stage is the formation of “gas particle + ion” complexes (which we will further call “ionic dimers”), arising from the adhesion of ions to neutral gas particles. The energy of the affinity of ions and dissolved gas molecules is electrostatic and is given by the formula
Direct calculation of the Coulomb interaction of one ion of a droplet with other ions shows that the smallest number of condensed ions of both signs, at which the maximum mechanical stability is achieved, is 27. In this case, 14 ions of the same sign occupy 6 vacancies of the first coordination sphere (its radius is equal to a), and 8 vacancies of the third sphere (radius is
A simple estimate based on the Gauss electrostatic theorem shows that for these ions the binding energy
Apparently, a necessary condition for the mesoscopic void formation is that the lifetime
It is of interest to estimate the time
The characteristic time of the formation of an ion droplet due to diffusion of the surrounding ions onto the ionic dimer is
We will assume
At the same time, to stabilize a bubston, adsorption of ions on its inner surface is necessary, see (Bunkin and Bunkin, 1992; Bunkin et al., 2012; Bunkin and Bunkin, 2016; Bunkin et al., 2016; Yurchenko et al., 2016). As shown in (Yurchenko et al., 2016), it is the chaotropic anions that are adsorbed on the inner surface; in NaCl solution, bubston is stabilized due to the adsorption of Cl− anions, whereas its nucleation, as shown above, is due ionic dimers (N2 + Na+). Note that, according to the results of (Kelsall et al., 1996), in pure (free of external ionic impurities) water, the “liquid - gas” intersurface acquires a charge due to the adsorption of ОН− ions; in this case the stabilization of bubstons is due to the adsorption of these anions.
The mesoscopic cavities (mesocavities) described above will be called viable bubston nuclei. Thus, the rate of specific (per unit volume) generation of bubstons with volume number density nb is defined by the obvious formula
where ni is the density of dissolved ions, Di is their diffusion coefficient, Δφ is the minimum increment in the thermodynamic potential of a solution that is realized during the formation of a single mesocavity. The coefficient deff, which has the dimension of length, reflects the effective dependence of the rate δnb/δt on the radii of ions and gas-hydrate inhomogeneities Λ (molecular complexes consisting of gas molecules and water molecules, see below). It is the scale deff that should be considered as the effective size of the inhomogeneities. The calculation shows that for water at pressures up to 103 atm. The increment Δφ is about 1 eV. After their emergence, the nuclei (mesocavities) grow and eventually become stable. The stability state corresponds to bubstons with a radius of R ≈ 100–200 nm. The formation of bubstons occurs in the process of diffusion on their surface of ions capable of adsorption and filling the expanding cavity with a dissolved gas. When the specific resistance of water is 10 MΩ⋅cm, the ions have a volume number density ni ≈ 3⋅1014 cm−3. It is obvious that the density nb of bubstons increases with increasing the volume number density of dissolved gas molecules
It is clear that formula (2) does not take into account the interaction between a gas molecule and the water dipoles surrounding this molecule. As is known, gas molecules can have a dipole moment (for example, NO and CO) or, in the absence of their own dipole moment, can be polarized in the dipole environment of water molecules. Thus, the interaction of a gas molecule with surrounding water molecules can be considered in the approximation of a dipole-dipole interaction. Thus, a potential well for the dissolved gas molecule is formed. Obviously, the depth of this well is expressed as
where (р1р2) is the scalar product of the effective dipole moment р1, formed by the water molecules surrounding the gas particle, and the dipole moment р2 = βЕ of the gas molecule, where β is the electronic polarizability of the gas molecule, Λ is the distance between the centers of the dipoles р1 and р2. A gas molecule surrounded by water dipoles is affected by a fluctuating electric field E; these fluctuations are obviously associated with the vibrational-librational dynamics of water molecules. It is obvious that the effective angle between the dipole moments р1 and р2 also fluctuates, i.e., the value of U0 also changes, and if at a certain moment of time the condition U0 < kT is met, and then the gas molecule is no longer captured by this potential well. This, incidentally, explains the fact that for most gases, the solubility in water decreases with increasing temperature. For water and nitrogen molecules, we have
Obviously, if the rate δnb/δt of bubston generation depends not only on the content of the dissolved gas and the concentration of ions, but also on the specific interaction between a gas molecule and a dipole environment (water molecules), then formula (2) should be refined. The aim of this work is to experimentally verify the mechanism of bubston nucleation depending on the pressure and the type of dissolved gas (i.e., in fact, on the polarizability/dipole moment of gas particles) for pure (deionized) water and a saline solution (aqueous NaCl solution, the ion concentration C = 0.14 M). Here, we study the effect of pressure on the generation of bubstons in a wide range: from 17 Torr (saturated vapor pressure of water at room temperature) to 5 Atm.
As shown in (Bunkin and Bunkin, 1993), bubstons serve as centers of optical (induced by laser radiation) breakdown in water. Optical breakdown [see, e.g., a comprehensive review (Vanraes and Bogaerts, 2018)] is the appearance of a plasma spark at the focus of a laser beam, the threshold of which (in terms of radiation intensity) is two to three orders of magnitude lower than the value corresponding to laser-induced multiphoton ionization of water molecules. Breakdown occurs as a result of the development of an electron avalanche inside individual bubstons, which occur in the lens caustic during a laser pulse, and manifests itself in the formation of local plasma flashes, see Figure 1.
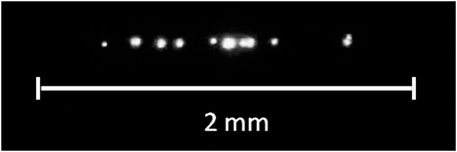
FIGURE 1. Pattern of optical breakdown in water irradiated with a laser pulse at a wavelength of λ = 1,064 nm, the pulse duration is 15 ns.
It should be noted that the optical breakdown is sporadic; at fixed parameters of the laser pulse, breakdown occurs only with a certain probability W. This unambiguously indicates that the breakdown is initiated by some objects that accidentally fall into the focal region with a volume V determined by the focusing conditions. The probability of finding a bubston inside such a volume is determined by the average volume number density of bubstons nb and the volume V. According to the Poisson distribution, we have
The experimentally measured breakdown probability is determined by the formula Wexp= N1/No, where N1 is the number of breakdown flashes for a total fixed number No of laser shots. For nbV << 1 we have
and thus the experimentally measured probability (N1/No) allows us to find with a certain accuracy the volume number density of bubstons
The radiation of a single-mode repetitively pulsed Nd3+:YAG laser (wavelength λ = 1064 nm, pulse duration 15 ns at half-height of the pulse, pulse repetition rate 2 Hz) was directed using a telescope and a lens system into a cell with a liquid sample, where an optical breakdown was excited. The pulse energy was varied in the range of 0.5–1 mJ. Breakdown occurred at a depth of 5 mm with respect to the liquid surface. The radiation intensity in the waist was 4.7⋅109–9.4⋅109 W/cm2; this significantly exceeds the theoretical value of the breakdown threshold inside bubstons at this wavelength, see the corresponding estimates in (Bunkin and Bunkin, 1993). In our case, the focusing of radiation was rather tight: the caustic length was LF = 1.7 mm, the beam radius in the waist was Ro = 15 μm, i.e., we have for the beam cross section in the waist So = 7.1·10−6 cm2.
Since the radiation at this wavelength belongs to the near-IR range, and the spectrum of the plasma flash belongs to the visible and near UV ranges, laser radiation did not obscure the visual observation of the breakdown. Breakdown flashes (their number was equal to N1) were recorded using a photoelectron cathode with subsequent computer processing. The breakdown volume (volume of the focal region V) represents two cones, directed towards each other with a base area So and a height of 0.5LF, i.e., V ≈ 0.4⋅10−6cm3. The equilibrium density of bubstons in deionized water is nb∼ 105–106 cm−3 [see the estimate in (Bunkin et al., 2016) and also Figure 5 below], so we can assume the relation nbV << 1 is satisfied. Substitution into Eq. 5 gives that at least one bubston falls into the volume V with the probability Wexp ≤ 0.4, i.e., breakdown will be sporadic. Below we also present the results of the measurements of the volume number density of bubstons using dynamic light scattering (DLS); however, at nb < 106 cm−3 the DLS technique is no longer effective.
We measured the breakdown probability with decreasing dissolved gas content. The experiments were carried out as follows. A cylindrical cell with a volume of 150 ml and a radius of 40 mm, sealed with a Teflon vacuum valve, was half filled with water produced by a Milli-Q setup (resistivity 7 MΩ⋅cm, pH = 5.5) and saturated with atmospheric air; the volume free from water we will term “free volume.” Next, the liquid sample was subjected to a degassing procedure, which took place in several stages; each stage is numbered N = 1, 2, etc. At the first stage, the free volume of the cell, filled with air at a pressure of p = 1 atm, was connected to an oil-free foreline pump for 1 min, and a pressure of P = 10−3 Torr was created in the free volume. Then the cell was disconnected from the foreline pump and sealed. After that, the liquid was settled for a day; during this time, the free volume was filled with equilibrium water vapor and dissolved gas molecules that left the liquid. At the end of the day, the pressure P in the free volume and the probability of breakdown Wexp were measured again. The measurement of these values means the end of the first stage (N = 1). The second and subsequent stages (N = 2, 3, … ) corresponded to the described protocol: pumping out the free volume for 1 min, followed by sealing and daily settling. At the end of each stage, the pressure P and the value of Wexp were measured. This degassing procedure allowed us to neglect the decrease in the amount of liquid in the cell, since the foreline pump was switched on for a short time.
In addition, the volume number density of bubstons nb was measured at pressures P = 1, 3, and 5 atm, created by various gases. For these measurements, the dynamic light scattering (DLS) technique, traditional for such experiments, was used; see, for example, (Chu, 1974; Berne and Pecora, 1990). Visualization of individual nanobubbles was carried out using a laser phase microscope (LPM), see our works (Bunkin et al., 2012; Bunkin et al., 2016; Yurchenko et al., 2016). These setups are detailed below.
The DLS principle is based on measuring the time-dependent autocorrelation function (ACF) of the intensity of light I scattered at a certain angle θ in a liquid sample:
where
For monodisperse particles performing Brownian motion in a liquid, the inverse decay time of the function
Here, D is the diffusion coefficient of particles in a liquid medium, q is the scattering wave vector (corresponding to the Fourier component of spatial fluctuations of the particle position), which is determined from the Bragg relation:
where n0 is the refractive index of the liquid. Spherical particles with dynamic viscosity
In the case of nanobubbles we have
where T is the absolute temperature, k is the Boltzmann constant. Expansion
The LPM method allows one to determine the phase shift profiles δ between the reference and object waves, which give an interference pattern on the pixels of the receiving matrix after the object wave passes through a particle in a liquid sample. The quantity δ is measured in units of λ/2, where λ is the wavelength. If the object wave passes through a spherical particle with diameter d, transparent to radiation, then the average value of the optical path difference Δh, measured at the maximum of the interference pattern, is determined by the formula
where α is a hardware coefficient, which depends on the particle size. In the approximation of geometric optics, we have
The results of measurements of pressure P and the breakdown probability Wexp are shown in Figures 2A,B as a function of the degassing number N. Each experimental point Wexp corresponds to the averaging over 10 repetitive series, for which the standard deviations were calculated. The number of shots in each series was N0 = 100. In this experiment, the number of plasma flashes N1 was measured, and then the value Wexp = N1/No was found. The pressure P in Figure 2A is the pressure of dissolved gas, which was measured with a manometer; no averaging was performed for pressure measurements. As follows from the graph in Figure 2A, with an increase in N, the residual gas pressure P decreases, and at N = 3, 4 it reaches a stationary level corresponding to the saturated vapor pressure at room temperature Psat = 17.5 Torr. The fact that the stationary level of residual pressure P = Psat was reached 75–100 h after the start of the degassing procedure is consistent with the estimate of the diffusion time τd of dissolved nitrogen from the volume of water with a depth of h ≈ 20 mm: τd ∼ h2/Dg ≈ 85 h (Dg ≈ 1.3⋅10−5cm2/sec is the diffusivity of nitrogen in water at room temperature).
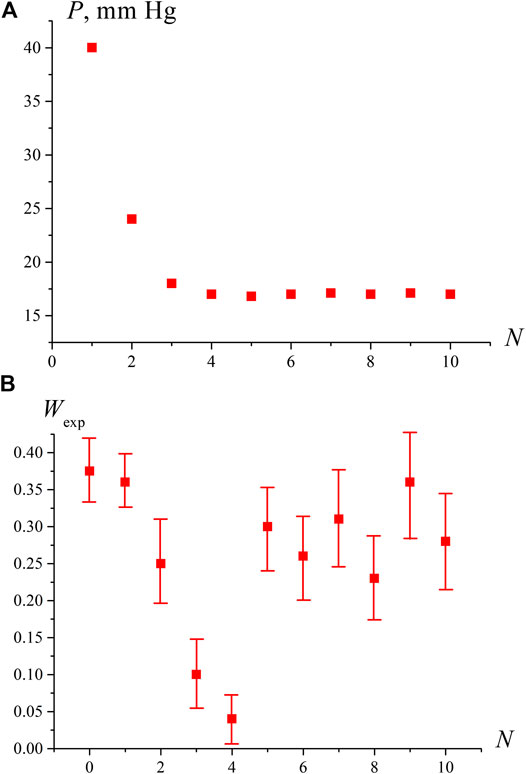
FIGURE 2. Dependence of pressure P in the free volume of the cell [panel (A)] and the probability of optical breakdown Wexp [panel (B)] depending on the degassing number N. It can be seen that when the pressure P in the free volume reaches the saturated vapor pressure (N ≥ 4), the probability of breakdown increases sharply.
Establishing a stationary pressure level P = Psat does not mean that the water is completely free of gas molecules. In such water, with some probability, hydrates of the dissolved gas with an abnormally long lifetime can persist. This assumption is confirmed by the results of measuring the values of P and Wexp presented in Figure2B; the first point on this graph corresponds to water that has not been degassed (N = 0). It can be seen from this figure that with an increase in N, the probability Wexp first decreases along with a decrease in pressure P, but at N = 4, when P becomes close to Psat, the probability Wexp sharply increases and remains high with a further growth of N. This is due to the fact that at P = Psat the liquid is at the boiling point, and vapor bubbles are formed on the remaining bubston nuclei (which in this case will be the centers of optical breakdown), i.e., the volume number density of optical breakdown centers rises significantly. Since radiation at a wavelength λ = 1,064 nm is weakly absorbed in water (the absorption coefficient is approximately equal to 0.16 cm−1, see, for example, http://www1.lsbu.ac.uk/water/water_vibrational_spectrum.html), we always deal with local heating, and at the boiling point, the volume number density of the boiling/breakdown centers at the areas of laser shooting should increase.
To test the hypothesis that the sharp increase in Wexp at N ≥ 4 is due to approaching the boiling point, we measured the probability of optical breakdown Wexp as a function of the temperature in an open cell when the liquid is heated via connecting the cell to a water bath. As seen in Figure 3, the breakdown probability increases sharply at T = 97°С, i.e., near the boiling point. Comparing the graphs in Figure 2B and Figure 3, it should be noted that the Wexp data along the ordinate in Figure 2B can be recalculated in accordance with Eq. 6; taking into account V ≈ 0.4⋅10−6 cm3, we can obtain an estimate for the volume number density of bubstons nb. At the same time, in the case of graph in Figure 3, such an estimate will already be incorrect, since at T = 97°С the probability of breakdown Wexp≈ 1, i.e., the condition nbV << 1 is violated.
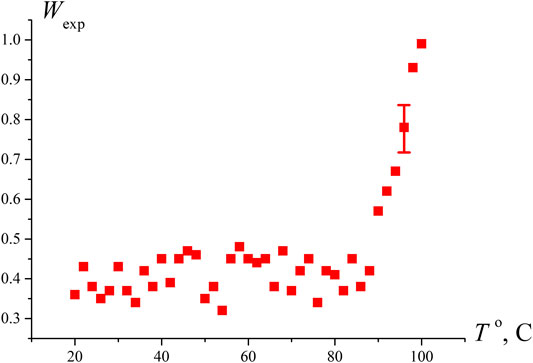
FIGURE 3. Dependence of the probability of optical breakdown Wexp vs. the temperature of water in an open cell. It is seen that the density of the breakdown centers increases substantially near the boiling point.
From the results for the pressure P ≥ Psat it would seem that the volume number density of bubstons nb is proportional to the density
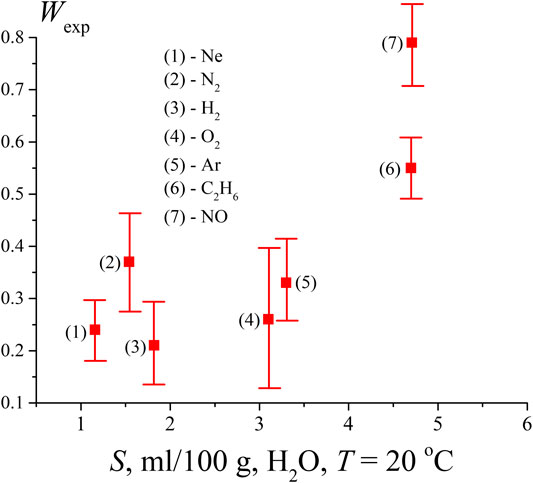
FIGURE 4. Probability Wexp, measured after saturation of the water sample by gases of various solubility (ml/100 g).
It is clear that the density of bubston nuclei should be controlled by the solubility S of a given gas. Since the saturation of the liquid with a dissolved gas occurred at the same initial pressure (1 atm), the effect of different gas solubility should manifest itself in the dependence shown in Figure 4. Additionally, in accordance with our model, the formation of bubston nuclei depends on the efficiency of interaction between a gas molecule and the dipole environment of water molecules, see formula (3); this interaction is controlled by the electronic polarizability of the gas molecules. Table 1 below shows the values of the solubility S of the test gases at an external pressure of 1 atm and room temperature (coordinates of the experimental points along the abscissa axis in Figure 4) and their polarizability (data on polarizability are taken from https://cccbdb.nist.gov/pollistx.asp). Note that NO molecules are not only polarizable, but also have a dipole moment μ = 0.16 D.
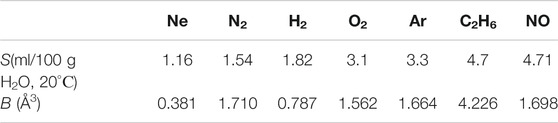
TABLE 1. Solubility and polarizability of gases.
As seen in Figure 4 and Table 1, solubility is not a determining factor for nanobubble formation in a system that is in equilibrium.
As follows from the data in Figure 4, the lowest value of Wexp (i.e., actually, the volume number density of bubstons nb) is observed for hydrogen. At the same time, hydrogen has approximately the same solubility as nitrogen, and exceeds the solubility of neon, while the polarizability of hydrogen is approximately 2 times higher than the polarizability of neon. Thus, approximately the same Wexp values for hydrogen and neon, apparently, cannot be explained within the framework of the model outlined in Theoretical Section, see formula (3). At the same time, formula (3) is applicable if we compare hydrogen and nitrogen: the polarizability of nitrogen is 2.2 times higher than the polarizability of hydrogen with approximately the same solubility. Note that the results of (Hemmingsen, 1975) can also be interpreted in the context of the efficiency of the Coulomb interaction of gas particles and water molecules. Indeed, in (Hemmingsen, 1975), cavitation was practically absent when water was supersaturated with helium, see Figure 2 of this work. At the same time, the polarizability of helium is the lowest among other gases and equals 0.208 Å3, see https://cccbdb.nist.gov/pollistx.asp. Note, however, that surface helium nanobubbles appear under normal conditions on a hydrophobized substrate, see (Van Limbeek and Seddon, 2011).
Furthermore, as follows from Table 1, NO and С2Н6 have the same solubility, while the ethane polarizability is about 2.5 times higher than that of nitrogen monoxide. At the same time, the volume number density nb in the case of ethane is lower than that of NO. We attribute this to the fact that the NO molecule has its own dipole moment, i.e., the Coulomb interaction of this molecule with the environment of H2O molecules is much more efficient. As noted above, we do not present numerical estimates here, since we do not know the effective dipole moment of the water molecules surrounding the NO molecule (Eq. 3). Finally, according to the data in Table 1, Ar and O2 have approximately the same solubility. However, argon has a higher polarizability; in our opinion, this may be due to the higher value of Wexp in the case of argon. In addition, the chemical reactivity of oxygen in water should be taken into account (for example, with the formation of hydrogen peroxide). Therefore, most likely, the comparison of argon and oxygen in the context of using formula (3) is not entirely correct.
Figure 5 shows the results of the measurements of the volume number density of bubstons in deionized water (Milli-Q, resistivity 7 MΩ cm, pH = 5.5) and physiological saline solution prepared with Milli-Q water (0.14 M NaCl) under saturation with various gases. Liquid samples with a volume of 200 ml were saturated with the studied gases at pressures of 1, 3, and 5 atm in sealed vessels for 3 days. Liquid samples were preliminarily degassed by boiling under vacuum for 10 min. In this case, a certain amount of liquid evaporated (the quantity of evaporated liquid was not controlled in this experiment), and measurements of the dissolved gas content after boiling were not carried out. Obviously, to measure nb at external pressures of 3 and 5 atm there was no need to control the gas content of the liquid after degassing. At the same time, the results, obtained with water saturation at 1 atm should not differ significantly from our earlier results of measuring the volume number density of bubstons in water by the DLS method [see (Bunkin et al., 2016), where it was found that nb ∼ 106 cm−3], i.e., the results obtained for different gases saturating a liquid sample at 1 atm can be considered as verification.
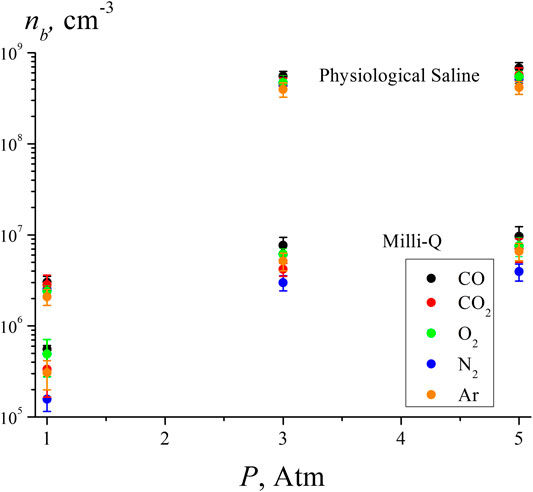
FIGURE 5. Volume number density of bubstons according to the DLS experiment in water and saline solution for various gases at pressures of 1, 3, and 5 atm.
After a sharp depressurization, a 1.2 ml sample was taken from the upper layer of the liquid and transferred to a 4.5 ml polystyrene square cuvette with a volume of 10 × 10 × 45 mm3 (Sarstedt, Germany) for DLS measurements with a Malvern Zetasizer setup. Each measurement was repeated 5 times; the mean values and standard deviations were determined. Unfortunately, we did not have the opportunity (for technical reasons) to measure the rate of release of gas molecules from bubstons into the liquid bulk for all studied gases.
As shown in our works (Bunkin et al., 2012; Bunkin et al., 2016; Yurchenko et al., 2016), the results of DLS experiments should always be verified in LPM experiments. Indeed, the results of the DLS experiment can be interpreted in favor of bubstons provided that the refractive index of the scatterers found in the DLS experiment corresponds to the refractive index of gas particles (see below).
A typical histogram of DLS intensity distribution over the scatterer sizes in a saline solution saturated with carbon dioxide at 3 atm is shown in Figure 6 (a). As can be seen, the solution contains particles with an average size of ∼ 250 nm. A 50 μl sample of the same saline solution placed on a glass slide was measured with LPM. In Figure 6B, we exhibit a 2D phase image(color map) of a sample area (5 × 5 μm2) with a thickness of about 100 μm; particles with a concave phase profile are clearly visible here. In this figure, the XY-plane corresponds to the area of the liquid sample, and the Z-axis is the optical path difference (OPD) between the reference and object waves, measured in nm. Figures 6C,D show 2D distribution of OPD and its 1D profile along the X-axis for an individual particle with a concave profile and a size of ∼ 300 nm, respectively. According to formula (11), see the comment in Laser Phase Microscopy, the refractive index of the displayed particles is lower than that of the surrounding liquid. An estimate of the refractive index of these particles gives n ≈ 1.03, i.e., these particles should be gas nanobubbles formed in the saline after depressurization.
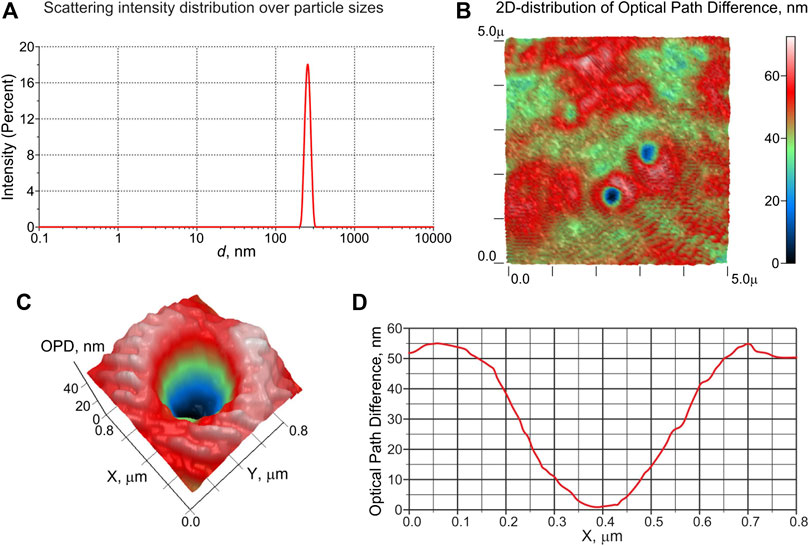
FIGURE 6. Results of the experiments with DLS and LPM for physiological solutions, saturated with CO2 under a pressure of 3 atm. Panel (A): distribution of scattering intensity over scatterer sizes in the DLS experiment. Panel (B): colormap of 2D distribution of the optical path difference (OPD) of a sample area (5 × 5 μm2); objects of 300–400 nm in size, for which the OPD distribution has a concave profile, are clearly visible. Panel (C): 2D distribution of OPD in the vicinity of an object with a concave OPD. Panel (E): 1D profile of OPD across the object shown in panel (C); according to the calibration data, the refractive index of this object is n ≈ 1.03, i.e., it is gas nanobubble.
As can be seen from the histogram of the scattering intensity distribution (Figure 6A and phase profiles (Figure 6D), the average particle size observed in the DLS experiments is in good agreement with the size of gas nanobubbles detected in the experiment with phase microscopy. The slight increase in the size of nanobubbles obtained using LPM technique in comparison with the size measured by the DLS apparatus is due to the Brownian motion of the nanobubbles.
Table 2 shows the data for the solubility and electronic polarizability (the data on the polarizability are taken from https://cccbdb.nist.gov/pollistx.asp) of the gases used in this experiment: CO, СО2, N2, О2, and Ar. Note that the CO molecule is polar: its dipole moment µ = 0.11 D. Our special interest in studying the effects of О2, СО2, and СО in physiological saline was stimulated by the results of our previous work (Bunkin et al., 2011), where we have observed the effect of bubston formation on the surface of erythrocytes, suspended in saline solution and containing these gases.
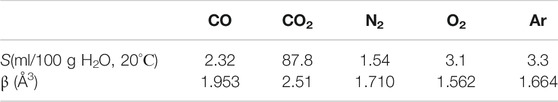
TABLE 2. Solubility and polarizability of gases.
As shown in Table 2, the highest gas content and the highest polarizability are realized for СО2. At the same time, the highest number density of bubstons nb in all liquids and all test pressures is observed for CO. We attribute this to the dipolar structure of CO molecule; note that in the experiment with optical breakdown, the highest bubston density was also observed for the polar gas NO, see Figure 4 Approximately the same density of bubstons is observed for Ar and CO2, but for O2 the density of bubstons is higher than for Ar and CO2 (note that in the experiment with optical breakdown, the probability of breakdown for O2 was slightly less than for Ar). In physiological solution, this tendency persists, but there the density of bubstons for all gases is 1 - 2 orders of magnitude higher than in pure water. As follows from our previous works [see (Bunkin et al., 2012; Bunkin et al., 2016; Yurchenko et al., 2016)], this effect is due to the presence of an external ionic impurity. The fact that according to Figure 5, the bubston density for O2 in pure water is higher than for all other gases (except for CO) does not agree with our model [Theoretical Section, formula (3)]. Indeed, O2 has the lowest polarizability among the gases studied in this experiment. In addition, the model based on formula (3) is not applicable in the case of CO2: this gas has the highest solubility and the highest polarizability, but the value of nb in pure water for this gas is less than nb for O2. Apparently, for these gases, chemical reactions in water must be taken into account: in the case of dissolved oxygen, hydrogen peroxide is formed, and in the case of carbon dioxide, carbonic acid. Thus, the model described in Theoretical Section, apparently, needs to be refined taking into account possible chemical reactions of gas molecules and water.
The lowest density of bubstons is observed for N2; this gas has the lowest solubility among the gases studied in this experiment. We recall that in the experiment with optical breakdown at 1 atm the probabilities of breakdown for N2and Ar were approximately the same, but in the DLS experiment, the number density of bubstons in the case of N2 is lower than in the case of Ar. At the same time, it is quite surprising that the data on Ar and N2 in (Hemmingsen, 1975) devoted to the induction of cavitation in supersaturated gas solutions are very similar. Summarizing this section, we can claim that the data obtained in (Hemmingsen, 1975) are in qualitative agreement with the results presented here. However, it is no point in expecting a complete correlation between the results obtained in our work and those in papers (Hemmingsen, 1975; Rubin and Noyes, 1987; Chen et al., 2014; Chen et al., 2015; Ren et al., 2017; Ren et al., 2020), since in these works, the nucleation of nanobubbles from supersaturated solutions occurs in the absence of nucleation centers, while in our case the bubstons are always present.
It is shown in this work that, in the pressure range of 1–5 atm, the rate of specific (per unit volume) generation of bubstons δnb/δt is determined not only by the volume number densities of dissolved gas molecules
The original contributions presented in the study are included in the article/Supplementary Material, further inquiries can be directed to the corresponding author.
NB, AS, NP, and AI were involved in conceptualization, investigation, original draft writing, project management. SG, MG, and PI were involved in investigation.
This work was supported by a grant of the Ministry of Science and Higher Education of the Russian Federation for large scientific projects in priority areas of scientific and technological development (grant number 075-15-2020-774).
The authors declare that the research was conducted in the absence of any commercial or financial relationships that could be construed as a potential conflict of interest.
Agarwal, A., Ng, W. J., and Liu, Y. (2011). Principle and applications of microbubble and nanobubble technology for water treatment. Chemosphere 84, 1175–1180. doi:10.1016/j.chemosphere.2011.05.054
Alheshibri, M., Qian, J., Jehannin, M., and Craig, V. S. J. (2016). A history of nanobubbles. Langmuir 32, 11086–11100. doi:10.1021/acs.langmuir.6b02489
Azevedo, A., Etchepare, R., Calgaroto, S., and Rubio, J. (2016). Aqueous dispersions of nanobubbles: generation, properties and features. Miner. Eng. 94, 29–37. doi:10.1016/j.mineng.2016.05.001
Bunkin, N. F., and Bunkin, F. V. (1992). Bubbstons: stable microscopic gas bubbles in very dilute electrolytic solutions. Sov. Phys. JETP 74, 271–276.
Bunkin, N. F., and Bunkin, F. V. (1993). The new concepts in the optical breakdown of transparent liquids. Las. Phys. 3, 63–78.
Bunkin, N. F., and Bunkin, F. V. (2016). Bubston structure of water and electrolyte aqueous solutions. Phys. Usp. 59, 846–865. doi:10.3367/UFNr.2016.05.03779610.3367/ufne.2016.05.037796
Bunkin, N. F., Ninham, B. W., Ignatiev, P. S., Kozlov, V. A., Shkirin, A. V., and Starosvetskij, A. V. (2011). Long-living nanobubbles of dissolved gas in aqueous solutions of salts and erythrocyte suspensions. J. Biophotonics 4 (3), 150–164. doi:10.1002/jbio.201000093
Bunkin, N. F., and Shkirin, A. V. (2012). Nanobubble clusters of dissolved gas in aqueous solutions of electrolyte. II. Theoretical interpretation. J. Chem. Phys. 137, 054707. doi:10.1063/1.4739530
Bunkin, N. F., Shkirin, A. V., Ignatiev, P. S., Chaikov, L. L., Burkhanov, I. S., and Starosvetskij, A. V. (2012). Nanobubble clusters of dissolved gas in aqueous solutions of electrolyte. I. Experimental proof. J. Chem. Phys. 137, 054706. doi:10.1063/1.4739528
Bunkin, N. F., Shkirin, A. V., Suyazov, N. V., Babenko, V. A., Penkov, N. V., Belosludtsev, K. N., et al. (2016). Formation and dynamics of ion-stabilized gas nanobubbles in the bulk of aqueous NaCl solutions. J. Phys. Chem. B 120, 1291–1303. doi:10.1021/acs.jpcb.5b11103
Chen, Q., Luo, L., Faraji, H., Feldberg, S. W., and White, H. S. (2014). Electrochemical measurements of single H2 nanobubble nucleation and stability at Pt nanoelectrodes. J. Phys. Chem. Lett. 5, 3539–3544. doi:10.1021/jz501898r
Chen, Q., Wiedenroth, H. S., German, S. R., and White, H. S. (2015). Electrochemical nucleation of stable N2 nanobubbles at Pt nanoelectrodes. J. Am. Chem. Soc. 137, 12064–12069. doi:10.1021/jacs.5b07147
Cho, S. H., Kim, J. Y., Chun, J. H., and Kim, J. D. (2005). Ultrasonic formation of nanobubbles and their zetapotentials in aqueous electrolyte and surfactant solutions. Colloids Surf. A Physicochem. Eng. Asp. 269, 28–34. doi:10.1016/j.colsurfa.2005.06.063
Duignan, T., Parsons, D. F., and Ninham, B. W. (2014a). Collin’s rules, Hofmeister effects and ionic dispersion interactions. Chem. Phys. Lett. 608, 55–59. doi:10.1016/j.cplett.2014.05.056
Duignan, T., Parsons, D. F., and Ninham, B. W. (2014b). A continuum solvent model of ion-ion interactions in water. Phys. Chem. Chem. Phys. 16, 22014–22027. doi:10.1039/C4CP02822H
Epstein, P. S., and Plesset, M. S. (1950). On the stability of gas bubbles in liquid-gas solutions. J. Chem. Phys. 18, 1505. doi:10.1116/1.128992510.1063/1.1747520
Fox, F. E., and Herzfeld, K. F. (1954). Gas bubbles with organic skin as cavitation nuclei. JASA 26, 984. doi:10.1121/1.1907466
Häbich, A., Ducker, W., Dunstan, D. E., and Zhang, X. (2010). Do stable nanobubbles exist in mixtures of organic solvents and water? J. Phys. Chem. B 114, 6962–6967. doi:10.1021/jp911868j
Hemmingsen, E. A. (1975). Cavitation in gas-supersaturated solutions. J. Appl. Phys. 46, 213–218. doi:10.1063/1.321323
Huang, T. W., Liu, S. Y., Chuang, Y. J., Hsieh, H. Y., Wu, W. J., Tsai, C. Y., et al. (2013). Dynamics of hydrogen nanobubbles in KLH protein solution studied with in situ wet-TEM. Soft Matter 9, 8856–8861. doi:10.1039/C3SM50906K
Jin, F., Ye, J., Hong, L., Lam, H., and Wu, C. (2007). Slow relaxation mode in mixtures of water and organic molecules: supramolecular structures or nanobubbles? J. Phys. Chem. B 111, 2255–2261. doi:10.1021/jp068665w
Jin, J., Feng, Z., Yang, F., and Gu, N. (2019). Bulk nanobubbles fabricated by repeated compression of microbubbles. Langmuir 35, 4238–4245. doi:10.1021/acs.langmuir.8b04314
Kelsall, G. H., Tang, S., Yurdakul, S., and Smith, A. (1996). Electrophoretic behaviour of bubbles in aqueous electrolytes. J. Chem. Soc. Faraday Trans. 92, 3887–3893. doi:10.1039/FT9969203887
Kononov, L. O. (2015). Chemical reactivity and solution structure: on the way to a paradigm shift? RSC Adv. 5, 46718–46734. doi:10.1039/C4RA17257D
Köse, G., Darguzyte, M., and Kiessling, F. (2020). Molecular ultrasound imaging. Nanomaterials 10, 1935. doi:10.3390/nano10101935
Landau, L. D., and Lifshitz, E. M. (Editors) (1987). “Course of theoretical physics,” in Fluid mechanics. 2nd Edn (Oxford, United Kingdom: Pergamon), Vol. 5, 100.
Li, C., Zhang, A. M., Wang, S., and Cui, P. (2018). Formation and coalescence of nanobubbles under controlled gas concentration and species. AIP Adv. 8, 015104. doi:10.1063/1.5013244
Millare, J. C., and Basilia, B. A. (2018). Nanobubbles from ethanol–water mixtures: generation and solute effects via solvent replacement method. ChemistrySelect 3, 9268–9275. doi:10.1002/slct.201801504
Ninham, B. W., Duignan, T., and Parsons, D. F. (2011). Approaches to hydration, old and new: insights through Hofmeister effects. Cur. Op. Col. Int. Sci. 16, 612–617. doi:10.1016/j.cocis.2011.04.006
Nirmalkar, N., Pacek, A. W., and Barigou, M. (2018). On the existence and stability of bulk nanobubbles. Langmuir 34, 10964–10973. doi:10.1021/acs.langmuir.8b01163
Nirmalkar, N., Pacek, A. W., and Barigou, M. (2019). Bulk nanobubbles from acoustically cavitated aqueous organic solvent mixtures. Langmuir 35, 2188–2195. doi:10.1021/acs.langmuir.8b03113
Oh, S. H., and Kim, J. M. (2017). Generation and stability of bulk nanobubbles. Langmuir 33, 3818–3823. doi:10.1021/acs.langmuir.7b00510
Ohgaki, K., Khanh, N. Q., Joden, Y., Tsuji, A., and Nakagawa, T. (2010). Physicochemical approach to nanobubble solutions. Chem. Eng. Sci. 65, 1296–1300. doi:10.1016/j.ces.2009.10.003
Ren, H., German, S. R., Edwards, M. A., Chen, Q., and White, H. S. (2017). Electrochemical generation of individual O2 nanobubbles via H2O2 oxidation. J. Phys. Chem. Lett. 8, 2450–2454. doi:10.1021/acs.jpclett.7b00882
Ren, H., Edwards, M. A., Wang, Y., and White, H. S. (2020). Electrochemically controlled nucleation of single CO2 nanobubbles via formate oxidation at Pt nanoelectrodes. J. Phys. Chem. Lett. 11, 1291–1296. doi:10.1021/acs.jpclett.9b03898
Rubin, M. B., and Noyes, R. M. (1987). Measurements of critical supersaturation for homogeneous nucleation of bubbles. J. Phys. Chem. 91, 4193–4198. doi:10.1021/j100299a048
Sander, R. (2015). Compilation of Henry's law constants (version 4.0) for water as solvent. Atmos. Chem. Phys. 15, 4399–4981. doi:10.5194/acp-15-4399-2015
Seddon, J. R. T., Lohse, D., Ducker, W. A., and Craig, V. S. J. (2012). A deliberation on nanobubbles at surfaces and in bulk. ChemPhysChem. 13, 2179–2187. doi:10.1002/cphc.201100900
Sedlák, M., and Rak, D. (2013). Large-scale inhomogeneities in solutions of low molar mass compounds and mixtures of liquids: supramolecular structures or nanobubbles? J. Phys. Chem. B 117, 2495–2504. doi:10.1021/jp4002093
Sedlák, M., and Rak, D. (2014). On the origin of mesoscale structures in aqueous solutions of tertiary butyl alcohol: the mystery resolved. J. Phys. Chem. B 118, 2726–2737. doi:10.1021/jp500953m
Strasberg, M. (1959). Onset of ultrasonic cavitation in tap water. JASA 31, 163. doi:10.1121/1.1907688
Thorpe, S. A., Stubbs, A. R., Hall, A. J., and Turner, R. J. (1982). Wave-produced bubbles observed by side-scan sonar. Nature 296, 636–638. doi:10.1038/296636a0
Tsuge, H. (2015). Micro- and nanobubbles. Fundamentals and applications. Boca Raton, FL: Pan Stanford Publishing, 121–157.
Uchida, T., Oshita, S., Ohmori, M., Tsuno, T., Soejima, K., Shinozaki, S., et al. (2011). Transmission electron microscopic observations of nanobubbles and their capture of impurities in wastewater. Nanoscale Res. Lett. 6, 295. doi:10.1186/1556-276X-6-295
Ushikubo, F. Y., Furukawa, T., Nakagawa, R., Enari, M., Makino, Y., Kawagoe, Y., et al. (2010). Evidence of the existence and the stability of nano-bubbles in water. Col. Surf. A: Physicochem. Eng. Asp. 361, 31–37. doi:10.1016/j.colsurfa.2010.03.005
Van Limbeek, M. A. J., and Seddon, J. R. T. (2011). Surface nanobubbles as a function of gas type. Langmuir 27, 8694–8699. doi:10.1021/la2005387
Vanraes, P., and Bogaerts, A. (2018). Plasma physics of liquids—a focused review. Appl. Phys. Rev. 5, 031103. doi:10.1063/1.5020511
Wang, Q., Zhao, H., Qi, N., Qin, Y., Zhang, X., and Li, Y. (2019). Generation and stability of size-adjustable bulk nanobubbles based on periodic pressure change. Sci. Rep. 9, 1118. doi:10.1038/s41598-018-38066-5
Weijs, J. H., Seddon, J. R. T., and Lohse, D. (2012). Diffusive shielding stabilizes bulk nanobubble clusters. ChemPhysChem. 13, 2197–2204. doi:10.1002/cphc.201100807
Wu, C., Nesset, K., Masliyah, J., and Xu, Z. (2012). Generation and characterization of submicron size bubbles. Adv. Colloid Interface Sci. 179–182, 123–132. doi:10.1016/j.cis.2012.06.012
Yasui, K., Tuziuti, T., and Kanematsu, W. (2018). Mysteries of bulk nanobubbles (ultrafine bubbles); stability and radical formation. Ultrason. Sonochem. 48 259–266. doi:10.1016/j.ultsonch.2018.05.038
Yurchenko, S. O., Shkirin, A. V., Ninham, B. W., Sychev, A. A., Babenko, V. A., Penkov, N. V., et al. (2016). Ion-specific and thermal effects in the stabilization of the gas nanobubble phase in bulk aqueous electrolyte solutions. Langmuir 32, 11245–11255. doi:10.1021/acs.langmuir.6b01644
Zhang, M., Tu, Y., and Fang, H. (2013). Concentration of nitrogen molecules needed by nitrogen nanobubbles existing in bulk water. Appl. Math. Mech. 34, 1433–1438. doi:10.1007/s10483-013-1757-x
Keywords: gas nanobubbles, bubstons, optical breakdown, dynamic light scattering, laser phase microscopy, stabilization of nanobubbles
Citation: Bunkin NF, Shkirin AV, Penkov NV, Goltayev MV, Ignatiev PS, Gudkov SV and Izmailov AY (2021) Effect of Gas Type and Its Pressure on Nanobubble Generation. Front. Chem. 9:630074. doi: 10.3389/fchem.2021.630074
Received: 16 November 2020; Accepted: 13 January 2021;
Published: 25 March 2021.
Edited by:
Sugata Chowdhury, National Institute of Standards and Technology (NIST), Gaithersburg, MD, United StatesCopyright © 2021 Bunkin, Shkirin, Penkov, Goltayev, Ignatiev, Gudkov and Izmailov. This is an open-access article distributed under the terms of the Creative Commons Attribution License (CC BY). The use, distribution or reproduction in other forums is permitted, provided the original author(s) and the copyright owner(s) are credited and that the original publication in this journal is cited, in accordance with accepted academic practice. No use, distribution or reproduction is permitted which does not comply with these terms.
*Correspondence: Nikolai F. Bunkin, bmJ1bmtpbkBtYWlsLnJ1
Disclaimer: All claims expressed in this article are solely those of the authors and do not necessarily represent those of their affiliated organizations, or those of the publisher, the editors and the reviewers. Any product that may be evaluated in this article or claim that may be made by its manufacturer is not guaranteed or endorsed by the publisher.
Research integrity at Frontiers
Learn more about the work of our research integrity team to safeguard the quality of each article we publish.