 Vishwas Goel
 Dalton Cox
 Scott A. Barnett2

95% of researchers rate our articles as excellent or good
Learn more about the work of our research integrity team to safeguard the quality of each article we publish.
Find out more
ORIGINAL RESEARCH article
Front. Chem. , 27 May 2021
Sec. Electrochemistry
Volume 9 - 2021 | https://doi.org/10.3389/fchem.2021.627699
This article is part of the Research Topic High Temperature Solid Oxide Cells View all 8 articles
Electrochemical impedance spectroscopy (EIS) is a powerful technique for material characterization and diagnosis of the solid oxide fuel cells (SOFC) as it enables separation of different phenomena such as bulk diffusion and surface reaction that occur simultaneously in the SOFC. In this work, we simulate the electrochemical impedance in an experimentally determined, three-dimensional (3D) microstructure of a mixed ion-electron conducting (MIEC) SOFC cathode. We determine the impedance response by solving the mass conservation equation in the cathode under the conditions of an AC load across the cathode’s thickness and surface reaction at the pore/solid interface. Our simulation results reveal a need for modifying the Adler-Lane-Steele model, which is widely used for fitting the impedance behavior of a MIEC cathode, to account for the difference in the oscillation amplitudes of the oxygen vacancy concentration at the pore/solid interface and within the solid bulk. Moreover, our results demonstrate that the effective tortuosity is dependent on the frequency of the applied AC load as well as the material properties, and thus the prevalent practice of treating tortuosity as a constant for a given cathode should be revised. Finally, we propose a method of determining the aforementioned dependence of tortuosity on material properties and frequency by using the EIS data.
With rising CO2 levels in the atmosphere, low emission energy technologies for energy conversion and storage are needed to mitigate further increases in the global temperature. Such technologies in active research and development include, Li-ion batteries (Nitta et al., 2015), supercapacitors (Zhang L. et al., 2018), and several types of fuel cells like polymer electrolyte membrane fuel cells (PEMFC) (Wang et al., 2020), solid acid fuel cells (SAFC) (Lim et al., 2020), biofuel cells (BFC) (Shakeel et al., 2019), and solid oxide fuel cells (SOFC) (Mahato et al., 2015). In particular, SOFCs can be used to produce electricity or, when used in reverse (as a solid oxide electrolyzer cell), to produce fuel, depending upon their applied polarization. Specifically, anodically polarized cells act as low-emission fuel-flexible electrochemical engines, and cathodically polarized cells store energy in the form of stable chemical bonds in H2, CO, or CH4 through electrolysis (Chen and Jiang, 2016; Mogensen et al., 2019). However, conventional high temperature SOFCs run at 800–1000°C, which makes their operation and maintenance highly cost-ineffective (Gao et al., 2016). The operating temperature has been reduced by the use of electrocatalytically active mixed ion-electron conducting (MIEC) cathodes such as (La,Sr) (Co,Fe)O3–δ (LSCF) (Hwang et al., 2005; Liu et al., 2013; Niania et al., 2020) and Sr(Ti,Fe)O3–δ (STF) (Yoo and Bouwmeester, 2012; Perry et al., 2015; Nenning et al., 2017), wherein the oxygen evolution reactions (OERs) and oxygen reduction reactions (ORRs) occur over the entire surface. To take advantage of this behavior, SOFC cathodes are designed to have complex and porous microstructures with a large specific surface area; however, such designs result in a high degree of tortuosity for ion transport, which limits the performance of SOFCs. Thus, it is important to accurately determine the tortuosity of a cathode microstructure and optimize it to enable high performance at low operating temperatures.
Several methods have been reported in the literature for determining the tortuosity of a porous electrode. These methods include: a) porosity-tortuosity relations, such as Bruggeman’s relations (Bruggeman, 1935); b) calculations of the tortuous path length either through the distance propagation method (Chen-Wiegart et al., 2014) or the shortest path search method (Çeçen et al., 2012); and c) calculations of tortuosity based on the effective diffusivity (Wilson et al., 2006). Bruggeman’s relations are known to be less suitable for a domain with connected solid phases and complex porous networks (as in a MIEC cathode) (Tjaden et al., 2018). The methods involving the calculations of tortuous path length or the effective diffusivity require the three-dimensional microstructural data as input, which is obtained through tomography (Wilson et al., 2006; Cooper et al., 2016). Unfortunately, availability of the necessary equipment to obtain tomographic data is not ubiquitous, sample preparation is time consuming, and the calculations are computationally expensive. Furthermore, these approaches provide tortuosity values associated with steady-state diffusion, yielding a single value and do not generally describe the tortuosity relevant to oscillating load or when surface reaction is present. Therefore, there is a need for alternate methods for determining tortuosity of a given SOFC electrode. Yu et al. (Yu et al., 2020) reported that tortuosity can be extracted from the diffusional impedance data; in particular, they showed that in systems limited by only bulk diffusion, the diffusional impedance data can be used to characterize a given microstructure in terms of tortuosity and the area of the loading boundary. They also showed that tortuosity is a function of the AC load frequency, which they define as effective tortuosity. Such use of impedance data to characterize the microstructure of a SOFC cathode is valuable to SOFC researchers since they widely use electrochemical impedance spectroscopy (EIS) to test SOFC performance.
In this study, we show that the EIS data of a SOFC MIEC cathode can be used to determine the tortuosity of the solid phase within the cathode. In particular, we consider a statistically representative (Scott Cronin et al., 2012) portion of an experimentally determined complex three-dimensional microstructure of an unbiased SOFC cathode. In the microstructure, we solve for the amplitude of the concentration-response to an applied AC load under the influence of surface reaction and bulk diffusion, and subsequently, use the solution to determine the impedance behavior. We investigate the effect of different material properties (bulk diffusion coefficient and reaction rate constant) on the impedance behavior, and on the effective tortuosity of the microstructure. From our simulations, we find that, due to the presence of surface reaction, the amplitude of oscillations in the oxygen vacancy concentration at the pore/solid interface of the cathode is lower than the amplitude within the bulk of the solid phase. Moreover, the difference between the two concentration amplitudes increases with an increase in the ratio between the reaction rate constant and the bulk diffusion coefficient. Such a difference is not taken into account by the widely used Adler-Lane-Steele (ALS) model, a macrohomogeneous model developed by Adler, Lane and Steele to predict the impedance data of a SOFC MIEC cathode (Adler et al., 1996; Adler, 1998). Thus, we propose a modification to the ALS model to account for the aforementioned difference.
Furthermore, we develop a method of extracting the effective tortuosity from the impedance data. Specifically, we compare the macrohomogeneous (modified ALS) and 1D Finite Length Gerischer relations for the impedance to determine the effective tortuosity. Our calculations for tortuosity determination reveal that the effective tortuosity is a function of the microstructure, frequency of the applied AC load, and the material properties such as the reaction rate constant and bulk diffusion constant. Additionally, the effective tortuosity of a microstructure in the low-frequency regime (where the tortuosity approaches the DC value) decreases with an increase in the ratio between the reaction rate constant and the bulk diffusion coefficient due to a decreased penetration depth of the electrode reactions. This finding suggests that the prevalent practice of using a single tortuosity value for a given electrode for extracting the material properties by employing the ALS model (Adler, 1998; Zhang S.-L. et al., 2018; Zhang S.-L. et al., 2019) should be reviewed and revised. Additionally, the finding suggests that, both the intrinsic material properties and the microstructure should be considered concurrently in designing a cathode with enhanced performance. Our findings open a new array of applications for the EIS technique in characterizing and optimization of the microstructure of a SOFC cathode.
All the previous reports primarily consider artificially generated microstructures (Rüger et al., 2007; Haffelin et al., 2013; Pereira et al., 2014), which are designed to match given macrohomogeneous properties and thus may not be representative of the local microstructural morphologies and topologies. Only a few three-dimensional impedance calculations have been reported with a consideration of experimentally determined microstructures that are statistically representative of the cathode (Kreller et al., 2011; Lynch et al., 2013). The report by Kreller et al. (Kreller et al., 2011) only explicitly considered the three-dimensional microstructure near the electrode/electrolyte interface and assumed a one-dimensional macrohomogeneous domain beyond a certain distance from the interface. On the other hand, the investigation by Lynch et al. (Lynch et al., 2013) focused on the method of calculating impedance in a microstructure where the ORR occurs either through bulk or surface pathways. However, it did not propose the utilization of the calculated impedance data for characterizing the microstructure nor did it consider the difference between the concentration amplitudes at the pore/solid interface and within the bulk of the solid, which are the two focuses of this paper.
MIEC cathodes are known to have much higher electronic conductivity as compared to the ionic conductivity (Jung and Tuller, 2009); thus, we ignore any impedance contribution due to electronic resistance. Moreover, due to the high electronic conductivity, it is reasonable to assume that the electrostatic potential of the solid phase is spatially invariant. Thus, in the absence of any gas phase transport limitation, the cathode impedance can be entirely attributed to the reduction of oxygen at the pore/solid interface and the transport of the resulting oxygen ions through the solid in the cathode, which is shown in Figure 1. The oxygen ions diffuse inside the solid phase of the cathode through a vacancy mechanism. Hence, the ionic current can be calculated from the flux of the oxygen vacancies. The mass transport equation for the oxygen vacancies inside the cathode can be written as
where
where
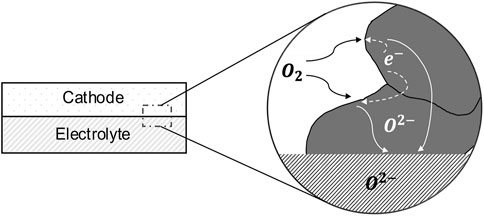
FIGURE 1. A schematic of oxygen transport withing the solid phase (gray region) of a MIEC SOFC cathode; the schematic is based on Kreller, (Kreller, 2011).
We employ the smoothed boundary method (SBM) (Yu et al., 2012) to solve Eq. 1 within an experimentally determined, complex microstructure of the MIEC cathode, along with the boundary condition set in Eq. 2. Using SBM, these equations can be reformulated as
where
The application of an AC load causes the vacancy concentration,
Since
Furthermore,
where
The above pair of equations is then solved to determine the
where
For numerically solving Eqs 8a,b, we chose to make them nondimensional by defining a length scale,
By defining
which are solved for two different sets of boundary conditions (BCs) as listed in Table 1.
The two sets of the BCs differ only in those at the cathode/current collector interface
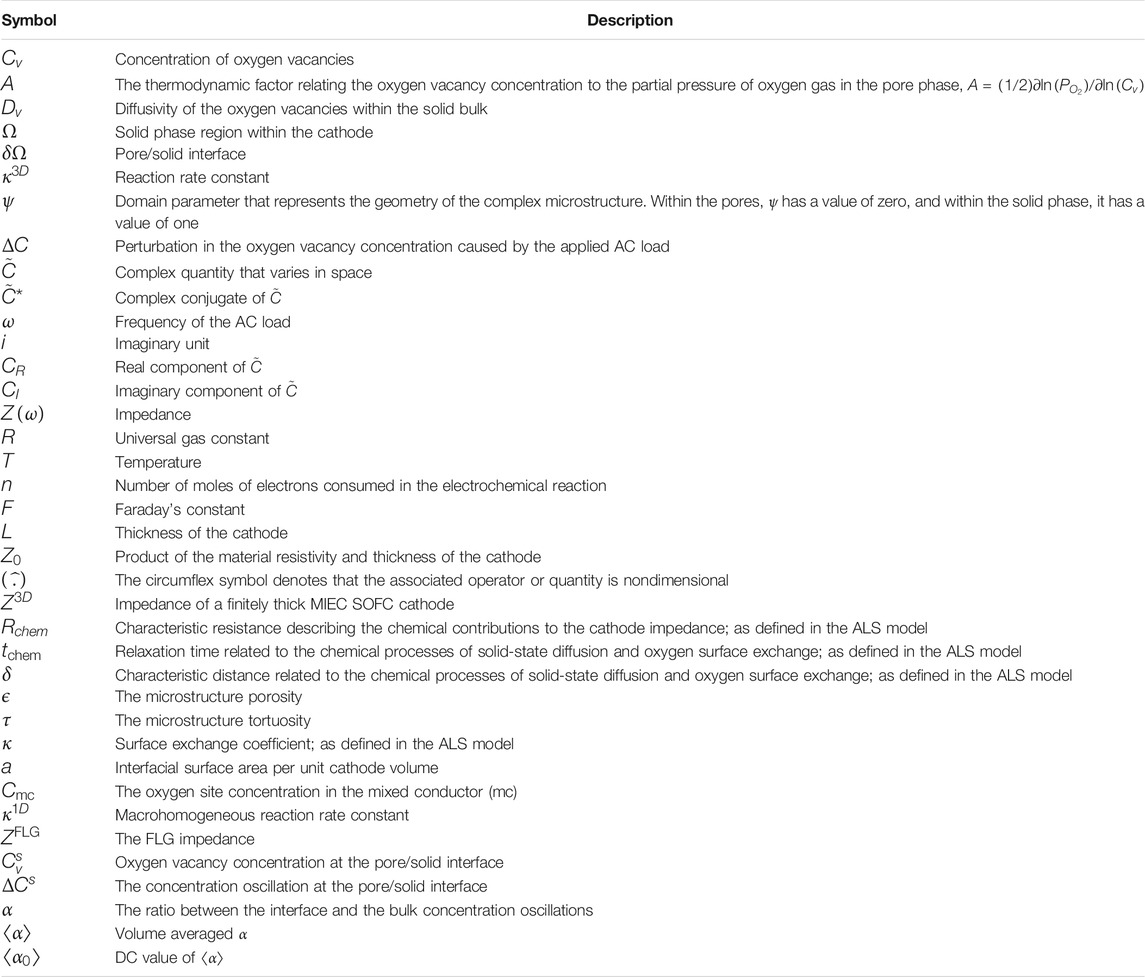
TABLE 2. List and description of the variables and symbols used in the model equations.
The choice of SBM enabled the use of a standard Cartesian grid and the finite difference method to solve the above pair of equations (Eqs 12a,b). We used the center difference scheme to discretize the domain, which consists of 352 × 642 × 594 grid points. A uniform grid spacing (
We chose
Adler, Lane, and Steele proposed a macrohomogeneous model to predict the impedance,
where
It should be noted that in the original ALS expression,
The substitution of Eqs 13b,c,d, and Eq. 14 into Eq. 13a gives
By defining
Finally, by following the same methodology as described in the model equation section, Eq. 16 can be made nondimensional as
where the nondimensional quantities are defined as
The conversion of Eq. 13 into Eq. 17 enables a direct comparison of the impedance expression of a complex 3D microstructure with that of the standard expression for 1D Finite Length Gerischer (FLG) impedance. The 1D FLG element represents the impedance of a 1D MIEC domain where no microstructural effects are present and where the kinetics is co-limited by both surface reaction and bulk diffusion. The FLG impedance,
It is evident from a comparison between Eq. 17 and Eq. 18 that the microstructure affects the impedance response of a SOFC cathode in two ways. First, the microstructure increases the cathode impedance by a factor of
A ratio between Eq. 17 and Eq. 18 gives
By taking the modulus (which is analytically unnecessary but numerically required) and after some rearrangement, Eq. 19 can be written as
where terms containing
The ALS model (Adler et al., 1996; Adler, 1998) is derived using the volume averaged form of the mass conservation equation (Eqs 2 and 3), which can be written as
where
The ALS model assumes the concentration oscillations at the pore/solid interface,
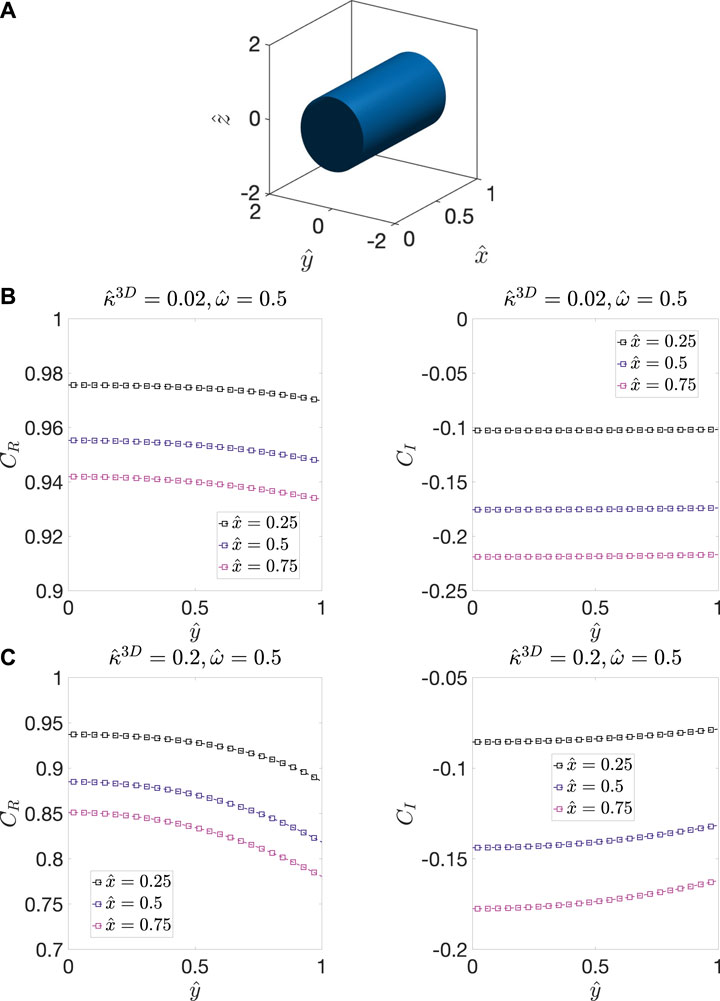
FIGURE 2. (A) The model microstructure, which contains a cylindrical solid domain with unit radius and length surrounded by pore phase. The distribution of
It is evident from the above model case that the difference between the amplitude of the oscillations at the interface and within the bulk cannot be neglected. Thus, we now consider a modification to the ALS model. Let
where the integral is over the entire volume of the cathode microstructure.
To characterize 〈
FIGURE 3. Calculated 〈
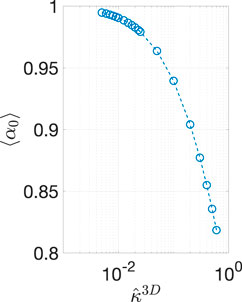
FIGURE 4. DC value of 〈
Using 〈
Thus, the expression for calculating the effective tortuosity can be modified as
Figure 5 shows the impedance spectra of the experimentally obtained microstructure for three values of
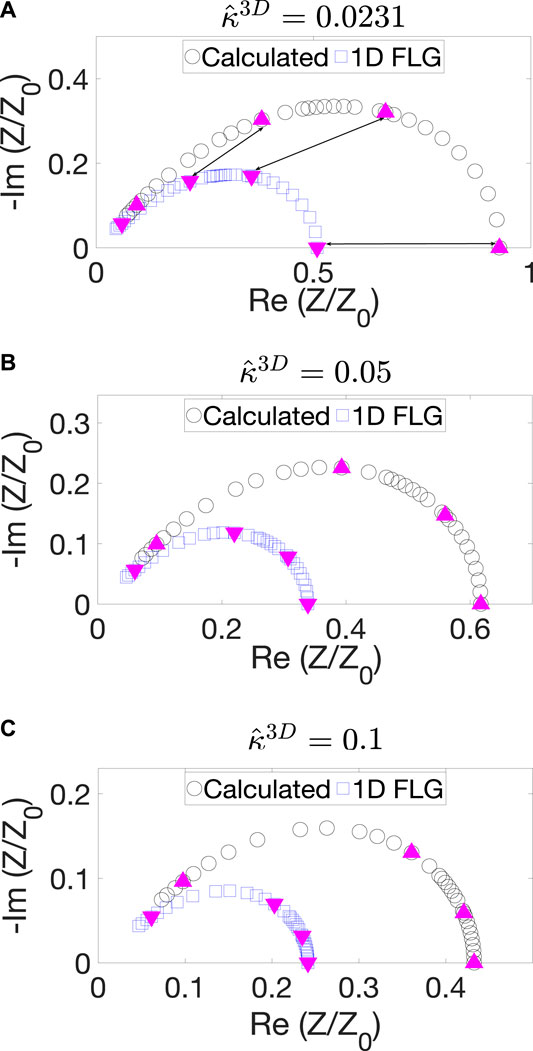
FIGURE 5. Nyquist plots obtained from 3D calculations for the BCC BC (black curve) and 1D FLG model (blue curve) for (A)
By solving Eq. 26, we calculated
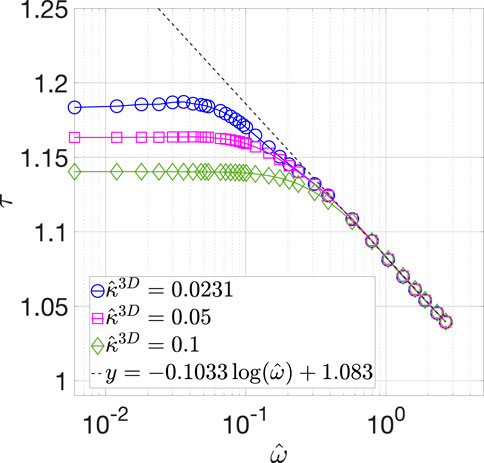
FIGURE 6. Calculated
To provide further insights, Figure 7 shows the distribution of
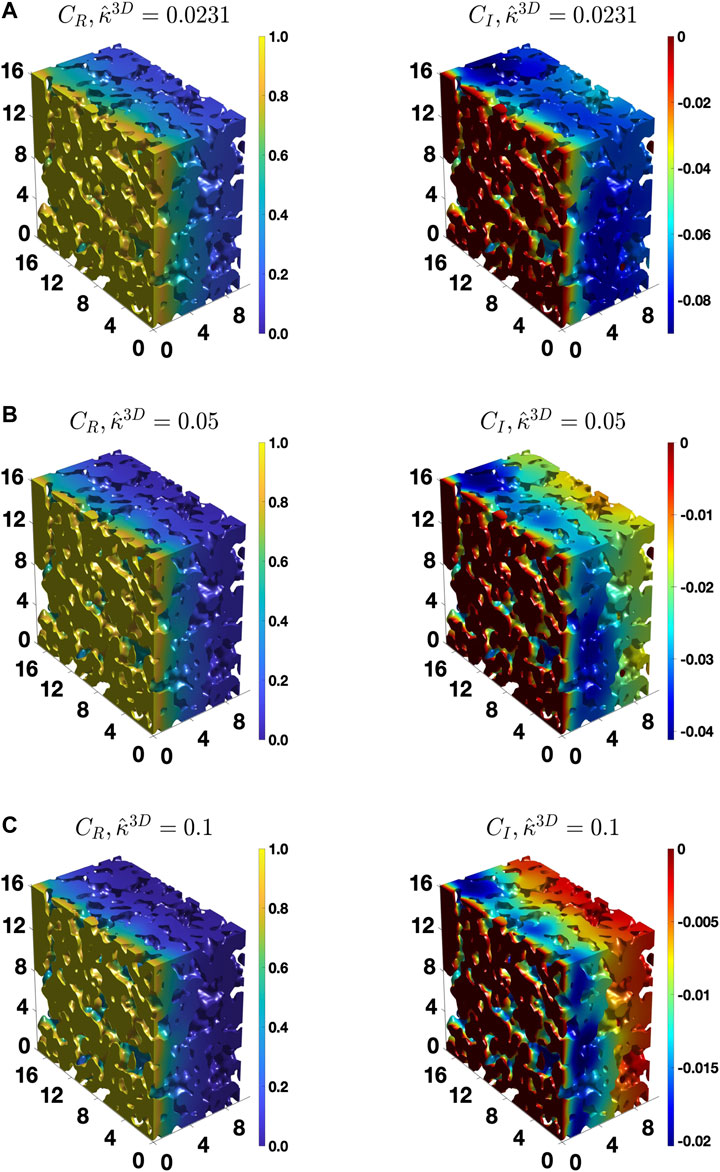
FIGURE 7. The distribution of the real and imaginary components of the concentration amplitude calculated for the BCC BC,
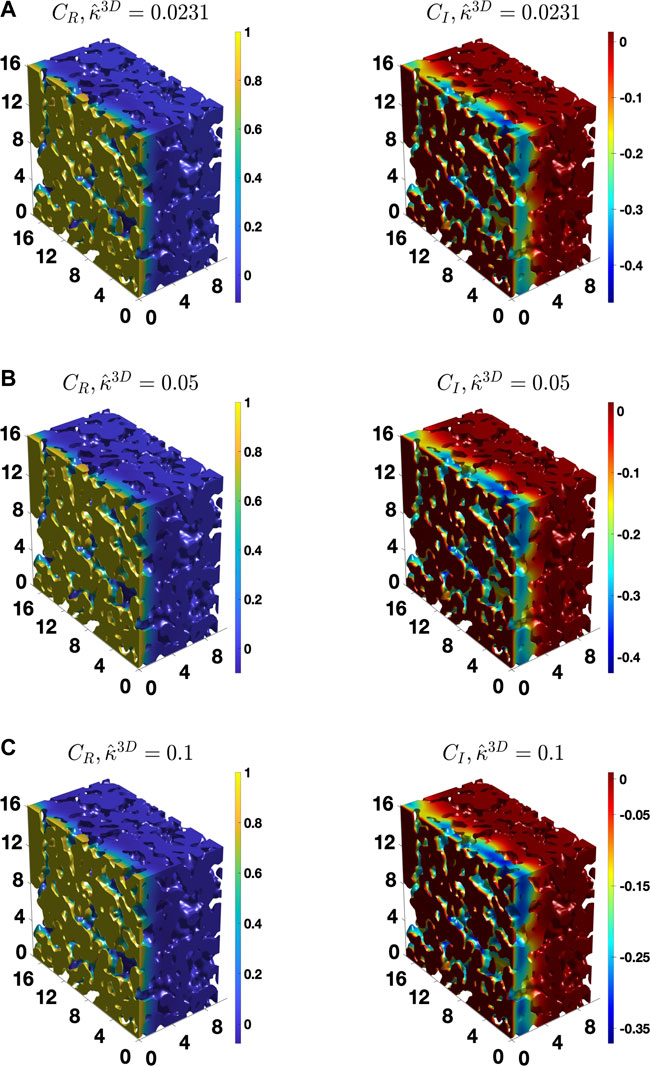
FIGURE 8. The distribution of the real and imaginary components of the concentration amplitude calculated for the BCC BC,
We note that there exists an error of up to 9% in the calculated impedance value at high frequencies, as described in Supplementary Material. The error arises because the accuracy of numerical approximations of the gradients in the concentration amplitudes decreases at high frequencies, as our numerical implementation employs fixed grid resolution throughout the simulation domain. Although this error can be reduced by doubling the grid resolution, such calculations become computationally expensive (as discussed in Supplementary Material) without providing additional insights. In fact, the error does not affect the observed qualitative behavior of the effective tortuosity, which is the one of the two main focuses of this work. Thus, the numerical results presented here are sufficiently accurate for demonstrating the dependence of the effective tortuosity on
Finally, to further evaluate the accuracy of approximating 〈
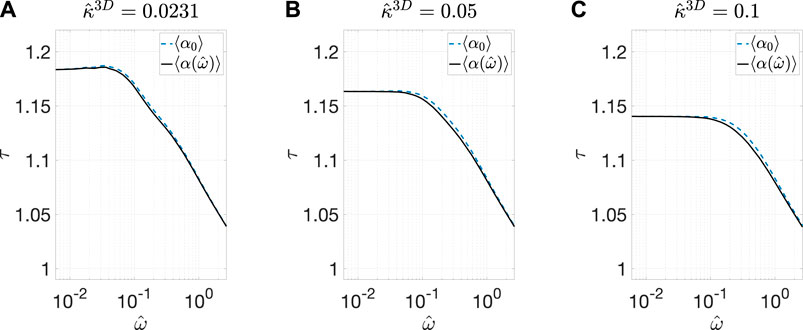
FIGURE 9. Comparisons of the calculated
In this study, we simulated the impedance behavior of a statistically representative portion of an experimentally determined complex three-dimensional microstructure of an unbiased MIEC SOFC cathode under two different boundary conditions. Our investigation generated two key insights. First, due to the presence of surface reaction, the amplitude of oscillations in the vacancy concentration is lower at the pore/solid interface than within the solid bulk of the cathode. This difference between the interface and bulk amplitude increases with an increase in the ratio between the reaction rate constant and the bulk diffusion coefficient. Therefore, to account for this difference, we proposed a modification to the ALS model in terms of the ratio of the surface and bulk concentration amplitudes at zero frequency, 〈
The data for all the figures in this paper can be downloaded from the following link: https://doi.org/10.13011/m3-ywxf-yw20.
VG: Methodology, Software, Formal analysis, Visualization, and Writing - original draft. DC: Formal analysis and Writing–original draft. SB: Conceptualization, Formal analysis, Writing–review and editing. KT: Conceptualization, Methodology, Formal analysis, Writing–review and editing, Supervision, Project administration, and Funding acquisition.
This study is supported by the United States National Science Foundation, Division of Material Research under the grant numbers DMR-1912151 and DMR-1912530. Computational resources were provided by the Extreme Science and Engineering Discovery Environment (XSEDE (Towns et al., 2014)) (allocation No. TG- DMR110007), which is supported by the United States National Science Foundation under grant number ACI-1053575, by the National Energy Research Scientific Computing Center (NERSC), a DOE Office of Science User Facility supported by the Office of Science of the United States Department of Energy under Contract No. DE-AC02–05CH11231.
The authors declare that the research was conducted in the absence of any commercial or financial relationships that could be construed as a potential conflict of interest.
The authors would like to acknowledge Prof. Hui-Chia Yu, who was involved in the development of the simulation code used in this work and provided associated information. The authors also thank Dr Beck Andrews for helpful discussions.
The Supplementary Material for this article can be found online at: https://www.frontiersin.org/articles/10.3389/fchem.2021.627699/full#supplementary-material
Aagesen, L. K., Adams, J. F., Allison, J. E., Andrews, W. B., Araullo-Peters, V., Berman, T., et al. (2018). PRISMS: An Integrated, Open-Source Framework for Accelerating Predictive Structural Materials Science. JOM 70, 2298–2314. doi:10.1007/s11837-018-3079-6
Adler, S. B., Lane, J. A., and Steele, B. C. H. (1996). Electrode Kinetics of Porous Mixed‐Conducting Oxygen Electrodes. J. Electrochem. Soc. 143, 3554–3564. doi:10.1149/1.1837252
Adler, S. B. (1998). Mechanism and Kinetics of Oxygen Reduction on Porous La1−Sr CoO3− Electrodes. Solid State Ionics 111, 125–134. doi:10.1016/s0167-2738(98)00179-9
Boukamp, B., Bouwmeester, H. J. M., Boukamp, B. A., and Bouwmeester, H. J. M. (2003). Interpretation of the Gerischer Impedance in Solid State Ionics. Solid State Ionics 157, 29–33. doi:10.1016/s0167-2738(02)00185-6
Boukamp, B., Verbraeken, M., Blank, D., and Holtappels, P. (2006). SOFC-anodes, Proof for a Finite-Length Type Gerischer Impedance?. Solid State Ionics 177, 2539–2541. doi:10.1016/j.ssi.2006.03.002
Bruggeman, D. A. G. (1935). Berechnung verschiedener physikalischer Konstanten von heterogenen Substanzen. I. Dielektrizitätskonstanten und Leitfähigkeiten der Mischkörper aus isotropen Substanzen. Ann. Phys. 416, 636–664. doi:10.1002/andp.19354160705
Çeçen, A., Wargo, E. A., Hanna, A. C., Turner, D. M., Kalidindi, S. R., and Kumbur, E. C. (2012). 3-D Microstructure Analysis of Fuel Cell Materials: Spatial Distributions of Tortuosity, Void Size and Diffusivity. J. Electrochem. Soc. 159, B299–B307. doi:10.1149/2.068203jes
Chen, K., and Jiang, S. P. (2016). Review-Materials Degradation of Solid Oxide Electrolysis Cells. J. Electrochem. Soc. 163, F3070–F3083. doi:10.1149/2.0101611jes
Chen-Wiegart, Y.-c. K., Demike, R., Erdonmez, C., Thornton, K., Barnett, S. A., and Wang, J. (2014). Tortuosity Characterization of 3D Microstructure at Nano-Scale for Energy Storage and Conversion Materials. J. Power Sourc. 249, 349–356. doi:10.1016/j.jpowsour.2013.10.026
Cooper, S. J., Bertei, A., Shearing, P. R., Kilner, J. A., and Brandon, N. P. (2016). TauFactor: An Open-Source Application for Calculating Tortuosity Factors from Tomographic Data. SoftwareX 5, 203–210. doi:10.1016/j.softx.2016.09.002
DeWitt, S., Rudraraju, S., Montiel, D., Andrews, W. B., and Thornton, K. (2020). PRISMS-PF: A General Framework for Phase-Field Modeling with a Matrix-free Finite Element Method. Npj Comput. Mater. 6, 1–12. doi:10.1038/s41524-020-0298-5
Gao, Z., Mogni, L. V., Miller, E. C., Railsback, J. G., and Barnett, S. A. (2016). A Perspective on Low-Temperature Solid Oxide Fuel Cells. Energy Environ. Sci. 9, 1602–1644. doi:10.1039/c5ee03858h
Häffelin, A., Joos, J., Ender, M., Weber, A., and Ivers-Tiffée, E. (2013). Time-Dependent 3D Impedance Model of Mixed-Conducting Solid Oxide Fuel Cell Cathodes. J. Electrochem. Soc. 160, F867–F876. doi:10.1149/2.093308jes
Hofhaus, J., and Van de Velde, E. F. (1996). Alternating-Direction Line-Relaxation Methods on Multicomputers. SIAM J. Sci. Comput. 17, 454–478. doi:10.1137/S1064827593253872
Holtappels, P., Verbraeken, M., Vogt, U., Blank, D., and Boukamp, B. (2006). Preparation and Electrochemical Characterisation of Supporting SOFC-Ni-YZT Anodes. Solid State Ionics 177, 2029–2032. doi:10.1016/j.ssi.2006.06.018
Hwang, H. J., Moon, J.-W., Lee, S., and Lee, E. A. (2005). Electrochemical Performance of LSCF-Based Composite Cathodes for Intermediate Temperature SOFCs. J. Power Sourc. 145, 243–248. doi:10.1016/j.jpowsour.2005.02.063
Jacobsen, T., and West, K. (1995). Diffusion Impedance in Planar, Cylindrical and Spherical Symmetry. Electrochimica Acta 40, 255–262. doi:10.1016/0013-4686(94)E0192-3
Jung, W., and Tuller, H. L. (2009). Impedance Study of SrTi1−xFexO3−δ (x=0.05 to 0.80) Mixed Ionic-Electronic Conducting Model Cathode. Solid State Ionics 180, 843–847. doi:10.1016/j.ssi.2009.02.008
Kreller, C., Drake, M., Adler, S. B., Chen, H.-Y., Yu, H.-C., Thornton, K., et al. (2011). Modeling SOFC Cathodes Based on 3-D Representations of Electrode Microstructure. ECS Trans. 35, 815–822. doi:10.1149/1.3570062
Kreller, C. R. (2011). Measurement and Modeling of Material and Microstructural Factors Governing Performance of Solid Oxide Fuel Cell Cathodes. ProQuest Diss. Theses. Available at: https://proxy.lib.umich.edu/login?url=https://www.proquest.com/dissertations-theses/measurement-modeling-material-microstructural/docview/865807958/se-2?accountid=14667.
Lim, D.-K., Plymill, A. B., Paik, H., Qian, X., Zecevic, S., Chisholm, C. R. I., et al. (2020). Solid Acid Electrochemical Cell for the Production of Hydrogen from Ammonia. Joule 4, 2338–2347. doi:10.1016/j.joule.2020.10.006
Liu, Z., Liu, M., Nie, L., and Liu, M. (2013). Fabrication and Characterization of Functionally-Graded LSCF Cathodes by Tape Casting. Int. J. Hydrogen Energ. 38, 1082–1087. doi:10.1016/j.ijhydene.2012.10.048
Lynch, M. E., Ding, D., Harris, W. M., Lombardo, J. J., Nelson, G. J., Chiu, W. K. S., et al. (2013). Flexible Multiphysics Simulation of Porous Electrodes: Conformal to 3D Reconstructed Microstructures. Nano Energy 2, 105–115. doi:10.1016/j.nanoen.2012.08.002
Mahato, N., Banerjee, A., Gupta, A., Omar, S., and Balani, K. (2015). Progress in Material Selection for Solid Oxide Fuel Cell Technology: A Review. Prog. Mater. Sci. 72, 141–337. doi:10.1016/j.pmatsci.2015.01.001
Mizusaki, J., Yasuda, I., Shimoyama, J. i., Yamauchi, S., and Fueki, K. (1993). Electrical Conductivity, Defect Equilibrium and Oxygen Vacancy Diffusion Coefficient of La1 − X Ca X AlO3 − δ Single Crystals. J. Electrochem. Soc. 140, 467–471. doi:10.1149/1.2221070
Mogensen, M. B., Chen, M., Frandsen, H. L., Graves, C., Hansen, J. B., Hansen, K. V., et al. (2019). Reversible Solid-Oxide Cells for Clean and Sustainable Energy. Clean. Energ. 3, 175–201. doi:10.1093/ce/zkz023
Nenning, A., Volgger, L., Miller, E., Mogni, L. V., Barnett, S., and Fleig, J. (2017). The Electrochemical Properties of Sr(Ti,Fe)O3-Δfor Anodes in Solid Oxide Fuel Cells. J. Electrochem. Soc. 164, F364–F371. doi:10.1149/2.1271704jes
Niania, M. A. R., Rossall, A. K., Van den Berg, J. A., and Kilner, J. A. (2020). The Effect of Sub-surface Strontium Depletion on Oxygen Diffusion in La0.6Sr0.4Co0.2Fe0.8O3−δ. J. Mater. Chem. A. 8, 19414–19424. doi:10.1039/d0ta06058e
Nielsen, J., Jacobsen, T., and Wandel, M. (2011). Impedance of Porous IT-SOFC LSCF:CGO Composite Cathodes. Electrochimica Acta 56, 7963–7974. doi:10.1016/j.electacta.2011.05.042
Nitta, N., Wu, F., Lee, J. T., and Yushin, G. (2015). Li-ion Battery Materials: Present and Future. Mater. Today 18, 252–264. doi:10.1016/j.mattod.2014.10.040
Pereira, J. M. C., Navalho, J. E. P., Amador, A. C. G., and Pereira, J. C. F. (2014). Multi-scale Modeling of Diffusion and Reaction-Diffusion Phenomena in Catalytic Porous Layers: Comparison with the 1D Approach. Chem. Eng. Sci. 117, 364–375. doi:10.1016/j.ces.2014.06.028
Perry, N. H., Kim, J. J., Bishop, S. R., and Tuller, H. L. (2015). Strongly Coupled Thermal and Chemical Expansion in the Perovskite Oxide System Sr(Ti,Fe)O3−α. J. Mater. Chem. A. 3, 3602–3611. doi:10.1039/c4ta05247a
Rootare, H. M., and Prenzlow, C. F. (1967). Surface Areas from Mercury Porosimeter Measurements. J. Phys. Chem. 71, 2733–2736. doi:10.1021/j100867a057
Rüger, B., Weber, A., and Ivers-Tiffee, E. (2007). 3D-Modelling and Performance Evaluation of Mixed Conducting (MIEC) Cathodes. ECS Trans. 7, 2065–2074. doi:10.1149/1.2729320
Scott Cronin, J., Muangnapoh, K., Patterson, Z., Yakal-Kremski, K. J., Dravid, V. P., and Barnett, S. A. (2012). Effect of Firing Temperature on LSM-YSZ Composite Cathodes: A Combined Three-Dimensional Microstructure and Impedance Spectroscopy Study. J. Electrochem. Soc. 159, B385–B393. doi:10.1149/2.053204jes
Shakeel, N., Ahmad, A., Ahamed, M. I., Inamuddin, , and Asiri, A. M. (2019). Kraton Based Polymeric Nanocomposite Bioanode for the Application in a Biofuel Cell. Enzyme Microb. Technol. 127, 43–49. doi:10.1016/j.enzmictec.2019.04.003
Tjaden, B., Brett, D. J. L., and Shearing, P. R. (2018). Tortuosity in Electrochemical Devices: a Review of Calculation Approaches. Int. Mater. Rev. 63, 47–67. doi:10.1080/09506608.2016.1249995
Towns, J., Cockerill, T., Dahan, M., Foster, I., Gaither, K., Grimshaw, A., et al. (2014). XSEDE: Accelerating Scientific Discovery. Comput. Sci. Eng. 16, 62–74. doi:10.1109/MCSE.2014.80
Wang, Y., Ruiz Diaz, D. F., Chen, K. S., Wang, Z., and Adroher, X. C. (2020). Materials, Technological Status, and Fundamentals of PEM Fuel Cells - A Review. Mater. Today 32, 178–203. doi:10.1016/j.mattod.2019.06.005
Wilson, J. R., Kobsiriphat, W., Mendoza, R., Chen, H.-Y., Hiller, J. M., Miller, D. J., et al. (2006). Three-dimensional Reconstruction of a Solid-Oxide Fuel-Cell Anode. Nat. Mater 5, 541–544. doi:10.1038/nmat1668
Yoo, C.-Y., and Bouwmeester, H. J. M. (2012). Oxygen Surface Exchange Kinetics of SrTi1−xFexO3−δ Mixed Conducting Oxides. Phys. Chem. Chem. Phys. 14, 11759–11765. doi:10.1039/c2cp41923h
Yu, H.-C., Adler, S. B., Barnett, S. A., and Thornton, K. (2020). Simulation of the Diffusional Impedance and Application to the Characterization of Electrodes with Complex Microstructures. Electrochimica Acta 354, 136534. doi:10.1016/j.electacta.2020.136534
Yu, H.-C., Chen, H.-Y., and Thornton, K. (2012). Extended Smoothed Boundary Method for Solving Partial Differential Equations with General Boundary Conditions on Complex Boundaries. Model. Simul. Mater. Sci. Eng. 20, 075008. doi:10.1088/0965-0393/20/7/075008
Zhang, L., Hu, X., Wang, Z., Sun, F., and Dorrell, D. G. (2018). A Review of Supercapacitor Modeling, Estimation, and Applications: A Control/management Perspective. Renew. Sustain. Energ. Rev. 81, 1868–1878. doi:10.1016/j.rser.2017.05.283
Zhang, S.-L., Cox, D., Yang, H., Park, B.-K., Li, C.-X., Li, C.-J., et al. (2019). High Stability SrTi1−xFexO3−δ Electrodes for Oxygen Reduction and Oxygen Evolution Reactions. J. Mater. Chem. A. 7, 21447–21458. doi:10.1039/c9ta07548h
Zhang, S.-L., Wang, H., Lu, M. Y., Zhang, A.-P., Mogni, L. V., Liu, Q., et al. (2018). Cobalt-substituted SrTi0.3Fe0.7O3−δ: a Stable High-Performance Oxygen Electrode Material for Intermediate-Temperature Solid Oxide Electrochemical Cells. Energ. Environ. Sci. 11, 1870–1879. doi:10.1039/c8ee00449h
Keywords: electrochemical impedance spectroscopy (EIS), tortuosity, 3D microstructure, solid oxide fuel cells, Adler-Lane-Steele model, Gerischer impedance
Citation: Goel V, Cox D, Barnett SA and Thornton K (2021) Simulation of the Electrochemical Impedance in a Three-Dimensional, Complex Microstructure of Solid Oxide Fuel Cell Cathode and Its Application in the Microstructure Characterization. Front. Chem. 9:627699. doi: 10.3389/fchem.2021.627699
Received: 10 November 2020; Accepted: 26 April 2021;
Published: 27 May 2021.
Edited by:
Dong Ding, Idaho National Laboratory (DOE), United StatesReviewed by:
Yanxiang Zhang, Harbin Institute of Technology, ChinaCopyright © 2021 Goel, Cox, Barnett and Thornton. This is an open-access article distributed under the terms of the Creative Commons Attribution License (CC BY). The use, distribution or reproduction in other forums is permitted, provided the original author(s) and the copyright owner(s) are credited and that the original publication in this journal is cited, in accordance with accepted academic practice. No use, distribution or reproduction is permitted which does not comply with these terms.
*Correspondence: Katsuyo Thornton, a3Rob3JuQHVtaWNoLmVkdQ==
Disclaimer: All claims expressed in this article are solely those of the authors and do not necessarily represent those of their affiliated organizations, or those of the publisher, the editors and the reviewers. Any product that may be evaluated in this article or claim that may be made by its manufacturer is not guaranteed or endorsed by the publisher.
Research integrity at Frontiers
Learn more about the work of our research integrity team to safeguard the quality of each article we publish.