 Izabela Jendrzejewska
95% of researchers rate our articles as excellent or good
Learn more about the work of our research integrity team to safeguard the quality of each article we publish.
Find out more
ORIGINAL RESEARCH article
Front. Chem. , 30 September 2020
Sec. Analytical Chemistry
Volume 8 - 2020 | https://doi.org/10.3389/fchem.2020.00672
This article is part of the Research Topic New Approaches in Forensic Analytical Chemistry View all 11 articles
It is estimated that ~50% of medications and dietary supplements offered in the Internet are counterfeit. X-ray diffraction is one of the techniques which may be successfully applied to identify various chemical compounds in polycrystalline mixtures such as dietary supplements, but also medications, narcotics or designer drugs. X-ray diffraction enables the understanding of compositions of such mixtures. For the tests, 22 dietary supplements which should contain magnesium and calcium compounds, available in pharmacies, groceries, Internet shops, as well as in shops for sportspersons, were selected. Identification of crystalline substances present in the tested sample consists in determination of inter-planar distances dhkl of investigated substances and determination of intensity of the obtained diffraction lines, and then in comparing them with values contained in diffraction databases. In this study, the ICDD-PDF2 database was used. The most important criterion in qualitative analysis, confirming the presence of a given phase, is the conformity of positions of diffraction lines in the recorded diffraction image with those in the reference image. Reflection shifts for the individual 2θ angles compared with the data from the database should not exceed 0.2°. In most cases, X-ray analysis of the investigated dietary supplements proved the presence of magnesium and calcium compounds declared by the manufacturer, as well as allowing the identification of auxiliary substances present in the tested products. In the case of two magnesium-containing dietary supplements, the magnesium compounds declared by the manufacturer were not found. Our studies confirmed the effectiveness of X-ray structural analysis and proved the possibility of distinguishing counterfeit preparations from authentic products, as well as to use this method for the quality control of such pharmaceutical preparations.
In recent years, there has been an increasing number of fatal cases resulting from taking counterfeit medical and therapeutical products, and dietary supplements. WHO and FDA experts estimate that counterfeit products may constitute ~10% of the global medicinal drug market. It is thought that the following groups are the largest among counterfeit drugs: antibiotics (28%); hormones (including steroid hormones, 18%); anti-asthmatics and anti-allergics (8%); antimalarials (7%); analgesics and antipyretics (6%); other medications (14 therapeutical classes, 33%) (Maurin et al., 2007; Singh et al., 2009; Venhuis et al., 2011). Also counterfeiters are also interested in popular medicines, such as aspirin. In 2013, 1.2 million aspirin tablets were confiscated in France, and it was a product that did not contain the active substance at all. In the USA, three batches of product containing only water, which were to replace a good, effective, and commonly used oncological drug, were confiscated (World Health Organisation, 2006).
Apart from these, dietary supplements are also massively forged. Because of the fact that they are classified as foodstuffs, their common availability and an increase in the interest for this type of product may be observed at present. More than 10,000 dietary supplements are available on the Polish market. These products contain more than 500 components in total. Use of many of them has no factual substantiation. The majority of plant products, nutrients and dietary supplements is not tested for the quality of the components used. Dietary supplements containing structural analogs of and chemical compounds very similar to those comprised in medicinal drugs, are particularly dangerous. They have much stronger undesirable effects usually and even cause death (World Health Organisation, 2018). That is why it is important to control their chemical composition, using the available test methods (Stypułkowska et al., 2011).
For the study, popular and frequently purchased dietary supplements containing magnesium and calcium were chosen. The goal of the paper consists in the identification of calcium and magnesium compounds declared by manufacturers as components of given supplements, as well as an attempt of determination whether the product is authentic or not.
Twenty-two dietary supplements containing calcium and magnesium were purchased in pharmacies, shops, filling stations, and via the Internet, and then subjected to tests using X-ray radiation. All analyzed products are gathered in Table 1. In the table, the data reported by manufacturers (magnesium and calcium contents), and the form of the chemical compound are taken into account.
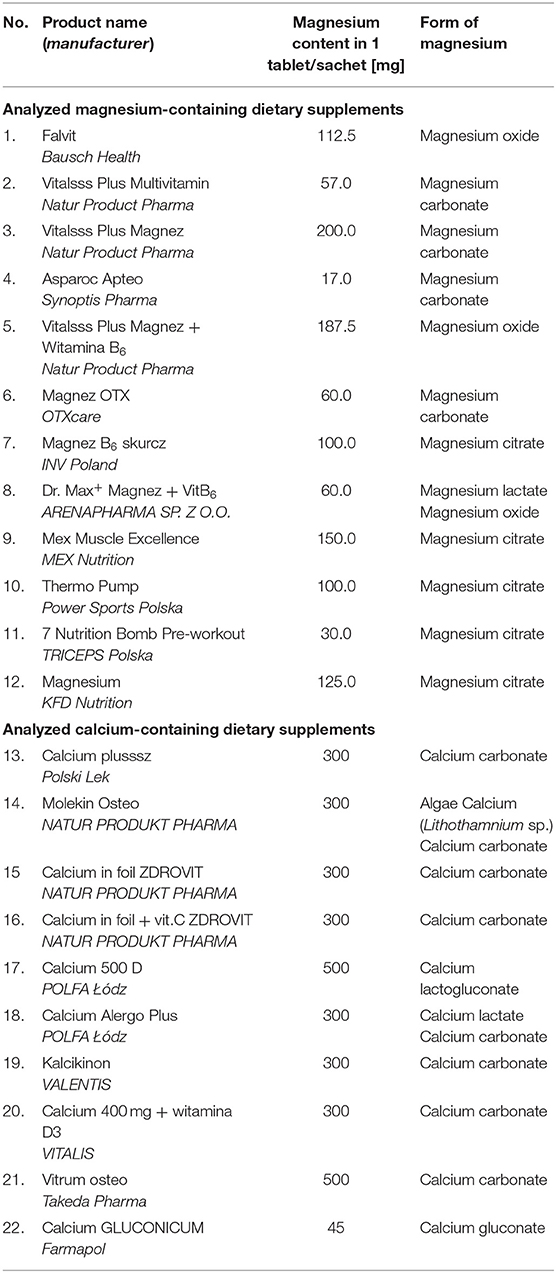
Table 1. Analyzed dietary supplements.
The table does not include auxiliary substances such as starch, talc, magnesium stearate, citric acid, etc., because of the fact that the main goal of the paper is the identification of calcium and magnesium compounds as “active substances” in the analyzed dietary supplements. On the other hand, strong diffraction lines, originating from auxiliary substances, such as ascorbic acid, citric acid, magnesium stearate, alanine, starch, are marked in the diffraction patterns. It pertains particularly to multivitamin preparations, in which the intensity of diffraction lines originating from magnesium and calcium compounds is lower than that of the strongest lines present in the diffraction pattern.
X-ray radiation has the ability to diffract, or dissipate off the rays on atoms of crystals. A reflection of a beam of parallel rays occurs on a series of parallel lattice planes (hkl). The radiation will be amplified when the angle of incidence (θ) is equal to the angle of reflection (θ). To amplify the reflected radiation, the path difference (Δs) must be equal to a total multiple of the wavelength (nλ), as only then, the wave are in phase. The scheme of X-ray diffraction is shown in Epp (2016).
The amplification condition will be met if:
where: n—reflection order, λ—wavelength, dhkl—interplanary distance, θ—angle of reflection.
The Equation (1), namely the Bragg-Wulff equation, describes the geometrical condition for X-ray diffraction (XRD) on lattice planes having interplanary distances of dhkl. An important advantage of the method consists in the fact that not only the θ angle, at which the X-rays are being reflected is measured, but also the intensities of the observed diffraction pattern lines. The diffraction pattern is obtained in the form of a plot of the intensity (count number) vs. the 2θ (deflection angle) (Figure 1).
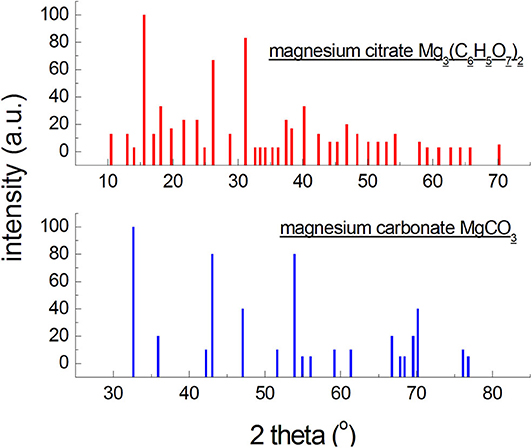
Figure 1. Diffraction patterns generated based on the data from the ICDD database for an organic and an inorganic magnesium salt.
X-ray phase analysis plays an important role in the analysis of almost all solids, including medications and medicinal preparations. As a non-destructive method, it is used for: (a) identification of unknown compounds, (b) investigation of polymorphism, solvation and salt form identification, (c) determination of physico-chemical properties, (d) detection of impurities and anomalies in medications (Thatcher and Briner, 1986; Stephenson, 2005; Chauhan and Chauhan, 2014; Das et al., 2014). X-ray phase analysis enables both qualitative and quantitative analyses of polycrystalline substances. Each crystalline substance has a characteristic X-ray diffraction pattern with specific locations of diffraction lines and their intensities. Such polycrystalline diffraction patterns are so complex that it is not possible to have identical diffraction images for various substances. Therefore, diffraction patterns may play the role of “fingerprints” in the identification of substances. A diffraction pattern may be considered as a set of interplanary distances dhkl and line intensities corresponding to them. It is important that every phase included in the composition of the mixture is independent in the process of creation of the diffraction pattern, which is a sum of diffraction patterns of the co-existent phases. To carry out the qualitative phase analysis, one should compare the obtained diffraction pattern (2θ angles, dhkl interplanary distances, and diffraction line intensities) with a corresponding standard, found in a proper database. A diffraction line shift of <0.2° is a normal phenomenon while analyzing a polycrystalline substance. It is connected with a random arrangement of grains in a polycrystalline sample. On the other hand, shifts larger than 0.2° at a given diffraction angle 2θ indicate a different crystal structure. Counterfeit pharmaceuticals contain various types of auxiliary substances (excipients) with different crystal structures than those of substance present in authentic products (Kugler, 2003; Rendle, 2003). Based on this assumption, a product for which the obtained diffraction lines are shifted by more than 0.2°, should be considered suspect (USP Pharmacopeial Convention, 2011; DeWitt, 2015). This rule is published in the general chapter of the <941> ascertaining that if the shifts of diffraction lines in an XRD image of the tested products are larger than 0.2° for a given 2θ diffraction angle while compared to the XRD image for an authentic product, these products meet the counterfeit criteria (DeWitt, 2015). Also, counterfeit drugs and supplements may be distinguished from authentic ones by studying their general XRD images. Additional lines, lack of lines, as well as line shifts will be observed in diffraction patterns of counterfeit products. This method enables the application of X-ray phase analysis as a technique for distinguishing counterfeit pharmaceuticals from authentic ones in legal chemistry.
The obtained diffraction pattern contains information on the angle of reflection θ and wavelength λ, so, using the Bragg Equation (1), the interplanary distance dhkl may be calculated (Bojarski and Łagiewka, 1988). The obtained values of the interplanary distances dhkl characterize a given phase and are independent from the radiation type, while the line intensities are closely related to it. Due to this method, identification of components of crystalline phases containing the tested material is possible, and simultaneously, qualitative analysis of the sample takes place.
There is a dependence between the intensity of any j phase reflection, having the mass absorption coefficient , and the intensity of the same reflection, , in the case when the phase j with a mass share mj is present in a polyphasic mixture with a mass coefficient μ*, shown by the following formula:
As can be seen from the formula (2), the intensity of a recorded reflection of a given phase depends on its amount in the mixture mj and the value, or its crystal structure (Bojarski and Łagiewka, 1988).
Identification of phases in polyphasic mixtures (and dietary supplements should be considered such) depends on crystal structure of a given phase, characters of the co-existing phases, and instrumental factors. X-ray photographs of crystalline phases having a high symmetry (regular, tetragonal, hexagonal systems) contain a relatively low number of diffraction reflections, but of high intensities. It allows for identifying them even at their contents below 1%. It is assumed that the X-ray detection limit is in the range of 0.1–1% by wt. per phase, while the limit of detection (LOD) is assumed as ~1% (Bojarski and Łagiewka, 1988)1.
On the other hand, X-ray photographs of low-symmetry phases (triclinic, monoclinic systems) contain large numbers of reflections, but of low intensities, leading to worse detection limits. Phases composed of atoms of elements having high atomic numbers will exhibit higher intensities of reflections than those composed of light elements (Figure 1). It is a consequence of atomic dissipation factor, increasing with the increase in the atomic number of the element. Thus, the X-ray detection limit will be more favorable for compounds with a high symmetry, and unfavorable for compounds with a low symmetry composed of light elements. It should be noted that more than 2/3 of organic compounds crystallize in low-symmetry systems, and the strongest diffraction lines are observed at small angles (Figure 1). The content of a given crystalline phase may be lower than this limit, so it will not be identified, but it does not mean it is absent. The detection limit is affected also by size of the crystallites and perfection of the crystal lattice. Defected lattices and crystallite sizes below 0.1 μm cause broadening and weakening of intensities of the reflections, hindering identification. The change in the limit of detection of a crystalline phase, depending on the type of the mixture, wherein this phase is present, consists in a change in the ration between the absorption coefficient of the phase and the mixture as a whole, , and in a superposition of reflections of the concomitant phases. The detection limit of phase j, having an absorption coefficient , will be more favorable in a mixture with a low absorption coefficient than in a mixture with a high value of absorption coefficient (formula 2) (Bojarski and Łagiewka, 1988).
Quantitative analysis is based on the diffraction line intensity expressed as formula (3):
where: C—constant, Fhkl–structural factor, LP—Lorentz, and polarization factor, p—plane multiplicity factor, A—absorption factor.
Depending on the number of phases in the mixture and their relationships, several typical methods of quantitative analysis are distinguished: (i) direct comparison of reflection intensities, (ii) internal standard method, (iii) external standard method, (iv) Chung method. It is important that reflections having adequate intensities are chosen. These should be the strongest, well separated reflections, located in a small angle range. Precision of quantitative X-ray analysis depends on many factors, therefore this method is affected by errors related to the structure of the phase being determined and the preparation of the sample. Precision of this method ranges from tenths of per cent to several per cent, depending on the analyzed mixture (Bojarski and Łagiewka, 1988).
Our studies were focused on a qualitative analysis of selected dietary supplements containing calcium and magnesium compounds. Samples of dietary supplements were very finely ground in an agate mortar, until a homogeneous fine powder was obtained. The tests were carried out using a PW1050 polycrystalline diffractometer with a PW1729 generator from Philips. Bragg-Brentano focusing of diffractive radiation was applied. The total duration of the analysis of each supplement amounted to 48 h, the angular range of the goniometer: 5°÷135°, CuKα1 radiation (λ = 1.54056 Å), filter—Ni. During the experiment, a full scan in the angle range of 5°–120° was carried out, with an angular step of 0.05°, and the scanning time was 0.1 s. The next measurement was configured so that the angle range matched to the given preparation subjected to the analysis. When the tested sample did not exhibit any peaks above 80°, the second measurement was recorded in the 2θ angle range of 5°÷80° or 10°÷80°. Parameters of the second measurement were as follows: 0.02° angular step and 0.02 s scanning time, affecting the quality of the diffraction pattern distinctly. The measurement was carried out twice or thrice to eliminate all errors.
Identification of calcium and magnesium compounds contained in the tested supplements was performed based on the data from the ICDD PDF−2 database (Release 2008, Table A1). For each tested substance, qualitative phase analysis was carried out. It consisted in a comparison of the experimental diffraction data such as 2θ diffraction angles, dhkl interplanary distances, and relative intensities, with the data from the ICDD database. Values of dhkl interplanary distances were calculated based on the Bragg-Wulff equation. The results gathered in tables and shown in the figures are grouped according to the magnesium or calcium compound contained in the tested dietary supplement.
Figure 2 illustrates polycrystalline diffraction patterns for the following dietary supplements: Asparoc APTEO Vitalsss Plus Multiwitamina, Vitalsss Plus Mg + K, and Magnez OTX. In all diffraction patterns, diffraction lines characteristic for magnesium carbonate (MgCO3) are present. Their intensity is small, confirming the small amount of MgCO3 declared by the manufacturer (Table 1). The largest amount of MgCO3 is contained in Vitalsss Plus Magnesium (200 mg) and it is evident in the diffraction pattern, where the lines originating from MgCO3 have the highest intensity in comparison to the other dietary supplements with MgCO3.
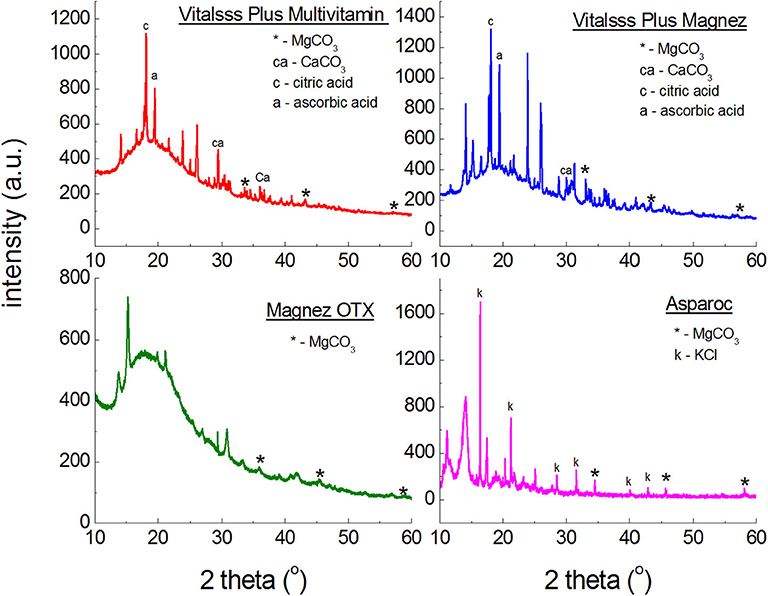
Figure 2. X-ray powder diffraction spectra of dietary supplements containing magnesium carbonate (MgCO3).
The comparison of experimental values of the 2θ angle with the data from the ICDD database for magnesium carbonate showed that the peak shifts are smaller than 0.2° (Table 2). It proves that the same crystalline form of MgCO3, thus the same product, is present in every tested dietary supplement, meaning that the tested preparation are authentic.
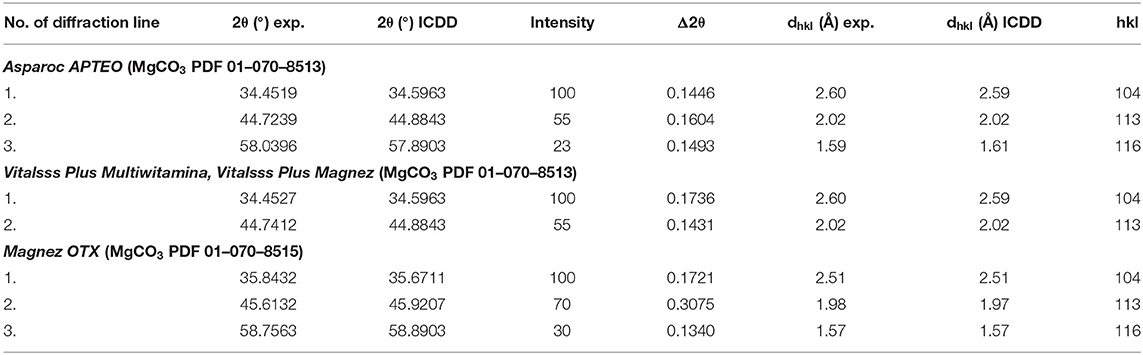
Table 2. Comparison of experimental data with the data from the ICDD database for the following dietary supplements: Vitalsss Plus Multiwitamina, Vitalsss Plus Magnez, Magnez OTX, Asparoc containing magnesium carbonate (MgCO3).
Figure 3 presents diffraction patterns of dietary supplements containing magnesium oxide (MgO). In the diffraction patterns of Falvit and Dr. Max+ Magnez + VitB6 (Figure 2), three of the strongest diffraction lines characteristic for magnesium oxide MgO are clearly evident. For Vitalsss Plus Magnez, only one line originating from MgO was identified, at the 2θ corresponding to the strongest line for MgO. Intensity of this line was significantly lower than that of the MgO line in Falvit preparation, however, the amount of MgO in Vitalsss Plus Magnez is higher in comparison with that in Falvit (Table 1). It indicates that the amount of magnesium oxide in the former preparation is lower than the manufacturer declares.
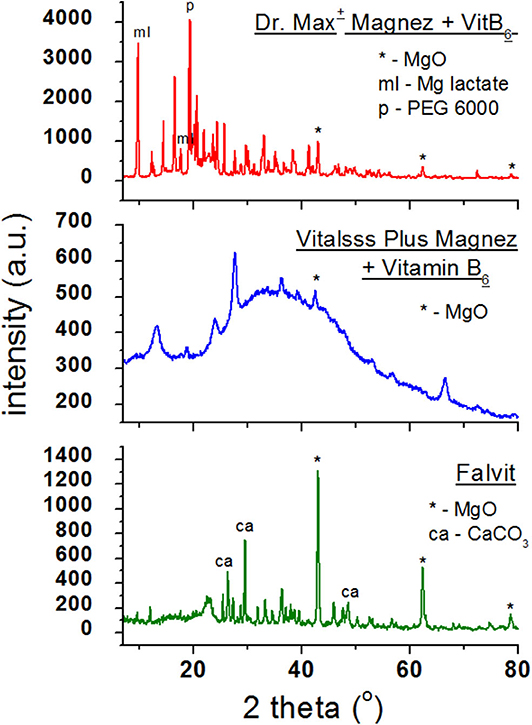
Figure 3. X-ray powder diffraction spectra of dietary supplements containing magnesium oxide (MgO).
Comparing the experimental 2θ values and the calculated values of interplanary distances dhkl gathered in Table 3 with the data from the ICDD database, their very good accordance may be confirmed. The shifts of the reflections for the individual diffraction angles 2θ compared to the reference data are smaller than 0.2°, confirming the authenticity of the product.
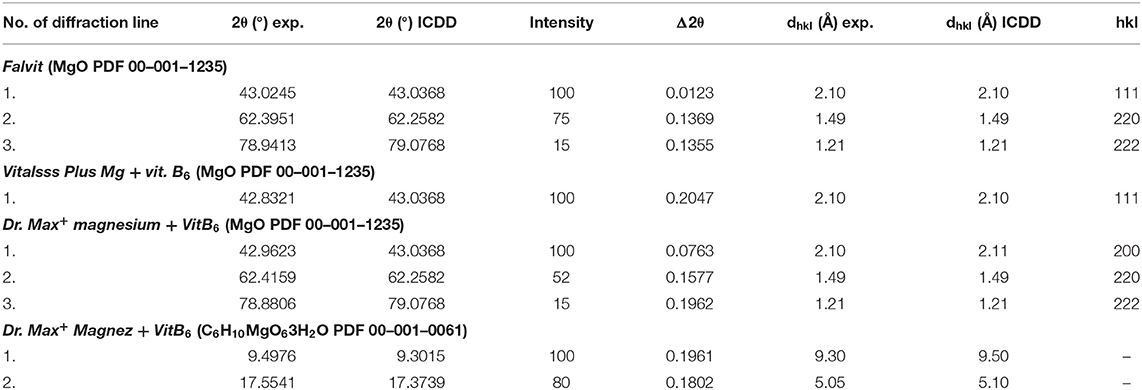
Table 3. Comparison of experimental data with the data from the ICDD database for dietary supplements Falvit and Vitalsss Plus Mg + vit. B6 containing magnesium oxide (MgO) and Dr. Max+ Magnez + VitB6 containing also magnesium lactate (C6H10MgO63H2O) apart from magnesium oxide (MgO).
Figure 4 presents diffraction patterns of dietary supplements with magnesium citrate. For Magnez B6 skurcz, 4 well-evident diffraction lines were identified, while for Magnesium KFD Nutrition only one line is visible for an angle close to the 2θ value, at which the strongest line from magnesium citrate is observed. The line has a lower intensity than, approximately, the corresponding line for Magnez B6 skurcz, despite the fact that the amount of magnesium citrate is relatively larger in Magnesium KFD Nutrition (Table 1). It may indicate a significantly smaller amount of magnesium citrate in Magnesium KFD Nutrition than the amount declared by the manufacturer.
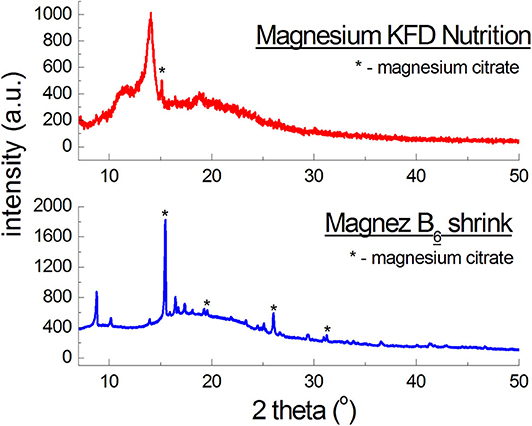
Figure 4. X-ray diffraction pattern for dietary supplements containing magnesium citrate [Mg3(C6H5O7)2].
The experimental data (2θ angle values and the calculated values of dhkl interplanary distances) for Magnez B6 skurcz are in a good accordance with the data from the ICDD database (Table 4). The Δ2θ differences for the individual diffraction angles 2θ while compared with the ICDD data are smaller than 0.2°, which may prove that the tested preparation is authentic. On the other hand, for Magnesium KFD Nutrition, the Δ2θ value is higher than 0.2°, possibly indicating irregularities in the composition of this supplement, e.g., a lack of magnesium citrate, an amount lower than that declared by the manufacturer, or presence of another substance giving a diffraction pattern close to that of magnesium citrate.
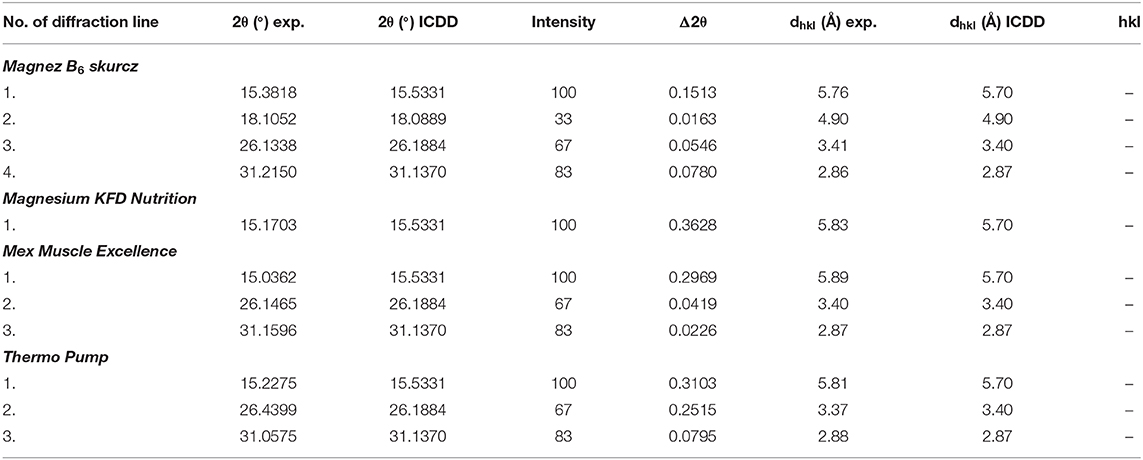
Table 4. Results of analysis of experimental data and data from the ICDD database for the following dietary supplements: Magnez B6 skurcz and Magnesium KFD Nutrition and for sportspersons: Mex Muscle Excellence and Thermo Pump [magnesium citrate Mg3(C6H5O7)2, PDF 00–001–0186].
In Figure 5, diffraction patterns for multicomponent dietary supplements intended for people engaging in sports are shown. The magnesium-supplementing compound is magnesium citrate. Diffraction lines characteristic for magnesium citrate are present in the diffraction patterns of Mex Muscle Excellence and Thermo Pump. Comparison of intensities of lines characteristic for magnesium citrate shows a significant decrease in the intensity of the Thermo Pump line, despite the relatively high content of this compound (Table 1). It indicates a lower amount of magnesium citrate in Thermo Pump than that declared by the manufacturer. Comparing the experimental values of 2θ angles and the calculated values of interplanary distances dhkl gathered in Table 4 with the data from the ICDD database, their very good accordance may be confirmed. The shifts of the reflections for the individual 2θ diffraction angles are smaller than 0.2°, proving that magnesium citrate is present in the tested preparations.

Figure 5. X-ray diffraction pattern for dietary supplements containing magnesium citrate [Mg3(C6H5O7)2].
In the case of 7 Nutrition Bomb Pre-workout dietary supplement for sportspersons, no lines originating from—Mg3(C6H5O7)2–were found (Figure 5). All visible lines originated from alanine—one of the components of the analyzed product according to its manufacturer. The identified alanine constitutes 25% (5,000 mg) of the total product mass. In this case, the problem of identification of magnesium citrate is probably connected with the composition of the analyzed preparation for sportspersons. Taking into account the information placed on the packaging, the preparation's composition includes more than 20 various substances. According to this description, the total amount of the preparation should contain only 0.15% (30 mg) of magnesium citrate, meaning that the magnesium citrate content may be lower than the roentgenographic detection limit.
In Figure 6, diffraction patterns of the following dietary supplements are shown: Calcium plusssz, Calcium in foil, Calcium in foil + vit.C containing calcium carbonate CaCO3 as a compound introducing calcium ions to the human organism, in the presence of ascorbic acid. Ascorbic acid was identified in Calcium plusssz and Calcium in foil, despite the fact that the manufacturer did not declare this component. Lines of citric acid, responsible for the taste of these supplements, have high intensities. In the diffraction patterns of the analyzed supplements (Figure 6), three of the strongest diffraction lines characteristic for calcium carbonate (CaCO3) are clearly visible. The intensities of these lines are similar, confirming the amount of calcium carbonate declared by the manufacturer.
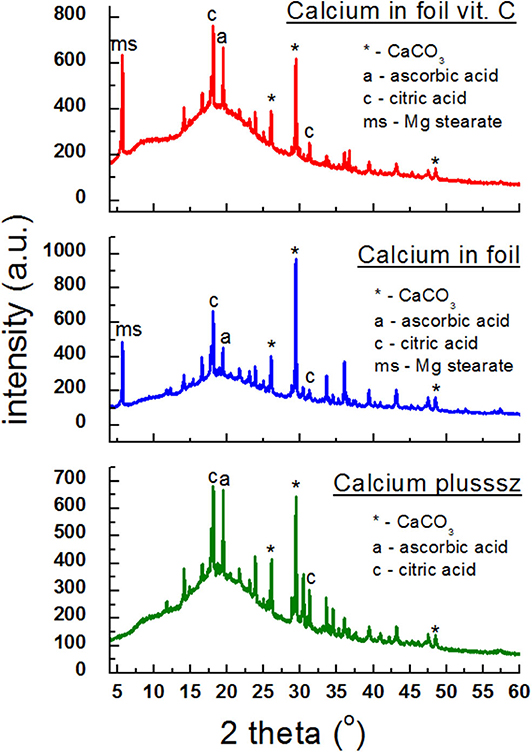
Figure 6. X-ray diffraction pattern for dietary supplements containing calcium carbonate (CaCO3) and ascorbic acid.
Table 5 presents a comparison of diffraction tests for the following dietary supplements: Calcium plusssz, Calcium in foil, Calcium in foil + vit.C. Comparison of experimental values of 2θ angles with the data from the ICDD database for calcium carbonate showed a very good accordance with the standard. The determined shifts Δ2θ of the peaks are significantly smaller than 0.2°. It proves that the same crystalline form of CaCO3 is present in these supplements, meaning that the tested sample is authentic.
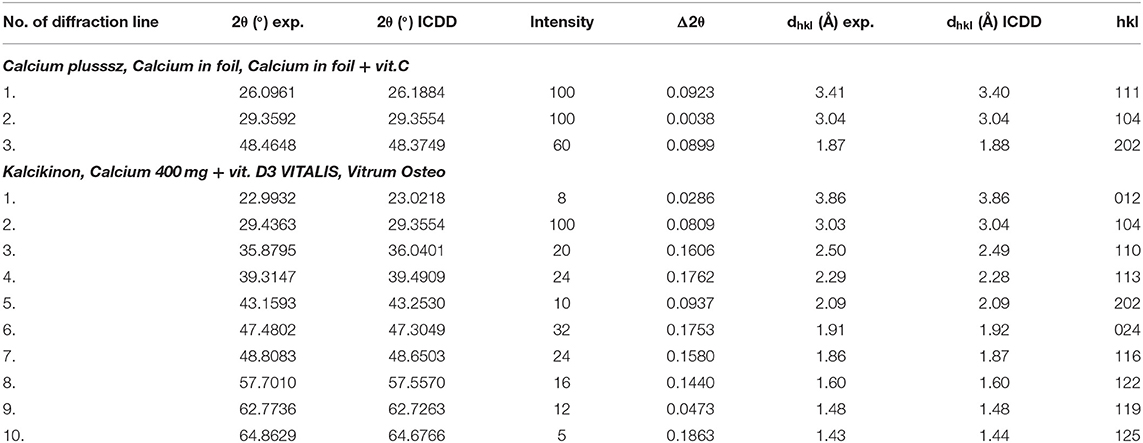
Table 5. Comparison of experimental data with the data from the ICDD database for the following dietary supplements: Calcium plusssz, Calcium in foil, Calcium in foil + vit.C, Kalcikinon, Calcium 400 mg + vit. D3 VITALIS, Vitrum Osteo (CaCO3 PDF 00–001–0837).
Figure 7 presents diffraction patterns of the next dietary supplements containing CaCO3. In the case of these three preparations, calcium carbonate is basically the sole component. Only diffraction lines from CaCO3 are present in the diffraction patterns (Figure 7). No lines from auxiliary substances (excipients) were found, indicating that the amounts of these substances are significantly lower than the detection limit or they are not present at all.
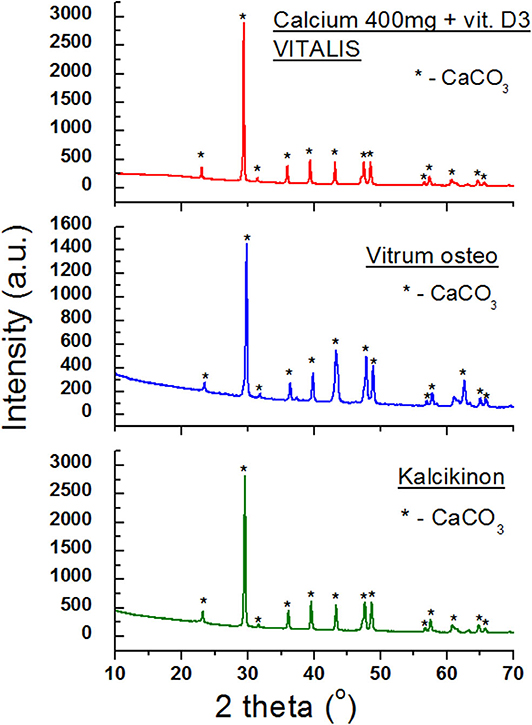
Figure 7. X-ray diffraction patterns for dietary supplements containing calcium carbonate CaCO3.
Analysis of values of 2θ angles read from the diffraction patterns is in a very good accordance with the data contained in the database, proving that the same crystalline variety of CaCO3 is present in all three products. This good accordance has been confirmed also by the determined Δ2θ difference, which does not exceed 0.2° (Table 5).
Figure 8A presents diffraction patterns of Calcium Alergo Plus and Calcium Gluconicum dietary supplements. According to the manufacturer's information, the active substance of Calcium Alegro Plus is constituted by a mixture of an organic and an inorganic calcium salt (calcium lactate and calcium carbonate). CaCO3 is the main component of this preparation; 7 diffraction lines of this compound were identified as having intensities concordant with the ICDD database. For calcium lactate, only one diffraction line with a low intensity was found. The highest intensity in the obtained diffraction pattern is exhibited by the line of SiO2, being a filler.
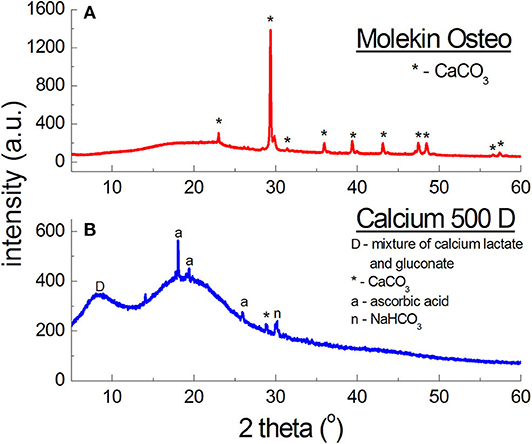
Figure 8. X-ray diffraction pattern for dietary supplements containing organic salts of calcium (A) and calcium carbonate CaCO3 and a mixture of organic salts of calcium (B).
Polycrystalline diffraction pattern of Calcium Gluconicum consists of many diffraction lines, which are difficult to identify (Figure 8A). These lines may originate from auxiliary substances not listed in the composition of this supplement. The active substance of Calcium Gluconicum is calcium gluconate. Diffraction lines of this component were identified in the diffraction pattern. On the other hand, the strongest visible diffraction line originates from starch.
For both supplements, Calcium Alergo Plus and Calcium Gluconicum, a very good accordance of experimental values of 2θ angles and the values of 2θ angles from the ICDD database is evident (Table 6). The determined values of Δ2θ are lower than 0.2°, proving the authenticity of the product.
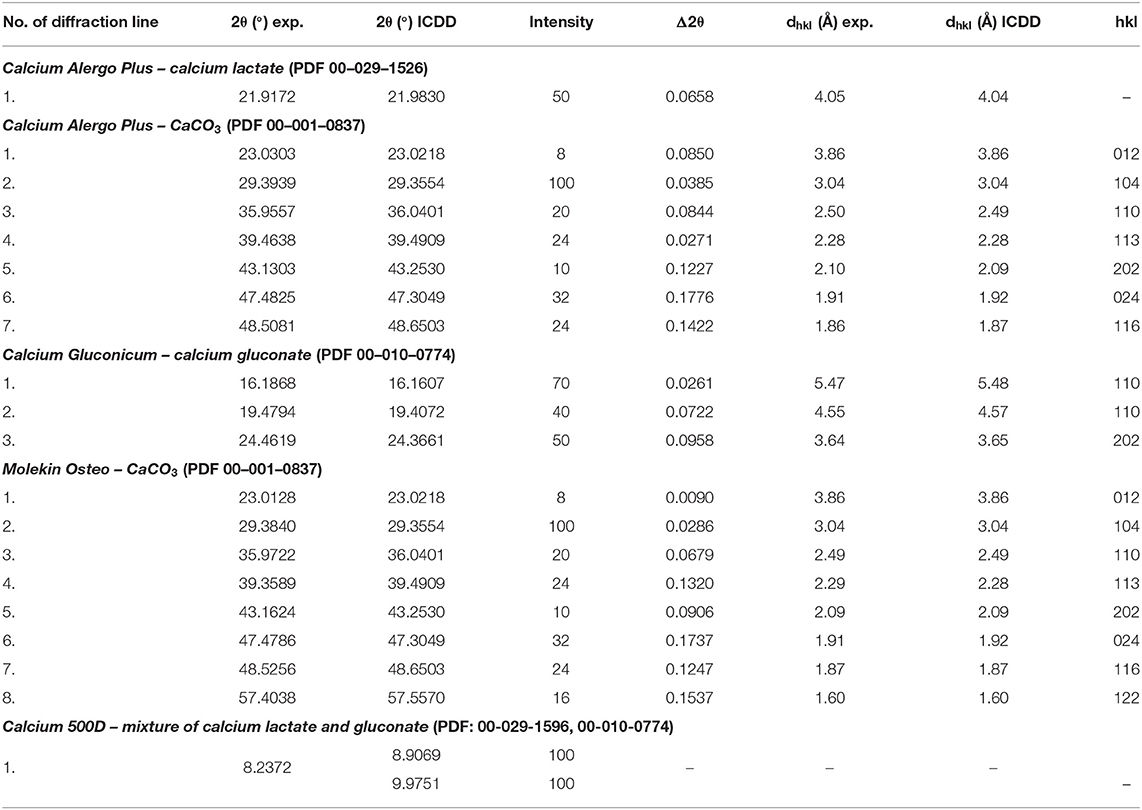
Table 6. Comparison of experimental data with the data from the ICDD database for the following dietary supplements: Calcium Alergo Plus, Calcium Gluconicum, Molekin Osteo, and Calcium 500D.
The diffraction pattern of Molekin dietary supplement (Figure 8B) contains lines of only CaCO3, however, the manufacturer declares also “calcium from seaweed” (in an unknown form). X-ray phase analysis clearly indicates presence of only calcium carbonate (CaCO3), similarly as in the preparations described in Table 6.
On the other hand, in Calcium 500D (Figure 8B) the source of calcium ions according to the manufacturer's claims, was constituted by calcium lactate gluconate, which could not be determined unequivocally in phase analysis. it is probable that a mixture of organic calcium salts: gluconate and lactate, form a broad diffraction peak with a maximum 2θ = 8.7190°, because the strongest line for calcium gluconate occurs at the angle of 2θ = 9.9751°, and for calcium lactate—at 2θ = 8.9521°.
The shape of the line, its width, and maximum value depend on the amounts of lactate and gluconate in this mixture. The manufacturer does not report these values. However, lines originating from calcium carbonate were identified in Calcium 500D, this compound likely being the main source of calcium ions in this preparation. Apart from the lines of CaCO3, peaks originating from citric acid, affecting the taste of the supplement, were identified. The manufacturer claims that 1 sachet contains 500 mg of calcium in the form of 3.875 g of calcium lactate gluconate, and 60 mg of ascorbic acid. X-ray analysis shows that the amount of calcium ions is significantly lower. It is proved by intensities of the lines originating from the mixture of calcium lactate and calcium gluconate, and the lines originating from CaCO3. With such a high amount of calcium ions, the diffraction lines should have higher intensities.
The comparative analysis results for Molekin Osteo presented in Table 6 confirm a very good accordance of the 2θ angle values read from the diffraction pattern with the data from the ICDD database. The determined Δ2θ values are smaller than 0.2°. It proves the authenticity of the Molekin Osteo preparation. Calcium 500D should be subject to further studies using other methods.
The X-ray diffractometric studies carried out for 22 commonly available dietary supplements containing calcium and magnesium allowed for ascertaining that the majority of the analyzed products contain appropriate calcium and magnesium compounds declared by the manufacturers in their specifications. Comparison of 2θ angle values at which the diffraction lines originating from calcium and magnesium compounds included into compositions of the tested dietary supplements were recorded, with the data from the ICDD database, showed a very good accordance. It indicates use of substances with the same structural parameters or substances being the same crystalline varieties. In most cases, the difference of 2θ angle values between the experimental data and those from the database is smaller than 0.2°. Abnormalities were found for two dietary supplements containing magnesium ions: Magnesium KFD Nutrition and 7 Nutrition Bomb Pre-workout.
For Magnesium KFD Nutrition, the sole visible diffraction line is shifted by more than 0.2° (Δ2θ = 0.3628), while for 7 Nutrition Bomb Pre-workout, no lines of the magnesium compound declared by the manufacturer (magnesium citrate) were identified.
In such a case, when the result of diffractometric analysis is ambiguous or raises some suspicions regarding the authenticity of the product, the tests should be repeated or the analysis expanded with other methods, e.g., IR, UV-Vis, chromatographic methods.
PXRD (Powder X-ray Diffraction) is a fundamental and the most frequently used technique for examination of medical preparations and plays an important role at all stages of pharmaceutical research and development. However, the best practice should consist in an approach in which the XRD studies will be combined with such methods as gas chromatography-mass spectrometry (GC-MS), high performance liquid chromatography (HPLC), Fourier transform infrared spectroscopy (FTIR), or synchrotron radiation (Rendle, 2019).
All datasets generated for this study are included in the article/supplementary material.
IJ was originator of the topic of this manuscript, who prepared all samples to X-ray analysis, who done these measurements and then worked out the results, and wrote the manuscript.
The author declares that the research was conducted in the absence of any commercial or financial relationships that could be construed as a potential conflict of interest.
1. ^https://serc.carleton.edu/research_education/geochemsheets/techniques/XRD.html (accessed September 06, 2020).
Chauhan, A., and Chauhan, P. (2014). Powder XRD technique and its application in science and technology. J. Analyt. Bioanalyt. Tech. 5:1000212. doi: 10.4172/2155-9872.1000212
Das, R., Eaqub Ali, M., and Abd Hamid, S. B. (2014). Current application of X-ray powder – a review. Rev. Adv. Mater. Sci. 38, 95–109.
DeWitt, K. M. (2015). X-ray powder diffraction method development and validation for the identification of counterfeit pharmaceuticals. Mater. Sci. 1–28.
Epp, J. (2016). “X-ray diffraction (XRD) techniques for materials characterization,” in Materials Characterization Using Nondestructive Evaluation (NDE) Methods, eds G. Huebschen, I. Altpeter, R. Tschuncky, and H. G. Herrmann (Rockville, MD: Woodhead Publishing), 81–124. doi: 10.1016/B978-0-08-100040-3.00004-3
Kugler, W. (2003). X-ray diffraction analysis in the forensic science: the last resort in many criminal cases. Adv. X-ray Analy. 46, 1–16.
Maurin, J. K., Pluciński, F., Mazurek, A. P., and Fijałek, Z. (2007). The usefulness of simple X-ray powder diffraction analysis for counterfeit control—the Viagra® example. J. Pharmac. Biomed. Analy. 43, 1514–1518. doi: 10.1016/j.jpba.2006.10.033
Rendle, D. F. (2019). “International tables for crystallography,” in Section 7.2.1.3.1. Drugs and Toxicology, Vol. H (Rockville, MD), 738.
Singh, S., Prasad, B., Savaliya, A. A., Shah, R. P., Gohil, V. M., and Kaur, A. (2009). Strategies for characterizing sildenafil, vardenafil, tadalafil and their analogues in herbal dietary supplements, and detecting counterfeit products containing these drugs. Trends Analyt. Chem. 28, 14–28. doi: 10.1016/j.trac.2008.09.004
Stephenson, G. A. (2005). Application of X-ray powder diffraction in the pharmaceutical industry. Rigaku J. 22, 2–15.
Stypułkowska, K., Błazewicz, A., Maurin, J., Sarna, K., and Fijałek, Z. (2011). X-ray powder diffractometry and liquid chromatography studies of sibutramine and its analogues content in herbal dietary supplements. J. Pharmac. Biomed. Analy. 56, 969–975. doi: 10.1016/j.jpba.2011.08.028
Thatcher, P. J., and Briner, G. P. (1986). The application of X-ray powder diffraction to forensic science. Powder Diffract. 1, 320–324. doi: 10.1017/S0885715600011994
USP Pharmacopeial Convention (2011). General <941> Characterization of Crystalline and Partially Crystalline Solids by X-Ray Powder Diffraction (Rockville, MD).
Venhuis, B. J., Vredenbregt, M. V., Kaun, N., Maurin, J. K., Fijałek, Z., and de Kaste, D. (2011). The identification of rimonabant polymorphs, sibutramine and analogues of both in counterfeit Acomplia bought on the internet. J. Pharmac. Biomed. Analy. 54, 21–26. doi: 10.1016/j.jpba.2010.07.043
World Health Organisation (2006). Counterfeit Medicines. Fact Sheet No. 275. Available online at: https://www.gphf.org/images/downloads/library/who_factsheet275.pdf (accessed January 26, 2020).
World Health Organisation (2018). Substandard and Falsified Medical Products. Available online at: http://www.who.int/en/news-room/fact-sheets/detail/substandard-and-falsified-medical-products (accessed February 4, 2020).
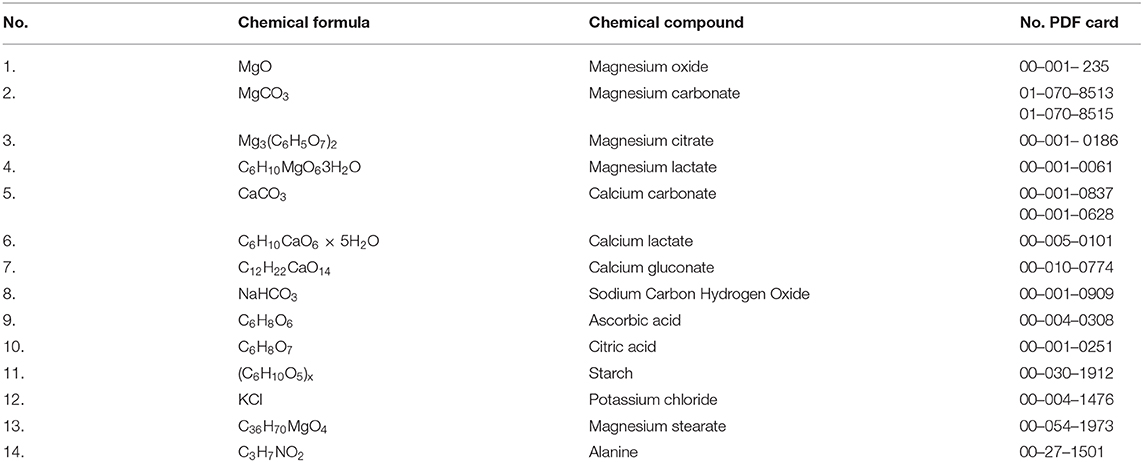
Table A1. List of used ICDD PDF2 (Release 2008) cards.
Keywords: dietary supplements analysis, counterfeit pharmaceutics, X-ray study, Bragg's low, diffraction data, X-ray phase analysis
Citation: Jendrzejewska I (2020) Application of X-Ray Powder Diffraction for Analysis of Selected Dietary Supplements Containing Magnesium and Calcium. Front. Chem. 8:672. doi: 10.3389/fchem.2020.00672
Received: 25 February 2020; Accepted: 29 June 2020;
Published: 30 September 2020.
Edited by:
Alberto Salomone, University of Turin, ItalyReviewed by:
Roberta Risoluti, Sapienza University of Rome, ItalyCopyright © 2020 Jendrzejewska. This is an open-access article distributed under the terms of the Creative Commons Attribution License (CC BY). The use, distribution or reproduction in other forums is permitted, provided the original author(s) and the copyright owner(s) are credited and that the original publication in this journal is cited, in accordance with accepted academic practice. No use, distribution or reproduction is permitted which does not comply with these terms.
*Correspondence: Izabela Jendrzejewska, aXphYmVsYS5qZW5kcnplamV3c2thQHVzLmVkdS5wbA==
Disclaimer: All claims expressed in this article are solely those of the authors and do not necessarily represent those of their affiliated organizations, or those of the publisher, the editors and the reviewers. Any product that may be evaluated in this article or claim that may be made by its manufacturer is not guaranteed or endorsed by the publisher.
Research integrity at Frontiers
Learn more about the work of our research integrity team to safeguard the quality of each article we publish.