
95% of researchers rate our articles as excellent or good
Learn more about the work of our research integrity team to safeguard the quality of each article we publish.
Find out more
ORIGINAL RESEARCH article
Front. Chem. Biol. , 18 March 2024
Sec. Molecular Sciences
Volume 3 - 2024 | https://doi.org/10.3389/fchbi.2024.1363498
This article is part of the Research Topic Bioluminescence and Fluorescence Molecular Imaging in Chemical Biology View all 6 articles
 Celeste Huaman1,2Caitlyn Clouse1,2Madeline Rader1,2Lianying Yan1,2
 Shuangyi Bai3
 Bronwyn M. Gunn3Moushimi Amaya1
 Eric D. Laing1
 Christopher C. Broder1*
 Brian C. Schaefer1*
Henipaviruses are enveloped single-stranded, negative-sense RNA viruses of the paramyxovirus family. Two henipaviruses, Nipah virus and Hendra virus, cause a systemic respiratory and/or neurological disease in humans and ten additional species of mammals, with a high fatality rate. Because of their highly pathogenic nature, Nipah virus and Hendra virus are categorized as BSL-4 pathogens, which limits the number and scope of translational research studies on these important human pathogens. To begin to address this limitation, we are developing a BSL-2 model of authentic henipavirus infection in mice, using the non-pathogenic henipavirus, Cedar virus. Notably, wild-type mice are highly resistant to Hendra virus and Nipah virus infection. However, previous work has shown that mice lacking expression of the type I interferon receptor (IFNAR-KO mice) are susceptible to both viruses. Here, we show that luciferase-expressing recombinant Cedar virus (rCedV-luc) is also able to replicate and establish a transient infection in IFNAR-KO mice, but not in wild-type mice. Using longitudinal bioluminescence imaging (BLI) of luciferase expression, we detected rCedV-luc replication as early as 10 h post-infection. Viral replication peaks between days 1 and 3 post-infection, and declines to levels undetectable by bioluminescence imaging by 7 days post-infection. Immunohistochemistry is consistent with viral infection and replication in endothelial cells and other non-immune cell types within tissue parenchyma. Serology analyses demonstrate significant IgG responses to the Cedar virus surface glycoprotein with potent neutralizing activity in IFNAR-KO mice, whereas antibody responses in wild-type animals were non-significant. Overall, these data suggest that rCedV-luc infection of IFNAR-KO mice represents a viable platform for the study of in vivo henipavirus replication, anti-henipavirus host responses and henipavirus-directed therapeutics.
Hendra virus (HeV) and Nipah virus (NiV) are members of the Henipavirus genus, which is part of the Paramyxoviridae family. Unlike other paramyxoviruses, HeV and NiV can infect a broad range of mammalian species, and infections with these viruses result in a high lethality rate (Luby and Broder, 2020). HeV and NiV were identified after being transmitted via intermediate hosts (horses in Australia and pigs in Malaysia, respectively) to humans (Murray et al., 1995; Chua et al., 2000). Subsequently, the natural reservoir for HeV and NiV was identified as the Pteropus species of bats (Clayton et al., 2013). Together, these viruses have been responsible for numerous outbreaks that have led to severe and highly lethal acute respiratory and neurological disease in humans, as well as the infection and subsequent destruction of large numbers of economically important livestock (Bishop and Broder, 2008; Luby et al., 2009; Broder et al., 2016). NiV is particularly concerning, as nearly annual outbreaks have occurred in Bangladesh and India since 2001, human-to-human transmission has been demonstrated, and human cases have a fatality rate, often >75% (Luby, 2013; Olatunji et al., 2023). As a result of their high mortality rate and lack of approved human vaccines or therapeutics, HeV and NiV are classified as Biosafety Level-4 (BSL-4) agents. Moreover, the World Health Organization (WHO) has included NiV in the list of priority pathogens with epidemic potential (Sweileh, 2017).
Since the identification of HeV and NiV, numerous additional henipaviruses have been discovered, primarily via nucleic acid sequencing (Caruso and Edwards, 2023; Li et al., 2023). Cedar virus (CedV) is a non-pathogenic henipavirus isolate that was identified in Pteropus bats in 2012 in Queensland, Australia during a routine screening of wild bats for novel henipaviruses (Marsh et al., 2012). Phylogenetic analysis demonstrates that CedV is the henipavirus that is most closely related to HeV and NiV, among currently known viruses in this genus. Notably, in comparison to HeV and NiV, the order of major CedV viral genes (nucleoprotein (N), phosphoprotein (P), matrix (M), fusion protein (F), glycoprotein (G) and large protein/polymerase (L)) in the genome is identical, and the length of the negative-sense genomic RNAs are nearly the same. Also, antibodies to CedV N cross-react with HeV and NiV N, demonstrating antigenic relatedness between these viruses (Marsh et al., 2012; Caruso and Edwards, 2023; Li et al., 2023). Remarkably, however, unlike nearly all characterized paramyxoviruses, the CedV phosphoprotein (P) gene does not undergo RNA editing to produce alternative proteins (which are V and W in the case of other henipaviruses and V in the case of non-henipavirus paramyxoviruses) (Marsh et al., 2012). In HeV and NiV, these proteins are responsible for antagonizing key elements of the innate antiviral response of infected cells (Shaw, 2009), and substantial evidence suggests that P, V and W are major determinants of HeV and NiV pathogenicity (Lieu et al., 2015). In particular, recombinant NiV variants lacking the V protein resulted in no clinical signs in productively infected hamsters (Yoneda et al., 2010), and a recombinant NiV lacking V resulted in a non-lethal productive infection in ferrets (Satterfield et al., 2015). Indeed, whereas HeV and NiV are highly pathogenic in humans and many other mammals, the testing of CedV in multiple mammalian species has shown that this henipavirus is non-pathogenic (Marsh et al., 2012; Schountz et al., 2019). Because CedV is non-pathogenic, it is categorized as BSL-2, meaning that this henipavirus can be studied much more easily than either NiV or HeV (which require BSL-4 containment facilities that are not accessible to most investigators).
To bind to and enter host cells, henipaviruses use the transmembrane envelope glycoproteins, G and F, respectively (Steffen et al., 2012; Bossart et al., 2013). The cognate cellular receptors for HeV and NiV G have been identified as ephrin-B2 and ephrin-B3 (Bonaparte et al., 2005; Negrete et al., 2005; Negrete et al., 2006; Bishop et al., 2007). Ephrin-B2 is expressed on endothelial cells and various other cell types across many tissues, whereas ephrin-B3 is primarily expressed on cells in the brain (Pasquale, 2008; Miao and Wang, 2009). The expression pattern of ephrin-B3 is presumed responsible for the CNS tropism of HeV and NiV (Negrete et al., 2006). In addition, the conserved homology of ephrin ligands contributes to their wide species tropism (Xu et al., 2012). CedV has a distinct cell tropism compared to HeV and NiV, due to the fact that the CedV G protein binds to a distinct array of host ephrin receptors, including ephrin-B1, ephrin-B2 and ephrin-A1, but not ephrin-B3 (Laing et al., 2019). The lack of ephrin-B3 usage by CedV may suggest that this virus is incapable of infecting the vertebrate brain (Negrete et al., 2006; Laing et al., 2019).
Recombinant forms of CedV (rCedV) that are genetically tagged with either green fluorescent protein (GFP) or firefly luciferase (luc) have proven very useful for in vitro studies, ranging from viral neutralization assays to novel anti-henipavirus drug discovery screens (Amaya et al., 2021; Amaya et al. 2023a; Amaya et al. 2023b). However, to date, the use of rCedVs for in vivo translational research has not been reported. Mouse models have proven extremely useful in the study of viral pathogenesis and countermeasure development. In particular, the availability of a wide array of labeled antibodies against phenotypic and functional markers of leukocytes and many other cell types has made the mouse the animal model of choice for defining host responses to many different viruses. Notably, despite a broad mammalian species tropism, initial investigations indicated that neither HeV nor NiV is capable of establishing a stable infection or causing pathogenesis in wild-type (WT) mice (Westbury et al., 1995; Wong et al., 2003). However, later work has shown that HeV (but not NiV) can establish an encephalitic infection in wild-type mice inoculated via the intranasal route, with efficiency depending on the age of animals and strain used (Dups et al., 2012; Dups et al., 2014; Edwards et al., 2023). To improve the efficiency of henipavirus infection in the mouse model, Dhondt et al., noting that type I interferon receptor knock-out (IFNAR-KO) mice had been used to support the replication of several human viruses that replicate poorly in WT mice, demonstrated that HeV and NiV can replicate and cause morbidity and mortality in IFNAR-KO mice with high efficiency (Dhondt et al., 2013). This work suggested that IFNAR-KO mice may represent a useful platform for the study of henipavirus in vivo biology, but it did not address the limitation of the requirement for BSL-4 containment to work with NiV and HeV.
Previously, we developed a BLI approach to monitor both longitudinal and positional information of lyssavirus replication in a mouse model (Mastraccio et al., 2020; Mastraccio et al., 2022). Employing a similar approach, in this study, we assessed the utility of combining luciferase-expressing rCedV (rCedV-luc) and IFNAR-KO mice as a BSL-2 model for the study of in vivo henipavirus replication dynamics and anti-henipavirus host responses. Using whole-animal BLI we were able to semi-quantitatively track the kinetics of viral replication in vivo in IFNAR-KO mice. The replication of rCedV-luc was robust for approximately 1 week in IFNAR-KO animals, whereas rCedV-luc replication was minimal in WT mice. PCR-based quantification of viral genomes in multiple tissues revealed a strong correlation between detected bioluminescence and absolute numbers of viral genomes. Although histopathological and serological analysis revealed that rCedV-luc could infect endothelial cells and some non-immune cells within organs of IFNAR-KO mice, none of the infected WT or IFNAR-KO animals displayed clinical signs of disease. Infection of IFNAR-KO mice resulted in significant levels of anti-Cedar G IgG that potently neutralized virus in vitro. Thus, rCedV-luc infection of IFNAR-KO mice represents a potentially useful BSL-2 in vivo system to study henipavirus replication dynamics and anti-henipavirus immune responses. This model may prove useful for the testing and initial validation of novel henipavirus-directed therapeutics.
VERO-E6 cells (ATTC CCL-81) were grown in Dulbecco’s Modified Eagle’s Medium (DMEM) (GE Healthcare Life Sciences) supplemented with 10% fetal bovine serum (FBS) (Sigma Aldrich) and 1% L-glutamine (Corning) at 37°C, 5% CO2.
Because melanin has been shown to attenuate bioluminescence in vivo (Sadikot and Blackwell, 2008), we used albino mice (which lack melanin in the hair, skin, and eyes) for all imaging experiments reported in this study. Female B6 (cg)-Tyrc−2J/J (B6 albino) (RRID: IMSR_JAX: 000058) and male Type I IFN Receptor Knock-out (IFNAR-KO) mice (RRID: IMSR_JAX: 028288) were obtained from Jackson Laboratories. These strains were bred to yield heterozygous F1 animals which were then intercrossed for several additional generations at Charles River Laboratories (Wilmington, MA) to generate albino mice that were homozygous for IFNAR-KO (albino IFNAR-KO). All mice were 6–7 (±1) weeks old and weighed 20 (±4) grams. All albino B6 animals used for experiments were female, whereas albino IFNAR-KO animals were a mix of males and females. All animal experiments were performed in the Uniformed Services University (USU) specific pathogen free animal facility under ABSL-2 conditions. Mouse feed was PicoLab® Verified 75 IF (Land O’ Lakes, Inc.), and mouse bedding was Beta Chip (Northeastern Products Corp.). Study approval was granted by the USU Institutional Animal Care and Use Committee (IACUC) (protocol number MIC-21-046) and the USU Institutional Biosafety Committee.
rCedV-luc was amplified as described (Amaya et al. 2023a), with modifications. Vero-E6 cells were seeded at a density of 6 × 10⁶ cells/flask in nine T175 cm2 flasks and incubated overnight at 37°C, 5% CO2. Cells were infected with rCedV-luc at an MOI of 0.001. Two to 3 days post-infection, when 90% cell death was observed, supernatant was clarified by centrifugation (2,400 rpm; 10 min) and virus supernatant was purified by ultracentrifugation (28,000 rpm; 2 h) through a 20% sucrose cushioned buffer. After purification, viral pellets were combined and resuspended in 10% sucrose TNE buffer, ∼50uL aliquots were made, and the viral stock was frozen and stored at −80°C. The following day, one aliquot was thawed and used for titer determination. Viral stocks were used for these experiments within 6 months of freezing. Viral titer was determined by a CPE-based plaque assay, where the rCedV-luc stock was serially diluted and incubated with Vero-E6 cells for 72 h. Briefly, 500 μL/well of virus inoculum was added to Vero-E6 cells (5 × 10⁵ cells/well) in 12-well cell culture plates and incubated for 1 h at 37°C, 5% CO2. A 2 mL overlay of a 1:1 mix of DMEM supplemented with 5% heat-inactivated FBS and 1% L-glutamine with 2% carboxymethylcellulose sodium salt (medium viscosity) (Sigma-Aldrich) was added to each well and incubated for 5 days at 37°C, 5% CO2. The cells were fixed with 4% paraformaldehyde for 1 h at room temperature and then stained with 0.5% crystal violet solution (80% methanol) in 1× phosphate buffered saline (1×PBS). Plaques were counted to determine infectious viral titers as plaque forming units (PFU) per mL.
For in vivo studies, albino B6 mice and albino IFNAR-KO mice (n = 4 to 5 per group) were individually placed in an isoflurane induction chamber, and isoflurane was administered with a vaporizer at 2–4% and at a flow rate of 2.0 L/min until mice lost consciousness. Mice were then inoculated intraperitoneally with 107 PFU of virus in 0.2 mL or with an equivalent volume of DMEM (mock-infected). Mouse weights were recorded on the same day as each imaging session.
Prior to imaging, mice were placed in an isoflurane induction chamber and isoflurane was administered with a vaporizer at 2–4% and at a flow rate of 2.0 L/min until mice lost consciousness. Mice then received intraperitoneal injections of D-Luciferin, Potassium Salt (Gold Biotechnology, Inc., Cat# LUCK1G). D-luciferin was prepared in sterile DPBS at 15 mg/mL and each mouse received 150 mg D-luciferin/kg body weight in a volume of 200 μL. Mice were placed in their cages and allowed to rest for 10 min. To generate reproducible data among individual mice over several days, the above timing was used in all experiments to standardize imaging data. Immediately prior to imaging, mice were placed in the induction chamber (2–4% isoflurane; flow rate of 2.0 L/min) until loss of consciousness before being transferred to the PE IVIS Spectrum CT (Perkin Elmer).
To ensure accurate collection of data for long-exposure bioluminescence imaging, mice must be anesthetized to minimize movement during each imaging session. Thus, mice were continuously administered isoflurane via a nose cone inside of the PE IVIS Spectrum CT (0.5–3% isoflurane; flow rate of 2.0 L/min). Mice were imaged for a maximum of 1 min to collect luminescence overlay images. After being imaged, mice were returned to their cages and monitored until they maintained an upright position and could walk normally. Living Image software (Perkin Elmer) was used to standardize luminescence intensity scales for all groups of mice. Living Image was also used to generate regions of interest (ROIs) around the chest or the whole body of the mouse. ROIs were then used to measure average radiance (p/s/cm2/sr) values from these anatomical sites. Images were cropped using Adobe Photoshop.
Mice were euthanized at the indicated times post-infection and tissues were collected. Tissues were processed for total RNA using Trizol (Invitrogen, Cat# 15596026) and a bead homogenizer (Bullet Blender 5 Gold, Next Advance, Inc.).
A set of standards for quantitative real-time PCR (qRT-PCR) was generated by adding defined quantities of linear CedV-N or CedV-F-G DNA molecules to 1 μg of total cDNA from uninfected mouse brains. The following formula was used to determine numbers of copies of CedV plasmid DNA fragments: (X ng × 6.0221×10²³ molecules/mole)/((Y bp × 660 g/mole) × 1×10⁹ ng/g). Analysis of these standards by RT-PCR revealed a linear relationship between log copy number and cycle number from 101 to 106 copies of CedV-N and CedV-F-G. Thus, as few as 10 copies of positive-sense CedV N sequences and negative-sense CedV genome transcripts per μg of total RNA could be reliably detected. N was chosen as the target for quantification of positive sense RNAs because N is the most abundantly transcribed viral gene (Kingsbury, 2012). To quantitatively measure these transcripts in tissue of rCedV-luc-infected animals and to discriminate transcriptionally active virus from inactive viral particles, we employed a recently described strategy (Jensen et al., 2018). Briefly, we prepared cDNA using specific primers to reverse-transcribe positive sense N RNA (which includes both N-encoding RNA transcripts and full-length antigenomes) (5′-CTCAAGACCGAACTTTATTGTA-3′) and the negative sense F/G intergenic region of the viral genome (5′- GCAAAGCCAGTAAGAGTAACA-3′). TaqMan real-time PCR primer sets were designed using the IDT RealTime qPCR Assay design tool. For N, primers were sense, 5′-ACATGAGATCCCTGATTGCG-3’; antisense, 5′-TGCCATTCCTGTCTCTTCAAC-3’; probe, 5′-CCCCGTCCTTTCTTAGCTTCCATCA-3’. For the F-G intergenic region of genomes, primers were sense, 5′-GGATTACCTCACTATCACTACCAAG-3’; antisense, 5′-AGGGATACTCTGGGATCCTAAG-3’; probe, 5′-TTCCATGTAAGATCGGACCTTCCCC-3’. See Supplementary Figure S1 for details regarding primer locations and RNA species detected. All primers and probes were purchased from IDT. Probes were labeled with FAM and the ZEN/Iowa Black FQ double-quencher. A BioRad CFX Connect instrument was used for all qRT-PCR assays and data were collected and quantified using Bio-Rad CFX Maestro software. The calculated efficiencies of each PCR for amplification of the qRT-PCR standards that were used to generate the standard curve were: CedV N amplification efficiency = 94.35%, standard curve R2= 0.999; CedV F/G amplification efficiency = 96.46%, standard curve R2= 0.995.
Mice at experimental endpoints were euthanized via overdose with ketamine (100 mg/kg) and xylazine (10 mg/kg), injected IP in a volume of 300 μL/10 g. Following cessation of all vital signs, tissues from infected mice were harvested and fixed with 4% Paraformaldehyde for 24 h, then soaked with 18% sucrose overnight at 4°C. Liver and kidney were embedded in OCT compound (Fisher Healthcare), flash frozen on dry ice, and 18-µm sections were cut using a Leica CM1850 UC Cryostat (Leica Biosystems). Tissue sections were treated with 2% Paraformaldehyde for 15 min at room temperature and blocked with 10% FBS for 1 h at room temperature. To detect CedV, sections were stained with mouse anti-CedV N (clone 1D5, 1:10, generated by GenScript Biotech (Piscataway, NJ) via contracted production) overnight at 4°C, followed by washing and secondary staining with Alexa Fluor 647 goat anti-mouse IgG2a (Thermo Fisher cat #A-21241, 1:1000) for 1 h at ambient temperature. Sections were also co-stained with Alexa Fluor 594 mouse anti-CD31 (clone MEC13.3, 1:500, Biolegend, cat #102520) to detect endothelial cells, APC mouse anti-CD45 (clone 30-F11, 1:100, Biolegend, cat #103111) to detect leukocytes and with DAPI (0.5 μg/mL; Thermo Fisher cat #D1306). Images were obtained on a Zeiss Axio Scan. Z1 slide scanner using Zen software (Carl Zeiss Microscopy, LLC, White Plains, NY).
Mice at experimental endpoints (21–23 days post-infection) were euthanized via overdose with ketamine (100 mg/kg) and xylazine (10 mg/kg), injected IP in a volume of 300 μL/10 g, followed by terminal bleed to collect blood. Blood samples were centrifuged (2,000 × g for 10 min at 4°C) after clotting to separate serum, and used for the following assays: Determination of antigen-specific antibody reactivity: Recombinant CedV soluble G (sG) was coupled to MagPlex beads (BioRad) via sulfo-NHS coupling chemistry, following the manufacturer’s recommended protocol. Mouse serum samples were diluted 1:100 or 1:50 in 1× PBS + 0.1% Tween 20 and incubated with antigen-coupled beads for 2 h. Beads were washed 3× with 1× PBS + 0.1% Tween 20, followed by incubation with PE-conjugated secondary antibodies specific for mouse total IgG (Southern Biotech 1031-09), IgG1 (Southern Biotech 1144-09), IgG2b (Southern Biotech 1186-09), IgG3 (Southern Biotech 1191-09), and IgM (Southern Biotech 1020-09S) at 1 μg/mL in 1× PBS + 0.1% Tween 20 for 1 h at room temperature. Beads were washed and analyzed on a Luminex MagPix instrument (Luminex). The median fluorescent intensity of 50 beads/region was recorded. Virus neutralization assay: CedV neutralizing antibodies were assayed using serial 2-fold dilutions of serum. Briefly, Vero-E6 cells were seeded at a density of 2 × 10⁴ cells/well in a black walled clear bottom 96-well plate (Corning Life Sciences) and incubated for 24 h at 37°C, 5% CO2. Serum from infected animals was heat inactivated for 30 min at 60°C and then serially diluted with DMEM such that sera was at a starting dilution of 1:50. An equal volume of DMEM containing rCedV-GFP was added to each dilution for a final MOI of 0.01, followed by incubation for 2 h at 37°C, 5% CO2. The virus-sera mix was added to the pre-seeded Vero-E6 cells in duplicate for 24 h at 37°C, 5% CO2. The plate was fixed with 4% Paraformaldehyde for 20 min at room temperature. The plates were washed 2 times with 1× PBS and imaged using a CTL S6 analyzer (Cellular Technology Limited). Relative neutralizing titers are defined as the reciprocal dilution of the last serum sample that completely inhibited formation of fluorescent foci. Titers reported as 1:25 represent no neutralization observed for that serum sample.
For Figure 1D, p values for the difference in mean between albino B6 and albino IFNAR-KO mice were calculated using the Kolmogorov-Smirnov test. To generate Figures 2A, D simple linear regression analysis was used. For Figures 4, 5; Supplementary Figure S5, p values for differences in means between indicated groups were calculated using the Kruskal-Wallis test, with Dunn’s correction for multiple comparisons. All graphs and statistics were generated using Graphpad Prism v.9 or v.10.
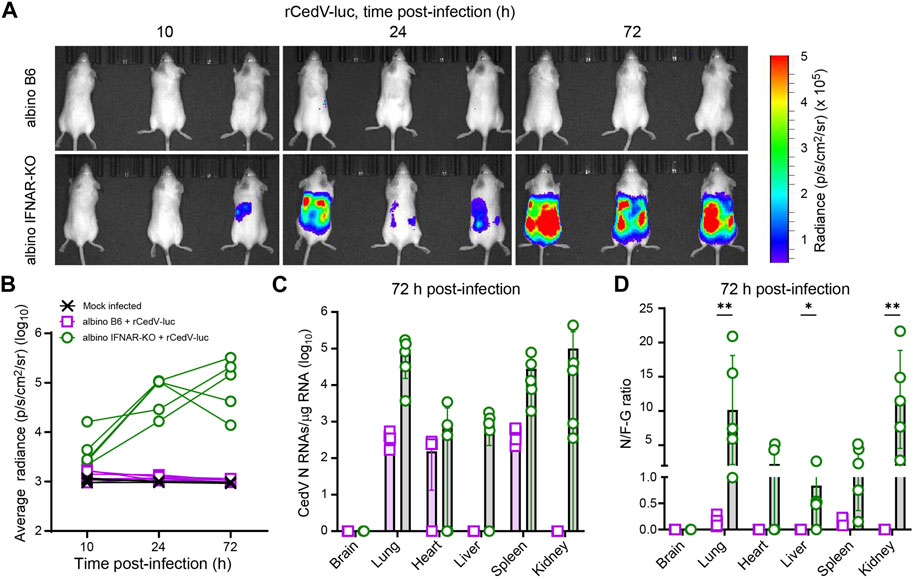
Figure 1. Longitudinal BLI, comparing efficiency of rCedV-luc infection in albino B6 vs. albino IFNAR-KO mice. Mice were mock infected or infected with 107 PFU of rCedV-luc via the I.P. route. (n = 3 mock infected albino B6 females; 5 infected albino B6 females; 5 infected albino IFNAR-KO females). (A) BLI data (pseudocolor intensity) overlaid on brightfield images of animals (dorsal view), analyzed at the indicated time points. The same three animals in the same right-to-left order are shown at each time point. See Supplementary Figure S2 for images of animals not in this panel. (B) Quantification of BLI data (whole-body average radiance) for each animal. (C) qRT-PCR-based quantification of N positive-sense RNAs from the indicated organs, reported as absolute number of N RNAs per µg of total RNA. (D) Ratio of N positive-sense RNAs to F-G junctional negative-sense RNAs for the indicated organs. The Kolmogorov-Smirnov test was used to calculate p-values for the indicated comparisons (brain, p >0.999; lung, p = 0.008 for; heart, p = 0.167; liver, p = 0.048; spleen, p = 0.08; kidney, p = 0.008). See Table 1 for per animal numerical values graphed in (C) and (D). Error bars in (C) and (D) are SD.
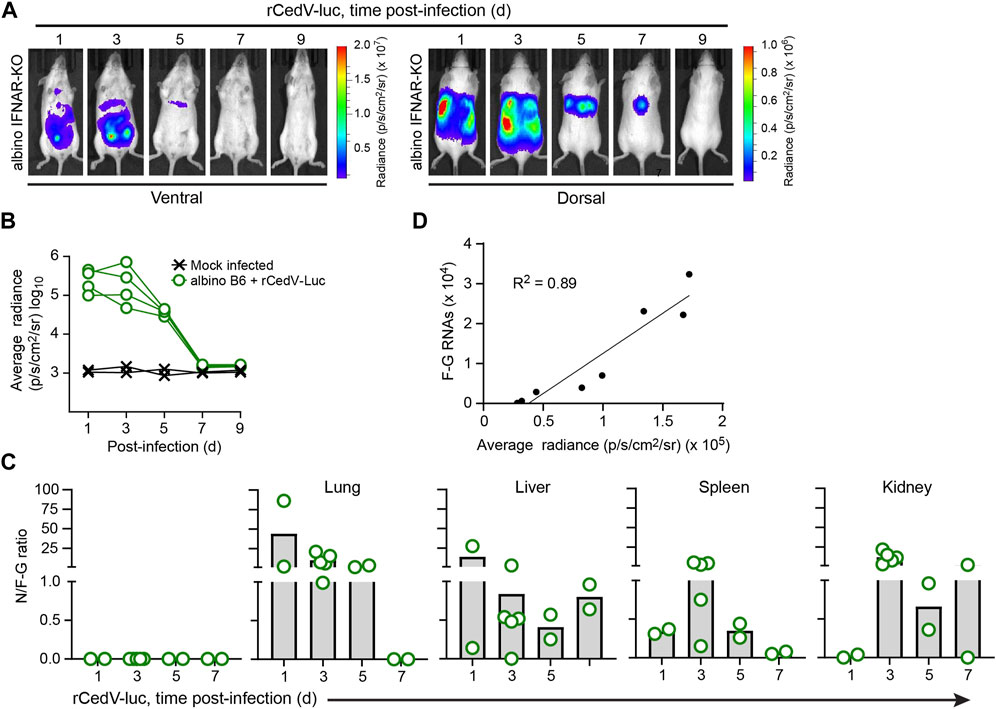
Figure 2. Kinetic analysis of rCedV-luc infection in albino IFNAR-KO mice. Albino IFNAR-KO mice were mock-infected or infected with 107 PFU of rCedV-luc via the I.P. route. (A) BLI data (pseudocolor intensity) overlaid on brightfield images of a representative animal, analyzed at the indicated time points. Ventral and dorsal views of the same animal are shown at each time point. (B) Quantification of BLI data (whole-body average radiance) for each animal. (n = 2 mock infected females; four infected females for (A, B)). (C) Ratio of N positive-sense RNA to F-G junctional negative-sense RNAs for the indicated organs (day 1, n = 2 males; day 3, n = 5 females; day 5, n = 2 females, day 7, n = 2 males). See Table 2 for per animal numerical values used to derive data for (C). (D) Simple linear regression analysis of the relationship between rCedV-luc copy number in the lungs (determined via qRT-PCR) and average radiance in the chest region (determined via BLI); r2 = 0.89.
To determine whether or not wild-type mice or mice deficient in interferon signaling can support efficient rCedV-luc replication, we infected albino C57BL/6 (albino B6) and albino IFNAR-KO mice with 107 PFU of rCedV-luc via intraperitoneal (I.P.) injection. Albino IFNAR-KO mice had detectable levels of rCedV-luc replication as early as 10 h post-infection, with levels of luminescence increasing by 24 h and still robustly detected at 72 h post-infection. By contrast, albino B6 mice did not have detectable levels of luminescence signal at any time point, with the possible exception of 10 h post-infection, at which time only a very weak signal was detected, barely distinguishable from background (Figure 1A, Supplementary Figure S2). By day 3 post-infection, all of the albino IFNAR-KO animals exhibited clear signal through the majority of the body, from the neck to the base of the tail, indicative of viral spread to multiple organs. Quantification of luminescence intensity yielded data consistent with qualitative analysis of the images. Specifically, the bioluminescence signal from the albino B6 animals was indistinguishable from the mock infected group, whereas rCedV-luc replication in most IFNAR-KO animals was distinct from uninfected controls by 10 h and had increased in all animals by 24 h, with signal remaining clearly above background at 72 h (Figure 1B).
To quantitatively determine viral RNA transcripts on a per-organ basis, we collected tissues at 72 h post-infection and analyzed total RNA by quantitative real-time PCR (qRT-PCR). For these experiments, we employed a primer set to detect positive-sense viral N RNAs, which detects a combination of N transcripts and positive sense anti-genomes (Figure 1C; Table 1; Supplementary Figure S1). These data confirmed the lack of detected rCedV-luc replication in the brains of both albino B6 and albino IFNAR-KO animals. N RNAs were detected in the lungs, spleens and kidneys of all albino IFNAR-KO animals, and in the hearts and livers of 4/5 of albino IFNAR-KO animals. By contrast, no N RNAs were detected in the livers and kidneys of albino B6 animals, whereas N transcripts were detected in the lungs, hearts and spleens of some of the albino B6 animals, but generally at lower levels and at lower frequency than in the albino IFNAR-KO mice (Figure 1C).

Table 1. Per tissue qRT-PCR quantification of N RNAs, F-G RNAs and the N/F-G ratio from each albino B6 and albino IFNAR-KO animal, 72 h post-infection.
Because the bioluminescence imaging indicated that rCedV-luc replication was not occurring (or was occurring at very low levels) in albino B6 mice, we reasoned that the N RNA species detected by qPCR might represent non-replicating viral particles trapped in the vasculature of tissues upon euthanasia. We therefore designed a second primer set to detect negative-sense genomes at the F-G junction (see Materials and Methods and Supplementary Figure S1). By this methodology, if rCedV-luc genomes are actively transcribed, the RNA copies per µg of total positive-sense RNA detected by the N probe set would be greater than the RNA copies per µg of total RNA detected by the negative sense F-G probe set. Alternatively, if most or all viral particles were non-replicating, the abundance of RNAs detected by the N probe set would be less than the abundance of RNAs detected by the F-G probe set. Using this approach, we plotted CedV RNA as a ratio of N RNAs/F-G RNAs (N/F-G), where a ratio > 1 represents a majority of replicating virus and a ratio < 1 represents a majority of non-replicative virus. Consistent with imaging, all of the albino B6 animals had a majority of non-replicative virus in all of the sampled tissues (Figure 1D). By contrast, most albino IFNAR-KO animals had replicating virus in all of the sampled organs (with the exception of brain tissue) at 72 h post-infection. Overall, we concluded that albino IFNAR-KO mice support robust replication of rCedV-luc over at least the first 72 h post-infection, whereas albino B6 mice fail to support rCedV-luc replication.
To assess the replication kinetics of rCedV-luc in albino IFNAR-KO mice, we performed longitudinal BLI after I.P. challenge with 107 PFU of virus. BLI was performed on infected animals every other day from day 1 until day 9. This analysis revealed that rCedV-luc replication peaks between day 1 and day 3 post-infection (Figures 2A,B; Table 2, Supplementary Figure S3). By day 5, the BLI signal had decreased relative to the day 3 value in all animals, with the whole-body bioluminescence signal declining to levels similar to mock infected animals by day 7 post-infection (Figures 2A,B; Table 2, Supplementary Figure S3). To confirm the viral kinetics determined by BLI, we collected tissues on days 1, 3, 5, and seven post-infection and analyzed total RNA by qRT-PCR. This analysis demonstrated that rCedV-luc replication in each organ followed a kinetic generally similar to the detected whole-body bioluminescence intensity, with replication (as assessed by the N/F-G ratio) decreasing after day 3 post-infection (Figure 2C; Table 2).
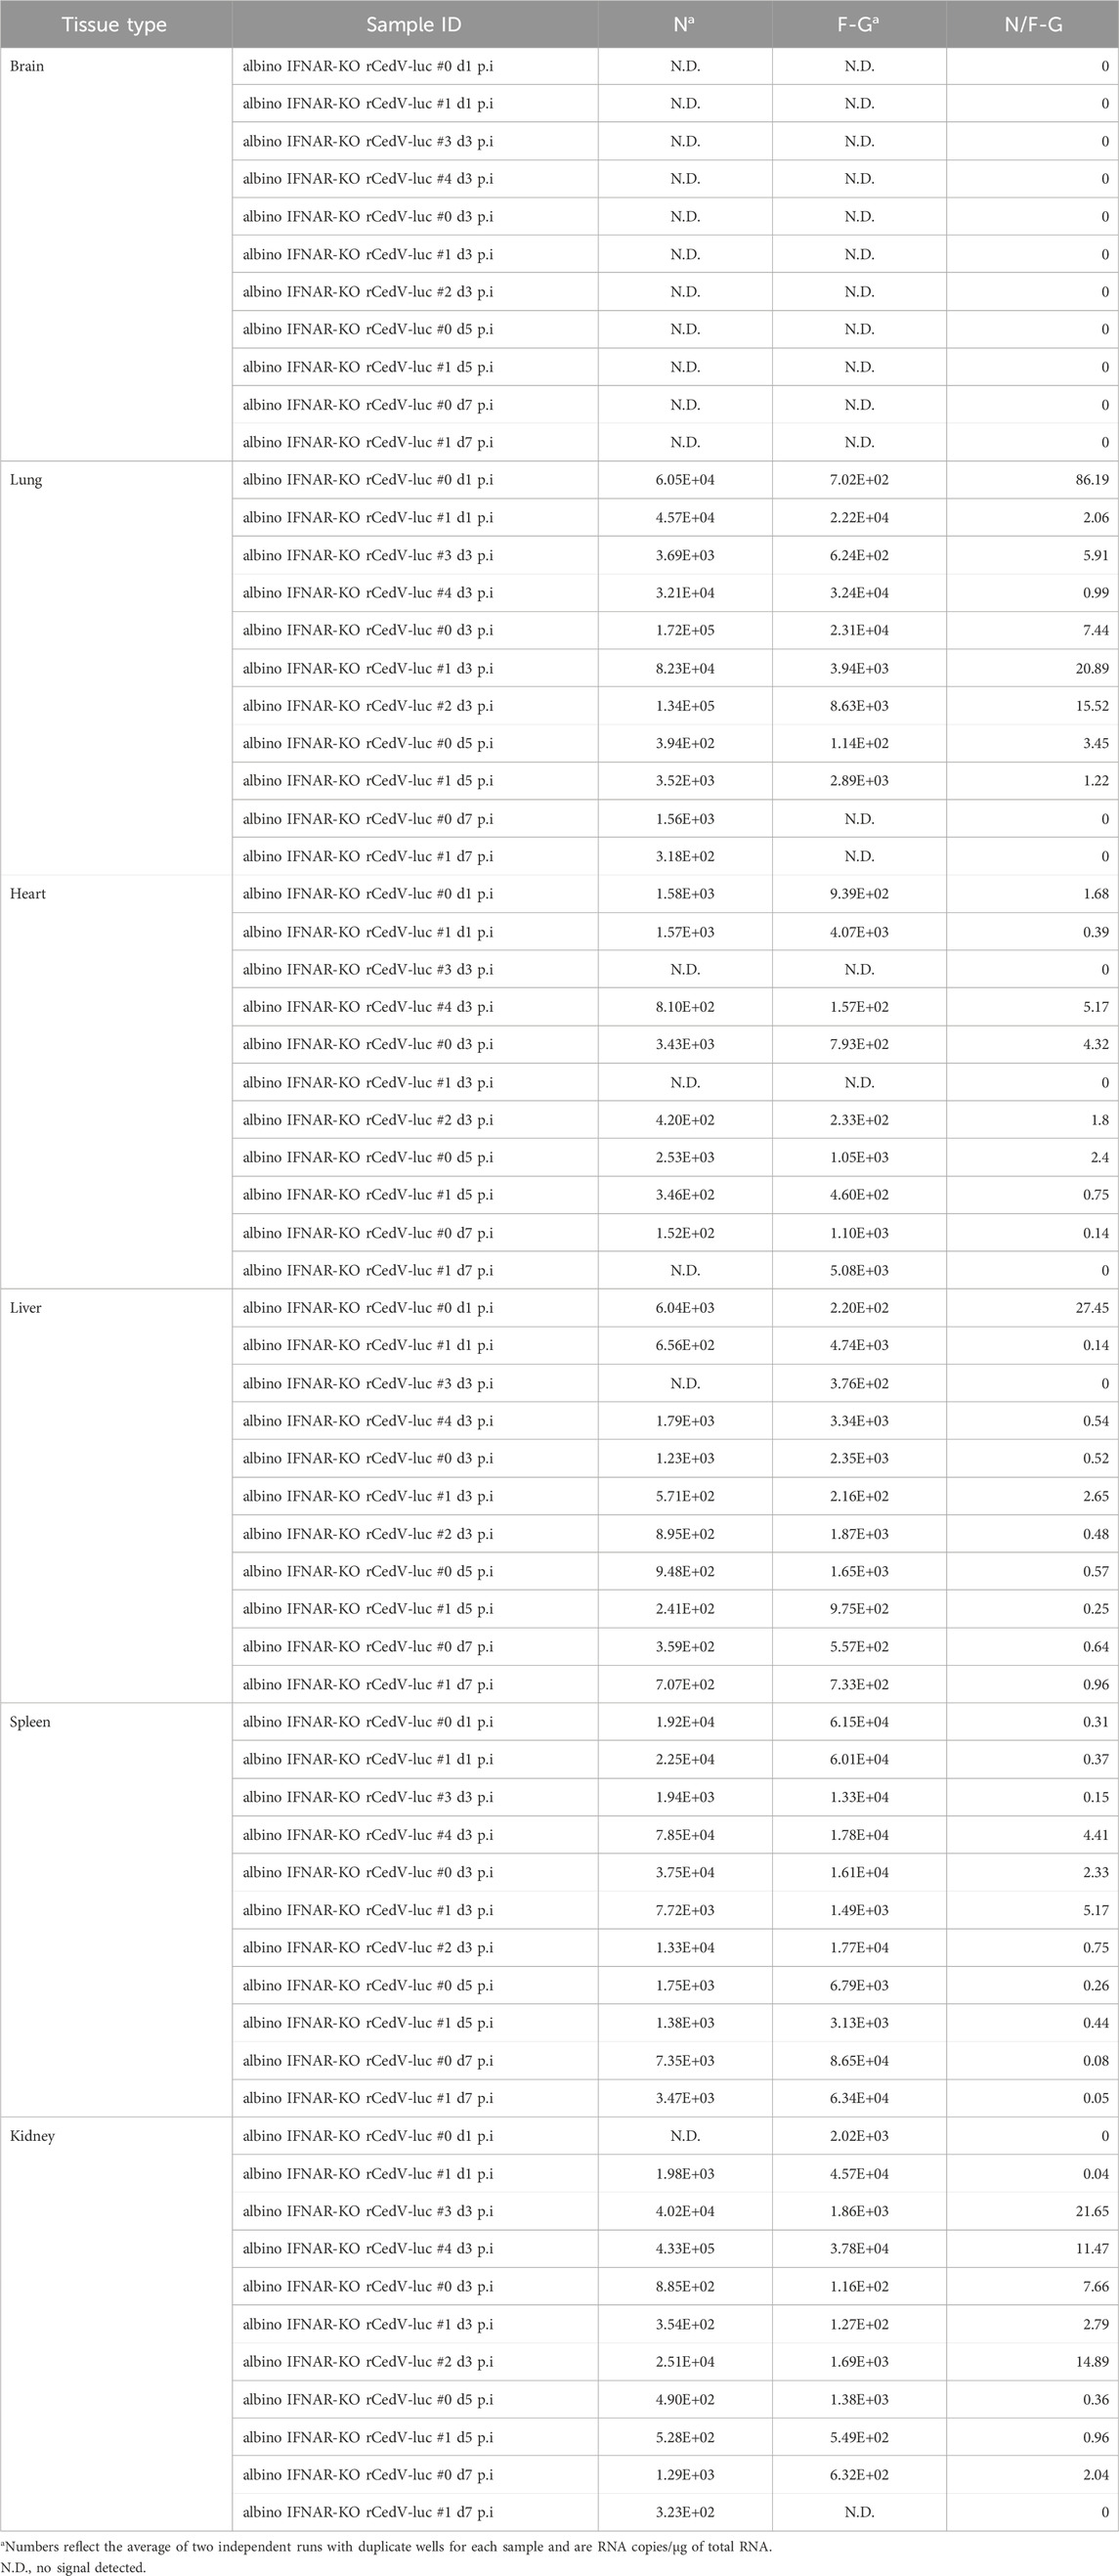
Table 2. Per tissue qRT-PCR quantification of N RNAs, F-G RNAs and the N/F-G ratio from albino IFNAR-KO animals, days 1–7 post-infection.
To determine whether BLI data collected from rCedV-luc-infected mice could be used as an accurate semi-quantitative measurement of viral replication, bioluminescent signal quantified from the chest of infected albino IFNAR-KO animals and the number of rCedV-luc genome copies (determined by F-G qRT-PCR of RNA harvested from lung tissue) were graphed on an X-Y plot for each animal. Linear regression analysis showed a high correlation (R2 = 0.89) between luminescence intensity and rCedV-luc genome copy number (Figure 2D). These data demonstrate that BLI can be used as a reliable semi-quantitative method to define the kinetics of in vivo rCedV-luc replication.
To begin to identify specific cell types that are infected with rCedV-luc, we used liver and kidney from albino IFNAR-KO and albino B6 animals on day 3 post-infection for immunohistochemistry (Figures 3A, B). To identify rCedV-luc-infected cells, we employed a monoclonal antibody that recognizes the Cedar virus N protein. We also included anti-CD31 to identify endothelial cells, anti-CD45 to identify leukocytes and DAPI to stain nuclear DNA. Fluorescence microscopy revealed that rCedV-luc efficiently infects endothelial cells from both tissues in albino IFNAR-KO mice, whereas more sporadic endothelial cell infection with lower levels of N protein were detected in albino B6 animals (Figures 3A,B). By contrast, we found no evidence of rCedV-luc infection of leukocytes in the liver or kidney in either strain at this time point. Additionally, clear infection of parenchymal cells in the kidney was observed in albino IFNAR-KO mice, but little evidence of parenchymal cell infection was detected in albino B6 mice (Figure 3B). Thus, rCedV-luc infects endothelial cells in the liver and kidney, as well as other non-leukocyte cell types in the kidney. Consistent with the BLI and qRT-PCR results, immunohistochemistry revealed strong evidence of infection and viral replication in tissues of the albino IFNAR-KO strain, while infection was much less evident in the albino B6 strain.
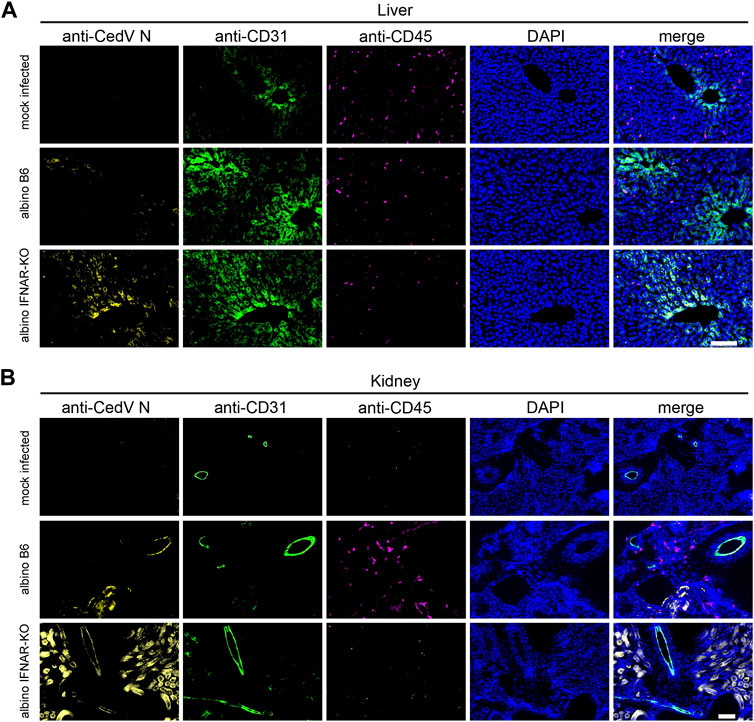
Figure 3. Immunohistochemistry to identify cell types infected by rCedV-luc. Fixed, frozen tissue sections of (A) liver and (B) kidney were stained with DAPI and monoclonal antibodies directed against CedV N, CD31 (endothelial cell marker) and CD45 (leukocyte marker). Representative sections are shown. Bar in (A, B), 100 µm.
At 21 days post-infection, infected albino B6 mice and albino IFNAR-KO mice were euthanized for a terminal blood draw, and sera were recovered for the analysis of antibodies specific for Cedar virus G. Albino IFNAR-KO animals exhibited very similar titers of total IgG directed against the surface G protein, and the response across this group was significantly different from the mock-infected controls (Figure 4; Table 3). Levels of tested IgG subtypes (IgG1, IgG2b and IgG3) were also significantly above background signal from the mock-infected control animal sera. By contrast, although some albino B6 animals had levels of anti-G total IgG and IgG subtypes that were comparable to levels detected in albino IFNAR-KO mice, there was much more variance in antibody responses across this group, and the aggregate signal was not significant with respect to the mock-infected controls. For both strains, levels of IgM detected were low, and the amounts did not differ significantly from the mock-infected animals (Figure 4; Table 3).
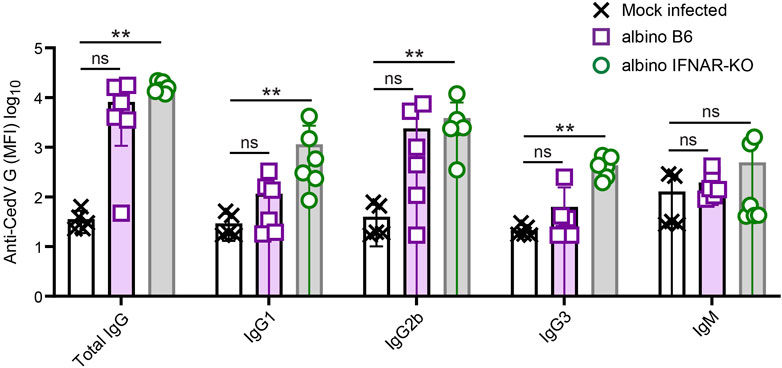
Figure 4. Analysis of anti-CedV G responses in rCedV-luc-infected albino B6 and albino IFNAR-KO mice. Mice were mock-infected or infected with 107 PFU of rCedV-luc via the I.P. route. (n = 5 mock-infected IFNAR-KO females; six infected albino B6 females; six infected albino IFNAR-KO (2 females, four males)). Blood was collected via terminal bleed at day 21 post-infection, and analyzed for CedV G reactivity using a Luminex bead-based assay. Isotype/subtype-specific antibodies were used to semi-quantitatively assess amounts of total IgG, IgG1, IgG2b, IgG3 and IgM. See Table 3 for per animal numerical values. The Kruskal-Wallis test with Dunn’s correction for multiple comparisons was used to determine significance in comparisons between albino B6 vs. mock and albino IFNAR-KO vs. mock. For mock-infected vs. albino B6, p values were: Total IgG, 0.069; IgG1, 0.436; IgG2b, 0.111; IgG3, >0.999; IgM, 0.265. For mock-infected vs. albino IFNAR-KO, p values were: Total IgG, 0.002; IgG1, 0.005; IgG2b, 0.0098; IgG3, 0.006; IgM, 0.731. Error bars are SD.
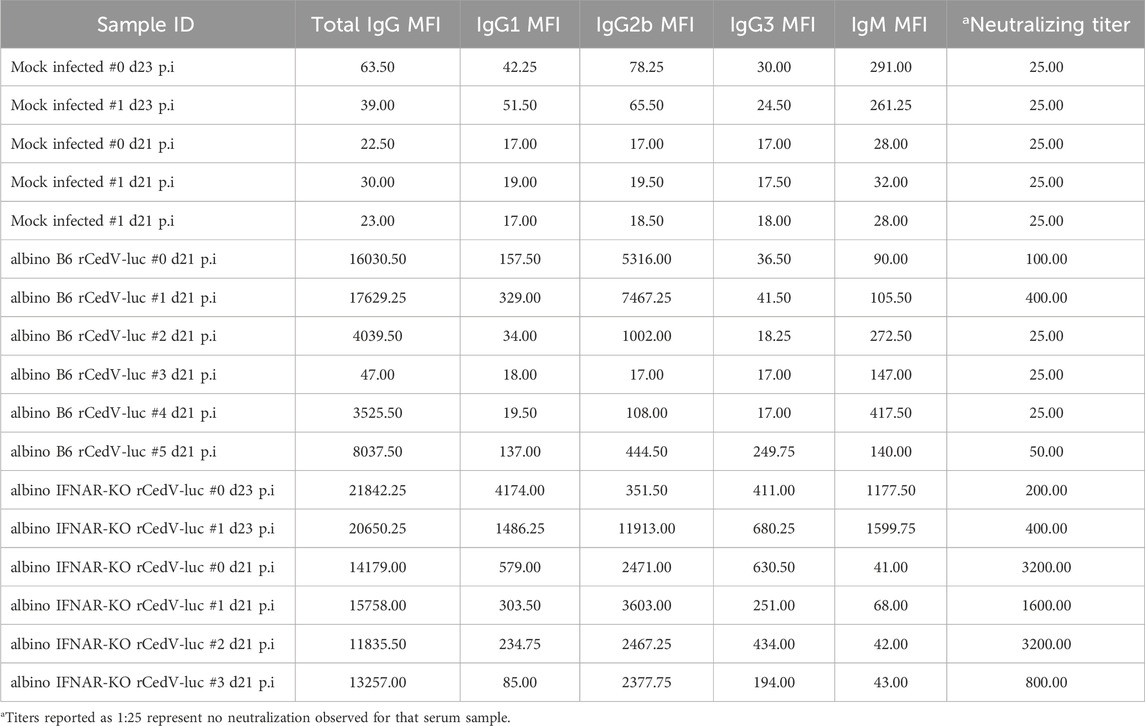
Table 3. IgM, IgG, and IgG subclass anti-CedV G titers and neutralization titers for sera from individual albino B6 and albino IFNAR-KO mice.
We next quantified the degree to which the day 21 sera from albino B6 and albino IFNAR-KO animals could neutralize Cedar virus in vitro. For this in vitro assay, we used rCedV-GFP, which forms fluorescent plaques that can be quantified on a plate reader (see Materials and Methods for details). Similar to results from quantification of anti-Cedar G IgG, albino IFNAR-KO mice produced levels of rCedV-GFP-neutralizing antibodies that were significantly different from the mock-infected controls (Figure 5; Table 3). Although some albino B6 mice produced levels of neutralizing antibodies in the same range as the albino IFNAR-KO mice, the mean neutralizing activity was lower and did not differ significantly from the mock-infected controls. Together, the data in Figures 4, 5 demonstrate that albino IFNAR-KO animals produce a robust IgG response to rCedV-luc infection, and this response is able to potently neutralize virus.
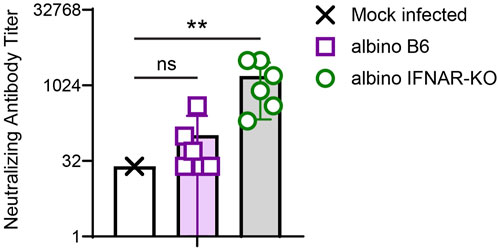
Figure 5. Analysis of in vitro CedV neutralization with serum from rCedV-luc-infected albino B6 and albino IFNAR-KO mice. Sera from the experiment in Figure 4 were serially diluted across a plate containing Vero-E6 cells, followed by the addition of rCedV-GFP. The ability of each serum sample dilution to block infection of Vero-E6 cells was assessed. The Kruskal-Wallis test with Dunn’s correction for multiple comparisons was used to determine significance in comparisons between albino B6 vs. mock (p = 0.699) and albino IFNAR-KO vs. mock (p = 0.003). Error bars are SD.
Pathogenic henipaviruses, HeV and NiV, have been shown to cause respiratory and fatal neurological disease in humans; however, the mechanisms underlying progression and dissemination through the bodies of living animals remains unclear. Although a number of animal studies have been performed with HeV and NiV (Geisbert et al., 2012; Rockx, 2014; Pigeaud et al., 2023), such work must be performed in a BSL-4 setting. This biosafety requirement is very limiting with regard to the number of animals included in each experiment and the scope of the analyses, due to a combination of the high cost of BSL-4 studies and the cumbersome nature of experimental analyses under high containment. Thus, the development of a BSL-2 animal model using an authentic henipavirus would likely represent a considerable advance in the study of henipavirus in vivo biology.
In this study, we employed BLI to follow rCedV-luc, a non-pathogenic henipavirus, which is the closest known relative to NiV and HeV in the Henipavirus genus (Caruso and Edwards, 2023; Li et al., 2023). BLI enabled us to follow infection in real-time, using the bioluminescence signal as a surrogate for viral replication. Notably, with appropriate imaging equipment, in vivo BLI is relatively easy to perform. Also, this technique is non-invasive, meaning that the same animals can be imaged longitudinally, at essentially any combination of desired time points post-infection. Importantly, through the quantification of absolute numbers of viral RNAs by qPCR, we were able to demonstrate that BLI yields a semi-quantitative surrogate measure of in vivo viral replication. By contrast, more traditional approaches for the study of in vivo viral replication (e.g., plaque assays) require the euthanasia of groups of individual animals at each time point. Such data are (i) not longitudinal, (ii) require many animals to provide data for multiple time points, and (iii) are extremely labor-intensive. Moreover, for a non-pathogenic virus such as CedV, it would be quite difficult to follow the course of infection without BLI, as there are no disease signs or other observable signs of infection. However, with BLI we were able to map the kinetics of infection with considerable granularity and then utilize the same animals to assess other relevant parameters (e.g., serology). Thus, BLI is a powerful tool for the study of viral dynamics in vivo, particularly in the case of viruses that do not cause pathology.
Because mice are inherently resistant to many human viral pathogens, a number of groups have used the IFNAR-KO strain to enable viral replication in the mouse model (Wong and Qiu, 2018), thereby gaining access to the many analysis tools (e.g., antibodies for differentiation antigens) that can be employed via flow cytometry and immunohistochemistry approaches to define the host response to infection. Type I interferons are a cell-intrinsic innate defense mechanism that protects the host against a broad range of viruses. Functional inactivation of the interferon α/β receptor in the IFNAR-KO strain completely prevents the effects downstream of type I interferon secretion (Muller et al., 1994). Although the HeV and NiV V and W proteins antagonize the host interferon response, they clearly do not completely inactivate this antiviral mechanism, as Dhondt et al., found that IFNAR-KO mice, unlike WT mice, are susceptible to infection with HeV and NiV and that the animals succumb between days 6 and 11 post-infection, when infected with a dose of 106 PFU via I.P. or 105 PFU via intracranial (I.C.) inoculation (Dhondt et al., 2013). Thus, the absence of IFNAR signaling enables HeV and NiV to replicate much more efficiently and cause lethal pathogenesis in mice.
In line with the above findings, we found that albino IFNAR-KO mice infected with rCedV-luc were able to support viral replication, whereas WT (albino B6) animals could not. Moreover, the observed endothelial cell tropism of rCedV-luc is consistent with pathological studies of humans infected with NiV, which demonstrated NiV antigen in a endothelial cells across a wide array of organs (Wong et al., 2002). Similar to reported data from NiV and HeV infections of IFNAR-KO mice (Dhondt et al., 2013), we detected CedV replication in the lungs, spleen and livers of infected IFNAR-KO mice. Thus, this murine model recapitulates key aspects of human NiV and HeV infections. A clear advantage of using the mouse as a model of in vivo henipavirus infection is the wide array of antibody-based reagents for determining phenotypes and activation status of murine cells. Particularly with regard to studying host responses, the mouse is the animal model of choice, for this reason. Although a caveat with the use of IFNAR-KO mice is the absence of responses to type I interferons, we demonstrated that the albino IFNAR-KO strain mounts a robust IgG response that exhibits significant neutralizing activity. Moreover, because class switching to IgG requires help from CD4 T cells (specifically, the T follicular helper (Tfh) subset) (Craft, 2012), these data also suggest that there is an intact Tfh response to rCedV-luc infection. Thus, key elements of the adaptive immune response are activated and effective in this model, despite the lack of signaling in response to type I interferons. Thus, we believe that important insights regarding the generation and efficacy of the host antibody response to henipavirus infection could be gained through the use of this model. With regard to the cellular immune response, further work will be needed to determine the functionality of the CD8 T cell response and the function of other CD4 T effector subsets in IFNAR-KO mice.
Despite the fact that IFNAR-KO mice cannot respond to type I interferons, an important generalized cell-intrinsic host defense against viral infection, rCedV-luc caused no discernable pathogenesis in this model. These data further emphasize the non-pathogenic nature of Cedar virus, critical for enabling its use in a BSL-2 setting. While the absence of pathogenesis represents a limitation for certain aspects of this animal model (e.g., validating in vivo efficacy of anti-henipavirus countermeasures), there are also arguably advantages. Firstly, despite the lack of pathology, this BLI model would afford a semiquantitative and in vivo assessment of replication-targeting antivirals during the early days of infection. Secondly, when commonly used model animals (e.g., Syrian golden hamster, ferret, African green monkey) are infected with NiV and HeV, morbidity and mortality generally develop rapidly (Pigeaud et al., 2023). As a result, longer term immune responses do not have time to develop, and there is thus little understanding of the nature of memory responses to henipavirus infection. Even in cases in which these experimental models have been successfully utilized to produce slower evolving NiV and/or HeV infections in which host immune responses develop (Lara et al., 2019; Scholte et al., 2023), the reagents to identify immune cell subsets are substantially more limited than for mice. By contrast, using this non-pathogenic mouse model, it should be possible to define with granularity the types of anti-henipavirus responses that hosts are (and are not) able to develop in response to longer term infections. Such data will be important for determining how immune mechanisms could potentially be harnessed in conjunction with novel therapeutic approaches to HeV and NiV infection.
Another limitation of this model is the inability of CedV to infect the CNS, whereas IFNAR-KO mice infected with HeV and NiV show evidence of viral infection of the brain (Dhondt et al., 2013). Investigators have proposed that HeV and NiV are able to invade the CNS because of their ability to bind host cells using Ephrin-B3, a receptor that is abundant in the brain (Negrete et al., 2006). CedV is unable to use Ephrin-B3 (Laing et al., 2019), which provides a plausible mechanistic explanation for why we did not observe any rCedV-luc replication in the brains of albino IFNAR-KO mice. Thus, via the I.P. route of virus inoculation, infections of the brain cannot be studied via rCedV-luc infection of IFNAR-KO mice. As a consequence, a major feature of NiV and HeV pathogenesis, specifically CNS invasion with consequent encephalitis, is not accessible for study via this model.
In summary, our work demonstrates that whole animal BLI used with rCedV-luc and IFNAR-KO mice represents a potentially powerful in vivo model for semiquantitative, longitudinal analysis of henipavirus infection dynamics and antiviral adaptive immune responses under BSL-2 containment.
The original contributions presented in the study are included in the article/Supplementary Material, further inquiries can be directed to the corresponding author.
The animal study was approved by the Uniformed Services University of the Health Sciences Institutional Animal Use and Care Committee (IACUC). The study was conducted in accordance with the local legislation and institutional requirements.
CH: Formal Analysis, Investigation, Methodology, Validation, Visualization, Writing–original draft, Writing–review and editing. CC: Investigation, Writing–review and editing. MR: Investigation, Writing–review and editing. LY: Resources, Writing–review and editing. SB: Investigation, Writing–review and editing. BG: Formal Analysis, Methodology, Writing–original draft. MA: Methodology, Resources, Writing–review and editing. EL: Methodology, Resources, Writing–review and editing. CB: Conceptualization, Funding acquisition, Methodology, Project administration, Writing–review and editing, Resources. BS: Conceptualization, Funding acquisition, Methodology, Project administration, Writing–original draft, Writing–review and editing.
The author(s) declare that financial support was received for the research, authorship, and/or publication of this article. Supported by grants from the National Institutes of Health to BS (AI125552) and CB (AI057168 and AI142764).
The authors thank D. McDaniel for microscopy support, and M. Hood and S. Jaiswal for bioluminescence imaging support. The opinions and assertions expressed herein are those of the authors and do not reflect the official policy or position of the Uniformed Services University of the Health Sciences, the Henry M. Jackson Foundation for the Advancement of Military Medicine, Inc. or any other agency of the U.S. Government.
The authors declare that the research was conducted in the absence of any commercial or financial relationships that could be construed as a potential conflict of interest.
The author(s) declared that they were an editorial board member of Frontiers, at the time of submission. This had no impact on the peer review process and the final decision.
All claims expressed in this article are solely those of the authors and do not necessarily represent those of their affiliated organizations, or those of the publisher, the editors and the reviewers. Any product that may be evaluated in this article, or claim that may be made by its manufacturer, is not guaranteed or endorsed by the publisher.
The Supplementary Material for this article can be found online at: https://www.frontiersin.org/articles/10.3389/fchbi.2024.1363498/full#supplementary-material
Amaya, M., Broder, C. C., and Laing, E. D. (2023a). Recombinant cedar virus: a henipavirus reverse genetics platform. Methods Mol. Biol. 2682, 73–86. doi:10.1007/978-1-0716-3283-3_5
Amaya, M., Cheng, H., Borisevich, V., Navaratnarajah, C. K., Cattaneo, R., Cooper, L., et al. (2021). A recombinant Cedar virus based high-throughput screening assay for henipavirus antiviral discovery. Antivir. Res. 193, 105084. doi:10.1016/j.antiviral.2021.105084
Amaya, M., Yin, R., Yan, L., Borisevich, V., Adhikari, B. N., Bennett, A., et al. (2023b). A recombinant chimeric cedar virus-based surrogate neutralization assay platform for pathogenic henipaviruses. Viruses 15 (5), 1077. doi:10.3390/v15051077
Bishop, K. A., and Broder, C. C. (2014). Hendra and Nipah viruses: lethal zoonotic paramyxoviruses. Emerg. Infect. 8, 155–187. doi:10.1128/9781555815592.ch9
Bishop, K. A., Stantchev, T. S., Hickey, A. C., Khetawat, D., Bossart, K. N., Krasnoperov, V., et al. (2007). Identification of Hendra virus G glycoprotein residues that are critical for receptor binding. J. Virol. 81 (11), 5893–5901. doi:10.1128/jvi.02022-06
Bonaparte, M. I., Dimitrov, A. S., Bossart, K. N., Crameri, G., Mungall, B. A., Bishop, K. A., et al. (2005). Ephrin-B2 ligand is a functional receptor for Hendra virus and Nipah virus. Proc. Natl. Acad. Sci. U. S. A. 102 (30), 10652–10657. doi:10.1073/pnas.0504887102
Bossart, K. N., Fusco, D. L., and Broder, C. C. (2013). Paramyxovirus entry. Adv. Exp. Med. Biol. 790, 95–127. doi:10.1007/978-1-4614-7651-1_6
Broder, C. C., Weir, D. L., and Reid, P. A. (2016). Hendra virus and Nipah virus animal vaccines. Vaccine 34 (30), 3525–3534. doi:10.1016/j.vaccine.2016.03.075
Caruso, S., and Edwards, S. J. (2023). Recently emerged novel henipa-like viruses: shining a spotlight on the shrew. Viruses 15 (12), 2407. doi:10.3390/v15122407
Chua, K. B., Bellini, W. J., Rota, P. A., Harcourt, B. H., Tamin, A., Lam, S. K., et al. (2000). Nipah virus: a recently emergent deadly paramyxovirus. Science 288 (5470), 1432–1435. doi:10.1126/science.288.5470.1432
Clayton, B. A., Wang, L. F., and Marsh, G. A. (2013). Henipaviruses: an updated review focusing on the pteropid reservoir and features of transmission. Zoonoses Public Health 60 (1), 69–83. doi:10.1111/j.1863-2378.2012.01501.x
Craft, J. E. (2012). Follicular helper T cells in immunity and systemic autoimmunity. Nat. Rev. Rheumatol. 8 (6), 337–347. doi:10.1038/nrrheum.2012.58
Dhondt, K. P., Mathieu, C., Chalons, M., Reynaud, J. M., Vallve, A., Raoul, H., et al. (2013). Type I interferon signaling protects mice from lethal henipavirus infection. J. Infect. Dis. 207 (1), 142–151. doi:10.1093/infdis/jis653
Dups, J., Middleton, D., Long, F., Arkinstall, R., Marsh, G. A., and Wang, L. F. (2014). Subclinical infection without encephalitis in mice following intranasal exposure to Nipah virus-Malaysia and Nipah virus-Bangladesh. Virol. J. 11, 102. doi:10.1186/1743-422x-11-102
Dups, J., Middleton, D., Yamada, M., Monaghan, P., Long, F., Robinson, R., et al. (2012). A new model for Hendra virus encephalitis in the mouse. PLoS One 7 (7), e40308. doi:10.1371/journal.pone.0040308
Edwards, S. J., Rowe, B., Reid, T., Tachedjian, M., Caruso, S., Blasdell, K., et al. (2023). Henipavirus-induced neuropathogenesis in mice. Virology 587, 109856. doi:10.1016/j.virol.2023.109856
Geisbert, T. W., Feldmann, H., and Broder, C. C. (2012). Animal challenge models of henipavirus infection and pathogenesis. Curr. Top. Microbiol. Immunol. 359, 153–177. doi:10.1007/82_2012_208
Genzer, S. C., Welch, S. R., Scholte, F. E. M., Harmon, J. R., Coleman-McCray, J. D., Lo, M. K., et al. (2020). Alterations in blood chemistry levels associated with Nipah virus disease in the Syrian hamster model. J. Infect. Dis. 221, S454. doi:10.1093/infdis/jiz552
Jensen, K. S., Adams, R., Bennett, R. S., Bernbaum, J., Jahrling, P. B., and Holbrook, M. R. (2018). Development of a novel real-time polymerase chain reaction assay for the quantitative detection of Nipah virus replicative viral RNA. PLoS One 13 (6), e0199534. doi:10.1371/journal.pone.0199534
Laing, E. D., Navaratnarajah, C. K., Cheliout Da Silva, S., Petzing, S. R., Xu, Y., Sterling, S. L., et al. (2019). Structural and functional analyses reveal promiscuous and species specific use of ephrin receptors by Cedar virus. Proc. Natl. Acad. Sci. U. S. A. 116 (41), 20707–20715. doi:10.1073/pnas.1911773116
Lara, A., Cong, Y., Jahrling, P. B., Mednikov, M., Postnikova, E., Yu, S., et al. (2019). Peripheral immune response in the African green monkey model following Nipah-Malaysia virus exposure by intermediate-size particle aerosol. PLoS Negl. Trop. Dis. 13 (6), e0007454. doi:10.1371/journal.pntd.0007454
Li, H., Kim, J. Y. V., and Pickering, B. S. (2023). Henipavirus zoonosis: outbreaks, animal hosts and potential new emergence. Front. Microbiol. 14, 1167085. doi:10.3389/fmicb.2023.1167085
Lieu, K. G., Marsh, G. A., Wang, L. F., and Netter, H. J. (2015). The non-pathogenic Henipavirus Cedar paramyxovirus phosphoprotein has a compromised ability to target STAT1 and STAT2. Antivir. Res. 124, 69–76. doi:10.1016/j.antiviral.2015.09.017
Luby, S. P. (2013). The pandemic potential of Nipah virus. Antivir. Res. 100 (1), 38–43. doi:10.1016/j.antiviral.2013.07.011
Luby, S. P., and Broder, C. C. (2020). Paramyxoviruses: henipaviruses. Viral infections of humans: epidemiology and control. New York, NY: Springer US, 1–51.
Luby, S. P., Hossain, M. J., Gurley, E. S., Ahmed, B. N., Banu, S., Khan, S. U., et al. (2009). Recurrent zoonotic transmission of Nipah virus into humans, Bangladesh, 2001-2007. Emerg. Infect. Dis. 15 (8), 1229–1235. doi:10.3201/eid1508.081237
Marsh, G. A., de Jong, C., Barr, J. A., Tachedjian, M., Smith, C., Middleton, D., et al. (2012). Cedar virus: a novel Henipavirus isolated from Australian bats. PLoS Pathog. 8 (8), e1002836. doi:10.1371/journal.ppat.1002836
Mastraccio, K. E., Huaman, C., Laing, E. D., Broder, C. C., and Schaefer, B. C. (2022). Longitudinal tracing of lyssavirus infection in mice via in vivo bioluminescence imaging. Methods Mol. Biol. 2524, 369–394. doi:10.1007/978-1-0716-2453-1_30
Mastraccio, K. E., Huaman, C., Warrilow, D., Smith, G. A., Craig, S. B., Weir, D. L., et al. (2020). Establishment of a longitudinal pre-clinical model of lyssavirus infection. J. Virological Methods 281, 113882. doi:10.1016/j.jviromet.2020.113882
Miao, H., and Wang, B. (2009). Eph/ephrin signaling in epithelial development and homeostasis. Int. J. Biochem. Cell Biol. 41 (4), 762–770. doi:10.1016/j.biocel.2008.07.019
Muller, U., Steinhoff, U., Reis, L. F., Hemmi, S., Pavlovic, J., Zinkernagel, R. M., et al. (1994). Functional role of type I and type II interferons in antiviral defense. Science 264 (5167), 1918–1921. doi:10.1126/science.8009221
Murray, K., Selleck, P., Hooper, P., Hyatt, A., Gould, A., Gleeson, L., et al. (1995). A morbillivirus that caused fatal fisease in horses and humans. Science 268 (5207), 94–97. doi:10.1126/science.7701348
Negrete, O. A., Levroney, E. L., Aguilar, H. C., Bertolotti-Ciarlet, A., Nazarian, R., Tajyar, S., et al. (2005). EphrinB2 is the entry receptor for Nipah virus, an emergent deadly paramyxovirus. Nature 436 (7049), 401–405. doi:10.1038/nature03838
Negrete, O. A., Wolf, M. C., Aguilar, H. C., Enterlein, S., Wang, W., Muhlberger, E., et al. (2006). Two key residues in ephrinB3 are critical for its use as an alternative receptor for Nipah virus. PLoS Pathog. 2 (2), e7. doi:10.1371/journal.ppat.0020007
Olatunji, G., Kokori, E., Abdulrahmon, M. A., and Aderinto, N. (2023). Addressing the recurrent Nipah Virus outbreaks: a call for vigilance, collaboration, and preparedness. New Microbes New Infect. 54, 101184. doi:10.1016/j.nmni.2023.101184
Pasquale, E. B. (2008). Eph-ephrin bidirectional signaling in physiology and disease. Cell 133 (1), 38–52. doi:10.1016/j.cell.2008.03.011
Pigeaud, D. D., Geisbert, T. W., and Woolsey, C. (2023). Animal models for henipavirus research. Viruses 15 (10), 1980. doi:10.3390/v15101980
Rockx, B. (2014). Recent developments in experimental animal models of Henipavirus infection. Pathogens Dis. 71 (2), 199–206. doi:10.1111/2049-632x.12149
Sadikot, R. T., and Blackwell, T. S. (2008). Bioluminescence: imaging modality for in vitro and in vivo gene expression. Methods Mol. Biol. 477, 383–394. doi:10.1007/978-1-60327-517-0_29
Satterfield, B. A., Cross, R. W., Fenton, K. A., Agans, K. N., Basler, C. F., Geisbert, T. W., et al. (2015). The immunomodulating V and W proteins of Nipah virus determine disease course. Nat. Commun. 6, 7483. doi:10.1038/ncomms8483
Schountz, T., Campbell, C., Wagner, K., Rovnak, J., Martellaro, C., DeBuysscher, B. L., et al. (2019). Differential innate immune responses elicited by Nipah virus and cedar virus correlate with disparate in vivo pathogenesis in hamsters. Viruses 11 (3), 291. doi:10.3390/v11030291
Shaw, M. L. (2009). Henipaviruses employ a multifaceted approach to evade the antiviral interferon response. Viruses 1 (3), 1190–1203. doi:10.3390/v1031190
Steffen, D. L., Xu, K., Nikolov, D. B., and Broder, C. C. (2012). Henipavirus mediated membrane fusion, virus entry and targeted therapeutics. Viruses 4 (2), 280–308. doi:10.3390/v4020280
Sweileh, W. M. (2017). Global research trends of World Health Organization's top eight emerging pathogens. Glob. Health 13 (1), 9. doi:10.1186/s12992-017-0233-9
Westbury, H. A., Hooper, P. T., Selleck, P. W., and Murray, P. K. (1995). Equine morbillivirus pneumonia: susceptibility of laboratory animals to the virus. Aust. Veterinary J. 72 (7), 278–279. doi:10.1111/j.1751-0813.1995.tb03549.x
Wong, G., and Qiu, X. G. (2018). Type I interferon receptor knockout mice as models for infection of highly pathogenic viruses with outbreak potential. Zool. Res. 39 (1), 3–14. doi:10.24272/j.issn.2095-8137.2017.052
Wong, K. T., Grosjean, I., Brisson, C., Blanquier, B., Fevre-Montange, M., Bernard, A., et al. (2003). A golden hamster model for human acute Nipah virus infection. Am. J. Pathology 163 (5), 2127–2137. doi:10.1016/s0002-9440(10)63569-9
Wong, K. T., Shieh, W. J., Kumar, S., Norain, K., Abdullah, W., Guarner, J., et al. (2002). Nipah virus infection: pathology and pathogenesis of an emerging paramyxoviral zoonosis. Am. J. Pathology 161 (6), 2153–2167. doi:10.1016/s0002-9440(10)64493-8
Xu, K., Broder, C. C., and Nikolov, D. B. (2012). Ephrin-B2 and ephrin-B3 as functional henipavirus receptors. Seminars Cell and Dev. Biol. 23 (1), 116–123. doi:10.1016/j.semcdb.2011.12.005
Keywords: hendra virus, nipah virus, paramyxovirus, henipavirus, cedar virus, firefly luciferase, ifnar−/− mice, pre-clinical model
Citation: Huaman C, Clouse C, Rader M, Yan L, Bai S, Gunn BM, Amaya M, Laing ED, Broder CC and Schaefer BC (2024) An in vivo BSL-2 model for henipavirus infection based on bioluminescence imaging of recombinant Cedar virus replication in mice. Front. Chem. Biol 3:1363498. doi: 10.3389/fchbi.2024.1363498
Received: 30 December 2023; Accepted: 05 March 2024;
Published: 18 March 2024.
Edited by:
Jeffrey Zaleski, Indiana University, United StatesReviewed by:
Katherine Davies, Centers for Disease Control and Prevention (CDC), United StatesCopyright © 2024 Huaman, Clouse, Rader, Yan, Bai, Gunn, Amaya, Laing, Broder and Schaefer. This is an open-access article distributed under the terms of the Creative Commons Attribution License (CC BY). The use, distribution or reproduction in other forums is permitted, provided the original author(s) and the copyright owner(s) are credited and that the original publication in this journal is cited, in accordance with accepted academic practice. No use, distribution or reproduction is permitted which does not comply with these terms.
*Correspondence: Brian C. Schaefer, YnJpYW4uc2NoYWVmZXJAdXN1aHMuZWR1; Christopher C. Broder, Y2hyaXN0b3BoZXIuYnJvZGVyQHVzdWhzLmVkdQ==
Disclaimer: All claims expressed in this article are solely those of the authors and do not necessarily represent those of their affiliated organizations, or those of the publisher, the editors and the reviewers. Any product that may be evaluated in this article or claim that may be made by its manufacturer is not guaranteed or endorsed by the publisher.
Research integrity at Frontiers
Learn more about the work of our research integrity team to safeguard the quality of each article we publish.