 Ziqi Lyu
 Joseph C. Genereux
95% of researchers rate our articles as excellent or good
Learn more about the work of our research integrity team to safeguard the quality of each article we publish.
Find out more
ORIGINAL RESEARCH article
Front. Chem. Biol. , 09 November 2023
Sec. Quantitative and Analytical Techniques
Volume 2 - 2023 | https://doi.org/10.3389/fchbi.2023.1288188
Introduction: Proximity labeling is a powerful approach for characterizing subcellular proteomes. We recently demonstrated that proximity labeling can be used to identify mistrafficking of secretory proteins, such as occurs during pre-emptive quality control (pre-QC) following endoplasmic reticulum (ER) stress. This assay depends on protein quantification by immunoblotting and densitometry, which sometimes suffers from poor sensitivity.
Methods: Here, we integrate parallel reaction monitoring (PRM) mass spectrometry to enable a more quantitative platform and assess how chemical ER stressors impact pre-QC of the model secretory protein transthyretin in HEK293T cells.
Results and Discussion: We find that some drug treatments affect labeling efficiency, which can be controlled for by normalizing to APEX2 autolabeling. While some chemical ER stress inducers including Brefeldin A and thapsigargin induce pre-QC, tunicamycin and dithiothreitol do not, indicating ER stress alone is not sufficient. This finding contrasts with the canonical model of pre-QC induction, and establishes the utility of our platform.
Eukaryotic cells depend upon the secretory pathway to properly traffic about one-third of their proteome (Juszkiewicz and Hegde, 2018), including nearly all secreted and plasma membrane proteins. As the first compartment of the secretory pathway, the endoplasmic reticulum (ER) maintains a calcium-rich environment for calcium binding (Carreras-Sureda et al., 2018), an oxidative environment for disulfide bond formation (Walczak et al., 2012), and possesses a unique set of enzymes and chaperones for glycoprotein biogenesis and quality control (Kozlov and Gehring, 2020). Secretory proteins have evolved to rely on this unique folding environment, and hence if mistargeted, these proteins present a threat to the cytosolic proteostasis (Rane et al., 2008). Multiple checkpoints and quality control steps ensure the high translocation fidelity of secretory proteins (Zhang and Shan, 2014). In the presence of ER stress, translocation for some secretory proteins is attenuated, leading to their cytosolic mislocalization. These mistargeted proteins are primarily directed towards degradation (Rodrigo-Brenni et al., 2014, 6; Hessa et al., 2011; Kadowaki et al., 2018; Braunstein et al., 2015). This process is termed ER pre-emptive quality control (Kang et al., 2006; Kadowaki et al., 2015) (sometimes denoted ER pQC; we use ER pre-QC instead, to avoid confusion with generic protein quality control PQC (McCaffrey and Braakman, 2016; Arrieta et al., 2017; Schwabl and Teis, 2022)). Because current techniques for measuring protein mislocalization are onerous or in vitro (Lyu and Genereux, 2021; Sharma et al., 2010), we do not yet have clear understanding of the substrates and biochemical mechanisms of ER pre-QC (Kadowaki and Nishitoh, 2019), nor which stresses activate it.
Proximity labeling has emerged as a technique of choice for characterizing subcellular proteomes (Bosch et al., 2021) and protein trafficking (Droujinine et al., 2021; Liu et al., 2021; Kim et al., 2021; Lee et al., 2023; Qin et al., 2023). We recently demonstrated that proximity labeling is an effective method for identifying mistargeting of secretory proteins (Espinoza et al., 2022; Lyu et al., 2022). In this approach, an APEX2 peroxidase with a nuclear export signal (NES) (Lam et al., 2015; Lee et al., 2016) is expressed and localized in the cytosol (cytAPEX). Upon initiation of labeling reactions with a 1-min H2O2 pulse, cytoplasmic proteins are biotin-phenol (BP)-labeled, and these BP-labeled proteins can be affinity purified. Secretory proteins that mistarget and accumulate in the cytosol are labeled and purified as well, and the relative amount of mistargeted protein can be determined by immunoblotting (IB). While this assay allows easy measurement of protein mistargeting under stress, the use of IB introduces several limitations. The relatively limited sensitivity of IB necessitates the use of several million cells for each drug treatment condition. IB is also a time-consuming process to detect multiple proteins. Targeted mass spectrometry methods like parallel reaction monitoring (Peterson et al., 2012) (PRM) have advantages over IB, including higher sensitivity and through-put (Aebersold et al., 2013; Liebler and Zimmerman, 2013).
Herein, we integrate PRM mass spectrometry with our assay to quantify mistargeting of the model secretory protein transthyretin (TTR) in response to ER stress by distinct mechanisms (Figure 1). Using a tenth of the sample, we obtain the same quantification results as are seen by IB (Lyu et al., 2022). We compare multiple normalization approaches and demonstrate the necessity to have a control for proximity labeling efficiency. For drug treatments that do not change proximity labeling efficiency, most normalization approaches yield the same result. For treatment that changes labeling efficiency, normalization to auto-labeled APEX2 peptides may be the most accurate method. With the PRM assay and proper data normalization, we establish that not all ER stressors induce ER pre-QC in HEK293T cells. Rather, only Brefeldin A (BFA) and sarcoplasmic/endoplasmic reticulum calcium ATPase (SERCA) inhibitors thapsigargin (Tg) and cyclopiazonic acid (CPA) induce ER pre-QC. While tunicamycin (Tm) or 1,4-dithiothreitol (DTT) induce ER stress, they do not increase relative FLAGTTR mistargeting in the cytosol. Hence, we show that PRM-based quantification of secretory protein mistargeting can be used to determine the factors responsible for pre-QC in living cells.
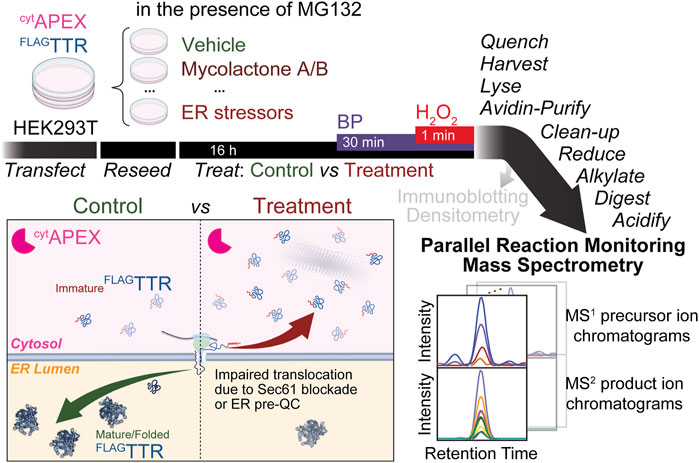
FIGURE 1. Proposed experimental workflow of this assay. cytAPEX and FLAGTTR are transiently transfected into HEK293T cells via calcium phosphate transfection. Cells are reseeded for later drug treatment (16 h). We expect increased differential FLAGTTR mistargeting to be observed under the condition of Sec61 blockade (during mycolactone A/B treatment) or ER pre-QC induction (during ER stress). 30 min before the H2O2 pulse, biotin-phenol (BP) is added. The 1-min BP-labeling reaction is quenched by washing cells on ice with quencher solution 3 times, and is brief enough that it should not affect the accumulation of mistargeted proteins. Cells are then harvested and lysed; cell lysates are brought to the same mass concentration and subjected to affinity purification with avidin agarose beads. Instead of loading eluate samples for SDS-PAGE and IB, we pellet avidin-enriched proteins by MeOH/CHCl3 precipitation and further process them for parallel reaction monitoring mass spectrometry. Displayed at the right bottom corner are schematic MS1 precursor ion chromatograms (isotopic series) and MS2 product ion chromatograms of a targeted peptide. Areas under chromatograms are used for quantification.
ER pre-QC has been described as a general protective mechanism of the ER in the presence of ER stress, and it is presumably regulated by activation of the ER unfolded protein response (UPR) (Kang et al., 2006; Kadowaki and Nishitoh, 2019; Legesse et al., 2023). This model suggests that all ER stressors should induce ER pre-QC to a similar extent. However, a previous study of prion protein (PrP) mistargeting in HeLa cells found that Tg and DTT, but not BFA, treatment induce pre-QC of PrP (Kang et al., 2006). Another study found that both Tg and Tm induce ER pre-QC in HepG2 cells (Kadowaki et al., 2015). We used proximity labeling combined with immunoblotting to determine whether ER stress, independently of the mechanism by which it is activated, always mistargets FLAGTTR (a known pre-QC substrate (Kadowaki et al., 2015; Lyu et al., 2022)) into the cytosol. In addition to Tg, which induces ER stress through depletion of ER Ca2+, we considered the well-studied small molecule ER stressors tunicamycin (Tm), 2-deoxy-d-glucose (2-DG), Brefeldin A (BFA) and 1,4-dithiothreitol (DTT). Tm inhibits GlcNAc-1-phosphate transferase, blocking the first step of N-glycosylation (Yoo et al., 2018). Tm treatment leads to glycoprotein misfolding inside the ER and activation of ER UPR, and it is also a reported ER pre-QC inducer in HepG2 cells (Kadowaki et al., 2015). 2-DG inhibits N-glycosylation due to its aberrant incorporation into the N-glycan, in place of mannose (Kurtoglu et al., 2007). BFA leads to cis-Golgi cisternae collapse into the ER and a complete loss of ER-to-Golgi transport and canonical protein secretion (Klausner et al., 1992; Nebenfuhr et al., 2002; Citterio et al., 2008). DTT is a cell-penetrable reductant that triggers ER stress by preventing disulfide bond formation inside the ER (Braakman et al., 1992).
We used HEK293T cells as they have previously been used to study ER pre-QC, and do not express endogenous TTR (Kadowaki et al., 2015; Lyu et al., 2022). We treated HEK293T cells co-expressing cytAPEX and FLAGTTR with chemical ER stressors (Tg, Tm, BFA, DTT, or 2-DG) in the presence of 26S proteasome inhibitor MG132 and determined the relative mistargeted (cytosolic) FLAGTTR under each condition using proximity labeling and IB. Only Tg increases FLAGTTR mistargeting relative to vehicle treatment (Supplementary Figure S1, avidin-purification IB: TTR). BFA and 2-DG did not induce as much BiP expression (a UPR target) under these conditions as Tg, Tm, or DTT (Supplementary Figure S1, whole cell lysate IB: KDEL, lanes 3–5 vs. 2). Hence, we performed titrations to determine optimized conditions for UPR induction (Supplementary Figure S2). 2-DG did not effectively induce BiP upregulation at any concentration in these cells, leading us to exclude this stressor in future experiments. We also observed that DTT, 2-DG, and higher concentrations of BFA inhibited total peroxidase labeling yield. For BFA, we chose the minimum concentration that still yields maximum BiP expression. For DTT-treated cells, cytAPEX labeling can be rescued by aspirating DTT-containing media and replacement of fresh media containing 1 mM H2O2 (Supplementary Figure S3, whole cell lysate, ECL: biotin). We repeated the treatments with the optimized conditions for each stressor, but still found that only Tg-treated cells display increased FLAGTTR mistargeting in the cytosol (Supplementary Figure S3, avidin purification, IB: TTR). It is difficult to evaluate the extent to which conditions affect TTR mistargeting, however, because mistargeted populations are small and IB bands after proximity labeling are often faint and difficult to quantify (Supplementary Figures S1, S3). Firm conclusions would require substantial material scale-up, and there are many chemical and genetic ER stressors worth considering, especially if pre-QC activation is dependent on how stress is induced. This limitation made us consider using a more sensitive platform for quantifying mistargeted proteins.
Peroxidase proximity labeling has been previously integrated with mass spectrometry, with quantification by stable isotope labeling by amino acids in cell culture (SILAC) (Lee et al., 2016; Rhee et al., 2013; James et al., 2019; Li et al., 2020; Bersuker et al., 2018), tandem mass tag (TMT) (Paek et al., 2017; Chu et al., 2021; Perez Verdaguer et al., 2022), or label-free methods including selected/multiple reaction monitoring (SRM, or MRM) and parallel reaction monitoring (PRM) (Lobingier et al., 2017; Kong et al., 2022; Ke et al., 2021; Saha et al., 2022; Hobson et al., 2022; Zhong et al., 2023). We decided to replace IB with PRM as our detection method, as shown in Figure 1. During PRM data acquisition, pre-defined peptides are isolated according to their mass-to-charge (m/z) ratios with a pre-set isolation window. Isolated precursor peptide ions are fragmented to generate product ions and all resulting product ions are analyzed in parallel with a mass analyzer that allows MS2 full scan (e.g., Orbitrap, time-of-flight (Van Bentum and Selbach, 2021) or linear ion trap (Heil et al., 2021)). Quantification is based on areas under curve (AUC) of product ions and/or precursor ions. Because we are using this assay as an exploratory assay measuring relative quantification of treatment vs. control, we chose a label-free method as opposed to the use of stable isotope dilution standards (Carr et al., 2014). We considered several other proteins that might serve to normalize TTR intensities. These included the peroxidase cytAPEX, endogenously biotin-binding proteins in mitochondrial matrix (Paek et al., 2017; Frankenfield et al., 2020; Garcia et al., 2021; Xiong et al., 2021), and the common loading control proteins β-actin, α-tubulin and GAPDH. Stress-inducible chaperones HSPA1A (nucleocytosolic) and BiP (alias HSPA5/GRP78, primarily ER luminal) were chosen to indicate the efficacy of MG132 and ER stressors.
Assayed peptides in this study are summarized in Table 1, with dot products of precursor ion isotopic series (idotp) and product ions against reference library (dotp) listed, as well as coefficients of variance (CVs) of 8 technical replicates. CVs calculated from raw peak areas are below 20%, with a median of 9.1%. If raw peak areas are normalized by total ion current (TIC), CVs of assayed peptides do not exceed 14%, with a median of 5.8% (Supplementary Figure S4). The MS2 spectra and product ion chromatograms of targeted peptides are provided in Supplementary Figure S5. While we considered several peptides from TTR, we chose to include only AADDTWEGFASGK (charge state +2) as other peptides either harbor ragged ends, which are subject to proteolysis artifacts, or contain tyrosine residues, which are subject to heme peroxidase-catalyzed proximity labeling.
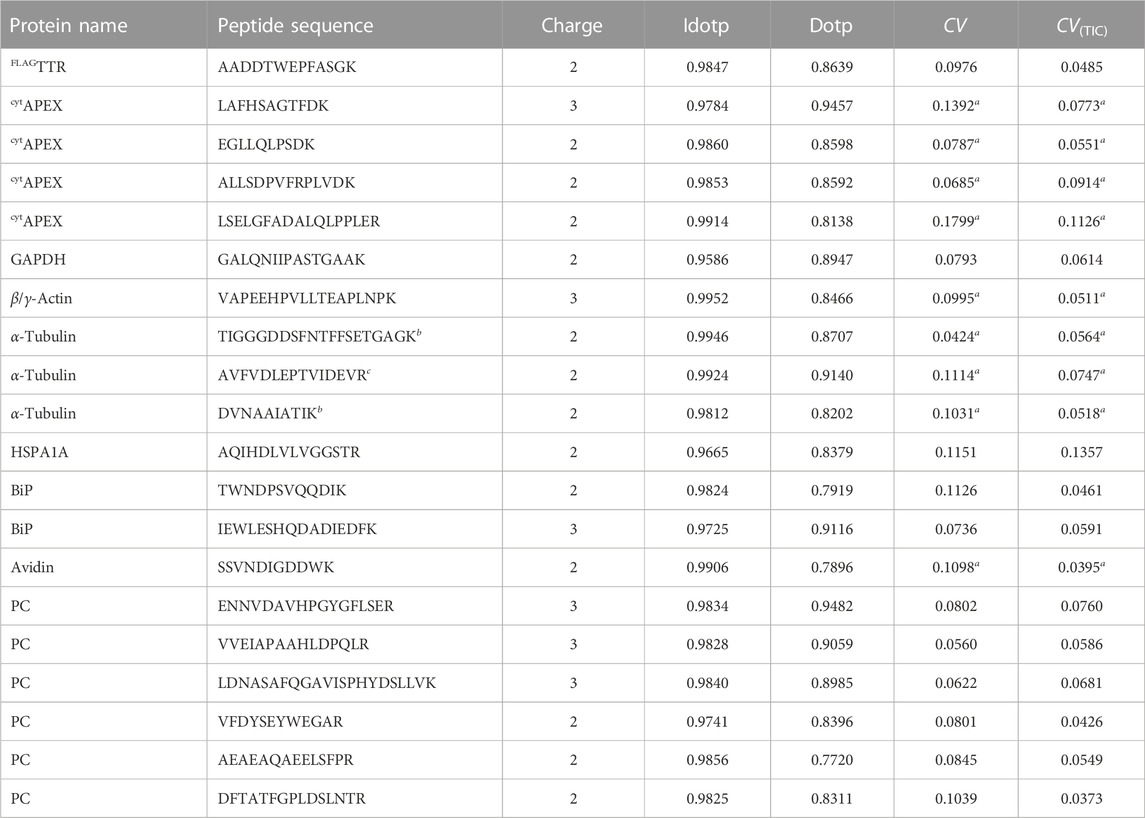
TABLE 1. Assayed proteins, peptides, median isotope dot products (idotp) and library dot products (dotp) against NIST library or Prosit-predicted library across all experiments performed with an LTQ Velos Pro, and coefficients of variance (n = 8, performed with the same LTQ Velos Pro). a indicates coefficients of variance (CV) are calculated based on the peak area of precursors. CV(TIC) is calculated based on peak areas normalized by MS1 total ion current (TIC) chromatogram. b indicates peptides shared across α-tubulin 1A, 1B, 1C, 3D, 3E and 3F. c indicates the peptide is shared across α-tubulin 1A, 1B and 1C.
To further evaluate our assay, we tested whether IB and PRM yield comparable results. For the head-to-head comparison, we used drug treatment conditions that provide a large dynamic range of FLAGTTR mistargeting yields. Mycolactone A/B (ML) is an inhibitor of Sec61-mediated co-translational translocation for secreted and type-I and type-II transmembrane proteins (McKenna et al., 2016; McKenna et al., 2017; Morel et al., 2018). It should completely arrest FLAGTTR translocation during the time-course of the experiment. When used in combination with the proteasome inhibitor MG132, ML is expected to give us the most FLAGTTR accumulation inside the cytosol. Tg is a noncompetitive SERCA inhibitor that rapidly induces severe ER stress (Sehgal et al., 2017), and is a known inducer of ER pre-QC (Kang et al., 2006; Kadowaki et al., 2015; Kadowaki et al., 2018). From our previous study by IB, combined Tg and MG132 treatment triggers around a 3-fold increase in FLAGTTR mistargeting compared to MG132 treatment alone, and 6-fold increase compared to the basal condition (Lyu et al., 2022).
HEK293T cells co-expressing FLAGTTR and cytAPEX were treated with vehicle, ML or Tg for 16 h in the absence or presence of MG132, before BP-labeling and quenching. Eluate samples (avidin-purifications) were split in half. One-half was separated by SDS-PAGE followed by IB, while the other half was prepared for bottom-up proteomics and analyzed by PRM. The amount of eluate digest we injected is equivalent to one tenth the amount we recovered from avidin beads. IB is quantified by densitometry, and PRM by raw peak areas of the TTR peptide AADDTWEGFASGK2+. To plot quantification results from both methods in the same scale, each treatment condition was normalized to the total intensity across conditions for a given replicate (Degasperi et al., 2014). Tg induces a 2.5-fold increase over vehicle in FLAGTTR mistargeting when co-treated with MG132 (Figure 2A), which agrees with what we have measured by IB in our previous study (Lyu et al., 2022). The results from the PRM assay are similar to IB, with Pearson’s R2 ∼0.99 for both replicates (Figure 2B). These experiments demonstrate that PRM yields similar results to IB, but with at least 5-fold less sample consumption.

FIGURE 2. PRM and IB similarly quantify relative FLAGTTR mistargeting. (A) Quantification of FLAGTTR from avidin-purified samples by IB and PRM. To plot quantification results from both methods in the same scale, signals were normalized across all six conditions within a replicate (y-axis). Normalization is performed by dividing signal from one condition by tallied signals across all six conditions in a replicate. For IB, it is local background-subtracted band densitometry from each condition normalized to the sum across all conditions; for PRM, it is raw peak area from each condition normalized to the sum across all conditions. See Supplementary Figure S6 for full blots of both replicates. (B) Plot of PRM quantification against IB is displayed to show correlation between the two methods, with raw densitometry and AUC values annotated. Linear regression equation and Pearson’s R2 are displayed as well.
With this PRM-coupled mistargeting assay, we revisited the small molecule ER stressors Tg, Tm, BFA and DTT (raw peak areas in Supplementary Table S1). Having observed that not all ER stressors increase mistargeting of FLAGTTR in HEK293T cells, we also included two other molecules that impact ER calcium homeostasis. Cyclopiazonic acid (CPA) is another SERCA inhibitor, but differs from Tg in that it is a competitive inhibitor, less potent, and inhibits SERCA reversibly (Moncoq et al., 2007). Diltiazem (Dil) is a calcium channel blocker that is used to maintain ER calcium level by preventing Ca2+ leakage. Dil does not induce ER stress, but does influence the ER protein homeostasis through elevated activity of ER calcium binding proteins (Mu et al., 2008; Ong et al., 2010). We confirmed that 100 µM CPA induces ER stress similarly to 50 nM Tg on the basis of BiP upregulation following a 16-h treatment (Supplementary Figure S7A, IB:KDEL, lanes 3,4 vs. 1,2 and 7,8 vs. 5,6).
We also took advantage of the inherent multiplexing of PRM to consider normalization. Appropriate normalization to control for loading, sample handling, and ionization efficiency is necessary for most biological mass spectrometry techniques. However, biased normalization methods can introduce artifacts into interpretation of results. A straightforward normalization factor is the area under the entire MS1 TIC chromatogram (Cox et al., 2014). This factor should control for injection efficiency, loss of material during sample preparation, differences in the recovery of cells or protein, errors in protein quantification prior to avidin purification, and to the extent that the signal is dominated by cytAPEX-labeled proteins, the labeling activity of cytAPEX in a given experiment. Mitochondrial carboxylases such as pyruvate carboxylase (PC), which are endogenously biotinylated, have been used for normalization in proximity labeling experiments when the peroxidases is localized elsewhere than the mitochondria (Paek et al., 2017; Frankenfield et al., 2020; Garcia et al., 2021; Xiong et al., 2021), controlling for the total amount protein loaded onto (strept)avidin beads. These proteins as normalization factors are valid if the assumptions of consistent expression level and consistent proximity labeling activity are maintained across conditions. Unlike normalization against TIC and PC, normalization against abundant proteins that share a compartment with the peroxidase can control against changes in BP-labeling efficiency (Lobingier et al., 2017). We considered β-actin, α-tubulin and GAPDH. We found that α-Tubulin levels are affected by cellular stress (e.g., Supplementary Figures S6A, B, Lysate IB: α-tubulin) and there was poor chromatographic performance in our gradient for GAPDH peptides, and hence we focused on β/γ-actin as a proxy for protein load and BP-labeling yield by cytAPEX. We also considered normalization against the heme peroxidase cytAPEX itself, under the expectation that cytAPEX auto-labeling is a proxy for total biotinylation yield.
We compared relative FLAGTTR mistargeting across drug treatments and different normalization schemes (Figure 3). For all normalization approaches, the SERCA inhibitors Tg and CPA induce pre-QC to similar extents while Tm and Dil do not induce pre-QC. The observed relative mistargeting of FLAGTTR following ML treatment varies between normalization methods. While DTT lowers the apparent mistargeted TTR load with each normalization, the extent of this decrease varies from 86% with PC normalization (Figure 3B) to 40% with β-actin or cytAPEX normalization (Figures 3C, D). BFA shows the largest disparity, doubling FLAGTTR mistargeting with β-actin or cytAPEX normalization, moderately increasing (14% increase) with TIC normalization, or having no effect with PC normalization.
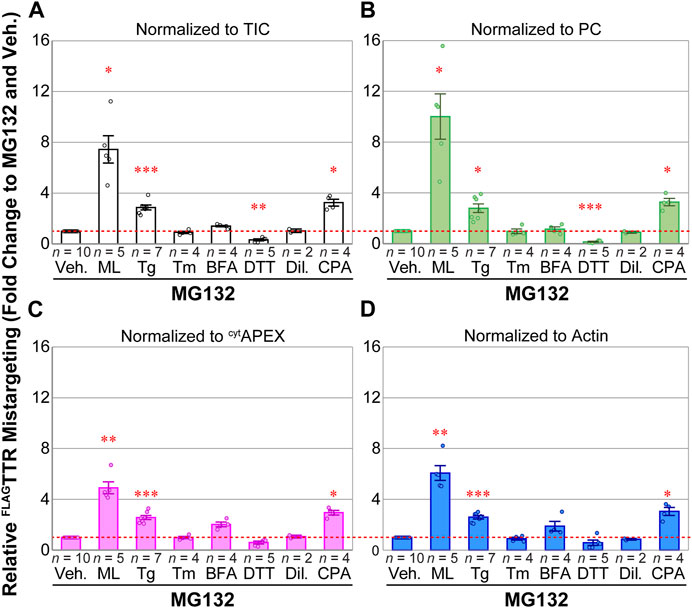
FIGURE 3. PRM quantification of apparent FLAGTTR mistargeting as results of various drug treatments, in the presence of MG132 (16 h). (A) MS1 TIC-, (B) PC-, (C) APEX2-and (D) β-actin-normalized PRM peak area fold change, compared to 1 μM MG132 and vehicle. Veh., 0.1% DMSO; ML, 25 nM, mycolactone A/B; Tg, 50 nM thapsigargin; Tm, 200 nM tunicamycin; BFA, 400 ng mL–1 Brefeldin A; DTT, 3 mM d,l-1,4-dithiothreitol; Dil, 30 μM diltiazem; CPA, 100 μM cyclopiazonic acid. Representative full blots of lysates in one experiment can be found in Supplementary Figure S7B. Error bars represent standard errors of the mean. Sample sizes are displayed above drug annotations. Fold change of 1 is marked as a red dashed line. Two-tailed heteroscedastic t-tests were performed for mistargeting fold change by each normalization factor, with Bonferroni correction (6 comparisons vs. Veh., excluding Dil). Adjusted p-value ≥0.05 or not compared, not annotated; 0.01 ≤ adj. p < 0.05, *; 0.001 ≤ adj. p < 0.01, **; 0.0001 ≤ adj. p < 0.01, ***.
To explain the disagreement among normalization methods for ML-, DTT- and BFA-treated cells, we considered how each of these would be affected by changes to labeling efficiency. PC recovery from avidin purification will solely reflect the total amount of lysate added to the beads. It will be insensitive to changes in peroxidase labeling. Recovery of biotinylated cytAPEX or β-actin, by contrast, will reflect both the amount of cells harvested as well as the peroxidase labeling efficiency. Normalization against MS1 TIC will also partially account for differences in labeling efficiency, however several other factors will affect the TIC signal (Figure 4A). These include carboxylases such as PC, which reflect total protein inputs, but also common contaminants (keratin, trypsin, etc.) and avidin that can be leached from the beads in a strongly condition- and lot-dependent manner (Berg Luecke and Gundry, 2021).
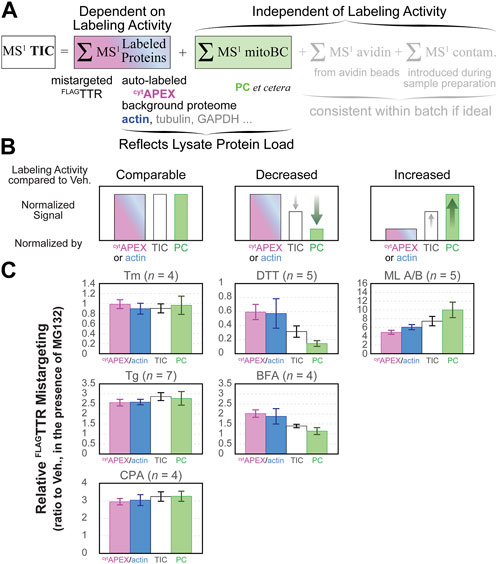
FIGURE 4. Composition of MS1 TIC chromatogram and the effect of labeling activity on the pattern of normalized data, organized per drug treatment. (A) MS1 TIC consists of the MS1 chromatograms of peptides from BP-labeled proteins, endogenous biotin carboxylases in mitochondrial matrix (mitoBC, independent of labeling), avidin etched from beads during elution and denaturation (independent of labeling), and other contaminants (independent of labeling). (B) Prediction of how relative amount of BP-labeling yield and PC level impacts normalized FLAGTTR mistargeting. For treatments that neither alter cytoplasmic proteome too much, nor change the relative levels of cytAPEX, actin and PC, normalization to cytAPEX, actin, TIC and PC gives similar results. For conditions that decrease the labeling activity, fold change normalized to cytAPEX or actin will be higher than that by PC. For conditions that increase the relative level of labeling, fold change normalized to cytAPEX or actin will be lower than that by PC. (C) Head-to-head comparison between apparent FLAGTTR mistargeting normalized by different factors, per drug treatment. These drug treatment conditions are categorized based on the pattern in panel (B). All drug treatment conditions include 16-h 1 μM MG132. Error bars represent the standard errors of the mean.
Prior to the affinity purification step, we bring clarified lysates to the same protein concentration, based on Bradford assay, and load the same mass of protein to avidin-agarose beads. If the drug treatments, as compared to vehicle, do not change the profile of labeling-independent biotin carboxylases, background cytoplasmic proteome and the labeling activity of cytAPEX, normalization to different global standards should yield similar results (Figure 4B left, “comparable labeling activity”). If cytAPEX labeling activity somehow decreases under some drug treatment conditions, but the total amount of biotin carboxylases and cytoplasmic background remain consistent, the portion of enriched cytoplasmic protein (e.g., cytAPEX and β-actin) is expected to decrease accordingly with the labeling activity decrease. This may result in a relatively higher proportion of PC and other labeling-independent components. Eventually, if data are divided by the level of cytAPEX or actin, the normalized value will be higher than that normalized by PC. On the contrary, data divided by PC level will be smaller than that by cytAPEX or actin. MS1 TIC can represent labeling activity to some extent, but it is also convoluted by labeling-independent components, thus mistargeting normalized by TIC is expected to be in the middle of the two extremes (Figure 4B center, “decreased labeling activity”). And vice versa, if cytAPEX labeling activity increases upon some treatments compared to the control condition, an opposite trend will be expected (Figure 4B right, “increased labeling activity”): the proportion of avidin-purified cytoplasmic proteins (e.g., cytAPEX or actin) will be relatively higher, resulting in a lower apparent mistargeting after normalization, while the proportion of labeling-independent PC will be lower, leading to a higher apparent mistargeting after normalization. Again, TIC normalization should yield an intermediate result. We find that our data nicely matches this model (Figure 4C), indicating that the divergence between TIC- and PC-normalization and cytAPEX-normalization can be entirely ascribed to drug treatment dependent variation in peroxidase labeling efficiency. We saw in our immunoblotting experiments (Supplementary Figure S1) that BFA and DTT decrease labeling efficiency and altered our protocol to mitigate this interference. Nevertheless, it is clear that these treatments even under optimized conditions affect peroxidase labeling enough to influence the quantitative accuracy of the data. Given that DTT is a potent reductant, it is not surprising that it inhibits oxidative labeling. The cause of inhibition during BFA treatment is unclear. It could be that changes in glutathione redox state also mediate the increased labeling following ML treatment, as a recent study shows that ML depletes cellular glutathione in myeloid leukemia cells KBM-7 (Förster et al., 2020). Whatever the basis of the change in labeling efficiency, by using PRM, we can normalize against cytAPEX auto-labeling and remove this confounding factor to find the most accurate quantification of mistargeting (Figure 3C).
In this study, we coupled PRM mass spectrometry with our protein mistargeting assay, enabling us to control for labeling efficiency and quantitatively compare the extent to which several ER stressors induce TTR mistargeting through ER pre-QC. Our results indicate that UPR activation alone is not sufficient to induce ER pre-QC in HEK293T cells. Our PRM-coupled mistargeting assay will now enable the effects of ER stress inducers and other proteostasis regulators to be scanned across multiple cell types, towards establishing the generality of ER pre-QC induction by ER stress. This platform could also be used to evaluate other pre-QC substrates beyond TTR, or to determine which signaling factors participate in mediating pre-QC. More broadly, we have demonstrated that the multiplexing capacity of PRM can be leveraged to ensure appropriate normalization when using in situ peroxidase labeling.
The ambient temperature in our lab is 17–21°C. Buffer components and other biochemical reagents were all purchased from Fisher, VWR, or Millipore Sigma. Nanopure water and sterilized consumables were used for all biochemical experiments. Cell culture media and cell detachment solution (0.25% trypsin, 0.1% EDTA, w/v; Corning) are pre-warmed before use in a 37°C aluminum bead bath. The heat block for denaturing protein samples is set to 100°C.
HEK293T cells (American Type Culture Collection) were cultured in Dulbecco’s modified Eagle’s medium (DMEM, Corning) supplemented with 10% (v/v) fetal bovine serum (FBS, Seradigm), 2 mM l-glutamine (Corning), and penicillin (100 IU mL–1)-streptomycin (100 μg mL–1, Corning), and used within 30 passages after thawing.
pcDNA3 APEX2-NES was a gift from Alice Ting (Addgene plasmid # 49386; http://n2t.net/addgene:49386; RRID:Addgene_49386). (Lam et al., 2015) The FLAGTTR vector has been reported. (Chen et al., 2014). 5 μg of each forementioned plasmid DNA was diluted to the same 1 mL 250 mM CaCl2 solution, with 1 mL 2× HEPES-buffered saline (2× HBS, 274 mM NaCl, 10 mM KCl, 1.4 mM Na2HPO4, 15 mM d-glucose, 42 mM HEPES pH 7.05) added to it dropwise while gently vortex mixed. To a 10-cm dish of HEK293T cells at ∼50% confluency, the transfection mixture was added dropwise to cover the entire dish. Media were changed 12−16 h post-transfection. At least 1 h after media change, cells were reseeded into poly d-lysine-treated 6-cm dishes to ensure cellular retention during later treatments and washing. Poly d-lysine treatment was performed by coating plates with poly d-lysine hydrobromide (0.1 mg mL–1 in H2O from lyophilized powder, Sigma-Aldrich) for 15 min, then washing twice with Dulbecco’s phosphate-buffered saline (DPBS, 1×, HyClone, GE) before adding cell culture media.
After cellular attachment, transfected cells were treated with corresponding drugs by changing media, as summarized in Supplementary Table S2. On the second day post-transfection, dimethyl sulfoxide (DMSO, as vehicle, tissue culture grade, Corning) or biotin-phenol (BP, 500 μM, from 0.5 M stock in DMSO, prepared in lab as described (Lyu et al., 2022)) were added to the cells through conditioned media containing residual drugs from initial treatment. Cells were incubated at 37°C for 30 min 1 M sodium (+)-l-ascorbate (in H2O, as 100× stock, Sigma), 0.5 M Trolox (in DMSO, as 100× stock, Acros) and 100 mM H2O2 (in 1× DPBS, as 100× stock, from 9.8 M, Fisher) were freshly prepared during or before the 30-min BP incubation. 1× quencher solution was made by diluting 1 M sodium azide (NaN3, in H2O, as 100× stock, Fisher) to 10 mM, 1 M ascorbate to 10 mM, 0.5 M Trolox to 5 mM, with 1× DPBS and chilled on ice.
After the 30-min BP incubation, 30 μL 100 mM H2O2 was added into each dish to a final concentration of 1 mM, and dishes were agitated immediately after addition. For DTT-treated cells, conditioned media containing DTT was aspirated before the replacement by pre-warmed DMEM containing 1 mM H2O2. Exactly 1 min after the H2O2 delivery, media were aspirated, and cells were washed three times with 3 mL ice-cold 1× quencher solution and kept on ice. Quenched cells were then harvested in 1 mL 1× quencher solution by scraping and pelleted at 4°C, 700× g for 5 min. Cell pellets that were not immediately processed were stored in the freezer (≤−60°C).
Freshly harvested or thawed cell pellets were lysed on ice for at least 10 min with 1× quenchers (10 mM NaN3, 10 mM sodium (+)-l-ascorbate, 5 mM Trolox) and protease inhibitors cocktail (PIC, Roche) in radioimmunoprecipitation assay (RIPA) buffer (50 mM Tris pH 7.5, 150 mM NaCl, 1% (w/v) Triton X-100, 0.5% (w/v) sodium deoxycholate, 0.1% (w/v) SDS). Lysates were clarified by centrifugation at 21,100× g for 15 min at 4°C. Soluble protein concentration was determined by colorimetric assay (Bio-Rad) using Agilent Cary 60 UV-Vis spectrophotometer, and lysate concentration was normalized to the lowest sample. SDS-PAGE samples were prepared in reducing Laemmli buffer (mix with 6× stock, 12% SDS, 0.01% bromophenol blue, Acros or Fisher, 47% (w/v) glycerol, Fisher, 60 mM Tris pH 6.8; DTT was freshly added immediately before use) followed by 10-min boiling. Samples with TTR were boiled for 20 min to break up aggregated material (Espinoza et al., 2022; Lyu et al., 2022).
BP-labeled proteins were affinity purified from mass-balanced lysates with RIPA-rinsed avidin agarose beads (Pierce, 30 μL slurry per sample) and rotated overnight at 4°C. Beads were then washed twice with RIPA, once with 1 M KCl/0.1% (w/v) Triton X-100 in H2O, once with 0.1 M Na2CO3/0.1% (w/v) Triton X-100 in H2O, once with 2 M urea/0.1% (w/v) Triton X-100 in 10 mM Tris pH 8.0, and twice with RIPA to decrease non-specific binding. BP-labeled proteins were eluted in denaturing elution buffer (12% (w/v) SDS, 0.01% (w/v) bromophenol blue, 7.8% (w/v) glycerol, 10 mM Tris pH 6.8, stored at ambient temperature; 2 mM d-(+)-biotin and 20 mM DTT added to the elution buffer freshly before use) by boiling for 10 min. Collected eluates were boiled for another 10 min.
SDS-PAGE was performed on 12% Tris-glycine gels (from 30% (w/v) acrylamide/bis-acrylamide, 37.5:1, w/w, Bio-Rad, or from acrylamide powder, Sigma and bis-acrylamide powder, Bio-Rad). Approximately 40 μg protein was loaded in input gels; 20 μL (60% v/v of elution buffer used) eluate was loaded in eluate gels. Proteins were transferred to nitrocellulose membrane (Bio-Rad) by semi-dry transfer (Turboblot, Bio-Rad). After visualization of total protein by Ponceau S (0.1% (w/v) in 5% (v/v) acetic acid (AcOH)/H2O, from powder, Acros) to confirm loading and transfer, membranes were blocked with 5% (w/v) non-fat dried milk (Walmart) in Tris-buffered saline (TBS, 10 mM Tris pH 7.0, 150 mM NaCl) 40–60 min at ambient temperature or overnight at 4°C. Rinsed membranes were incubated in primary antibody solution (primary antibody reserved in 5% bovine serum albumin, BSA, Sigma, 0.1% (w/v) NaN3 in TBS) for ≥2 h at ambient temperature or overnight at 4°C, rinsed well with TBS with 0.1% Tween 20 (Fisher, TBST), incubated in secondary antibody solution (50 ng mL–1 in 5% (w/v) non-fat milk/TBS) 20–30 min at ambient temperature. Blots were rinsed three times with TBST, once with TBS, and once with H2O, followed by imaging on a LI-COR Fc Odyssey imager and analyzed with Image Studio Lite software (LI-COR). Quantification was done using background-subtracted densitometric data of each band of interest.
Antibodies for IB include: polyclonal rabbit anti-GRP78/BiP (1:1000, from 86 μg per 150 μL stock, Proteintech), anti-HSP70/HSPA1A (1:5000, from 24.0 μg per 150 μL stock, Proteintech), anti-human prealbumin/TTR (1:1000, 2.0 g L–1, Dako), anti-DNAJB11/ERdj3 (1:1000, from 27 μg per 150 μL stock), Proteintech), anti-GAPDH (1:1000, 42 mg mL–1, Cell Signaling Technology or 1:1000, 600 μg mL–1, Proteintech) followed by secondary goat anti-rabbit antibody (IRDye 800 CW, 1:10000–20000, from 0.5 mg mL–1, LI-COR). Monoclonal mouse anti-KDEL (1:500, 1 mg mL–1, Enzo), M2 anti-FLAG tag (1:1000, from 1 mg mL–1, Sigma), anti-β-actin (1:5000, from 86 or 150 μg per 150 μL, Proteintech), and anti-α-tubulin (1:5000, from 260 μg per 150 μL, Proteintech) followed by secondary goat anti-mouse antibody (IRDye 680 RD, 1:10000–20000, from 0.5 mg mL–1, LI-COR).
For electrochemiluminescence, nitro-cellulose membranes were incubated in HRP-conjugated streptavidin (Thermo, 1.25 mg mL–1, 1:5000 dilution in 1% milk/TBST) for 4 h at room temperature, followed by washing three times with TBST, once with TBS, and once with H2O. Membranes were then drained and placed on the image tray. ECL substrate and peroxide (Cytiva) were mixed, applied to the entire membrane and drained before acquisition on the LI-COR Fc Odyssey imager.
Only MS grade organic solvents were used during sample preparation, except chloroform (CHCl3, certified ACS). Buffer A is 0.1% formic acid in 5% acetonitrile (ACN)/H2O, v/v. Buffer B is 0.1% formic acid in 80% ACN/H2O, v/v.
Samples (100 μg lysates or 40 μL eluates) were transferred to low-protein-binding microcentrifuge tubes and brought up to 100 μL with H2O and mixed well by vortex mixer at slowest mode. 400 μL MeOH, 100 μL CHCl3 and 300 μL H2O were added sequentially, with gentle vortex mixing after each addition. After centrifugation twice at 12,500× g for 5 min, protein pellets form between the interface of the two liquid phases. Majority of the upper liquid layer was removed carefully by aspiration. The remnant was cleaned by adding 400 μL MeOH, vortex mixing, hard spinning for at least 15 min and supernatant aspiration, repeated ≥3 times. Protein pellets were dried in air.
Dried protein pellets were resuspended in 3 μL 1% Rapigest in H2O, followed by addition of 47 μL 100 mM HEPES, pH 8.0. Proteins were then reduced by 10 mM tris(2-carboxyethyl)phosphine (TCEP, Millipore Sigma) for 30 min at 37°C, alkylated by 5 mM iodoacetamide (Millipore Sigma) for 30 min in dark at ambient temperature and digested by trypsin (Thermo Fisher Scientific, final concentration 0.01 μg μL–1) overnight (16–24 h) at 37°C with 600-rpm agitation. Tryptic digestion was quenched by adding formic acid (Acros) to pH 2.0. Acidified samples were heated at 37°C for 1 h and hard spun for 30 min to precipitate Rapigest decomposition products. Clarified samples were transferred to new low-protein-binding tubes. This process of heating and hard spinning was repeated twice. Samples were stored in freezer ≤ −50°C until analysis.
Dried protein pellets were resuspended in 9 M urea in 25 mM NH4HCO3, pH 7.8 (or 50 mM Tris, pH 8.0). Proteins were then reduced by 10 mM TCEP in 200 mM NH4HCO3, pH 7.8 (or 50 mM Tris pH 8.0) for 30 min at 37°C, alkylated by 10 mM iodoacetamide in 25 mM NH4HCO3, pH 7.8 (or 50 mM Tris pH 8.0) for 30 min in dark at room temperature. Samples were diluted with 25 mM NH4HCO3, pH 7.8 (or 50 mM Tris pH 8.0) to ≤2 M urea and brought to 1 mM CaCl2, before digested by trypsin (Thermo Fisher Scientific, final concentration 0.01 μg μL–1) overnight (16–24 h) at 37°C with agitation. For sample volume greater than 60 μL, we used an orbital shaker at 37°C and 600 rpm. For samples of 20 μL, we placed those samples inside a 37°C incubator, with 300 rpm agitation, to avoid water evaporation and condensation at the EP tube cap. Tryptic digestion was quenched by adding formic acid (Acros) to pH 2.0 and digests stored in freezer (≤–50°C) until analysis.
Monophasic C18 trapping columns were prepared by polymerizing a Kasil 1624 (next advance) frit into a 150-µm-inner-diameter fused silica capillary (Polymicro, Molex) and then packing with 2.5-cm-long reversed-phase 5 µm Aqua C18 resin (125 Å, Phenomenex). Analytical columns were prepared by pulling a 150-µm-inner-diameter fused silica capillary (Polymicro, Molex) with a P-2000 laser tip puller (Sutter Instrument Co., Novato, CA), followed by packing with 30-cm reversed-phase 3 µm Aqua C18 resin (Phenomenex). Columns were washed with MeOH and Buffer A prior to use.
For PRM peptide selection, in general, we required that peptides i) be 8-25 amino acids long, ii) do not contain methionine or tyrosine, iii) do not contain ragged ends of tryptic digestion (Rauniyar, 2015), and iv) be available in NIST peptide tandem mass spectra library (Stein, 2008). For cytAPEX peptides and some of chicken avidin peptides, we turned to Prosit (Gessulat et al., 2019) to predict their CID fragmentation patterns at NCE 35%. Uniqueness was examined by either using a background proteome in the Skyline software (MacLean et al., 2010), or by uploading the candidate precursor list into Nextprot (Schaeffer et al., 2017). For actin and tubulin, uniqueness was required at the class-level and not the family-level. For cytAPEX, actin and tubulin peptides, precursor ion chromatograms are used for quantification because little interference is observed. Mitochondrial matrix biotin carboxylases are at low levels in HEK293T lysate and chicken avidin should not be present in HEK293T lysate. Hence, their peptides were first evaluated from an avidin-purification sample digest in data dependent acquisition mode with the same LC gradient. Only pyruvate carboxylase (PC) peptides were used because they are the most abundant among the mitochondrial biotin carboxylases in our avidin purifications. We also removed peptides that were confirmed to be deamidated in avidin purification samples.
2 μL digest was analyzed using nLC-1000 (Thermo) with a 100-min ACN gradient (5 min from 1% B to 6% B, 15 min to 12% B, 25 min to 18% B, 35 min to 33% B, 5 min to 100% B, 5 min at 100% B, 5 min to 1% B, 5 min at 1%, 100 min in total; 500 nL/min flow rate). Eluted peptides were ionized by electrospray (3.0 kV) and scanned from 110 to 2000 m/z in the Orbitrap with resolution 30000 in MS1 at scheduled 10-min-long window. Targeted precursors were isolated (isolation window 2.0 m/z) and fragmented by collision-induced dissociation (CID, normalized collision energy NCE 35%, activation time 10 ms) in the ion trap, and detected in the orbitrap with a resolution of 7500. Raw data were imported into and analyzed with Skyline versions 19.1–22.2 (MacLean et al., 2010). Peak boundaries for integration were manually inspected and adjusted if necessary to include the entire peak. Where indicated, normalization was performed by dividing raw TTR peptide peak areas by either the TIC or raw peptide peak areas of the indicated normalization factor. The MS proteomics data and associated results files have been deposited to the Panorama Repository (Sharma et al., 2018) and are available at https://panoramaweb.org/GenereuxLab_MistargetingAssay.url.
15 μL avidin-purification digest from HEK293T cell expressing eGFP.N2 was analyzed using the same interface and LC gradient as in the PRM method. Eluted peptides were ionized by electrospray (3.0 kV) and scanned from 110 to 2000 m/z in the Orbitrap with resolution 30000 in data dependent acquisition mode. The top ten peaks from each full scan were fragmented by higher energy C-trap dissociation (HCD) using a normalized collision energy of 38%, a 100 ms activation time, and a resolution of 7500. Dynamic exclusion parameters were 1 repeat count, 30 ms repeat duration, 500 exclusion list size, 60 s exclusion duration, and 1.50 Da exclusion width. MS1 and MS2 spectra were searched with MSFragger version 3.4 (with FragPipe version 17.1 (Kong et al., 2017; Teo et al., 2021)) against a database of Uniprot human proteome database (downloaded with FragPipe, 2021-07-14), FLAG-APEX2-NES, erHRPN175S-KDEL and chicken avidin, and reverse sequences for each entry as the decoy set, with common contaminants (e.g., keratin, porcine trypsin, etc.). Closed searches were allowed for static modification of cysteine residues (57.02146 Da, carbamidomethylation), variable modification of methionine (15.9949 Da, oxidation), and N-terminal free amino group (42.0106 Da, acetylation), full tryptic peptidolysis specificity, and mass tolerance of 20 ppm for precursor mass and 20 ppm for product ion masses. Spectral matches were assembled and filtered with a false discovery rate (FDR) of 0.01 at peptide level.
For quantification of IB or PRM experiments of same types of conditions, we normalized individual densitometric signal or MS1 TIC-normalized peak area by the sum of all conditions. For the comparison across different PRM experiments with distinct drug treatment conditions, we divided individual raw peak area or global standard-normalized peak area datum to that of (MG132 and Veh.) sample (fold change) across 10 experiments. To be conservative, these fold changes were subjected to two-tailed heteroscedastic t-test in Excel, with Bonferroni correction (6 comparisons).
The datasets presented in this study can be found in online repositories. The names of the repository/repositories and accession number(s) can be found in the article/Supplementary Material. The MS proteomics data and associated results have been deposited to the Panorama Repository (Sharma et al., 2018) and are available at https://panoramaweb.org/GenereuxLab_ 1027 MistargetingAssay.url.
Ethical approval was not required for the studies on humans in accordance with the local legislation and institutional requirements because only commercially available established cell lines were used.
ZL: Conceptualization, Methodology, Writing–original draft, Writing–review and editing, Data curation, Investigation, Visualization. JG: Conceptualization, Methodology, Writing–original draft, Writing–review and editing, Funding acquisition, Project administration, Supervision.
The author(s) declare financial support was received for the research, authorship, and/or publication of this article. Support was provided by the University of California and NIH R01GM134125.
We gratefully acknowledge Y. Kishi for the generous gift of mycolactone A/B. We acknowledge the Analytical Chemistry Instrumentation Facility instrumentation at UCR. Part of Figure 1 was created with Biorender.com.
The authors declare that the research was conducted in the absence of any commercial or financial relationships that could be construed as a potential conflict of interest.
All claims expressed in this article are solely those of the authors and do not necessarily represent those of their affiliated organizations, or those of the publisher, the editors and the reviewers. Any product that may be evaluated in this article, or claim that may be made by its manufacturer, is not guaranteed or endorsed by the publisher.
The Supplementary Material for this article can be found online at: https://www.frontiersin.org/articles/10.3389/fchbi.2023.1288188/full#supplementary-material
Aebersold, R., Burlingame, A. L., and Bradshaw, R. A. (2013). Western blots versus selected reaction monitoring assays: time to turn the tables?. Mol. Cell. Proteomics 12 (9), 2381–2382. doi:10.1074/mcp.E113.031658
Arrieta, A., Blackwood, E. A., and Glembotski, C. C. (2017). “ER protein quality control and the unfolded protein response in the heart,” in Coordinating organismal physiology through the unfolded protein response. Editors R. Luke Wiseman, and C. M. Haynes (Cham: Springer International Publishing). 414:193–213. Current Topics in Microbiology and Immunology. doi:10.1007/82_2017_54
Berg Luecke, L., and Gundry, R. L. (2021). Assessment of streptavidin bead binding capacity to improve quality of streptavidin-based enrichment studies. J. Proteome Res. 20 (2), 1153–1164. doi:10.1021/acs.jproteome.0c00772
Bersuker, K., Nomura, D. K., Olzmann, J. A., Clark, W. H., Peterson, C. W., To, M., et al. (2018). A proximity labeling strategy provides insights into the composition and dynamics of lipid droplet proteomes. Dev. Cell 44 (1), 97–112.e7. doi:10.1016/j.devcel.2017.11.020
Bosch, J. A., Chen, C.-L., and Perrimon, N. (2021). Proximity-Dependent labeling methods for proteomic profiling in living cells: an update. Wiley Interdiscip. Rev. Dev. Biol. 10 (1), e392. doi:10.1002/wdev.392
Braakman, I., Helenius, J., and Helenius, A. (1992). Manipulating disulfide bond formation and protein folding in the endoplasmic reticulum. EMBO J. 11 (5), 1717–1722. doi:10.1002/j.1460-2075.1992.tb05223.x
Braunstein, I., Zach, L., Allan, S., Kalies, K. U., and Stanhill, A. (2015). Proteasomal degradation of preemptive quality control (pQC) substrates is mediated by an AIRAPL-P97 complex. Mol. Biol. Cell 26 (21), 3719–3727. doi:10.1091/mbc.e15-02-0085
Carr, S. A., Abbatiello, S. E., Ackermann, B. L., Borchers, C., Domon, B., Deutsch, E. W., et al. (2014). Targeted peptide measurements in Biology and medicine: best practices for mass spectrometry-based assay development using a fit-for-purpose approach. Mol. Cell. Proteomics 13 (3), 907–917. doi:10.1074/mcp.M113.036095
Carreras-Sureda, A., Pihán, P., Hetz, C., and Hetz, C. (2018). Calcium signaling at the endoplasmic reticulum: fine-tuning stress responses. Cell Calcium 70, 24–31. doi:10.1016/j.ceca.2017.08.004
Chen, J. J., Genereux, J. C., Qu, S., Hulleman, J. D., Shoulders, M. D., and Wiseman, R. (2014). ATF6 activation reduces the secretion and extracellular aggregation of destabilized variants of an amyloidogenic protein. Chem. Biol. 21 (11), 1564–1574. doi:10.1016/j.chembiol.2014.09.009
Chu, T.-T., Tu, X., Yang, K., Wu, J., Repa, J. J., and Yan, N. (2021). Tonic prime-boost of STING signalling mediates niemann–pick disease type C. Nature 596 (7873), 570–575. doi:10.1038/s41586-021-03762-2
Citterio, C., Vichi, A., Pacheco-Rodriguez, G., Aponte, A. M., Moss, J., and Vaughan, M. (2008). Unfolded protein response and cell death after depletion of Brefeldin A-inhibited guanine nucleotide-exchange protein GBF1. Proc. Natl. Acad. Sci. 105 (8), 2877–2882. doi:10.1073/pnas.0712224105
Cox, J., Hein, M. Y., Luber, C. A., Paron, I., Nagaraj, N., and Mann, M. (2014). Accurate proteome-wide label-free quantification by delayed normalization and maximal peptide ratio extraction, termed MaxLFQ. Mol. Cell. Proteomics 13 (9), 2513–2526. doi:10.1074/mcp.M113.031591
Degasperi, A., Birtwistle, M. R., Volinsky, N., Rauch, J., Kolch, W., and Kholodenko, B. N. (2014). Evaluating strategies to normalise biological replicates of western blot data. PLoS ONE 9 (1), e87293. doi:10.1371/journal.pone.0087293
Droujinine, I. A., Meyer, A. S., Wang, D., Udeshi, N. D., Hu, Y., Rocco, D., et al. (2021). Proteomics of protein trafficking by in vivo tissue-specific labeling. Nat. Commun. 12 (1), 2382. doi:10.1038/s41467-021-22599-x
Espinoza, M. F., Nguyen, K. K., Sycks, M. M., Lyu, Z., Quanrud, G. M., Montoya, M. R., et al. (2022). Heat shock protein Hspa13 regulates endoplasmic reticulum and cytosolic proteostasis through modulation of protein translocation. J. Biol. Chem. 298 (12), 102597. doi:10.1016/j.jbc.2022.102597
Förster, B., Demangel, C., and Thye, T. (2020). Mycolactone induces cell death by SETD1B-dependent degradation of glutathione. PLOS Neglected Trop. Dis. 14 (10), e0008709. doi:10.1371/journal.pntd.0008709
Frankenfield, A. M., Fernandopulle, M. S., Hasan, S., Ward, M. E., and Hao, L. (2020). Development and comparative evaluation of endolysosomal proximity labeling-based proteomic methods in human iPSC-derived neurons. Anal. Chem. 92 (23), 15437–15444. doi:10.1021/acs.analchem.0c03107
Garcia, Y. A., Velasquez, E. F., Gao, L. W., Gholkar, A. A., Clutario, K. M., Cheung, K., et al. (2021). Mapping proximity associations of core spindle assembly checkpoint proteins. J. Proteome Res. 20 (7), 3414–3427. doi:10.1021/acs.jproteome.0c00941
Gessulat, S., Schmidt, T., Zolg, D. P., Samaras, P., Schnatbaum, K., Zerweck, J., et al. (2019). Prosit: proteome-wide prediction of peptide tandem mass spectra by deep learning. Nat. Methods 16 (6), 509–518. doi:10.1038/s41592-019-0426-7
Heil, L. R., Remes, P. M., and MacCoss, M. J. (2021). Comparison of unit resolution versus high-resolution accurate mass for parallel reaction monitoring. J. Proteome Res. 20 (9), 4435–4442. doi:10.1021/acs.jproteome.1c00377
Hessa, T., Sharma, A., Mariappan, M., Eshleman, H. D., Gutierrez, E., and Hegde, R. S. (2011). Protein targeting and degradation are coupled for elimination of mislocalized proteins. Nature 475 (7356), 394–397. doi:10.1038/nature10181
Hobson, B. D., Choi, S. J., Mosharov, E. V., Soni, R. K., Sulzer, D., and Sims, P. A. (2022). Subcellular proteomics of dopamine neurons in the mouse brain. eLife 11, e70921. doi:10.7554/eLife.70921
James, C., Müller, M., Goldberg, M. W., Lenz, C., Urlaub, H., and Kehlenbach, R. H. (2019). Proteomic mapping by rapamycin-dependent targeting of APEX2 identifies binding partners of VAPB at the inner nuclear membrane. J. Biol. Chem. 294 (44), 16241–16254. doi:10.1074/jbc.RA118.007283
Juszkiewicz, S., and Hegde, R. S. (2018). Quality control of orphaned proteins. Mol. Cell 71 (3), 443–457. doi:10.1016/j.molcel.2018.07.001
Kadowaki, H., Nagai, A., Maruyama, T., Takami, Y., Satrimafitrah, P., Kato, H., et al. (2015). Pre-Emptive quality control protects the ER from protein overload via the proximity of ERAD components and SRP. Cell Rep. 13 (5), 944–956. doi:10.1016/j.celrep.2015.09.047
Kadowaki, H., and Nishitoh, H. (2019). Endoplasmic reticulum quality control by garbage disposal. FEBS J. 286 (2), 232–240. doi:10.1111/febs.14589
Kadowaki, H., Satrimafitrah, P., Takami, Y., and Nishitoh, H. (2018). Molecular mechanism of ER stress-induced pre-emptive quality control involving association of the translocon, derlin-1, and HRD1. Sci. Rep. 8 (1), 7317. doi:10.1038/s41598-018-25724-x
Kang, S. W., Rane, N. S., Kim, S. J., Garrison, J. L., Taunton, J., and Hegde, R. S. (2006). Substrate-Specific translocational attenuation during ER stress defines a pre-emptive quality control pathway. Cell 127 (5), 999–1013. doi:10.1016/j.cell.2006.10.032
Ke, M., Yuan, X., He, A., Yu, P., Chen, W., Shi, Y., et al. (2021). Spatiotemporal profiling of cytosolic signaling complexes in living cells by selective proximity proteomics. Nat. Commun. 12 (1), 71. doi:10.1038/s41467-020-20367-x
Kim, K.-E., Park, I., Kim, J., Kang, M.-G., Choi, W. G., Shin, H., et al. (2021). Dynamic tracking and identification of tissue-specific secretory proteins in the circulation of live mice. Nat. Commun. 12 (1), 5204–5209. doi:10.1038/s41467-021-25546-y
Klausner, R. D., Donaldson, J. G., and Lippincott-Schwartz, J. (1992). Brefeldin A: insights into the control of membrane traffic and organelle structure. J. cell Biol. 116 (5), 1071–1080. doi:10.1083/jcb.116.5.1071
Kong, A. T., Leprevost, F. V., Avtonomov, D. M., Mellacheruvu, D., and Nesvizhskii, A. I. (2017). MSFragger: ultrafast and comprehensive peptide identification in mass spectrometry–based proteomics. Nat. Methods 14 (5), 513–520. doi:10.1038/nmeth.4256
Kong, Q., Ke, M., Weng, Y., Qin, Y., He, A., Li, P., et al. (2022). Dynamic phosphotyrosine-dependent signaling profiling in living cells by two-dimensional proximity proteomics. J. Proteome Res. 21 (11), 2727–2735. doi:10.1021/acs.jproteome.2c00418
Kozlov, G., and Gehring, K. (2020). Calnexin cycle – structural features of the ER chaperone system. FEBS J. 287 (20), 4322–4340. doi:10.1111/febs.15330
Kurtoglu, M., Gao, N., Shang, J., Maher, J. C., Lehrman,, M. A., Wangpaichitr, M., et al. (2007). Under normoxia, 2-deoxy-d-glucose elicits cell death in select tumor types not by inhibition of glycolysis but by interfering with N-linked glycosylation. Mol. Cancer Ther. 6 (11), 3049–3058. doi:10.1158/1535-7163.MCT-07-0310
Lam, S. S., Martell, J. D., Kamer, K. J., Deerinck, T. J., Ellisman, M. H., Mootha, V. K., et al. (2015). Directed evolution of APEX2 for electron microscopy and proximity labeling. Nat. Methods 12 (1), 51–54. doi:10.1038/nmeth.3179
Lee, S.-Y., Cheah, J. S., Zhao, B., Xu, C., Roh, H., Kim, C. K., et al. (2023). Engineered allostery in light-regulated LOV-turbo enables precise spatiotemporal control of proximity labeling in living cells. Nat. Methods 20 (6), 908–917. doi:10.1038/s41592-023-01880-5
Lee, S. -Y., Kang, M. G., Park, J. S., Lee, G., Ting, A. Y., and Rhee, H. W. (2016). APEX fingerprinting reveals the subcellular localization of proteins of interest. Cell Rep. 15 (8), 1837–1847. doi:10.1016/j.celrep.2016.04.064
Legesse, A., Kaushansky, N., Braunstein, I., Saad, H., Lederkremer, G., Navon, A., et al. (2023). The role of RNF149 in the pre-emptive quality control substrate ubiquitination. Commun. Biol. 6 (1), 385. doi:10.1038/s42003-023-04763-9
Li, Y., Tian, C., Liu, K., Zhou, Y., Yang, J., and Zou, P. (2020). A clickable APEX probe for proximity-dependent proteomic profiling in yeast. Cell Chem. Biol. 27 (7), 858–865.e8. doi:10.1016/j.chembiol.2020.05.006
Liebler, D. C., and Zimmerman, L. J. (2013). Targeted quantitation of proteins by mass spectrometry. Biochemistry 52 (22), 3797–3806. doi:10.1021/bi400110b
Liu, J., Jang, J. Y., Pirooznia, M., Liu, S., and Finkel, T. (2021). The secretome mouse provides a genetic platform to delineate tissue-specific in vivo secretion. Proc. Natl. Acad. Sci. U. S. A. 118 (3), e2005134118. doi:10.1073/pnas.2005134118
Lobingier, B. T., Huttenhain, R., Eichel, K., Miller, K. B., Ting, A. Y., von Zastrow, M., et al. (2017). An approach to spatiotemporally resolve protein interaction networks in living cells. Cell 169 (2), 350–360 e12. doi:10.1016/j.cell.2017.03.022
Lyu, Z., and Genereux, J. C. (2021). Methodologies for measuring protein trafficking across cellular membranes. ChemPlusChem 86 (10), 1397–1415. doi:10.1002/cplu.202100304
Lyu, Z., Sycks, M. M., Espinoza, M. F., Nguyen, K. K., Montoya, M. R., Galapate, C. M., et al. (2022). Monitoring protein import into the endoplasmic reticulum in living cells with proximity labeling. ACS Chem. Biol. 17 (7), 1963–1977. doi:10.1021/acschembio.2c00405
MacLean, B., Tomazela, D. M., Shulman, N., Chambers, M., Finney, G. L., Frewen, B., et al. (2010). Skyline: an open source document editor for creating and analyzing targeted proteomics experiments. Bioinformatics 26 (7), 966–968. doi:10.1093/bioinformatics/btq054
McCaffrey, K., and Braakman, I. (2016). Protein quality control at the endoplasmic reticulum. Essays Biochem. 60 (2), 227–235. doi:10.1042/EBC20160003
McKenna, M., Simmonds, R. E., and Stephen, H. (2016). Mechanistic insights into the inhibition of sec61-dependent Co- and post-translational translocation by mycolactone. J. Cell Sci. 129 (7), 1404–1415. doi:10.1242/jcs.182352
McKenna, M., Simmonds, R. E., and Stephen, H. (2017). Mycolactone reveals substrate-driven complexity of sec61-dependent transmembrane protein biogenesis. J. Cell Sci. January, jcs, 198655. doi:10.1242/jcs.198655
Moncoq, K., Trieber, C. A., and Young, H. S. (2007). The molecular basis for cyclopiazonic acid inhibition of the sarcoplasmic reticulum calcium pump. J. Biol. Chem. 282 (13), 9748–9757. doi:10.1074/jbc.M611653200
Morel, J.-D., Paatero, A. O., Wei, J., Yewdell, J. W., Guenin-Macé, L., Van Haver, D., et al. (2018). Proteomics reveals scope of mycolactone-mediated Sec61 blockade and distinctive stress signature. Mol. Cell. Proteomics 17 (9), 1750–1765. doi:10.1074/mcp.RA118.000824
Mu, T.-W., Fowler, D. M., and Kelly, J. W. (2008). Partial restoration of mutant enzyme homeostasis in three distinct lysosomal storage disease cell lines by altering calcium homeostasis. PLoS Biol. 6 (2), e26. doi:10.1371/journal.pbio.0060026
Nebenfuhr, A., Ritzenthaler, C., and Robinson, D. G. (2002). Brefeldin A: deciphering an enigmatic inhibitor of secretion. Plant Physiol. 130 (3), 1102–1108. doi:10.1104/pp.011569
Ong, D. S. T., Mu, T.-W., Palmer, A. E., and Kelly, J. W. (2010). Endoplasmic reticulum Ca2+ increases enhance mutant glucocerebrosidase proteostasis. Nat. Chem. Biol. 6 (6), 424–432. doi:10.1038/nchembio.368
Paek, J., Kalocsay, M., Staus, D. P., Wingler, L., Pascolutti, R., Paulo, J. A., et al. (2017). Multidimensional tracking of GPCR signaling via peroxidase-catalyzed proximity labeling. Cell 169 (2), 338–349.e11. doi:10.1016/j.cell.2017.03.028
Perez Verdaguer, M., Zhang, T., Surve, S., Paulo, J. A., Wallace, C., Watkins, S. C., et al. (2022). Time-Resolved proximity labeling of protein networks associated with ligand-activated EGFR. Cell Rep. 39 (11), 110950. doi:10.1016/j.celrep.2022.110950
Peterson, A. C., Russell, J. D., Bailey, D. J., Westphall, M. S., and Coon, J. J. (2012). Parallel reaction monitoring for high resolution and high mass accuracy quantitative, targeted proteomics. Mol. Cell. Proteomics 11 (11), 1475–1488. doi:10.1074/mcp.O112.020131
Qin, W., Cheah, J. S., Xu, C., James, M., Freibaum, B. D., Boeynaems, S., et al. (2023). Dynamic mapping of proteome trafficking within and between living cells by TransitID. Cell 186, 3307–3324. doi:10.1016/j.cell.2023.05.044
Rane, N. S., Kang, S.-W., Chakrabarti, O., Feigenbaum, L., and Hegde, R. S. (2008). Reduced translocation of nascent prion protein during ER stress contributes to neurodegeneration. Dev. Cell 15 (3), 359–370. doi:10.1016/j.devcel.2008.06.015
Rauniyar, N. (2015). Parallel reaction monitoring: a targeted experiment performed using high resolution and high mass accuracy mass spectrometry. Int. J. Mol. Sci. 16 (12), 28566–28581. doi:10.3390/ijms161226120
Rhee, H. W., Zou, P., Udeshi, N. D., Martell, J. D., Mootha, V. K., Carr, S. A., et al. (2013). Proteomic mapping of mitochondria in living cells via spatially restricted enzymatic tagging. Science 339 (6125), 1328–1331. doi:10.1126/science.1230593
Rodrigo-Brenni, M. C., Gutierrez, E., and Hegde, R. S. (2014). Cytosolic quality control of mislocalized proteins requires RNF126 recruitment to Bag6. Mol. Cell 55 (2), 227–237. doi:10.1016/j.molcel.2014.05.025
Saha, B., Salemi, M., Williams, G. L., Oh, S., Paffett, M. L., Phinney, B., et al. (2022). Interactomic analysis reveals a homeostatic role for the HIV restriction factor TRIM5α in mitophagy. Cell Rep. 39 (6), 110797. doi:10.1016/j.celrep.2022.110797
Schaeffer, M., Gateau, A., Teixeira, D., Michel, P.-A., Zahn-Zabal, M., and Lane, L. (2017). The neXtProt peptide uniqueness checker: a tool for the proteomics community. Bioinformatics 33 (21), 3471–3472. doi:10.1093/bioinformatics/btx318
Schwabl, S., and Teis, D. (2022). Protein quality control at the golgi. Curr. Opin. Cell Biol. 75, 102074. doi:10.1016/j.ceb.2022.02.008
Sehgal, P., Szalai, P., Olesen, C., Praetorius, H. A., Nissen, P., Christensen, S. B., et al. (2017). Inhibition of the sarco/endoplasmic reticulum (ER) Ca2+-ATPase by thapsigargin analogs induces cell death via ER Ca2+ depletion and the unfolded protein response. J. Biol. Chem. 292 (48), 19656–19673. doi:10.1074/jbc.M117.796920
Sharma, A., Mariappan, M., Appathurai, S., and Hegde, R. S. (2010). “in vitro dissection of protein translocation into the mammalian endoplasmic reticulum,” in Protein secretion: methods and protocols. Anastassios economou and anastassios economou (Totowa, NJ, 339–63. doi:10.1007/978-1-60327-412-8_20
Sharma, V., Eckels, J., Schilling, B., Ludwig, C., Jaffe, J. D., MacCoss, M. J., et al. (2018). Panorama public: a public repository for quantitative data sets processed in skyline. Mol. Cell. Proteomics 17 (6), 1239–1244. doi:10.1074/mcp.RA117.000543
Stein, S. (2008). NIST libraries of peptide fragmentation mass spectra, NIST standard reference database 1 C. Natl. Inst. Stand. Technol. doi:10.18434/T4ZK5S
Teo, G. C., Polasky, D. A., Yu, F., and Nesvizhskii, A. I. (2021). Fast deisotoping algorithm and its implementation in the MSFragger search engine. J. Proteome Res. 20 (1), 498–505. doi:10.1021/acs.jproteome.0c00544
Van Bentum, M., and Selbach, M. (2021). An introduction to advanced targeted acquisition methods. Mol. Cell. Proteomics 20, 100165. doi:10.1016/j.mcpro.2021.100165
Walczak, C. P., Bernardi, K. M., and Tsai., B. (2012). Endoplasmic reticulum-dependent redox reactions control endoplasmic reticulum-associated degradation and pathogen entry. Antioxidants Redox Signal. 16 (8), 809–818. doi:10.1089/ars.2011.4425
Xiong, Z., Lo, H. P., McMahon, K.-A., Martel, N., Jones, A., Hill, M. M., et al. (2021). in vivo proteomic mapping through GFP-directed proximity-dependent biotin labelling in zebrafish. eLife 10, e64631. doi:10.7554/eLife.64631
Yoo, J., Mashalidis, E. H., Kuk, A. C. Y., Yamamoto, K., Kaeser, B., Ichikawa, S., et al. (2018). GlcNAc-1-P-Transferase–Tunicamycin complex structure reveals basis for inhibition of N-glycosylation. Nat. Struct. Mol. Biol. 25 (3), 217–224. doi:10.1038/s41594-018-0031-y
Zhang, X., and Shan, S. O. (2014). Fidelity of cotranslational protein targeting by the signal recognition particle. Annu. Rev. Biophys. 43, 381–408. doi:10.1146/annurev-biophys-051013-022653
Keywords: pre-emptive quality control, protein mislocalization, endoplasmic reticulum stress, APEX2 proximity labeling, parallel reaction monitoring
Citation: Lyu Z and Genereux JC (2023) Quantitative measurement of transthyretin mistargeting by proximity labeling and parallel reaction monitoring. Front. Chem. Biol 2:1288188. doi: 10.3389/fchbi.2023.1288188
Received: 03 September 2023; Accepted: 10 October 2023;
Published: 09 November 2023.
Edited by:
Cemil Aydoğan, Bingöl University, TürkiyeCopyright © 2023 Lyu and Genereux. This is an open-access article distributed under the terms of the Creative Commons Attribution License (CC BY). The use, distribution or reproduction in other forums is permitted, provided the original author(s) and the copyright owner(s) are credited and that the original publication in this journal is cited, in accordance with accepted academic practice. No use, distribution or reproduction is permitted which does not comply with these terms.
*Correspondence: Joseph C. Genereux, am9zZXBoZ0B1Y3IuZWR1
Disclaimer: All claims expressed in this article are solely those of the authors and do not necessarily represent those of their affiliated organizations, or those of the publisher, the editors and the reviewers. Any product that may be evaluated in this article or claim that may be made by its manufacturer is not guaranteed or endorsed by the publisher.
Research integrity at Frontiers
Learn more about the work of our research integrity team to safeguard the quality of each article we publish.