 Jayr H. Marin1
 Mónica B. Mamián-López2*
 Daniel R. Da Silva3Marcia L. A. Temperini1
 Ana Maria da Costa Ferreira3
- 1Laboratório de Espectroscopia Molecular, Instituto de Química, Universidade de São Paulo, São Paulo, Brazil
- 2Laboratório de Espectroscopia Molecular e Atômica, Centro de Ciências Naturais e Humanas, Universidade Federal do ABC, Santo André, Brazil
- 3Laboratório de Bioinorgânica, Catálise e Farmacologia, Instituto de Química, Universidade de São Paulo, São Paulo, Brazil
In this study, the main goal was to identify the intracellular targets of oxindolimine copper(II) complexes by SERS and Raman imaging of living HeLa cells, whose action as a cancer inhibitor has been previously determined. The used SERS probe was constituted of spherical gold nanoparticles together with the Raman reporter 5,5′-dithiobis-2-nitrobenzoic acid (DTNB) and oxindolimine copper(II) complexes, [Cu(isatp)Cl] and [Cu(nisatp)H2O]. Two excitation radiations were used to acquire living single HeLa cells images: 532 nm to acquire the conventional Raman information of the cells and 785 nm to acquire the localization of the modified SERS probe inside the cells. The Raman images of the main intracellular components were obtained by multivariate analysis, and the SERS images were obtained by univariate analysis using a Raman reporter. The SERS and Raman images showed that the complexes could enter the cells together with the gold nanoparticles, causing main damage to the nuclei and lipids-rich region. In addition, there was no evidence of water entry into the cell.
Introduction
The use of compounds containing metal ions for treating or preventing human illnesses is not new nor unknown, not to mention its indubitable relevance for providing functionality to cells (Anthony et al., 2020), a role that any purely organic compound cannot fulfill alone (Aung et al., 2017). The advantages of metallodrugs include a significant possibility of diverse geometries around the metal center (square planar, tetrahedral, square pyramidal, trigonal pyramidal, and octahedral environments). Such different geometries modulate the bioactivity of these compounds (Mjos and Orvig, 2014). Further, the availability of multiple oxidation states by the metal ions provides redox processes by stimuli-responsive drugs (Wang et al., 2019), amplifying the possibilities of modes of action. Among the wide range of metal compounds, metallodrugs have been extensively used for treating degenerative diseases such as cancer or rheumatoid arthritis as well as infectious diseases (Anthony et al., 2020; Yousuf et al., 2021). From this group, lithium-, bismuth- and platinum-based drugs are widely used for several pathological conditions, where the latter represents about 50% of cancer chemotherapies in use, despite its side effects (Dilruba and Kalayda, 2016; Zhou et al., 2020). Even less usual metal ions, as rhenium (I) or rhodium (III) have deserved extensive studies related to immunotherapies. A mitochondria-targeted rhenium (I) complex, integrating the clinical iron chelating agent deferasirox, was shown to elevate the methylation levels of histone, DNA, and RNA, inducing immunogenic apoptotic cell death, and exhibiting potent antitumor activity in vivo (Pan et al., 2020). A mtDNA-targeting rhodium (III) complex was recently also reported as an effective cancer immunotherapeutic agent, by activating the so called cGAS-STING signaling (cyclic GMP AMP synthase (cGAS)-stimulator of interferon genes (STING) (Zheng et al., 2023).
A common strategy for synthesizing these complexes is bonding suitable metal ions to ligands with biological activity. The coordination provides a permanent charge to the ligand, favoring interactions with crucial biomolecules such as DNA or specific proteins. Different ligands show such properties as penicillamine, quinolines or indoles, and oxindoles, to mention a few. Mainly, indoles occur naturally in biological systems and, upon oxidation, generate oxindoles, being the isatin ligand one of the most interesting, naturally found in plants, mollusks, and mammals’ tissues and fluids (Ferraz de Paiva et al., 2021). Metallodrugs containing isatin or its derivatives have shown an ability for DNA cleavage, topoisomerases, and kinases inhibition and formation of reactive oxygen species (ROS) acting as potential antitumor agents. In addition, many studies have observed more severe damage to tumor cells with complexes having copper as metal ions rather than when treated with analogous zinc (Miguel et al., 2015; Castelli et al., 2018; Mamián-López et al., 2021).
Even though these metallodrugs have been used for decades now, the understanding of their intracellular targets and mechanisms of action was not accurately reachable until recently, when developments in computational and analytical instrumentation have allowed us to “see” or monitor processes at a molecular scale, in real-time and even in living systems. The multitarget and prodrug (activation occurs at the target site or in its way) nature of these compounds, along with their high electronic and structural versatility, makes them still more exciting and challenging.
Various strategies have been applied in the search for elucidating the intracellular mode of action of some metallodrugs. Many combine instrumental techniques such as Nuclear Magnetic Resonance, UV-Vis, Liquid Chromatography-Mass Spectrometry, and High and Ultrahigh Performance Liquid Chromatography (Xiong et al., 2022). Even imaging approaches have been used to explore inside single cells or tissues through techniques such as Laser Ablation Inductively Coupled Plasma Mass Spectrometry (LA-ICP-MS) (Theiner et al., 2021), cryo-X ray tomography (XRT) (Conesa et al., 2020), fluorescence (XRF) (Bolitho et al., 2021), and synchrotron-IR spectroscopy (Lima et al., 2022). Among imaging techniques, fluorescence has also been broadly used for identifying certain regions inside the cell using a fluorophore (Peña et al., 2014).
Remarkably, among vibrational spectroscopies, Raman offers structural information for various moieties and, as an imaging technique, can reach the submicron scale without causing tissue damage or cell death for a typical image acquisition time. This technique has been used recently in many investigations in living cells, for instance, in breast cancer pathology at the aim of classification and diagnosis (Li et al., 2021; Cutshaw et al., 2023), of bacterial infections at the single-cell level (Lima et al., 2022), visualization and quantification of neurodegenerative protein aggregates (Sun and Chen, 2020), as well as imaging of lipid droplets content in prostate cell models (Hislop et al., 2022). We have previously shown that a strategy combining Raman spectroscopy along with multivariate analysis allows identifying at least four intracellular regions, following their chemical modifications upon treatment with metallodrugs in single living cells (Mamián-López et al., 2021). Although Raman signals can be highly informative in several samples, the generation of the SERS effect has become one of the most interesting strategies to enhance Raman scattering (Le Ru and Etchegoin, 2009). Here, the electromagnetic field intensifies in the surroundings of noble metal nanoparticles, and this phenomenon increases remarkably the signal from chemical species adsorbed on the nanostructured surface.
Metal nanoparticles for probing molecules in different media have been used in several systems comprising intracellular environments. For example, in human cells, nanoparticles have been used to image in vivo both tissue and single cells, taking advantage of their ability to uptake metal nanostructures under certain conditions of size, morphology, and surface nature (Spedalieri and Kneipp, 2022). Also, metal nanoparticles can be functionalized before entering the cells so that they can act as a carrier for a Raman reporter and/or as a drug deliverer (Navas-Moreno et al., 2017; Drescher et al., 2021).
In this work, a SERS probe built with 5,5′-dithiobis-2-nitrobenzoic acid (DTNB) as Raman reporter and two oxindolimine copper(II) complexes, [Cu(isatp)Cl] and [Cu(nisatp)H2O] (see Figure 1), new compounds of a class already reported as efficient antitumor compounds (da Costa Ferreira et al., 2020) were attached to semi-spherical gold citrate nanoparticles, A(cit) NPs, and they have been used for SERS imaging intracellular media to investigate the preferential targets of these metallodrugs in living HeLa cells. Also, Raman images of intracellular regions acquired between 2,800 and 3,500 cm−1 (-CH2, -CH3 of lipids and proteins and -OH modes) were obtained to improve the visualization of the whole system.
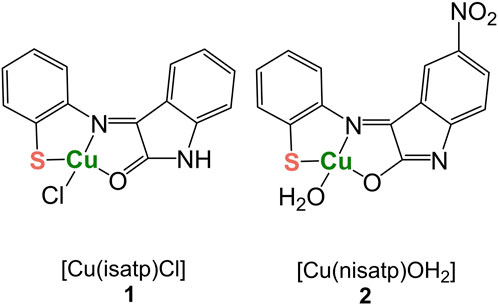
FIGURE 1. Structures of oxindolimine copper(II) complexes studied, [Cu(isatp)Cl] and [Cu(nisatp)H2O].
Experimental
Syntheses of the complexes [Cu(isatp)Cl] 1 and [Cu(nisatp)H2O] 2
The reagents isatin (isa) and 2-aminothiophenol (tp), in a proportion of 1:1 molar, were dissolved in ca. 50 mL of 96% EtOH. The resulting mixture was refluxed under a nitrogen atmosphere for 2 h, forming the ligands isatp {(E)-3-[(2-mercaptophenyl)imino]indolin-2-one} or nisatp {(E)-3-[(2-mercaptophenyl)imino]-5-nitro-3H-indol-2-ol}. After cooling the reaction mixture, an excess of CuCl2·2H2O dissolved in 96% ethanol was introduced, and the mixture was agitated for 10 min. After 2 days, the precipitated complex, [Cu(isatp)Cl], was filtered under low pressure, washed with cold ethanol, and stored in a desiccator under vacuum. Analogously, [Cu(nisatp)H2O] was synthesized by the same procedure using 5-nitroisatin (nisa) as the starting reagent. These complexes were characterized by UV-Vis, IR, and EPR spectroscopies and had their reactivity toward HeLa cells estimated.
[Cu(isatp)Cl]·1.5H2O: 1.: (C14H9N2OSClCu·1.5H2O, FW = 379.33 g/mol): Yield 45%, Elemental Anal.: Found (Calc): C: 44.36 (44.33); H: 3.01 (3.19); N: 7.37 (7.38). Matrix free MALDI-TOF MS Spectrum: m/z = 569.004 [ML-S-S-L]+ and 316.949 [ML]+. After 24 h treatment, at 37°C, for HeLa cells: IC50 = 88.7 ± 1.0 µM, and for fibroblasts: >100 µM.
[Cu(nisatp)H2O]∙0.5C2H5OH 2.: (C14H7N3O3SCu·0.5C2H6O, FW = 401.90 g/mol): Yield 48%, IC50 = 68.4 ± 1.0 µM, and for fibroblasts: >100 µM. Elemental Analysis.: Found (Calc): C: 47.24 (47.81); H: 2.55 (3.01); N: 10.58 (10.45). After 24 h treatment, at 37°C, for HeLa cells.
The complexes were isolated in the solid phase in different tautomeric forms, depending on the pH adjusted during the synthesis: [Cu(isatp)] was obtained in the keto form, and [Cu(nisatp)] in the enol form. In both, the thiol group is ionized, as shown in Figure 1.
The chosen complexes [Cu(isatp)Cl] and [Cu(nisatp)H2O] were not the most active in the studied series since we wanted a reactive compound that damages the cells but does not destroy them (Cerchiaro et al., 2005; Mamián-López et al., 2021). Along this text for clarity, these complexes are named [Cu(isatp)] and [Cu(nisatp)].
Synthesis of gold nanoparticles
Semi-spherical nanoparticles were synthesized according to the Lee-Miesel procedure (Lee and Meisel, 1982). Briefly, 97 mL of a 0.626 mmol L−1 HAuCl4.3H2O solution was brought to a boil with vigorous stirring. After thermal equilibrium was reached, 3 mL of a hot 1% (w/v) sodium citrate solution was added to the reaction mixture, and a red colloidal dispersion was obtained. The resulting colloid had an extinction spectrum with maxima at ca. 524 nm, indicating the formation of gold nanoparticles at a size of approximately 26 nm of the gold nanoparticles having citrate as stabilized ligand, Au(cit) NPs (Haiss et al., 2007). The extinction spectrum and the confirmatory transmission electronic microscopy (TEM) images are shown in Supplementary Figure S1.
Raman and SERS measurements
It was not possible to obtain the Raman spectra of the complexes for all visible and near IR radiations (1,064 nm) due to the great luminescence presented in all spectra.
SERS spectra were registered using a 1 mmol L−1 solution of the complexes dissolved in DMSO:water (1:50) solution. 100 μL of the complexes solution and 400 µL of Au(cit)NPs colloidal dispersion were mixed, and the SERS spectra were obtained. SERS and Raman spectra were recorded in a Renishaw InVia Confocal Raman Microscope spectrometer using a quartz cuvette with laser radiation at λ0 = 785 nm (SERS spectra) or 532 nm (Raman spectra) and a diffraction grating of 1,200 lines/mm.
Conditioning of HeLa cells
HeLa cells (cervical tumor cells, CCL-2, obtained from ATCC) were incubated on small quartz Petri dishes with DMEM (Dulbecco’s Modified Eagle’s Medium) containing 10% FBS (Fetal Bovine Serum), at 37°C, in a 5% CO2 atmosphere. After 24 h, the culture medium was removed, and the adhered cells were washed three times with PBS (Phosphate Buffer Saline), maintained under PBS solution, and used as control cells. Treated cells were incubated for another 16 h with the respective assemblies, at 37°C, then washed three times with PBS and maintained under PBS solution during the imaging procedure. Previous HeLa cell viability data, in the presence of studied copper complexes, were evaluated by the tetrazolium dye reduction assay (MTT), compared to non-tumorigenic human foreskin fibroblasts P4 cells (see Supplementary Figure S2). These fibroblasts P4 cells were isolated from tissues at Faculty of Pharmaceutical Sciences-USP in the laboratory of Professor Silvya Stuchi Maria-Engler (Kim et al., 2013). Intake of copper ions in Hela cells after 6 h and 24 h with complexes 1 and 2, in comparison with aqua-copper ions, [Cu(H 2 O) 4 ] 2+, at 37°C is shown at Supplementary Figure S3. The determination of intracellular copper concentrations was done by ESI-MS measurements.
SERS and Raman mapping
For image acquisition, the culture medium was removed and substituted with a fresh PBS solution. A Renishaw InVia Confocal Raman Microscope spectrometer was used with excitation at λ0 = 785 nm for SERS imaging, with the diffraction grating centered at 1,340 cm−1, and λ0 = 532 nm for Raman imaging, with the diffraction grating centered at 3,020 cm−1. The objective used was a water immersion Leica ×63 with a N.A of 0.90. The airy disk radius (r) was calculated as r = 0.61x (wavelength/N.A). For 785 nm the airy disk has a diameter of 1.064 µm, and for 532 nm, 0.721 µm. Thus, a 1 µm pixel is enough to resolve the Raman mappings.
First, the SERS images were obtained. After this procedure, Raman images of the same cells were acquired. The spatial resolution between each pixel was 1 µm and the integration time for each spectrum was 0.5 s. This two-radiation strategy was adopted due to the complementary information they supplied: the first radiation source allows detecting SERS intensification from the Raman reporter, while the latter one allows collecting information from lipids, proteins, and water vibration modes, which is useful for building chemical maps from specific cells regions, as the membrane, nuclei, and water content, for example, as widely described in the literature (Talari et al., 2015; Li et al., 2019). Besides, irradiating with λ0 = 532 in the presence of AuNPs could generate a luminescence background in the spectra (Dilruba and Kalayda, 2016).
Data processing
All spectra processing and image building were performed in Matlab (MATLAB 9.11.0.1837725 (R2021b) Update 2). PCA analyses and preprocessing were performed on PLS Toolbox (Eigenvector Inc.). The MCR-ALS method was run using the MCR Toolbox. (Jaumot et al., 2015; de Juan and Tauler, 2021).
The image background was removed using a digital mask based on a threshold value statistically chosen from the raw chemical maps, in a way that those pixels with relative abundance values than it were kept, and the remaining were filled with zeros. Due to the natural variability found in each cell, the threshold is necessarily different for each one and its choice was automated within the digital mask command lines.
Datasets were arranged as matrices, spikes (instrumental noise) were manually removed, and the baseline was corrected using an Asymmetric Least Squares procedure with a polynomial of order: 2, λ = 10,000, p = 0.001.
Different cell samples were investigated: control samples (untreated), samples (treated with [Cu(isatp)], [Cu(nisatp)], Au(cit) NPs, Au(cit) NPs with attached DTNB, Au(cit) (DTNB) NPs and finally Au(cit) (DTNB) NPs attached with one of the complexes, giving Au(cit) (DTNB) (Cu(isatp) and Au (cit) (DTNB) (Cu(nisatp). Firstly, an exploratory analysis was applied for each of the seven different groups of samples separately to estimate a preliminary number of principal components and investigate intragroup variability. Before this procedure, spectra were mean-centered.
Before running the MCR method, Singular Value Decomposition (SVD) and SIMPLe-to-use Interactive Self Modeling Analysis (SIMPLISMA) were applied to determine the number of “purest” components in each dataset and the profile of the spectral factors. For calculating this, MCR-ALS was constrained with no negativity in spectra and concentrations and using 1.0 as the convergence criterion. The calculation stopped when no significant variation was observed in the model for two consecutive iterations.
Raman and SERS images were built with the relative concentration matrix calculated by MCR-ALS. These values were normalized to the maximum value and reshaped to the xy dimension used during the spectroscopic mapping, where x and y are the numbers of pixels.
Results and discussion
SERS spectra of oxindolimine copper(II) complexes
The interaction between the surface of Au (cit) NPs and the [Cu(nisatp)] and [Cu(isatp)] complexes were investigated through their respective SERS spectra. Supplementary Figure S4; Supplementary Table S1 presents a tentative vibrational bands assignment.
Despite that the SERS spectra of the oxindolimine copper(II) complexes with a moderate signal-to-noise ratio could be acquired, this scenario changes when the system Au(cit)-complex NPs requires to be incubated with cell culture for periods no longer than 16 h, at high concentrations. These complexes easily induce nanoparticle aggregation in the aqueous medium with time, and in consequence, a significant lowering in the signal intensity is observed. Therefore, this undesirable effect was avoided using complex concentrations lower than the corresponding IC50 values (68.89 ± 3.31 and 93.95 ± 5.78 µmolL−1 for [Cu(nisatp)] 2 and [Cu(isatp)] 1, respectively). Also, to overcome those disadvantages, a Raman reporter, which has a high scattering cross-section, was used to obtain SERS images of living cells.
The introduction of a Raman reporter
The SERS spectrum of 5,5′-dithiobis-2-nitrobenzoic acid, DTNB, chosen as the Raman reporter in the colloidal solution of Au(cit) NPs, is depicted in Figure 2. The DTNB is widely used in protein quantification through UV-Vis spectroscopy, and one of its main structural characteristics is the presence of a disulfide bridge that can be chemically cleaved, for example, in the presence of sodium borohydride in an alkaline medium (Wang et al., 2015). Similarly, upon interaction with the gold surface, its high affinity towards the sulfur atom can break the -S-S chemical bond, allowing the AuNPs functionalization, as shown in Scheme 1.
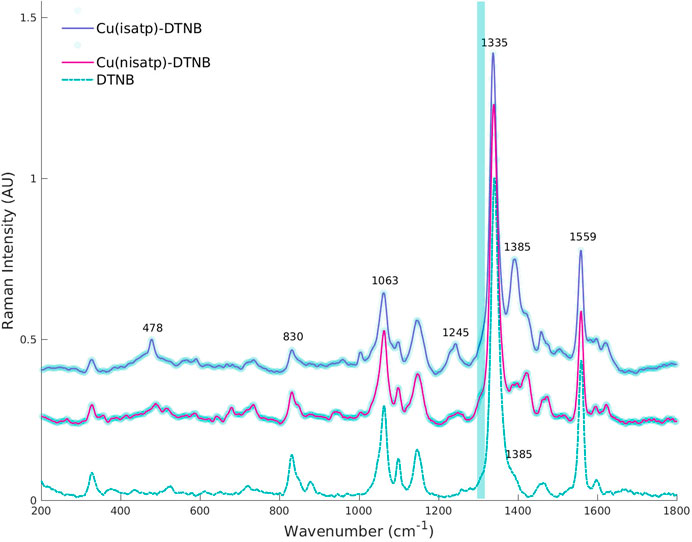
FIGURE 2. SERS spectra of colloidal Au(cit) (DTNB) [Cu(isatp)] and Au(cit) (DTNB) [Cu(nisatp)] and Au(cit) (DTNB) NPs solutions under 785 nm radiation. Spectra were normalized to its maximum value and stacked for better visualization. Turquoise stripe highlights the νs (NO2) ca. 1,323 cm−1 of Cu(nisatp), discussed in the main text.
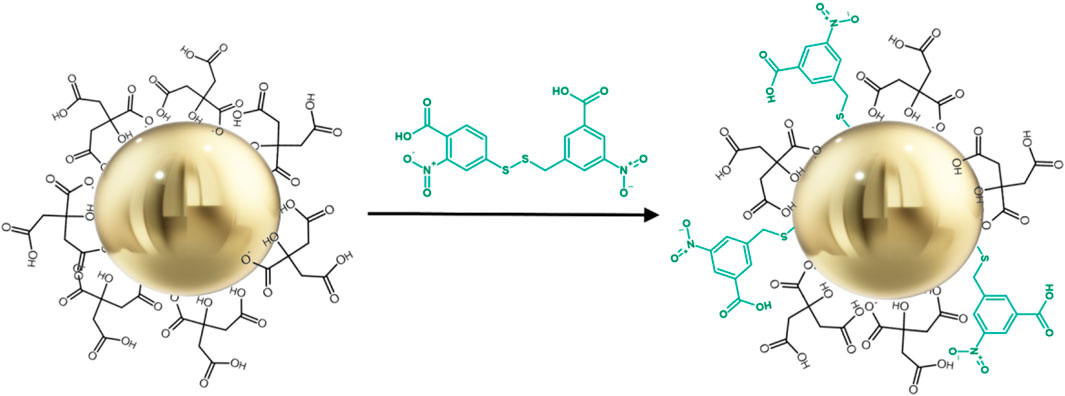
SCHEME 1. Functionalization of Au (cit) NPs with DTNB and cleavage of the -S-S bridge.
The SERS spectrum of DTNB shows a main band located at 1,340 cm−1, corresponding to the νs (NO2) mode, chosen as the marker mode for the cell mappings. In addition, as observed in Supplementary Figure S5, it is worth mentioning the presence of an Au-S band at 322 cm−1, confirming the disulfide bridge cleavage and the formation of a chemical bond between sulfur and gold.
Then, the SERS probe was completed by the adsorption of the complexes on the Au(cit) (DTNB) NPs. The SERS spectrum of the whole nanostructured architecture was acquired in the colloidal aqueous medium, as shown in Figure 2. It is noticeable that the νs (NO2) band at 1,340 cm−1 due to DTNB remains in both Au(cit) (DTNB) (complex) NPs spectra and, in addition, a band with contribution from the imine modes [νs (NC) + ν(CO)] at 1,393 cm−1 appears, attesting the presence of isatp and nisatp ligands.
A closer view of the spectral region near the strong band of νs (NO2) at 1,340 cm−1 due to DTNB shows slight differences in shape and frequency values for each SERS probe. For Au(cit) (DTNB) (Cu(isatp) NPs at frequencies higher than 1,340 cm−1, a band is observed at 1,393 cm−1, assigned as the imine. In the case of the Au(cit) (DTNB) [Cu(nisatp)] NPs, the spectrum also shows this band with a lower intensity and at lower frequencies from the strong band of the DTNB νs (NO2) mode, a shoulder at 1,323 cm−1 is observed (Supplementary Figure S5), which could be assigned to νs (NO2) located at the nisa moiety. Besides, the absence of wavenumber shifts in these spectra suggests that the metal complexes and the DTNB do not interact chemically. The findings at this stage indicate that the DTNB choice is suitable for SERS imaging of living cells, and a deeper understanding of the spectral behavior will be discussed in the sections ahead.
SERS spectra of living cells
Two main sets of experiments (in the absence and presence of Au NPs) were employed to study the effect of the metallodrugs in the intracellular environment, as detailed in Table 1. In the first set, cells were treated with either [Cu(isatp)] and [Cu(nisatp)] to evaluate their effect in the absence of Au(cit) NPs. In the second set, Au(cit) NPs were present in all cases, with their assemblies modified as indicated. Also, Raman spectra were acquired for cells without any treatment as a control experiment. Therefore, the discussion will rely on the chemical images built from mappings registered under 785 (for acquiring SERS signals) and 532 nm radiation (for acquiring Raman signals from lipids, proteins, and water).
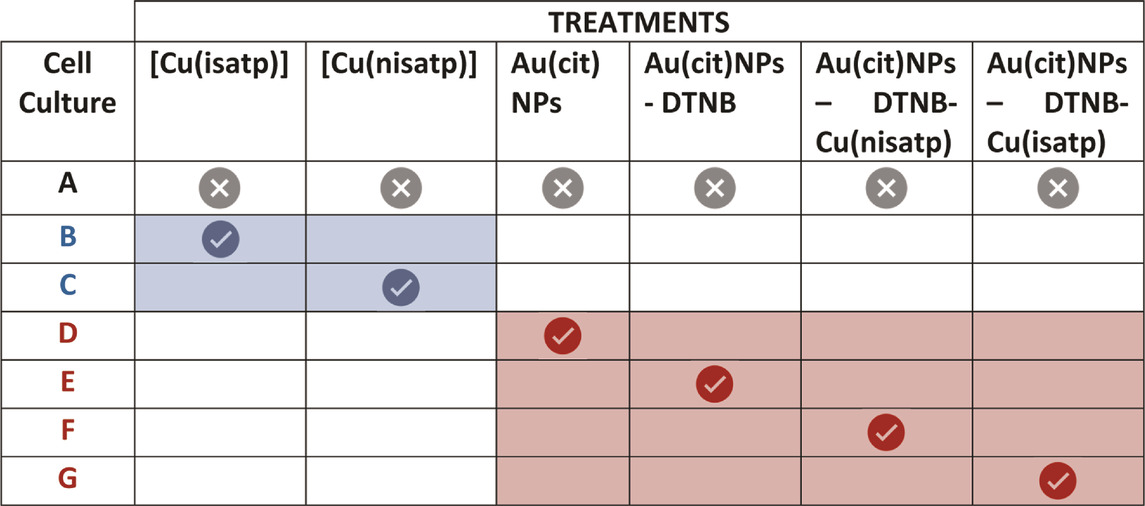
TABLE 1. Cells culture groups studied.
A preliminary data mining procedure was performed on the Raman spectra λ0 = 532 nm of each group of cells, separately, through PCA analysis, to identify the main intercellular differences upon each treatment applied. The standard deviation (SD) for the variance explained by each principal component (PC) was calculated to estimate this. The results depicted in Figure 3 give an initial hint about the extent of damage suffered by the cell groups D, E, F, and G compared to control cell group A. It is expected to observe a certain degree of variability due to the natural characteristics of cells, i.e., intracellular processes at different stages during the mapping acquisition, as seen in A cell’s subplot. This behavior is similar for the D and E groups, where the cells are in the presence of Au(cit) NPs or Au(cit) (DTNB) NPs, respectively. For this last group, though, it seems that for components 2 and 3, there is a slight increase in variability, suggesting that the presence of Au(cit) (DTNB) NPs could cause a different response in the cells when compared to Au(cit) NPs alone or control cells.
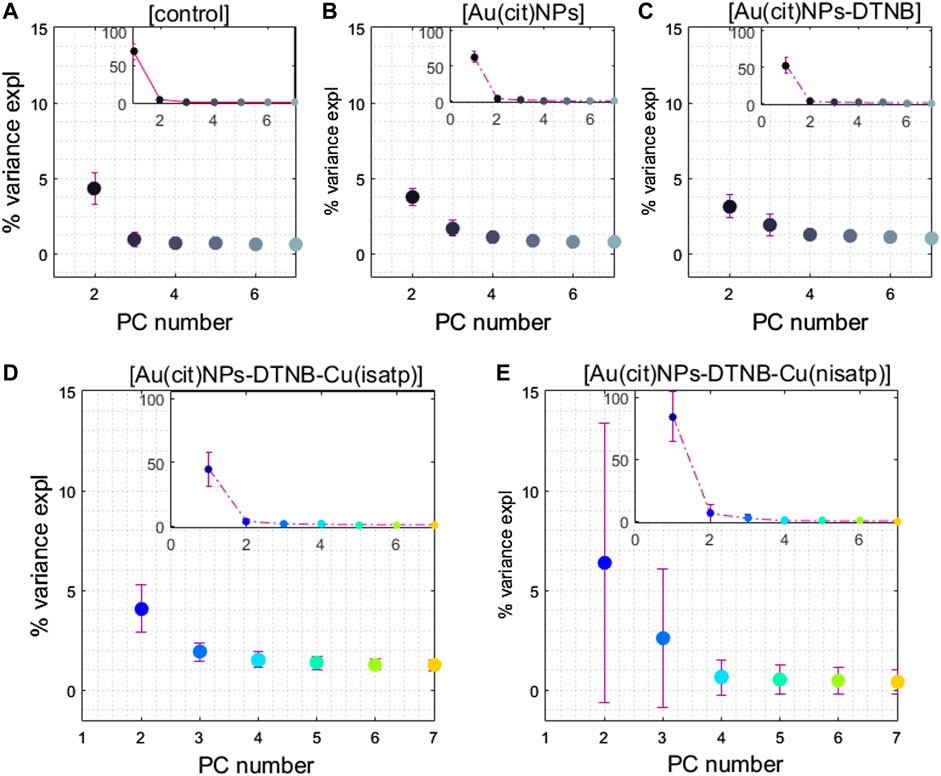
FIGURE 3. Variation in number of PCs and variance explained (%) for cells belonging to groups (A) control, (B) Au(cit) NPs, (C) Au(cit) (DTNB) NPs, (D) Au(cit) (DTNB) [Cu(isatp)] NPs and (E) Au(cit) (DTNB) [Cu(nisatp)] NPs. Inset plot includes the PC1 for visualizing the entire trend.
For F cells containing Au(cit) (DTNB) [Cu(isatp)] NPs, it is interesting to notice a higher intracellular variability for the second component. The % of explained variance remains constant from the third component, contrary to the behavior of A, D, and E groups, where components 1 to 3 store a significant amount of explained variance, which could indicate that at least for a fraction of the cells, chemical changes are occurring that could be observed through the calculated spectral profile. Finally, the remarkable difference among the cells of group G is clearly showing that the Au(cit) (DTNB) [Cu(nisatp)] NPs system is causing chemical modifications observable through the Raman spectra.
As Raman signals are highly specific and, in the case of living cells, can offer fingerprints of their chemical components, the first approach was performed through a curve resolution method, MCR, to separate the most important fingerprints in the datasets.
Three main MCR factors or spectral profiles could be resolved for the control experiments spectra (group A, cells without any treatment), whose spatial distribution is depicted in Figures 4E–G. Component 1 represents the OH symmetric and asymmetric stretching modes from water content (Figure 4B). It is noticeable, in image 4E, that its distribution, as expected, is higher close to the internal part of the membrane. Component 2 (Figure 4C) is related to regions with high protein content, and it is distributed along the entire cell but concentrated in the nucleus/nucleolus region, as seen in Figure 4F. Finally, the lipid-rich regions are described in component 3 (Figure 4D), located mainly in the cytoplasm, image 4G. The optical image (Figure 4A) confirms the location of these regions. The chemical images and spectra for cells upon treatment will be analyzed using this cells group as reference, used as a control experiment in our study.
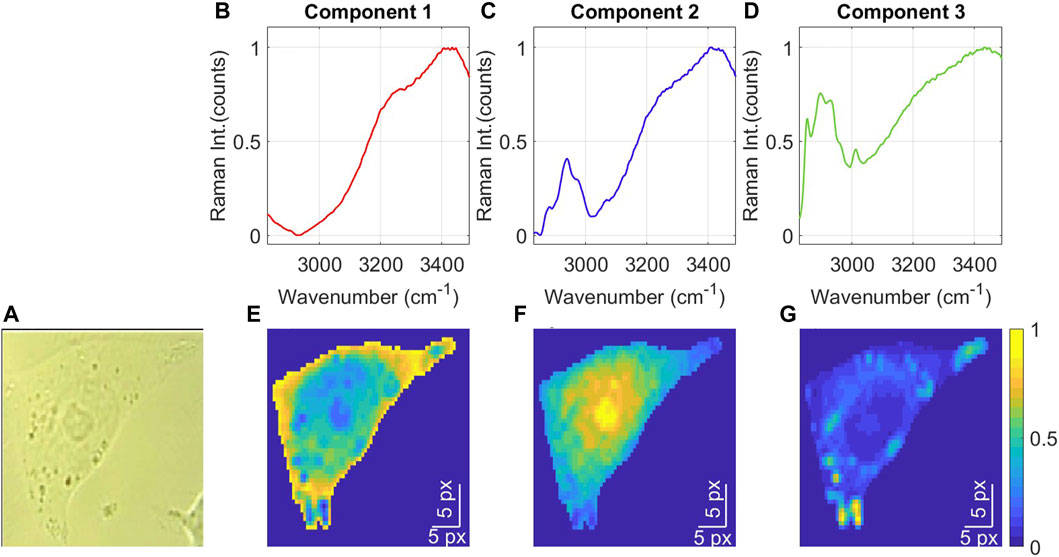
FIGURE 4. Cell A (control): Bright field image (A) and spectral profiles calculated with MCR-ALS for components 1 (B), 2 (C), and 3 (D), and their respective Raman images (E–G) at λ=532 nm. Image size: 37 × 26 px (37 × 26 µm).
The Raman images, obtained by using 532 nm exciting radiation, for both B and C groups of cells, treated with [Cu(isatp)] or [Cu(nisatp)], showed no damage to the cells’ structure, also confirmed by their respective optical images, as can be observed in Supplementary Figures S7–S16.
When the cells were incubated with Au(cit) NPs (group D), a noticeable signal enhancement was observed for several bands, mainly in the region between 1,200 and 1,500 cm−1. This SERS enhancement occurs due to Au NPs and the proper exciting radiation at 785 nm. In addition, vibrational modes from the cytoplasm, corresponding to lipids and proteins, as well as characteristic bands assigned to nucleic acids such as guanine and adenine, were identified. An example of this enhancement in the intracellular environment is shown in Supplementary Figure S6, and a more detailed band assignment can be found in Supplementary Table S2. Also, notice the signal enhancement obtained compared with the spectra from A cells, where Au(cit) NPs are absent.
Again, the chemical image obtained under 532 nm radiation showed that the membrane structure seems to be without damage; changes in the spectra between 3,000 and 3,450 cm−1 suggested an increase in the intracellular water content, which could mean a slight membrane permeation induced by the AuNPs. Other regions inside the cell show no apparent damage, as illustrated in the chemical maps for D cell in Figure 5.
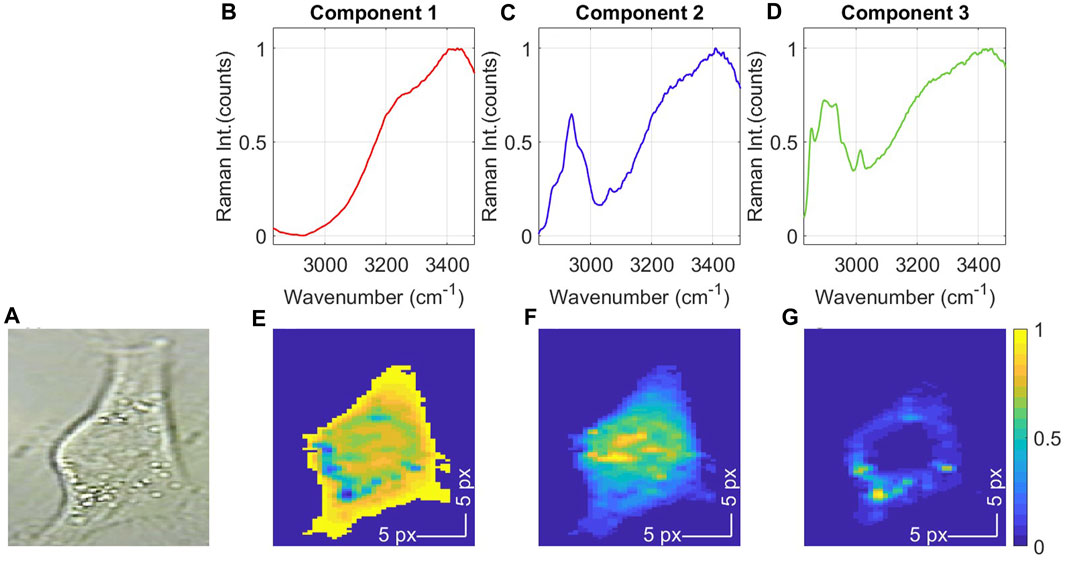
FIGURE 5. Cell D [cells incubated with Au(cit) NPs]: Bright field image (A) and spectral profiles calculated with MCR-ALS for components 1 (B), 2 (C), and 3 (D), and their respective Raman images (E–G) at λ=532 nm. Image size: 21 × 48 px (21 × 48 µm).
For the E group, containing the DTNB assembled on the Au(cit) NPs, it was verified through both optical and chemical images that the location of Au(cit) (DTNB) NPs through the intensified νs (NO2) band match inside the cell, confirming that, firstly, Au(cit) (DTNB) NPs can enter the cell and secondly, the DTNB remains attached to the metallic surface. However, the profile of the MCR component describing regions with high lipids concentration appears modified regarding the A cells group, suggesting that lipids content in cells in the presence of DTNB was affected. At the same time, the intracellular water content increased, as shown in Figure 6, and the image shows that the cellular wall was severely damaged. Besides, the component 2 distribution shows unusually big protein agglomerates, suggesting that the nuclei content was scattered inside the cell, mainly in the cytoplasm. Cells in the same E group showed similar behavior; even for some of them (Supplementary Figure S13), the MCR method could not resolve the lipidic component, probably due to modifications on the cell or influence of the DTNB attached to the Au(cit) NPs on the spectra themselves.
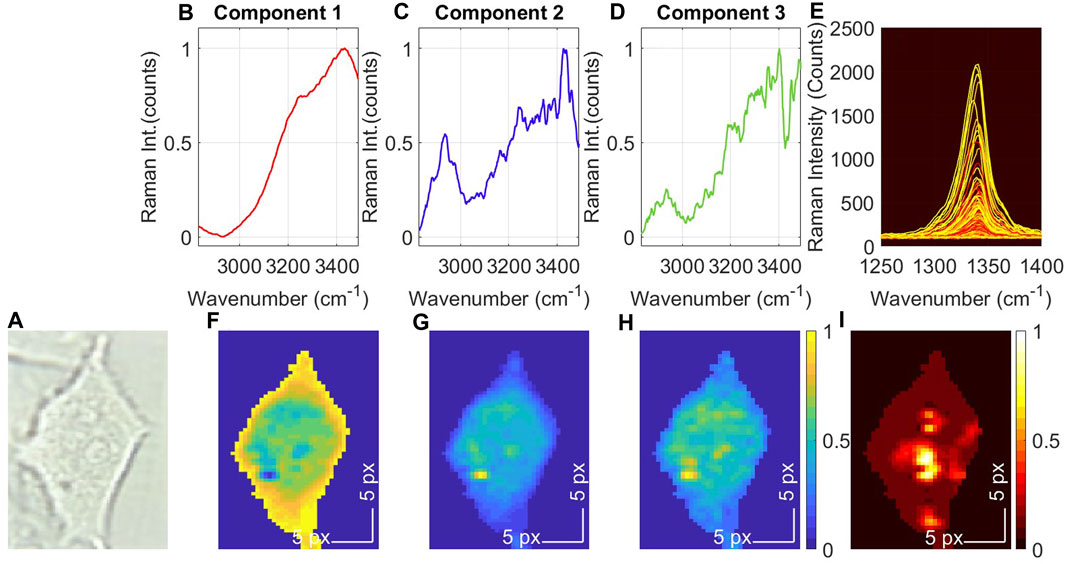
FIGURE 6. Cell E [cells with Au(cit) (DTNB) NPs]: Bright field image (A) and spectral profiles calculated with MCR-ALS for components 1 (B), 2 (C), and 3 (D), and their respective Raman images (F–H) at λ=532 nm. SERS spectra (E) for the νs (NO2) mode and its respective SERS image (I) at λ=785 nm. Image size: 20 × 33 px (20 × 33 µm).
Cells treated with the assembly Au (cit) (DTNB) (metallodrug) NPs
The optical and chemical maps analysis allowed identifying remarkable characteristics upon the cell’s incubation with the metallodrugs. The first one was related to the number of MCR factors resolved as describing the whole variability in the cell’s spectra. Contrary to all the other cell groups studied, the number of spectral factors resolved by the MCR method was only two, with a clear absence of the lipids factor. This result matches with a second observation where the optical image shows that the Au(cit) (DTNB) (metallodrug) NPs are located preferentially in lipid-rich regions, suggesting that lipids could be at least one of the main targets during the metallodrug mechanism of action. This is shown in Figure 7 for cells from group F [cells with Au(cit) (DTNB) (Cu(nisatp)] NPs.
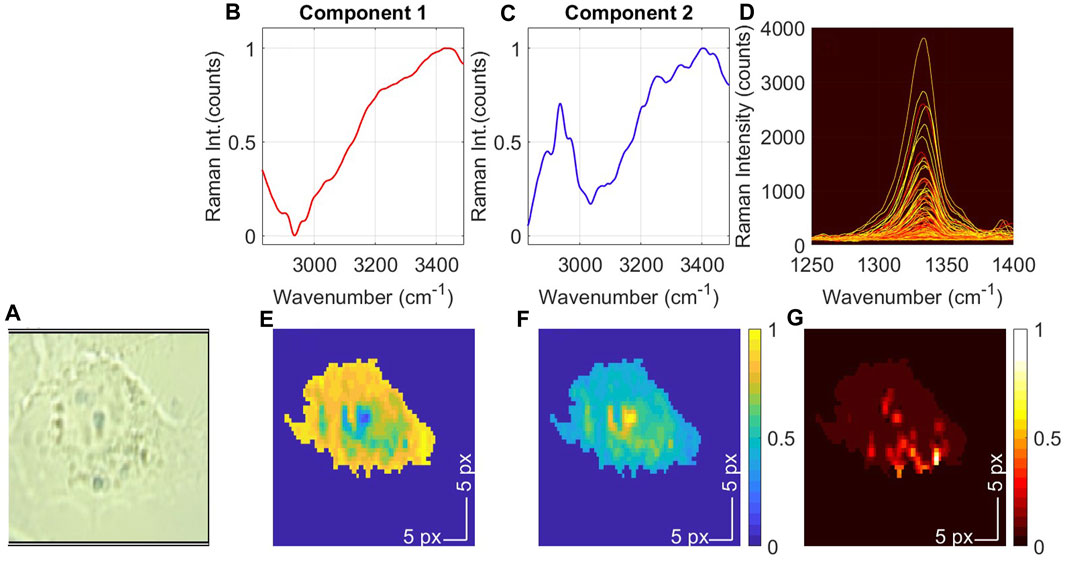
FIGURE 7. Cell F [cells with Au(cit) (DTNB) (Cu(nisatp)] NPs: Bright field image (A) and spectral profiles calculated with MCR-ALS for components 1 (B) and 2 (C) (λ=532 nm) and their respective Raman images (E,F). SERS spectra (D) for the νs (NO2) mode and its respective SERS image (G) at λ=785 nm. Image size: 44 × 26px (44 × 26 µm).
Another important effect of this treatment was related to the changes found in the protein distribution, i.e., the factor 2 from MCR. Their distribution appears highly dispersed inside the cell, indicating possible damage and leaking of the nucleus content. It is also interesting that the water pattern for cells F and G [treated with Au(cit) (DTNB) (Cu(nisatp) and Au(cit) (DTNB) (Cu(isatp) NPs respectively] is comparable to the control cells, which means that the assembly Au(cit) (DTNB) (metallodrug) NPs does not break the membrane structure to the point of allowing entering water through it. The same behavior is observed in both images and spectral MCR profiles in Figure 8, corresponding to a G cell Au(cit) (DTNB[(Cu(isatp)].
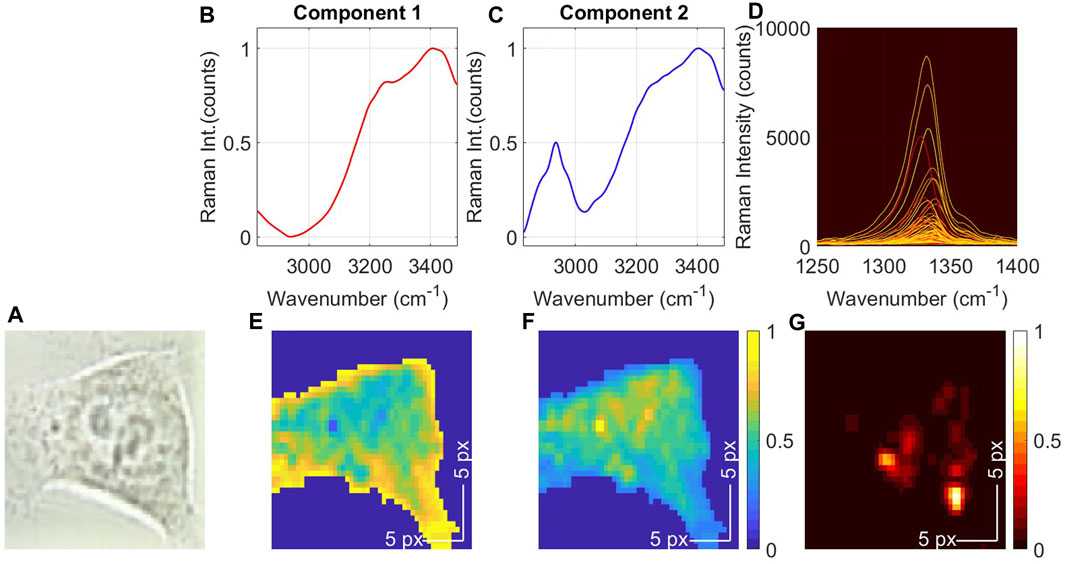
FIGURE 8. Cell G [cells with Au(cit) (DTNB) (Cu(nisatp)] NPs: Bright field image (A) and spectral profiles calculated with MCR-ALS for components 1 (B) and 2 (C) (λ=532 nm) and their respective Raman images (E,F). SERS spectra (D) for the νs (NO2) mode and its respective SERS image (G) at λ=785 nm. Image size: 25 × 20 px (25 × 20 µm).
More chemical images and MCR profiles obtained for other cells from groups A to G are included in the supplementary information, Supplementary Figures S7–S16.
Regarding the SERS spectra in the region between 1,200 and 1,400 cm−1 where the νs (NO2) mode is observed, interesting differences were found upon application of a curve resolution method MCR-ALS (run on the same number of spectra from groups treated with Au(cit) (DTNB), Au(cit) (DTNB) (Cu(isatp) and Au(cit) (DTNB) (Cu(nisatp) NPs. This was done in order to confirm that the SERS probe (Figure 9G) reached the inside of the cells. When the Au(cit) (DTNB) NPs is inside the intracellular environment, the NO2 band shows that it can be decomposed into two main features centered at 1,333 and 1,340 cm−1, as seen in Figure 9A. The same processing applied to groups F and G, showed that when the [Cu(nisatp)] complex (Figure 9H) is included, there is a 7 cm−1 shift for both components to lower frequency values (Figure 9C). No frequency shifts were observed for the [Cu(isatp] complex (Figure 9B), although factor 2 was predominant. These observations were corroborated by comparison to the behavior of the relative concentrations (Calculated by MCR-ALS) for each factor inside the cells (Figures 9D–F), where these values can be understood as the abundance of each factor in each spectrum. As shown, Factor 1 in the cells containing Au(cit) (DTNB) (Cu(isatp) NPs, one of the NO2 modes, seems not to be enhanced, while for Au(cit) (DTNB) and Au(DTNB) (Cu(nisatp) NPs the abundance of the two factors in each spectrum is comparable. This result reinforces that the complexes remained attached to the metal surface, so the SERS probe is stable inside the cells.
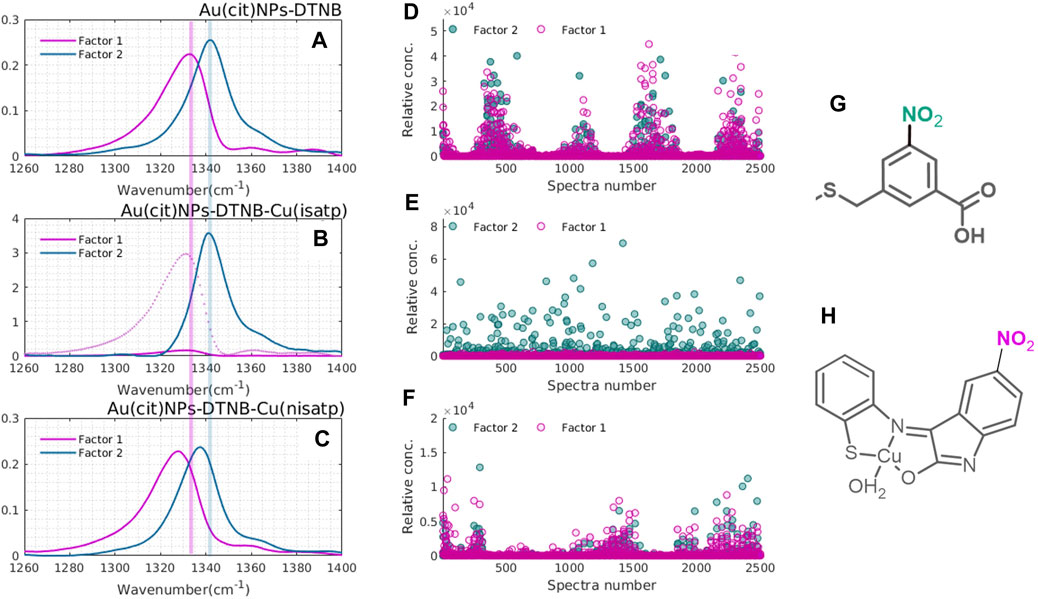
FIGURE 9. MCR-ALS factors and their corresponding relative concentrations (D–F) for each spectrum from the groups E, Au(cit)(DTNB)NPs (A), Au(cit) (DTNB)(Cu(isatp)) NPs (B), and Au(cit)(DTNB)Cu(nisatp)) NPs (C). Factor 1 in (B) was magnified for better visualization (dotted line). Structures of DTNB (G) and [Cu(nisatp)] complex (H).
Conclusion
In this study, a combined strategy using SERS and Raman simultaneously acquired images along with chemometrics tools was used to identify preferential targets of the oxindolimine copper(II) complexes [Cu(isatp)] and [Cu(nisatp)], assembled on the surface of Au(cit) NPs having DTNB as Raman reporter, on living HeLa cells. Under 532 nm radiation, the treatment of the HeLa cells with [Cu(isatp)] or [Cu(nisatp)] provided lipidic distribution images that were different from that obtained with reference cells, indicating that the metallodrugs significantly interact with lipids. It was shown that their characteristic distribution pattern disappeared after treatment with both metallodrugs. Further, one of the main observations of HeLa cells images treated with [Cu(nisatp)] is the spreading of proteins in the cytoplasm. By using the 785 nm exciting radiation, it was possible to track the nitro group mode of DTNB inside the cells, with a concomitant intensification of its surrounding chemical environment. Thus, through the building of the SERS images, it was recognized that the Au(cit) (DTNB) (metallodrugs) NPs architectures were mainly concentrated in the cytoplasm region. Further, nuclei debris was found in their vicinity. This fulfills the dual purpose of the gold nanoparticles, acting simultaneously as metallodrug carriers and as a signal intensifier surface. Besides, this occurred under experimental conditions that guaranteed the preservation of living cells.
Finally, it is remarkable that the membrane was not drastically damaged, as seen in the images showing the water distribution inside the cells, which matches with previous findings of our group (Mamián-López et al., 2021), and with Raman images from this work. Our results reinforced data in the literature (Lima et al., 2022) using Raman microscopy in diagnosis investigations of cancer cells and verification of possible modes of action of metallodrugs.
Data availability statement
The raw data supporting the conclusion of this article will be made available by the authors by email upon reasonable request.
Ethics statement
Ethical approval was not required for the studies on humans in accordance with the local legislation and institutional requirements because only commercially available established cell lines were used.
Author contributions
JM: Conceptualization, Data curation, Formal Analysis, Investigation, Methodology, Writing–original draft, Writing–review and editing. MM-L: Data curation, Formal Analysis, Writing–original draft, Writing–review and editing. DD: Investigation, Methodology, Writing–review and editing. MT: Conceptualization, Formal Analysis, Funding acquisition, Investigation, Project administration, Resources, Supervision, Writing–review and editing. AC: Conceptualization, Formal Analysis, Funding acquisition, Investigation, Project administration, Resources, Supervision, Writing–review and editing.
Acknowledgments
The authors are grateful to São Paulo State Research Foundation (FAPESP, Project CEPID-Redoxoma, grant 2013/07937-8 and 2016/21070-5) and Brazilian National Council for Scientific and Technological Development (CNPq, grants 304776/2014-9 and 405087/2021-7) for financial support. MM-L thanks FAPESP for her fellowship during her post-Doctorate research at USP (grant 2014/07841-3). JM is also thankful for the fellowship during his MSc studies (CNPq grant 130025/2017-8). DD is thankful to Conselho Nacional de Desenvolvimento Científico e Coordenação de Aperfeiçoamento de Pessoal de Nível Superior (CAPES, Finance code 001) for his PhD fellowship.
Conflict of interest
The University of São Paulo has a patent application BR 10 2013 026558 6, granted on 24th March 2020 (AUCANI—USP Innovation Agency), related to the antitumor activity of oxindolimine-metal complexes under study in our laboratory.
The author AC declared that she was an editorial board member of Frontiers, at the time of submission. This had no impact on the peer review process and the final decision.
Publisher’s note
All claims expressed in this article are solely those of the authors and do not necessarily represent those of their affiliated organizations, or those of the publisher, the editors and the reviewers. Any product that may be evaluated in this article, or claim that may be made by its manufacturer, is not guaranteed or endorsed by the publisher.
Supplementary material
The Supplementary Material for this article can be found online at: https://www.frontiersin.org/articles/10.3389/fchbi.2023.1254702/full#supplementary-material
References
Anthony, E. J., Bolitho, E. M., Bridgewater, H. E., Carter, O. W. L., Donnelly, J. M., Imberti, C., et al. (2020). Metallodrugs are unique: opportunities and challenges of discovery and development. Chem. Sci. 11, 12888–12917. doi:10.1039/D0SC04082G
Aung, T., Qu, Z., Kortschak, R., and Adelson, D. (2017). Understanding the effectiveness of natural compound mixtures in cancer through their molecular mode of action. Int. J. Mol. Sci. 18, 656. doi:10.3390/ijms18030656
Bolitho, E. M., Coverdale, J. P. C., Bridgewater, H. E., Clarkson, G. J., Quinn, P. D., Sanchez-Cano, C., et al. (2021). Tracking reactions of asymmetric organo-osmium transfer hydrogenation catalysts in cancer cells. Angew. Chem. Int. Ed. 60, 6462–6472. doi:10.1002/anie.202016456
Castelli, S., Gonçalves, M. B., Katkar, P., Stuchi, G. C., Couto, R. A. A., Petrilli, H. M., et al. (2018). Comparative studies of oxindolimine-metal complexes as inhibitors of human DNA topoisomerase IB. J. Inorg. Biochem. 186, 85–94. doi:10.1016/j.jinorgbio.2018.05.012
Cerchiaro, G., Aquilano, K., Filomeni, G., Rotilio, G., Ciriolo, M. R., and Ferreira, A. M. D. C. (2005). Isatin-Schiff base copper(II) complexes and their influence on cellular viability. J. Inorg. Biochem. 99, 1433–1440. doi:10.1016/j.jinorgbio.2005.03.013
Conesa, J. J., Carrasco, A. C., Rodríguez-Fanjul, V., Yang, Y., Carrascosa, J. L., Cloetens, P., et al. (2020). Unambiguous intracellular localization and quantification of a potent iridium anticancer compound by correlative 3D cryo X-ray imaging. Angew. Chem. Int. Ed. 59, 1270–1278. doi:10.1002/anie.201911510
Cutshaw, G., Uthaman, S., Hassan, N., Kothadiya, S., Wen, X., and Bardhan, R. (2023). The emerging role of Raman spectroscopy as an omics approach for metabolic profiling and biomarker detection toward precision medicine. Chem. Rev. 123, 8297–8346. doi:10.1021/acs.chemrev.2c00897
da Costa Ferreira, A. M., Cerchiaro, G., Ciriolo, M. R., and Abbott, M. P. S. V. C. (2020). Patent BR 2006 00985-A, granted in March 24th,2020. Set of pharmacological metallic complexes containing e.g. indole compounds comprises anti-tumor medicines incorporating indole and oxindole compounds and their iminic derivatives.
de Juan, A., and Tauler, R. (2021). Multivariate Curve Resolution: 50 years addressing the mixture analysis problem – a review. Anal. Chim. Acta 1145, 59–78. doi:10.1016/j.aca.2020.10.051
Dilruba, S., and Kalayda, G. V. (2016). Platinum-based drugs: past, present and future. Cancer Chemother. Pharmacol. 77, 1103–1124. doi:10.1007/s00280-016-2976-z
Drescher, D., Büchner, T., Schrade, P., Traub, H., Werner, S., Guttmann, P., et al. (2021). Influence of nuclear localization sequences on the intracellular fate of gold nanoparticles. ACS Nano 15, 14838–14849. doi:10.1021/acsnano.1c04925
Ferraz de Paiva, R. E., Vieira, E. G., Rodrigues da Silva, D., Wegermann, C. A., and Costa Ferreira, A. M. (2020). Anticancer compounds based on isatin-derivatives: strategies to ameliorate selectivity and efficiency. Front. Mol. Biosci. 7, 627272. doi:10.3389/fmolb.2020.627272
Haiss, W., Thanh, N. T. K., Aveyard, J., and Fernig, D. G. (2007). Determination of size and concentration of gold nanoparticles from UV−Vis spectra. Anal. Chem. 79, 4215–4221. doi:10.1021/ac0702084
Hislop, E. W., Tipping, W. J., Faulds, K., and Graham, D. (2022). Label-free imaging of lipid droplets in prostate cells using stimulated Raman scattering microscopy and multivariate analysis. Anal. Chem. 94, 8899–8908. doi:10.1021/acs.analchem.2c00236
Jaumot, J., de Juan, A., and Tauler, R. (2015). MCR-ALS GUI 2.0: new features and applications. Chemom. Intelligent Laboratory Syst. 140, 1–12. doi:10.1016/j.chemolab.2014.10.003
Kim, E., Rebecca, V., Fedorenko, I. V., Messina, J. L., Mathew, R., Maria-Engler, S. S., et al. (2013). Senescent fibroblasts in melanoma initiation and progression: an integrated theoretical, experimental, and clinical approach. Cancer Res. 73, 6874–6885. doi:10.1158/0008-5472.CAN-13-1720
Le Ru, E. C., and Etchegoin, P. (2009). Principles of Surface-Enhances Raman Spectroscopy and related plasmonic effects. 1st. Amsterdam: Elsevier.
Lee, P. C., and Meisel, D. (1982). Adsorption and surface-enhanced Raman of dyes on silver and gold sols. J. Phys. Chem. 86, 3391–3395. doi:10.1021/j100214a025
Li, H., Ning, T., Yu, F., Chen, Y., Zhang, B., and Wang, S. (2021). Raman microspectroscopic investigation and classification of breast cancer pathological characteristics. Molecules 26, 921. doi:10.3390/molecules26040921
Li, X., Sha, J., Chu, B., Wei, Y., Huang, W., Zhou, H., et al. (2019). Quantitative visualization of intracellular lipids concentration in a microalgae cell based on Raman micro-spectroscopy coupled with chemometrics. Sensors Actuators B Chem. 292, 7–15. doi:10.1016/j.snb.2019.04.048
Lima, C., Ahmed, S., Xu, Y., Muhamadali, H., Parry, C., McGalliard, R. J., et al. (2022). Simultaneous Raman and infrared spectroscopy: a novel combination for studying bacterial infections at the single cell level. Chem. Sci. 13, 8171–8179. doi:10.1039/D2SC02493D
Mamián-López, M. B., Bernardi Miguel, R., Araki, K., A Temperini, M. L., and da Costa Ferreira, A. M. (2021). Multivariate probing of antitumor metal-based complexes damage on living cells through Raman imaging. Spectrochimica Acta Part A Mol. Biomol. Spectrosc. 244, 118838. doi:10.1016/j.saa.2020.118838
Miguel, R. B., Petersen, P. A. D., Gonzales-Zubiate, F. A., Oliveira, C. C., Kumar, N., do Nascimento, R. R., et al. (2015). Inhibition of cyclin-dependent kinase CDK1 by oxindolimine ligands and corresponding copper and zinc complexes. JBIC J. Biol. Inorg. Chem. 20, 1205–1217. doi:10.1007/s00775-015-1300-4
Mjos, K. D., and Orvig, C. (2014). Metallodrugs in medicinal inorganic chemistry. Chem. Rev. 114, 4540–4563. doi:10.1021/cr400460s
Navas-Moreno, M., Mehrpouyan, M., Chernenko, T., Candas, D., Fan, M., Li, J. J., et al. (2017). Nanoparticles for live cell microscopy: a surface-enhanced Raman scattering perspective. Sci. Rep. 7, 4471. doi:10.1038/s41598-017-04066-0
Pan, Z., Tan, C., Rao, L., Zhang, H., Zheng, Y., Hao, L., et al. (2020). Recoding the cancer epigenome by intervening in metabolism and iron homeostasis with mitochondria-targeted rhenium(I) complexes. Angew. Chem. Int. Ed. 59, 18755–18762. doi:10.1002/anie.202008624
Peña, B., Barhoumi, R., Burghardt, R. C., Turro, C., and Dunbar, K. R. (2014). Confocal fluorescence microscopy studies of a fluorophore-labeled dirhodium compound: visualizing metal–metal bonded molecules in lung cancer (A549) cells. J. Am. Chem. Soc. 136, 7861–7864. doi:10.1021/ja503774m
Spedalieri, C., and Kneipp, J. (2022). Surface enhanced Raman scattering for probing cellular biochemistry. Nanoscale 14, 5314–5328. doi:10.1039/D2NR00449F
Sun, D., and Chen, X. (2020). Raman imaging shines a light on neurodegenerative disorders. ACS Cent. Sci. 6, 459–460. doi:10.1021/acscentsci.0c00267
Talari, A. C. S., Movasaghi, Z., Rehman, S., and Rehman, I. (2015). Raman spectroscopy of biological tissues. Appl. Spectrosc. Rev. 50, 46–111. doi:10.1080/05704928.2014.923902
Theiner, S., Schoeberl, A., Schweikert, A., Keppler, B. K., and Koellensperger, G. (2021). Mass spectrometry techniques for imaging and detection of metallodrugs. Curr. Opin. Chem. Biol. 61, 123–134. doi:10.1016/j.cbpa.2020.12.005
Wang, X., Wang, X., Jin, S., Muhammad, N., and Guo, Z. (2019). Stimuli-responsive therapeutic metallodrugs. Chem. Rev. 119, 1138–1192. doi:10.1021/acs.chemrev.8b00209
Wang, Y., Wee, E. J. H., and Trau, M. (2015). Highly sensitive DNA methylation analysis at CpG resolution by surface-enhanced Raman scattering via ligase chain reaction. Chem. Commun. 51, 10953–10956. doi:10.1039/C5CC03921E
Xiong, X., Liu, L.-Y., Mao, Z.-W., and Zou, T. (2022). Approaches towards understanding the mechanism-of-action of metallodrugs. Coord. Chem. Rev. 453, 214311. doi:10.1016/j.ccr.2021.214311
Yousuf, I., Bashir, M., Arjmand, F., and Tabassum, S. (2021). Advancement of metal compounds as therapeutic and diagnostic metallodrugs: current frontiers and future perspectives. Coord. Chem. Rev. 445, 214104. doi:10.1016/j.ccr.2021.214104
Zheng, Y., Chen, X.-X., Zhang, D.-Y., Wang, W.-J., Peng, K., Li, Z.-Y., et al. (2023). Activation of the cGAS-STING pathway by a mitochondrial DNA-targeted emissive rhodium(iii) metallointercalator. Chem. Sci. 14, 6890–6903. doi:10.1039/D3SC01737K
Keywords: SERS imaging, gold nanoparticles, SERS probe, anticancer copper complexes, main intracellular targets
Citation: Marin JH, Mamián-López MB, Da Silva DR, Temperini MLA and da Costa Ferreira AM (2023) Dual-purpose nanoparticle assembly for identifying preferential intracellular targets of oxindolimine copper(II) complexes through SERS imaging. Front. Chem. Biol 2:1254702. doi: 10.3389/fchbi.2023.1254702
Received: 07 July 2023; Accepted: 12 October 2023;
Published: 10 November 2023.
Edited by:
Srinivas Sistla, Stony Brook University, United StatesReviewed by:
Dong-Yang Zhang, Guangzhou Medical University, ChinaGeorge Barisas, Colorado State University, United States
Copyright © 2023 Marin, Mamián-López, Da Silva, Temperini and da Costa Ferreira. This is an open-access article distributed under the terms of the Creative Commons Attribution License (CC BY). The use, distribution or reproduction in other forums is permitted, provided the original author(s) and the copyright owner(s) are credited and that the original publication in this journal is cited, in accordance with accepted academic practice. No use, distribution or reproduction is permitted which does not comply with these terms.
*Correspondence: Mónica B. Mamián-López, bW9uaWNhLmxvcGV6QHVmYWJjLmVkdS5icg==