 Marv Khala
 Colin Hare
 Vikram Karde2
- 1School of Engineering, Newcastle University, Newcastle upon Tyne, United Kingdom
- 2Department of Chemical Engineering, Imperial College London, London, United Kingdom
- 3Institute for Molecular Science and Engineering, Imperial College London, London, United Kingdom
A numerical study is carried out to investigate the combined influence of material properties and process parameters on coating quality in a high shear mixer (specifically an FT4 Powder Rheometer) to construct a regime map. The Discrete Element Method (DEM) is employed to simulate a range of material properties (size, density, and surface energy) and process parameters (impeller speed and mixing time) via Design of Experiments (DoE). A robust regime map is proposed for prediction of dry coating performance based on dimensionless Stokes deformation number (Stdef) and granular Bond number (Bo). The regime map provides insight on the optimal range of material properties and process parameters to achieve high coating levels in a high-shear bladed mixer. Furthermore, the minimum energy required to achieve optimal coating performance as well as regions of poor coating quality due to guest detachment exacerbated by excessive energy input can be identified from the regime map, thus reducing wastage of energy and coating material required. The regime map enables the required mixing time for optimal coating to be determined so long as particle size distributions and surface energies are known.
1 Introduction
Dry powder coating is a widely used process for altering surface properties of substrates, with a variety of applications such as improvement of bulk powder flow and modifying drug-release kinetics (Stephenson and Thiel, 1980; Honda et al., 1994; Watano et al., 2000; Otles et al., 2011). One of the key advantages of dry powder coating is the absence of volatile organic compounds and lower manufacturing costs since solvent evaporation is not required in contrast to conventional liquid-based coatings. Dry powder coating process involves adherence of fine guest particles onto carrier host particles via mechanical means. Several dry powder coating techniques have been used for the deposition of guest particles onto the surface of host particle in various applications in the coatings industry, which include electrostatic coating (Yang et al., 2015; Prasad et al., 2016; Jaber et al., 2021; Jing et al., 2022), mechanofusion (Zhou et al., 2010; 2011; Qu et al., 2015), hybridizers (Yang et al., 2005), rotating tumblers (Gärtner et al., 2021), resonance acoustic mixing (Kunnath et al., 2021), magnetic-assisted impact coating (Pfeffer et al., 2001; Yang et al., 2005; Chen et al., 2010), milling (Zhang et al., 2009; Mullarney et al., 2011; Karde et al., 2015; Wei et al., 2017; Capece et al., 2021) and fluidised beds (Smikalla et al., 2011). Despite its obvious advantages, the dry coating process typically uses an excess of coating material accompanied by high energy consumption to achieve highly uniform and consistent coatings. Several studies have been carried out to provide fundamental understanding of the factors governing dry powder coating performance (Alonso et al., 1989; Dave et al., 2003; Nguyen et al., 2014; 2016; Deng et al., 2018; Tamadondar et al., 2018). The effect of particle interfacial energies and mixing energy input on dry powder coating efficiency has been investigated by Tamadondar et al. (2018) via Discrete Element Method (DEM) simulations of a Couette cell. The same authors also proposed a regime map, in which the coating quality is governed by Stokes deformation number, Stdef (defined as ratio of mixing energy to work of adhesion) and a reduced intermittent coefficient, Λ (defined as ratio of cohesion to adhesion strength). Optimal process conditions for good coating quality were found to exist between regions of low Stdef & low Λ (characterised by poor mixing), low Stdef & high Λ (characterised by excessive agglomerate formation), and high Stdef values (characterised by rapid breakage of guest-host contacts). However, only the particle surface energy was varied in this study. Moreover, Stdef is calculated from work of adhesion according to the JKR theory as given by Eq. 1 (Thornton and Ning, 1998), which requires number of particle contacts obtained from DEM simulations. Khala et al. (2021) proposed a Stdef expressed as the ratio of mixing energy to cohesion energy to describe the mixing rate of multi-component mixtures, in which the cohesion energy can be computed from the fractional number of contacts of different particle species or from the fractional surface area of the mixture constituents. Computing the cohesion energy based on fractional surface area approach gives an approximate solution using only experimental data. Population Balance Modelling (PBM) has also been used to correlate particle size ratio and guest concentration to the particle coating quality (Alonso et al., 1989), however the kinetic mechanisms involved are not well established. Our previous work (Khala et al., 2023) investigated the interplay between material properties (size, density and surface energy) and the dry coating performance in a bladed mixer via DEM. We demonstrated that granular Bond number (between host and guest particles) dictates the affinity of guest particles to host particles, with granular Bond numbers >220 providing good coating performance. However, very high granular Bond numbers reduced the coating performance due to very high agglomerate bond energy. In this work, we further explore the influence of material properties along with process parameters (impeller speed, mixing time) with the aim of developing a regime map for the dry powder coating process. The developed regime map could be utilised as a prediction tool for the minimum energy required to achieve desired coating uniformity. Furthermore, the influence of other process parameters such as blade geometry and dynamics, fill ratio, guest concentration and initial location of guest particles, on coating efficiency are examined.
where
2 Methodology
The dry powder coating process in the FT4 powder rheometer (FT4) was simulated using the Hertz-Mindlin with JKR model (see Khala et al., 2023) for contact model equations) in the EDEM®2022.0 software (Altair Engineering Inc.) using an NVIDIA Quadro GV100 GPU. The FT4 consists of a cylindrical vessel in which an impeller with a twisted blade profile is rotated, typically as it descends/ascends through the bed. In this case the 25 mm diameter vessel and 23.5 mm wide impeller are simulated. A pre-segregated guest-host mixture with a specified particle size ratio (host radius (rh)/guest radius (rg)) and bed height was created as illustrated in Figure 1. The host particles are generated and settle under gravity prior to guest particle generation and settling, forming a thin layer above the host particles. Rotation with/without vertical movement was then applied to the impeller for a range of speeds and number of blade revolutions. These are the setup conditions upon which the regime map is based, with rotational speed and time being the process parameters captured in the regime map. However, other process parameters can influence the coating process. To demonstrate this we carried out further simulations varying the guest mass fraction, the initial location of guest particles, the bed height and the impeller design and dynamics, as described in Sections 3.2–3.5, respectively.
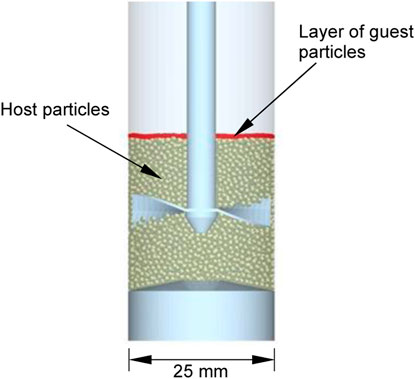
FIGURE 1. Model geometry and configuration of the bed.
The material and interaction properties used in the simulations reported in Section 3 are given in Table 1. In Section 4 the values of particle size, density and surface energy are varied as indicated in that section. The particle sizes are chosen to ensure a sufficient size ratio between guest and host particles, whilst preventing such small guests that the simulations become prohibitively computationally expensive. The particle properties are equivalent to those of glass beads, with surface energy approximating that of α-lactose monohydrate (Karde et al., 2015), whilst the geometry properties are for stainless steel. The effects of blade rotational speed, guest concentration, guest initial location, fill level, impeller design and dynamics on the surface area coverage (SAC) were evaluated. The SAC is calculated as the ratio of the total projected area of guest particles to the maximum available host surface area,
where Nh is the total number of host particles, ng is the number of guest particles per host particle, Ap,g is the projected area of the guest particles, Sh is the surface area of the host particle, the factor ξ (=0.906) represents the densest hexagonal packing possible for spherical guest particles on the host surface. A guest particle is considered to be coating a host if it is in contact with it. The SAC is normalised by the theoretical maximum achievable SAC in an ideal system with uniformly distributed coatings i.e., an even distribution of (an incomplete) monolayer of guest particles on each host particle, given by Eq. 3.
where,
where
where fc is the cohesive force between two particles from JKR contact theory, given by Eq. 6 and fw is the harmonic mean of the gravitational forces given by Eq. 7.
where w represents the particle weight and subscripts i and j represent different species. This granular Bond number described by Eqs 5–7 only considers the interactions between host and guest. For binary mixtures there also exist guest-guest and host-host interactions, to account for these the arithmetic (AM), geometric (GM) and harmonic (HM) mean of the granular Bond number can be evaluated by Eqs 8–10, respectively.
where fsa,i is the fractional surface area of each species and Boij is the Bond number between particle species i and j. The incremental mechanical or mixing energy due to the blade rotation is given by the particle kinetic energies, expressed as,
where T is the blade torque and θ is the angular blade displacement. The cohesive energy, Ecoh, can be computed from the interfacial energy and fractional surface area of each particle species (Khala et al., 2021):
where rij is the equivalent particle radius given by,
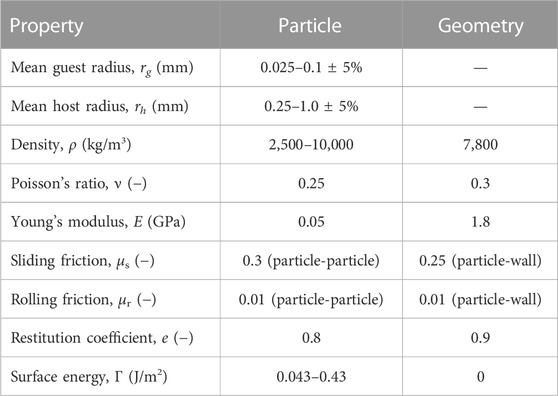
TABLE 1. Material and interaction properties used in the simulations.
The Stokes deformation number, Stdef, is defined as the ratio of the mixing energy (Eq. 11) and the cohesive energy (Eq. 12).
3 Effect of process parameters
In this section, the simulations were performed using a size ratio of 10 (where rh = 1.0 mm and rg = 0.1 mm), density ratio of 1 (where ρh = ρg = 2,500 kg/m3) and interfacial energy of 0.043 J/m2. These conditions are chosen because dry powder coating processes typically use a size ratio of at least 5–10 (though often much higher by use of nanoparticle guests), with guest particles being of similar or greater density to the hosts (Yang et al., 2005). The surface energy is chosen to match that of α-lactose monohydrate, as stated previously.
3.1 Blade rotational speed
The effect of the blade rotational speed on the evolution of average SACnorm, bed height of 13 mm and guest concentration of 2 %w/w is shown in Figure 2. The average SACnorm increases with mixing time and number of blade revolutions, with higher blade rotational speeds providing lower average SACnorm after 5 blade revolutions, with a slower increase in SAC relative to blade revolutions. However, higher rotational speeds exhibit a more rapid increase in SACnorm per unit time due to higher frequency of guest-host collisions. Furthermore, the higher rotational speeds provide more evenly distributed coatings as shown by the narrower probability density function of the SACnorm per host particle in Figure 3, with a rotational speed of 244 rpm showing a significant improvement over the other speeds, albeit with slightly more uncoated particles. SACnorm > 1 represents host particles coated by a relatively higher number of guest particles compared to an ideal system when guest particles are distributed evenly across all host particle surfaces (see Eq. 4). Figure 4 shows the distribution of guest particles throughout the bed after 5 blade revolutions for different blade rotational speeds. At the three lowest blade rotational speeds there is a dense region of guests accumulated above the blade. At the highest speed (244 rpm) there is a smaller dense region of guests accumulating at the bottom, but overall the guests are more evenly distributed through the bed. The enhanced dispersion of guest particles at higher blade rotational speeds (see Figure 4) is facilitated by higher shear stresses in front of the blade (see Figure 5) to overcome interparticle forces represented by surface energy, and subsequently break the agglomerated guest particles. The average shear stress shown in Figure 5 is calculated using the stress analysis approach by Khala et al. (2022), in which the measurement volume is aligned with the horizontal axis of the blade and extends 45° away from the blade (see Figure 6). Repeated high impact collisional forces promote the adhesion of the guest particles onto the surface of host particles until the coating homogeneity is achieved by forming a discrete, continuous or film surface layer on the host particles. For cases with low impeller rotational speeds and highly cohesive particles (high surface energy), the low shear stresses may not provide sufficiently intensive energy to break the agglomerates. This is evidenced in Figure 7, where the number of guest-guest and guest-host contacts against number of blade revolutions are shown for two cases: a simulation with low impeller rotational speed and high surface energy (290 rpm,
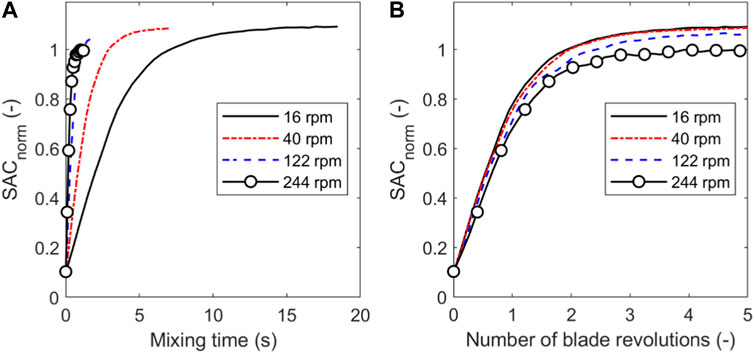
FIGURE 2. Evolution of SAC with (A) mixing time and (B) number of blade revolutions for a range of blade rotational speeds. Bed height = 13.0 mm and guest concentration = 2 %w/w.
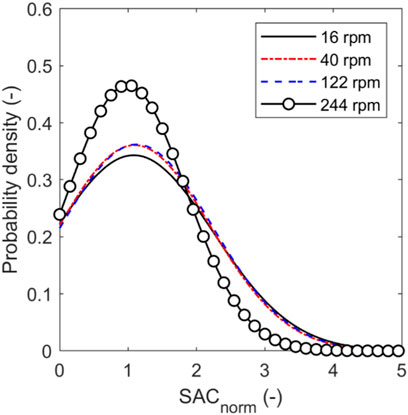
FIGURE 3. Probability density function of SACnorm per host particle after 5 blade revolutions. Bed height = 13.0 mm and guest concentration = 2 %w/w.
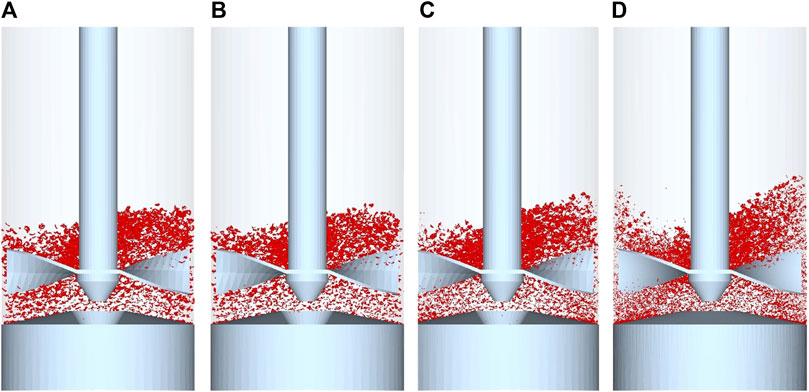
FIGURE 4. Cross-sectional view of distribution of guest particles for blade rotational speeds of (A) 16 rpm (B) 40 rpm (C) 122 rpm (D) 244 rpm after 5 blade revolutions. (A, B) Bed height of 13.0 mm and guest concentration of 2 %w/w.
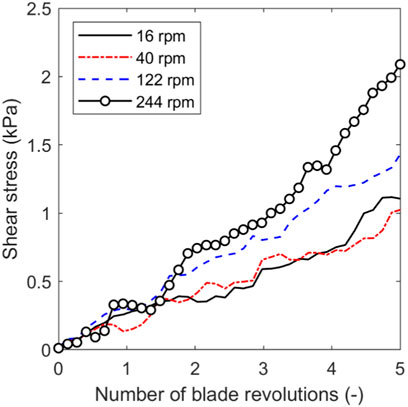
FIGURE 5. Effect of blade rotational speed on local shear stress. Bed height = 13.0 mm and guest concentration = 2 %w/w.
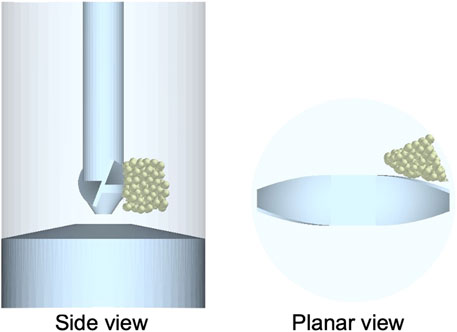
FIGURE 6. Measurement volume used for stress analysis.
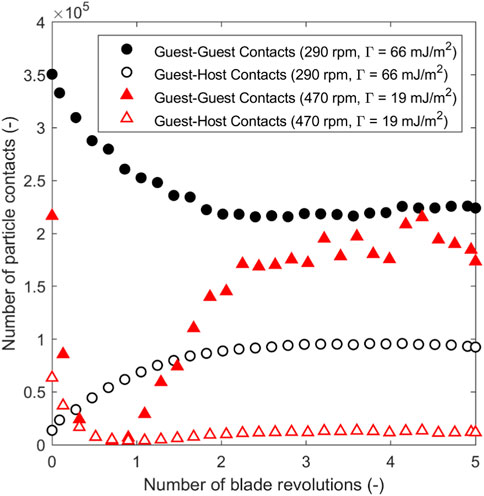
FIGURE 7. Guest-guest and guest-host contact variation throughout simulations for two cases: a low impeller rotational speed and high surface energy (290 rpm,
3.2 Guest mass fraction
Figure 8 shows the effect of guest particle fraction, expressed as %w/w, on the evolution of the SAC for a blade rotational speed of 244 rpm. An increase in guest concentration leads to an increase in SAC, as would be expected, due to a greater number of guest particles being present to coat the host surfaces. However, the non-dimensional SAC (normalised by the maximum theoretical SAC for each guest-host mixture) decreases with increasing guest concentration. This indicates a reduced utilisation of the guest material when the fraction of guests is increased. The initial non-zero SAC is due to initial percolation of guest particles during the vessel filling process, with the phenomenon being more pronounced at lower guest concentration as a greater proportion of the guest particles exist as discrete entities. For the highest guest concentration of 4 %w/w, a greater fraction of guest particles initially exists as agglomerates rather than single entities, and therefore, require excess energy input to achieve comparable uniform dispersion to lower guest concentration, hence reduced SACnorm. Furthermore, a thicker dense layer is formed for higher guest fractions, therefore, the guest particles at the top of the dense layer have lower likelihood of percolation.
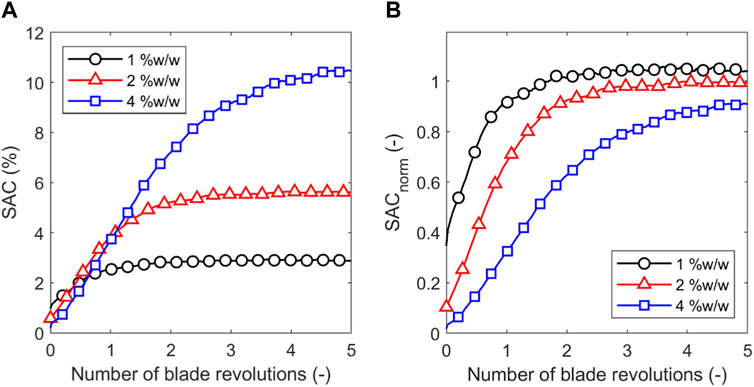
FIGURE 8. Effect of guest concentration on (A) average SAC and (B) SACnorm for a bed height of 13.0 mm and blade rotational speed of 244 rpm.
It would be expected that at any given guest mass fraction, a lower blade rotational speed would result in a slower coating rate against time, as is shown for 2 wt% guest mass fraction in Figure 2. At a lower blade rotational speed the trends shown in Figure 8 for 244 rpm would be expected to still apply, i.e., increased guest mass fraction results in increased surface area coverage, but a lower non-dimensional surface area coverage as the guest material is less well utilised. Since the shear stress is lower at lower blade rotational speeds (see Figure 5), it’s likely that at any guest mass fraction the guests would be less homogeneously distributed than at higher blade rotational speeds.
3.3 Initial location of guest particles
Figures 2, 8 demonstrate that when the guests are initially loaded into the vessel on top of the hosts the SAC typically increases with blade revolutions, initially following an almost constant rate of SAC increase until an asymptote is approached. One possibility to increase the rate of increase in SAC is changing the initial location of the guests to enable faster dispersion. To assess this, we considered two additional loading positions: in line with the blade horizontal plane and directly above the blades, for a bed height of 26.0 mm, as demonstrated in Figure 9. Figure 10 shows that SACnorm is initially much higher for the cases with the guests initially positioned closer to the blade, with guests above the blade showing the highest initial SAC. This is due to a greater number of guest-host contacts prior to blade rotation, since there are host particles directly above the layer of guest particles. When the guests are initially located in line with or above the blade the increase in SAC with blade revolutions is initially high, but quickly reaches the asymptote. Interestingly, for both cases of the guests being located lower in the bed, the rate of increase in SAC with blade revolutions is almost identical, with the final SACnorm after 5 revolutions being greater when the guests are initially located above the blade. In contrast, when guests are initially located on the bed surface the rate of increase in SAC with blade revolutions is slower. Note that the slower increase in SAC for guests initially on the bed surface in Figure 10 compared to Figure 2 (at 244 rpm) and Figure 8 (with 2 %w/w) is due to the greater initial bed height (26.0 mm instead of 13.0 mm).
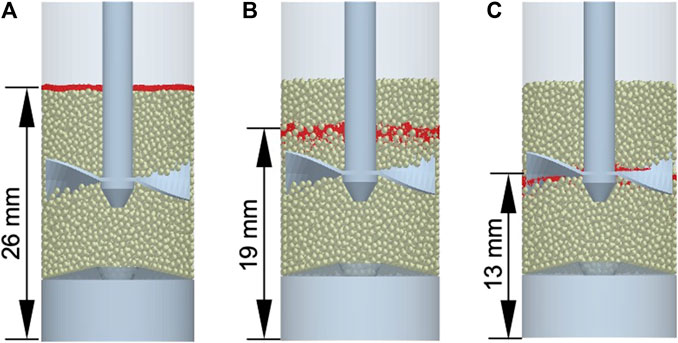
FIGURE 9. Initial locations of guest particles simulated (A) bed free surface, (B) above blade and (C) blade horizontal plane. Bed height = 26.0 mm and guest concentration = 2 %w/w.
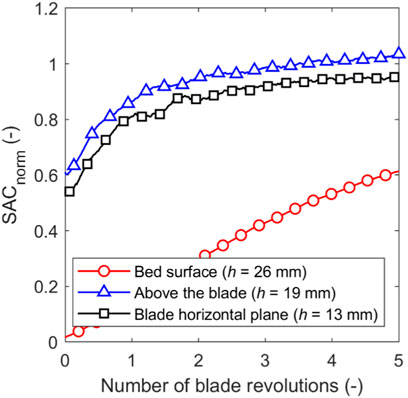
FIGURE 10. Effect of initial location of guest particles on SACnorm with a bed height of 26.0 mm, guest concentration of 2 %w/w and blade rotational speed of 244 rpm.
Positioning the guest particles nearer to the blades (slightly above the blades or the same horizontal position as the blades) during vessel filling leads to instantaneous rupture of agglomerates upon blade rotation as the bed dilates, thereby providing more uniformly dispersed guest particles, as shown in Figure 11. However, for guest agglomerates that are initially on the same horizontal plane as the blades, instantaneous breakage of the agglomerates still occurs but axial sifting (or percolation) due to local bed dilation leads to greater accumulation of guest particles in the dead zone beneath the blades as shown in Figure 12C. When the guest particles are initially located slightly above the blades there is still some accumulation of guest particles below the blades (as shown in Figure 12B), though to a lesser extent than when they are initially on the same horizontal plane as the blades. For the guest particles that are initially positioned on the top free surface of the bed, poor dispersion of guest particles occurs. This is largely due to the central vortex formation during mixing, which draws the surface guest particles towards the centre of the bed (see Figure 12A) thus negating the radial dispersion of guest particles across the bed towards the periphery.
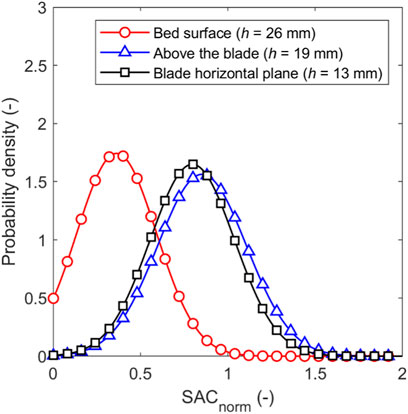
FIGURE 11. Distribution of SACnorm for different initial position of the guest particles after 5 blade revolutions with a bed height of 26.0 mm, guest concentration of 2 %w/w and blade rotational speed of 244 rpm.
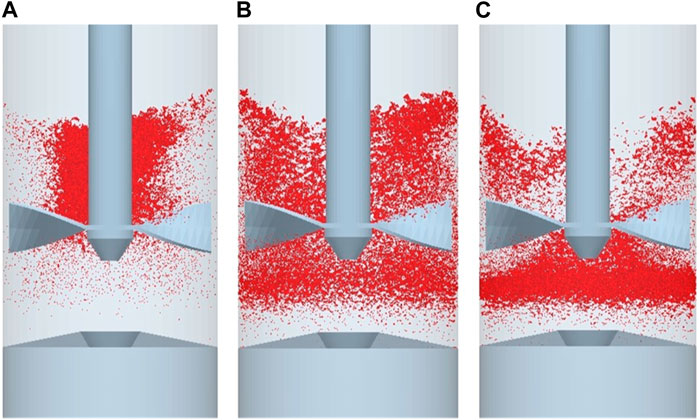
FIGURE 12. Cross-sectional view of the distribution of guest particles after 5 blade revolutions for guest particles initially located (A) on bed surface (h = 26.0 mm), (B) slightly above the blades but below bed surface (h = 19.0 mm), and (C) on same horizontal plane as the mid-surface of the blades (h = 13.0 mm).
3.4 Bed height
The effect of bed height was assessed using bed heights of 13.0, 15.6, 20.8 and 26.0 mm, which are equivalent to 25%, 30%, 40% and 50% of the maximum bed height (52 mm) for the standard 25 mm diameter vessel of the FT4 powder rheometer. In all cases the guest loading was 2 %w/w. The influence of bed height on the coating performance is shown in Figure 13. Increasing the bed height decreases the SACnorm, which is largely attributed to reduced global mobilisation of particles by the impeller. For bed heights of 13.0 and 15.6 mm, a greater fraction of the bed is mobilised by the impeller, with a narrow almost stagnant zone present beneath the impeller shaft as shown by the velocity profiles in Figure 14. For these shallow depths of the granular bed, the swept volume is approximately equivalent to the bed volume. Contrastingly, for bed heights of 20.8 and 26.0 mm, the mobilised fraction of the bed is lower than at bed heights of 13.0 and 15.6 mm. The greater hydrostatic pressure for bed heights of 20.8 and 26 mm contributes to reduced movement of particles with dead zones appearing beneath the impeller shaft and above the blades. Comparing bed heights of 20.8 and 26.0 mm, the movement of particles in the outer radial positions above the blade is suppressed by the greater hydrostatic pressure for the 26.0 mm bed height.
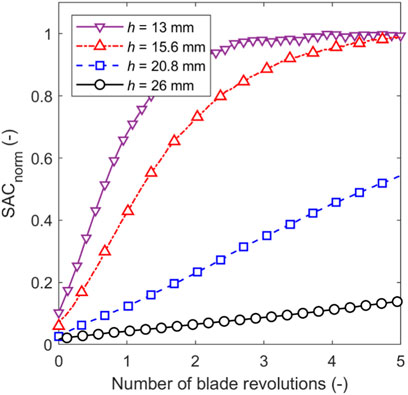
FIGURE 13. Effect of bed height on SACnorm for a guest concentration of 2 %w/w.
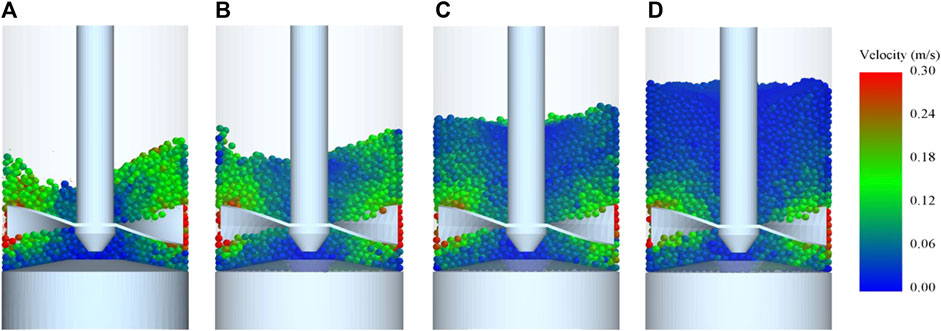
FIGURE 14. Particle velocity profiles for bed heights of (A) 13 mm (B) 15.6 mm (C) 20.8 mm (D) 26 mm.
3.5 Impeller design and dynamics
The preceding results are for systems using the standard FT4 impeller in a fixed vertical position 6.5 mm above the base. The variation of extent of coating with time will also be influenced by the impeller design and dynamics. This has implications for the regime map developed in Section 4, which is valid for the specific conditions investigated. To explore the influence of impeller design and dynamics on the coating rate we compared the above case (fixed vertical position 6.5 mm above the base) with five additional cases: centrally aligning the impeller within the bed, traversing the impeller down through the bed, traversing the impeller down and up through the bed (following an approach similar to the standard FT4 protocol), adding an additional impeller in an orthogonal arrangement and adding an additional impeller blade in a parallel arrangement. These cases are shown in Figure 15. For the down and down/up traverses the impeller follows the protocols outlined in Table 2. For the double impeller, the second impeller is positioned 13.0 mm above the first, 6.5 mm from the initial bed surface. In all cases the bed height was 26.0 mm and the guests were initially loaded on the bed surface with a fraction of 2 %w/w.
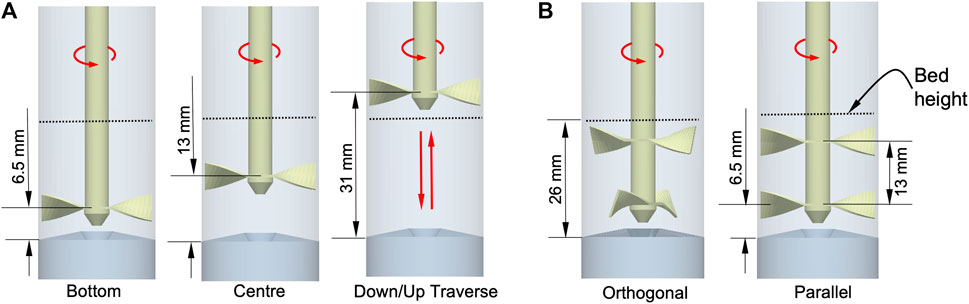
FIGURE 15. Impeller design models and dynamics investigated (A) single impeller designs (B) double impeller designs.
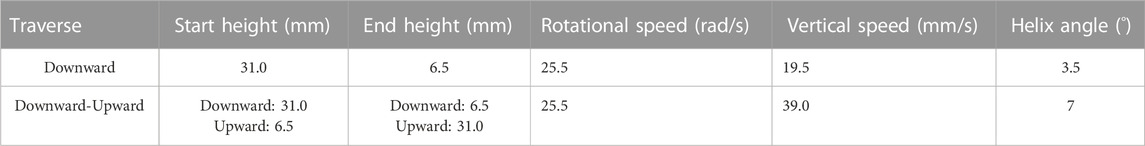
TABLE 2. Rotational and vertical speed of the single impeller for the downward and/or upward traverse.
3.5.1 Blade positioning
Figure 16 shows the influence of blade position and dynamics on SACnorm for the single impeller for a bed height of 26.0 mm, guest concentration of 2 %w/w and blade rotational speed of 244 rpm. Positioning the single impeller at the centre of the bed leads to a 240% increase in SACnorm after 5 revolutions compared to positioning the impeller at the bottom of the bed. A combination of the vertical and rotational blade movement with only the downward blade traverse leads to a 67% and 470% increase in SACnorm after 5 revolutions compared to the centre-positioned and bottom-positioned impeller configurations which has only the rotational movement, respectively. The combined downward-upward traverse exhibits a very slight improvement in SACnorm after 5 revolutions when compared to the downward blade traverse. The downward-upward blade traverse exhibits a rapid rise in SACnorm until the impeller reaches the bottom of the bed (at 2.5 revolutions), after which the SACnorm remains almost constant until rising in the final 0.5 revolutions. This suggests the blade carries host particles upward to reach guest particles that remained close to the bed surface. The downward blade traverse shows a monotonic increase in SACnorm, with the downward-upward blade traverse configuration exhibiting greater SACnorm than the downward traverse up to 3 blade revolutions, beyond which the downward traverse performs better until the very end of the fifth revolution. The breakage of agglomerates and subsequent dispersion of guest particles onto the surfaces of host particles is greatly reduced and prolonged when the blades are positioned at the bottom of the bed, whereas, positioning the blades at the centre of the bed enables faster dispersion of guest particles since a greater volume of particles above the blades are mobilised as shown in Figure 17.
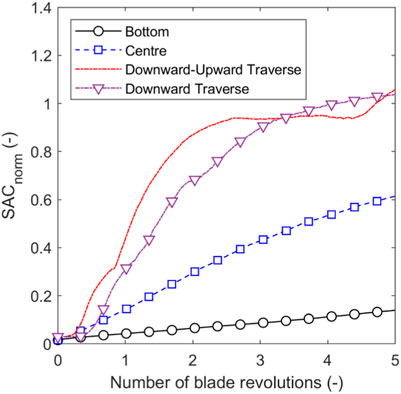
FIGURE 16. Effect of blade positioning on SACnorm for a bed height of 26.0 mm, guest concentration of 2 %w/w and blade rotational speed of 244 rpm.
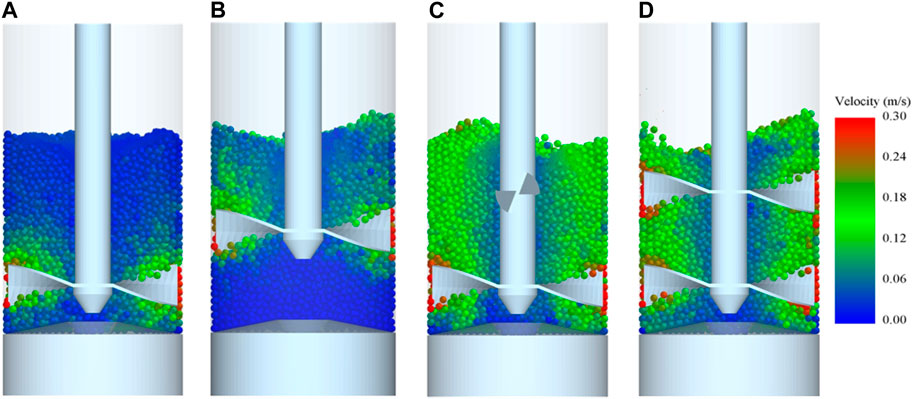
FIGURE 17. Velocity profiles of particles for different blade configurations: (A) bottom-positioned single impeller, (B) centre-positioned single impeller, (C) orthogonal double impeller, and (D) parallel double impeller.
3.5.2 Number of blades
The influence of the number of blades on SACnorm for a bed height of 26 mm, guest concentration of 2 %w/w and blade rotational speed of 244 rpm is shown in Figure 18. The double impeller (with four blades) provides higher SACnorm than the single impeller (with two blades) due to greater bed mobility as indicated by the velocity profiles in Figure 17. However, the parallel configuration of the blades provides greater SACnorm.
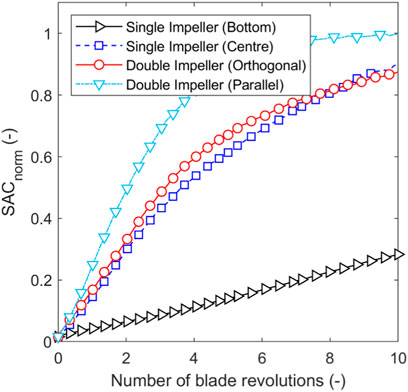
FIGURE 18. Effect on number of blades and blade configuration on SACnorm for a bed height of 26.0 mm, guest concentration of 2 %w/w and blade rotational speed of 244 rpm.
4 Regime map
A Design of Experiments (DoE) is employed to evaluate the influence of material properties and process parameters on coating efficiency at reduced computational cost, for the single impeller design at the centre of a 13.0 mm high bed, with 2 %w/w guests. This approach is taken to generate a map of surface area coverage as a function of material properties and process parameters. The map is intended to enable process parameters (e.g., mixing speed or time) to be tailored in an operation to achieve a given surface area coverage, based on material properties (size, density and surface energy of guest and host particles). The Sobol sequence (Sobol, 1976), a quasi-random low discrepancy sampling method, is used to generate 32 representative parameter combinations of dimensionless guest-host Bond number (determined by host and guest material properties: size, density, and surface energy) and impeller rotational speed shown in Figure 19. The upper and lower limits of guest-host bond number were selected to cover a wide range of system cohesivity. These guest-host bond number values outlined by the Sobol sequence within this range were achieved using a range of values for host-guest size ratio (10, 20 and 30) and guest-host density ratio (1, 1.5), with surface energy (equal for host and guest particles) being adjusted to achieve the desired Bond number. The combinations of material properties (size ratio, density ratio, and surface energy) and impeller speeds are shown in Table A1. Splashing was observed in a number of the simulated cases (see Figure 20), whereby particles are aerosolized due to a combination of high shear rate, low cohesion energy and/or low density of guest particles. The splashing effect gives inaccurate temporal evolution of the SAC, which is incomparable to the non-splashing cases. Consequently, the cases with splashing effect are excluded from further analysis. As indicated by Figure 20, a clear splashing limit based on impeller speed and cohesion is not evident when considering guest-host Bond number. In contrast, the harmonic mean Bond number shows a clear limit that separates splashing and non-splashing cases.
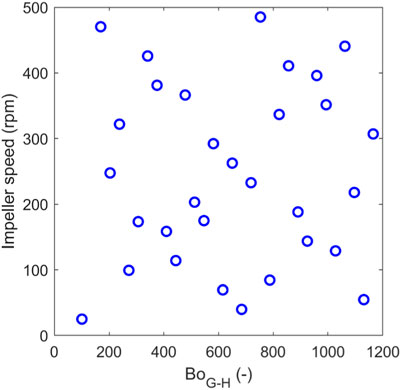
FIGURE 19. DoE of numerical simulations based on Sobol sampling sequence.
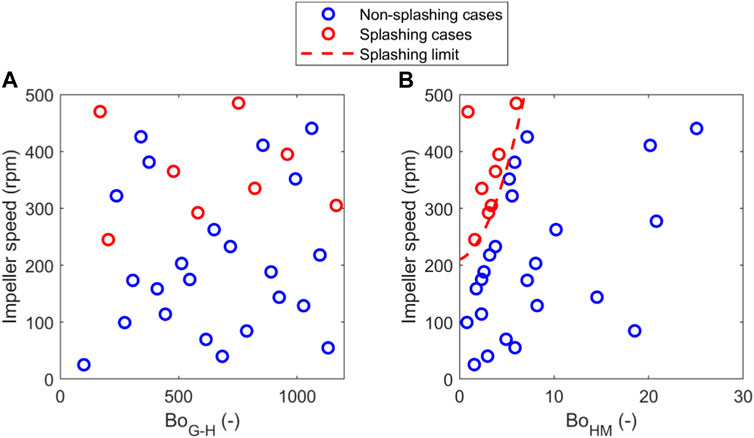
FIGURE 20. Simulated cases with splashing and non-splashing effect using (A) guest-host Bond number and (B) harmonic mean Bond number.
The parameter space expressed by Stokes deformation number (for process parameters) as a function of the different Bond numbers (for material properties) is shown in Figure 21. Each vertical line of data points represents a single simulation of fixed material properties and impeller speed, with each data point representing a different time within the simulation (longer times equate to higher Stokes deformation numbers). Figures 21A–D show that irrespective of the Bond number quantification approach there is a general increase in surface area coverage as Stokes deformation number is increased. Figures 21A–C show several simulations around intermediate values of Bond number where high surface area coverage could not be achieved even at high Stokes deformation numbers. Whilst all of the sub figures of Figure 21 show the same surface area coverage for a given simulation, the harmonic mean Bond number in Figure 21D provides the clearest clustering of the cases with similar values of SACnorm. A contour map of the Stokes deformation number against harmonic mean Bond number for these guest-host mixtures is shown in Figure 22A. This regime map provides a prediction of the design space for optimal dry coating performance based on the system energy input and material properties. For low Stdef (e.g., below 500), and low BoHM (e.g., below 3.5), low SAC is observed due to insufficient mixing energy resulting in inadequate dispersion and weak interparticle forces between the guest and host particles hence poor adhesion, respectively. This region of low Stdef and low BoHM is also characterised by low variance of SAC (see Figure 22B) since the majority of host particles remain uncoated. For low BoHM and high Stdef, low SAC and low variability (due to most particles being uncoated) is still observed, since there is insufficient cohesion to enable guests to stick to the host no matter how much mixing energy is supplied. Conversely, a very high BoHM with low energy input leads to relatively poor guest dispersion due to stronger interparticle forces, hence poor coating efficiency. This can be alleviated by greater energy (higher Stdef) to break up the agglomerated guest particles and promote adhesion to the host particles. In this region of high BoHM, high standard deviation of SACnorm (greater than 1) is observed for Stdef < 1,000 (peaking around Stdef = 500), but this reduces to below unity as more energy is imparted into the system indicating a transition from clusters of guests heavily coating some hosts to a more uniformly dispersed discrete coating. Figure 23 shows a simplified representation of this map to separate the regimes, based on an assumption of effective coating corresponding to SACnorm > 0.8. Fulchini et al. (2017) found that the best flowability for coated cohesive powders is achieved at 10%–20% SAC, which corresponds to the aforementioned threshold of SACnorm = 0.8 in our system.
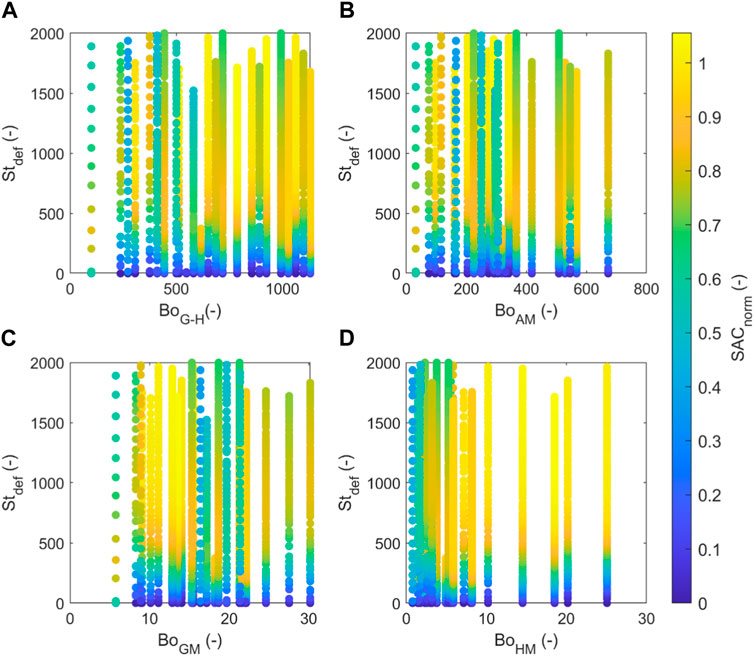
FIGURE 21. Distribution of parameter space of Stokes deformation number as a function of (A) guest-host Bond number, (B) arithmetic mean Bond number, (C) geometric mean Bond number, and (D) harmonic mean Bond number. Splashing cases have been excluded.
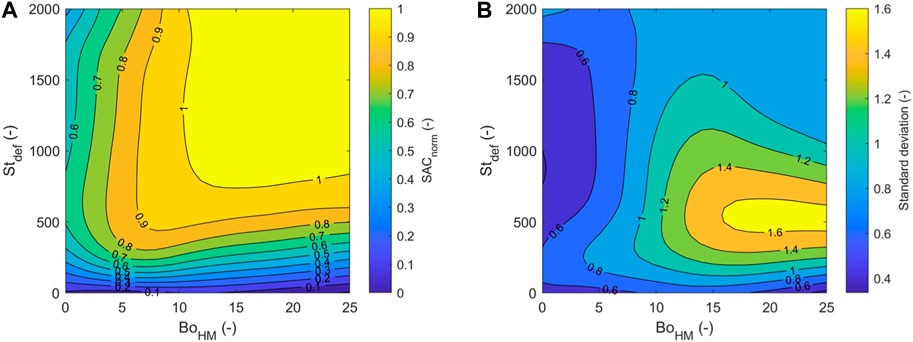
FIGURE 22. (A) Coating regime map (SACnorm) and (B) standard deviation of SACnorm based on Stokes deformation number as a function of harmonic Bond number.
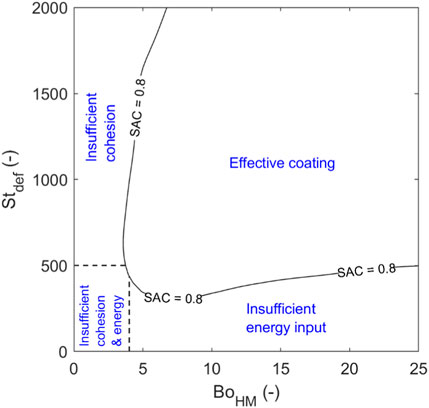
FIGURE 23. Simplified regime map indicating regimes of effective and undesirable coating using a threshold of SACnorm = 0.8.
Interestingly, despite the highly cohesive systems that are included in this map, we observed no case(s) of guest-guest cohesion prohibiting disruption of the agglomerates required to achieve effective coating, provided there was sufficient mixing energy input to the system. It may be the case that such cases exist beyond the range covered by this map (beyond a harmonic mean bond number of 25), which may be a pertinent avenue for future research. It should be noted that this regime map is valid for the specific system studied here—the 25 mm diameter FT4 Rheometer with a 13 mm bed height and 2 %w/w guests added to the bed surface prior to impeller agitation at a fixed vertical position centrally aligned in the bed. However, it is hypothesised that regime maps for other systems would contain broadly similar features, albeit with varying thresholds separating different regimes. Whilst this presented map may serve as a useful prediction tool for dry powder coating in similar systems (e.g., a vertical axis impeller mixing at moderate speeds), it is expected that a pronounced deviation from this system (e.g., using very high impeller speeds, a horizontal axis of rotation, or other driving force such as magnetically assisted impact coating) will lead to a change in the effective utilisation of mixing energy toward disrupting guest-guest agglomerates and subsequently leading to guest-host coating. The results in Section 3 indicate that impeller design and operation, bed height, guest fraction and guest initial location will affect the required energy input to achieve a given surface area coverage. Although particle sizes in a real coating system may differ very much from those used in simulations here to generate this regime map, it is expected that the harmonic mean of granular Bond number captures such changes so that the regime map remains reasonably valid for smaller particles (so long as the system is similar to that used in this work, e.g., a vertical axis impeller mixing at moderate speeds). Likewise a change in density ratio beyond that used to generate the regime map would be accounted for by a change in Bond number. A possible exception is the case where the guests are at least moderately cohesive and are less dense than the host, since the migration of the guests downward through the bed will be significantly reduced. Finally the validity of the map for highly non-spherical particles remains untested, one particular challenge here is suitably accounting for the particle shape in the characteristic size used to determine Bond number.
5 Conclusion
This study demonstrates that low rotational speeds provide higher average SAC, but higher rotational speeds provide a more even distribution of the SAC. The higher mechanical energy imparted on the particles results in higher shear stresses, which promote the breakage of agglomerates and dispersion of primary guest particles. The initial bed configuration influences the SAC, whereby initially locating the guest particles slightly above the blades, but not on the bed surface, leads to more uniform dispersion hence greater SAC. Higher bed heights reduce the SAC due to increased energy requirement for global mobilisation of the particles comparable to lower bed heights. Impeller blade position in the bed influences the SAC, with centre-positioned blades providing better coating performance than bottom-positioned blades. Furthermore, in a deep powder bed the combined rotational and vertical movement of the two-bladed impeller enhances the guest dispersion due to greater bed mobility, thus providing enhanced coating efficiency than the sole rotational blade movement. A four-bladed impeller with parallel blade configuration gives improved coating efficiency compared to the two-bladed impeller and the four-bladed impeller with orthogonal blade configuration.
A regime map was developed based on two dimensionless quantities, Stokes deformation number and harmonic mean Bond number. For very low harmonic bond numbers (e.g., below 3.5), poor coating is observed regardless of the value of Stokes deformation number due to low cohesive forces between host and guest particles, whereas for high harmonic Bond numbers, greater mixing energy is required to promote breakage of agglomerates and provide uniformly distributed coatings. At low Stokes deformation numbers (e.g., below 500), poor coating is observed due to insufficient mixing energy. The developed regime map can be used to estimate the design space or operational window of a similar dry coating system for optimal coating performance, thereby minimising energy input and material quantity requirements.
Data availability statement
The original contributions presented in the study are included in the article/Supplementary Material, further inquiries can be directed to the corresponding author.
Author contributions
MK: Conceptualization, Data curation, Formal Analysis, Investigation, Methodology, Visualization, Writing–original draft, Writing–review and editing. CH: Conceptualization, Funding acquisition, Methodology, Project administration, Writing–review and editing. VK: Writing–review and editing. JH: Conceptualization, Supervision, Writing–review and editing, funding acquisition.
Funding
The author(s) declare financial support was received for the research, authorship, and/or publication of this article. Financial support provided by Engineering and Physical Sciences Research Council (EPSRC) through the grant EP/V003070/2.
Acknowledgments
The authors would like to thank the Engineering and Physical Sciences Research Council (EPSRC) for financial support through the grant EP/V003070/2. The authors would also like to thank Jamie Clayton (Freeman Technology), Vicenzino Vivacqua (Johnson Matthey), Gerald Hebbink and Pauline Janssen (DFE Pharma) and Joel Caragay (Procter & Gamble) for providing their expertise in completion of this work.
Conflict of interest
The authors declare that the research was conducted in the absence of any commercial or financial relationships that could be construed as a potential conflict of interest.
Publisher’s note
All claims expressed in this article are solely those of the authors and do not necessarily represent those of their affiliated organizations, or those of the publisher, the editors and the reviewers. Any product that may be evaluated in this article, or claim that may be made by its manufacturer, is not guaranteed or endorsed by the publisher.
Footnotes
1Note, these simulations are runs 12 and 16 in Table A1, respectively.
References
Alonso, M., Satoh, M., and Miyanami, K. (1989). Kinetics of fines transfer among carriers in powder coating. Powder Technol. 59, 217–224. doi:10.1016/0032-5910(89)80068-3
Capece, M., Borchardt, C., and Jayaraman, A. (2021). Improving the effectiveness of the Comil as a dry-coating process: enabling direct compaction for high drug loading formulations. Powder Technol. 379, 617–629. doi:10.1016/J.POWTEC.2020.10.070
Chen, Y., Jallo, L., Quintanilla, M. A. S., and Dave, R. (2010). Characterization of particle and bulk level cohesion reduction of surface modified fine aluminum powders. Colloids Surf. A Physicochem Eng. Asp. 361, 66–80. doi:10.1016/J.COLSURFA.2010.03.015
Dave, R., Chen, W., Mujumdar, A., Wang, W., and Pfeffer, R. (2003). Numerical simulation of dry particle coating processes by the discrete element method. Adv. Powder Technol. 14, 449–470. doi:10.1163/156855203769710672
Deng, X., Zheng, K., and Davé, R. N. (2018). Discrete element method based analysis of mixing and collision dynamics in adhesive mixing process. Chem. Eng. Sci. 190, 220–231. doi:10.1016/j.ces.2018.06.043
Fulchini, F., Zafar, U., Hare, C., Ghadiri, M., Tantawy, H., Ahmadian, H., et al. (2017). Relationship between surface area coverage of flow-aids and flowability of cohesive particles. Powder Technol. 322, 417–427. doi:10.1016/J.POWTEC.2017.09.013
Gärtner, E., Jung, H. Y., Peter, N. J., Dehm, G., Jägle, E. A., Uhlenwinkel, V., et al. (2021). Reducing cohesion of metal powders for additive manufacturing by nanoparticle dry-coating. Powder Technol. 379, 585–595. doi:10.1016/J.POWTEC.2020.10.065
Honda, H., Kimura, M., Honda, F., Matsuno, T., and Koishi, M. (1994). Preparation of monolayer particle coated powder by the dry impact blending process utilizing mechanochemical treatment. Colloids Surf. A Physicochem Eng. Asp. 82, 117–128. doi:10.1016/0927-7757(93)02620-T
Jaber, A. A., Obaid, A. A., Advani, S. G., and Gillespie, J. W. (2021). Experimental investigation of dry powder coating processing parameters on the polystyrene particle’s distribution on the surface of carbon fibers. Powder Technol. 393, 461–470. doi:10.1016/J.POWTEC.2021.07.089
Jing, Z., Ma, Y., and Zhu, J. (2022). Application of a novel electrostatic dry powder coating technology on capsules for enteric release. J. Drug Deliv. Sci. Technol. 68, 103058. doi:10.1016/J.JDDST.2021.103058
Karde, V., Panda, S., and Ghoroi, C. (2015). Surface modification to improve powder bulk behavior under humid conditions. Powder Technol. 278, 181–188. doi:10.1016/J.POWTEC.2015.03.025
Khala, M. J., Hare, C., Karde, V., and Heng, J. Y. Y. (2023). A numerical analysis of the influence of material properties on dry powder coating performance. Chem. Eng. Res. Des. 193, 158–167. doi:10.1016/j.cherd.2023.03.028
Khala, M. J., Hare, C., Wu, C.-Y., Venugopal, N., Murtagh, M. J., and Freeman, T. (2021). Density and size-induced mixing and segregation in the FT4 powder rheometer: an experimental and numerical investigation. Powder Technol. 390, 126–142. doi:10.1016/j.powtec.2021.05.027
Khala, M. J., Hare, C., Wu, C. Y., Venugopal, N., Murtagh, M. J., and Freeman, T. (2022). Rheological response of granular materials under dynamic conditions. Powder Technol. 398, 117074. doi:10.1016/J.POWTEC.2021.117074
Kunnath, K., Chen, L., Zheng, K., and Davé, R. N. (2021). Assessing predictability of packing porosity and bulk density enhancements after dry coating of pharmaceutical powders. Powder Technol. 377, 709–722. doi:10.1016/J.POWTEC.2020.09.037
Mullarney, M. P., Beach, L. E., Davé, R. N., Langdon, B. A., Polizzi, M., and Blackwood, D. O. (2011). Applying dry powder coatings to pharmaceutical powders using a comil for improving powder flow and bulk density. Powder Technol. 212, 397–402. doi:10.1016/J.POWTEC.2011.06.008
Nguyen, D., Rasmuson, A., Thalberg, K., and Björn, I. N. (2016). The exchange of fines between carriers in adhesive particle mixing: a study using DEM simulation. Powder Technol. 288, 266–278. doi:10.1016/j.powtec.2015.10.048
Nguyen, D., Rasmuson, A., Thalberg, K., and Niklasson Bjorrn, I. (2014). Numerical modelling of breakage and adhesion of loose fine-particle agglomerates. Chem. Eng. Sci. 116, 91–98. doi:10.1016/J.CES.2014.04.034
Otles, S., Lecoq, O., and Dodds, J. A. (2011). Dry particle high coating of biopowders: an energy approach. Powder Technol. 208, 378–382. doi:10.1016/j.powtec.2010.08.032
Pfeffer, R., Dave, R. N., Wei, D., and Ramlakhan, M. (2001). Synthesis of engineered particulates with tailored properties using dry particle coating. Powder Technol. 117, 40–67. doi:10.1016/S0032-5910(01)00314-X
Prasad, L. K., McGinity, J. W., and Williams, R. O. (2016). Electrostatic powder coating: principles and pharmaceutical applications. Int. J. Pharm. 505, 289–302. doi:10.1016/J.IJPHARM.2016.04.016
Qu, L., Zhou, Q., Denman, J. A., Stewart, P. J., Hapgood, K. P., and Morton, D. A. V. (2015). Influence of coating material on the flowability and dissolution of dry-coated fine ibuprofen powders. Eur. J. Pharm. Sci. 78, 264–272. doi:10.1016/J.EJPS.2015.07.016
Smikalla, M., Mescher, A., Walzel, P., and Urbanetz, N. A. (2011). Impact of excipients on coating efficiency in dry powder coating. Int. J. Pharm. 405, 122–131. doi:10.1016/J.IJPHARM.2010.12.001
Sobol, I. M. (1976). Uniformly distributed sequences with an additional uniform property. USSR Comput. Math. Math. Phys. 16, 236–242. doi:10.1016/0041-5553(76)90154-3
Stephenson, P. L., and Thiel, W. J. (1980). The mechanical stability of ordered mixtures when fluidized and their pharmaceutical application. Powder Technol. 26, 225–227. doi:10.1016/0032-5910(80)85067-4
Tamadondar, M. R., de Martín, L., Thalberg, K., Björn, I. N., and Rasmuson, A. (2018). The influence of particle interfacial energies and mixing energy on the mixture quality of the dry-coating process. Powder Technol. 338, 313–324. doi:10.1016/j.powtec.2018.07.022
Thornton, C., and Ning, Z. (1998). A theoretical model for the stick/bounce behaviour of adhesive, elastic-plastic spheres. Powder Technol. 99, 154–162. doi:10.1016/S0032-5910(98)00099-0
Watano, S., Imada, Y., Miyanami, K., Wu, C.-Y., Dave, R. N., Pfeffer, R., et al. (2000). Surface modification of food fiber by dry particle coating. J. Chem. Eng. Jpn. 33, 848–854. doi:10.1252/jcej.33.848
Wei, G., Mangal, S., Denman, J., Gengenbach, T., Lee Bonar, K., Khan, R. I., et al. (2017). Effects of coating materials and processing conditions on flow enhancement of cohesive acetaminophen powders by high-shear processing with pharmaceutical lubricants. J. Pharm. Sci. 106, 3022–3032. doi:10.1016/J.XPHS.2017.05.020
Yang, J., Sliva, A., Banerjee, A., Dave, R. N., and Pfeffer, R. (2005). Dry particle coating for improving the flowability of cohesive powders. Powder Technol. 158, 21–33. doi:10.1016/j.powtec.2005.04.032
Yang, Q., Ma, Y., and Zhu, J. (2015). Applying a novel electrostatic dry powder coating technology to pellets. Eur. J. Pharm. Biopharm. 97, 118–124. doi:10.1016/J.EJPB.2015.10.006
Zhang, Q., Yang, J., Teng, S., Dave, R. N., Zhu, L., Wang, P., et al. (2009). In-situ, simultaneous milling and coating of particulates with nanoparticles. Powder Technol. 196, 292–297. doi:10.1016/J.POWTEC.2009.08.011
Zhou, Q., Armstrong, B., Larson, I., Stewart, P. J., and Morton, D. A. V. (2010). Improving powder flow properties of a cohesive lactose monohydrate powder by intensive mechanical dry coating. J. Pharm. Sci. 99, 969–981. doi:10.1002/jps.21885
Zhou, Q. T., Qu, L., Larson, I., Stewart, P. J., and Morton, D. A. V. (2011). Effect of mechanical dry particle coating on the improvement of powder flowability for lactose monohydrate: a model cohesive pharmaceutical powder. Powder Technol. 207, 414–421. doi:10.1016/J.POWTEC.2010.11.028
Appendix A
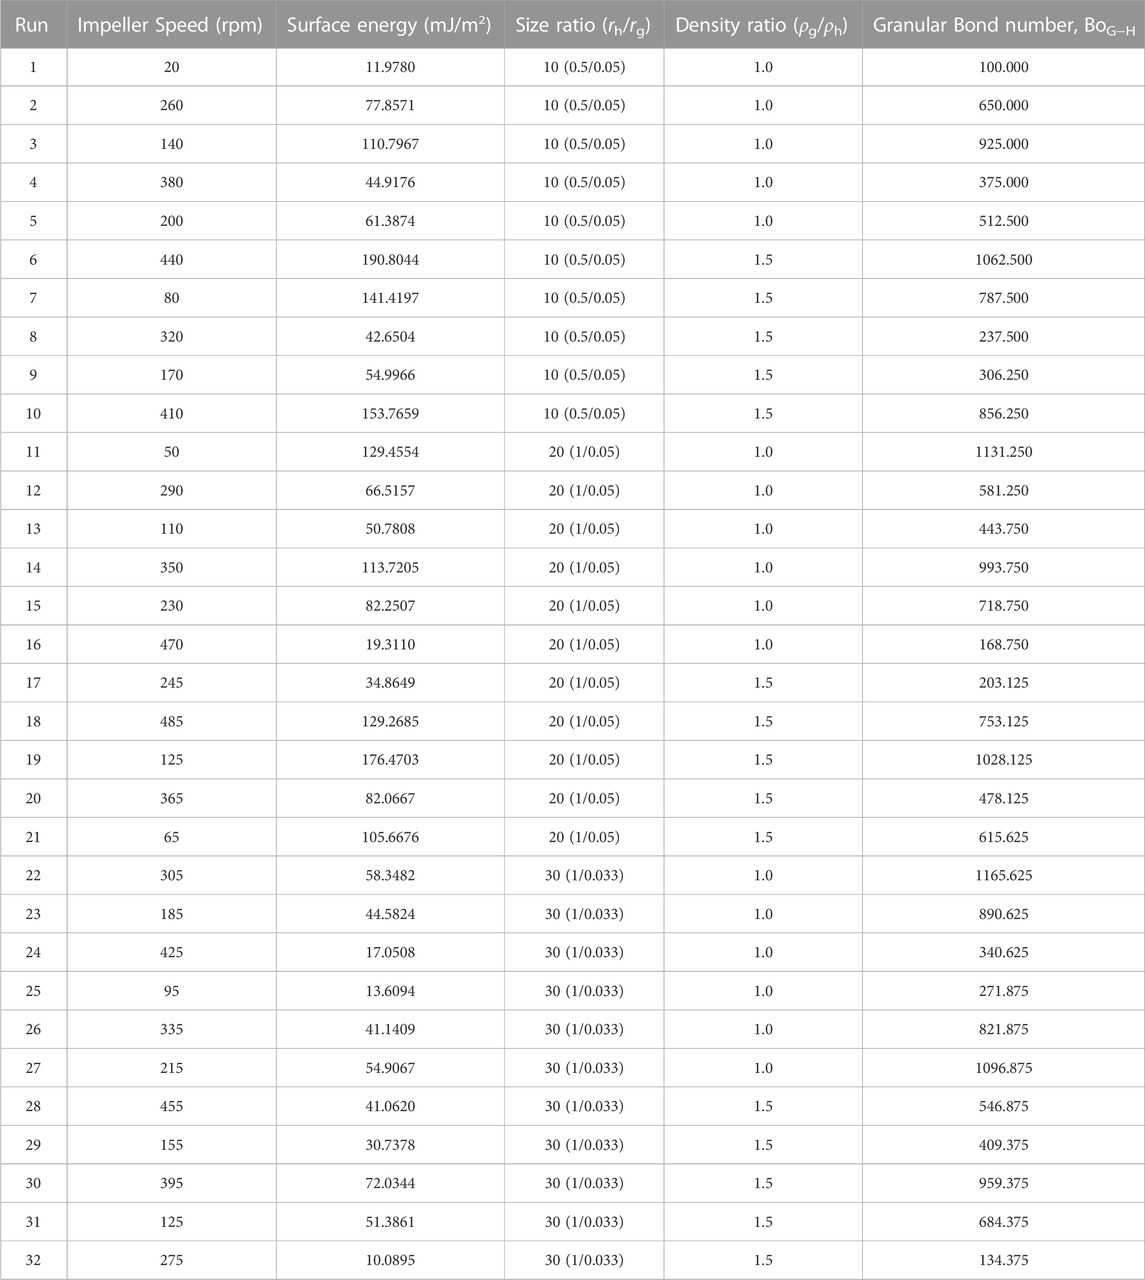
TABLE A1. Virtual DoE created using Sobol sampling sequence for DEM simulations used to develop the coating regime map.
Keywords: dry powder coating, regime map, stokes deformation number, granular bond number, DEM
Citation: Khala M, Hare C, Karde V and Heng JYY (2023) A regime map for dry powder coating: the influence of material properties and process parameters. Front. Chem. Eng. 5:1301386. doi: 10.3389/fceng.2023.1301386
Received: 24 September 2023; Accepted: 08 November 2023;
Published: 23 November 2023.
Edited by:
Zhengbiao Peng, The University of Newcastle, AustraliaReviewed by:
Dusan Ilic, The University of Newcastle, AustraliaStefan Radl, Graz University of Technology, Austria
Copyright © 2023 Khala, Hare, Karde and Heng. This is an open-access article distributed under the terms of the Creative Commons Attribution License (CC BY). The use, distribution or reproduction in other forums is permitted, provided the original author(s) and the copyright owner(s) are credited and that the original publication in this journal is cited, in accordance with accepted academic practice. No use, distribution or reproduction is permitted which does not comply with these terms.
*Correspondence: Colin Hare, colin.hare@newcastle.ac.uk