 Alexander Beugholt
 Dominik Ulrich Geier
 Thomas Becker
- Chair of Brewing and Beverage Technology, Technical University of Munich, Munich, Germany
A variety of yeast applications in the food and beverage industry require individual and reproducible yeast propagation at high yields and consistent quality. One quality-determining parameter for yeast propagation is effective aeration to avoid oxygen depletion. Therefore, this work investigated three important aeration parameters: airflow, pulse time, and oxygen concentration, for their influence on yeast propagation. The aeration of a propagator involves phase transitions which are gradient-driven processes and can be accelerated with higher gradients between the liquid medium and the gas bubbles. In this study, oxygen-enriched air generated with membrane filters was used to aerate the system in an easy and cost-efficient way without the need for expensive technical gas usage. Propagation experiments were carried out in a pilot-scale reactor equipped with a membrane filter system for enhanced oxygen concentrations in ingas and online sensors for representative monitoring of the process. The membrane filter system is based on the separation of nitrogen in compressed air, leading to oxygen enrichment. Using oxygen-enriched air for propagation aeration showed higher oxygen transfer into the medium and the anaerobic process time caused by oxygen depletion due to high cell numbers was reduced by an average of 7.4% for pulsed aeration. Additionally, we conducted experiments with controlled measures of dissolved oxygen using different oxygen concentrations for aeration. The main objective of this study is to present a new and affordable optimization of propagation aeration using membrane filtration to enrich process air. The results showed increased cell counts for higher ingas oxygen concentrations and no negative impact on cell vitality was observed. Hence, our investigations showed that using oxygen-enriched air reduced the frequency of pulsed aeration, thus hindering foam formation, a limiting factor of the yeast propagation process.
1 Introduction
Saccharomyces is an ideal model organism for several scientific research topics and an important tool for the industrial manufacturing of many products. However, the industry requires individual and reproducible yeast propagation with high yields and stable product quality (Baghban et al., 2019; Rahmat and Kang, 2020). An integral part of this process is effective aeration to avoid potential oxygen limitations and to enable proper growth conditions without damaging the cells through oxidative stress (Beugholt et al., 2022). Aeration increases the dissolved oxygen concentration in the medium and additionally reduces the concentration of dissolved gases like CO2 and other volatile substances. Since oxidative metabolism is more efficient in generating ATP, the yeast requires the presence of oxygen in the cultivation medium for optimal biomass production (Alexander and Jeffries, 1990). The high cell counts during the propagation process require artificial aeration to enable aerobic metabolism. There are different types of methods to achieve forced aeration of the medium: surface aeration, utilization of blowers, and bubbleless membrane reactors (Pankhania et al., 1994; Drewnowski et al., 2019). Various types of aeration units exist for each of the stated methods, but depending on the field of application surface aeration and bubble reactors are most relevant. In the brewing industry venturi-type reactors are the standard method to aerate the system with air bubbles as small as possible for the best aeration efficiency (Panda et al., 2020). The standard pulsed aeration procedure for industrial brewing using venturi valves is divided into two parts: the pulse phase (when air is pumped into the medium) and the pause phase (when aeration is inactive). The idea behind implementing the pause phase was the decline in the previously formed foam during the pulse phases since antifoam agents are either not allowed or may cause unwanted interactions during upcoming process steps and reduces foam stability in the final product (Wilde et al., 2003). Pulsed aeration with constant phase durations has proven to be the most economical solution in the brewing industry since less measurement and control effort is required compared to constant aeration. The calculation of the decrease in dissolved oxygen during the pause periods due to cellular uptake is shown in Equation 1 (Atkinson and Mavituna, 1991):
where CL = dissolved oxygen concentration, QO2 = specific oxygen uptake rate, and X = biomass concentration.
The microbial oxygen uptake rate
where
Conversely, the volumetric oxygen transfer coefficient, kLa, describes the efficiency of the aeration system and depends on various parameters, such as the temperature, bubble size, airflow, and geometry of the fermentation tank (Seidel and Eibl, 2021). Specifically, kLa is a combination of the mass-transfer coefficient
where Ctp = dissolved oxygen concentration at tp, tp = time when pulse starts.
Consequently, an optimal aeration system generates a steady-state condition in the optimal oxygen concentration range of the respective microorganism, meeting the criteria in E. 4, where the known microbial oxygen uptake rate
However, given its low solubility in aqueous solutions, oxygen can be a limiting factor for fermentation processes. To this end, increasing the oxygen demand of cell cultures during exponential growth phases causes high cell counts toward the end of microbial processes, which leads to a fall in the dissolved oxygen concentrations of the medium (Garcia-Ochoa et al., 2010). Still, meeting the increasing oxygen demand has remained a process engineering challenge. Therefore, to better understand the basic oxygen transition mechanism, Figure 1 shows a simple two-film theory model, first described by Lewis and Whitman in 1924 (Lewis and Whitman, 1924).
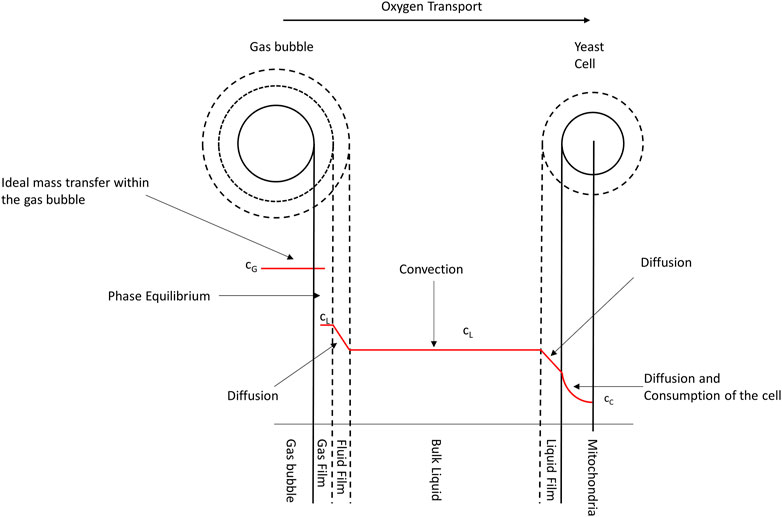
FIGURE 1. Schematic representation of oxygen transfer from an air bubble to a yeast cell’s mitochondria. The red curve corresponds to the oxygen concentration in the medium, with cG being the concentration inside the gas bubble, cL being the concentration in the liquid, and cc being the concentration in the cell for 21% oxygen in ingas.
It is evident from Figure 1 that oxygen underwent a series of transport processes on its way from the gas bubble into the cell. First, in the gas bubble, oxygen diffuses into the propagation medium through a laminar boundary layer on the gas and liquid sides. Although the inside of the gas bubble and the propagation medium are assumed to be ideally mixed, resulting in a location-independent concentration, the diffusive transport in the gas film surrounding the gas bubble leads to a constant decrease in oxygen concentration down to the equilibrium concentration between the gas bubble and the fermentation medium. Then, a second diffusion step occurs in the liquid film surrounding the cell. In this case, the concentration decreases to the equilibrium concentration in the laminar boundary layer, as in the surrounding layer of the gas bubble. Conversely, when inside the cell, oxygen is transported by diffusion into the organelles, where it is metabolized. Although this process leads to a nonlinear decrease in the oxygen concentration in the cell, oxygen has low solubility in water; thus, the diffusion of the gas through the liquid film is very slow. In contrast, its diffusion rate in the gas film is quick and can be neglected for the total transport (Mines and Sherrard, 1987). Summarily, the resulting transport rate of the entire process from the bubble to the cell is mainly determined by two slow diffusion steps.
The most used characterization of gas diffusion is Fick’s law. Fick’s law comprises a diffusion coefficient defined as the mass per time when moving along a diffusion direction through a given area perpendicular to the diffusion direction (Zhao et al., 2019). Furthermore, its relation in Eq. 5 defines diffusion as driven by a concentration gradient between higher and lower concentration regions. As the mathematical descriptions meeting the experimental conditions were difficult to obtain, the diffusion coefficient was mainly considered constant.
where
The difference between the saturation point and the oxygen concentration of the ingas defines the concentration gradient and therefore the transition speed of oxygen into the propagation medium. For the original extract of wort, the carbon source of the yeast, a valid negative linear correlation was observed with the saturation point up to approximately 15% original extract, as shown in Eq. 7 (Annemüller et al., 2008):
where
As shown in this introduction there are many ways to manipulate the phase transition of oxygen during the aeration of a bioreactor. One of the most important parameters for an accelerated phase transition is the gradient between the reaction medium and the gas bubble. An obvious way to increase this gradient would be using technical oxygen, but this is a cost-intensive method that also has the potential to harm yeast cells due to oxidative stress. In this paper, we investigate a membrane filter to increase the oxygen content in pressured air as a continuous way to enrich the ingas of the propagation process. Based on the above background, this work evaluated the influence of three parameters: airflow, aeration duration, and oxygen concentration on the pulsed aeration of brewer’s yeast propagation with fixed pulse times. In the first step, the influence of the tested parameters on foam formation and duration of aerobic metabolism was monitored. Then, we investigated the impact on the resulting cell count, yeast vitality, and aeration duration, applying variable pulse times in a proportional–integral–derivative (PID) controller.
2 Materials and methods
2.1 Preculture
Experiments were conducted using Saccharomyces pastorianus ssp. Carlsbergensis TUM 34/70, a genetic hybrid of Saccharomyces cerevisiae and Saccharomyces eubayanus widely used in industrial brewing. The preculture was first inoculated with dry yeast and cultivated on a shaker under aerobic conditions through several intermediate steps for 144 h at room temperature to a final volume of 3 L.
2.2 Propagation
Figure 2 shows the experimental setup consisting of a membrane filter system and fermentation tank with online sensors. As the oxygen enrichment of pressured air is based on a membrane separation process that reduces the nitrogen concentration in ambient air, thereby increasing the oxygen content for the process input. By adopting this membrane filter, it was possible to regulate the oxygen concentration from 21% to 36.5%. The oxygen content is controlled by the airflow in the membrane. Lower Airflows lead to higher oxygen concentrations due to more effective separation of nitrogen and a higher resulting oxygen content that remains in the gas mixture. Aeration of the process was performed in a bypass, using a venturi valve to generate a homogeneous fermentation broth with small bubbles for optimal oxygen transfer. The dissolved oxygen concentration was measured using optical online sensors.
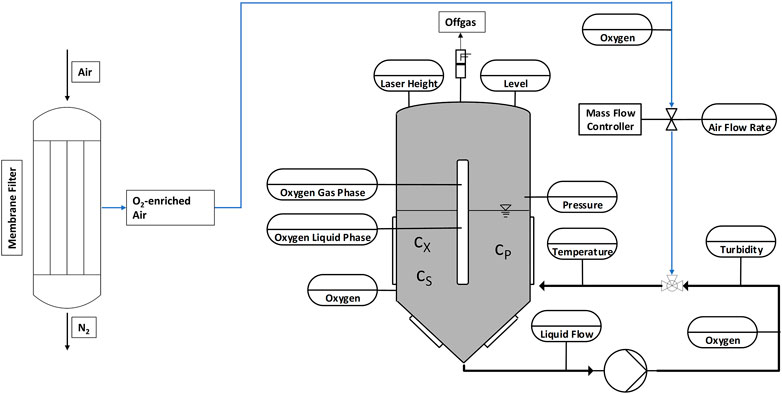
FIGURE 2. Schematic showing the experimental setup. A membrane filter separates oxygen from nitrogen to increase the oxygen concentration in the process ingas. The placement of the online sensors used is also shown.
Extract and free amino nitrogen (FAN) are terminologies in the brewing industry to describe carbon and nitrogen sources available for the yeast. As a propagation medium, lager cast wort from an industrial brewery during knockout was used. It had extract content of 11.28 ± 0.11°P and 197.6 ± 3.69 mg/L FAN, its pH was 5.14 ± 0.036. Furthermore, its temperature was controlled at 12°C, its initial cell count was set to 5 × 10⁶ cells per ml at a total volume of 60 L, and the propagation was performed for 3 days. Three parameters were investigated in this study: airflow, pulse duration, and oxygen concentration of the ingas, each with two different values, were tested for their effects on the aeration of brewer’s yeast propagation. A summary of the tested parameters with their corresponding values is shown in Table 1. First, the airflow was alternated between a low level of 0.008 vvm and a higher level of 0.025 vvm, ensuring sufficient oxygen supply and preventing over-foaming in the tank. Then, while the propagation process was divided into 1000-s cycles with 100 s or 200 s of aeration and 900 s or 800 s of foam decrease, the oxygen concentration was alternated between 21% and 36.5%.
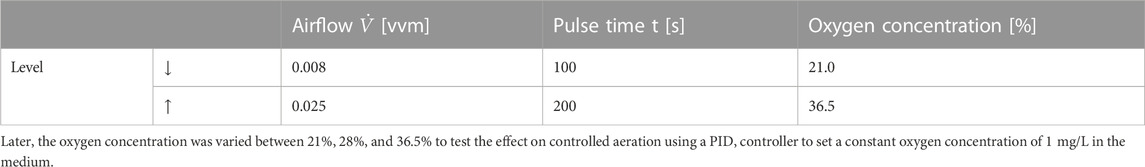
TABLE 1. Corresponding values of the tested parameters.
2.3 Cell count
The cell count was measured manually using a microscope and a hemocytometer according to MEBAK 10.4.3.1 and MEBAK 10.11.4.4 (Jacob, 2013).
2.4 Yeast vitality
According to Weigert et al. and Imai and Ohno, yeast vitality was determined by measuring the intracellular pH (ICP) based on flow cytometry (Imai and Ohno, 1995; Weigert et al., 2009). (Weigert et al., 2009) stated that very good vitality of yeast cells should correspond to an ICP value of 5.6–6.2. Conversely, lower ICP values indicate worse cell vitality.
2.5 Foam volume
The foam height was detected using a laser-based system on top of the vessel to measure the distance to the sensor. At the beginning of the propagation, the initial distance without foam formation was determined and used as a reference value. However, as the foam rose during the process, the distance to the laser decreased with the given geometry of the vessel. Hence, the correlating foam volume was calculated using the following formula:
where VRel = relative foam volume, VFoam = total volume of foam, DVessel = diameter of the tank, h0 = initial filling level, h = filling level, and VTank = volume of the propagator.
3 Results
3.1 Influence of aeration parameters on propagation processes during pulsed aeration
In industrial brewing, a standard procedure for process aeration is the pulse-pause method with fixed pulse times and without a control loop. A huge drawback of this technique is a possible oxygen limitation during the pause phases that allow foam reduction.
3.1.1 Aerobic ratio of process time
Figure 3 shows the aerobic proportion of the processing time, where the dissolved oxygen concentration is higher than 0.5 mg/L. In literature, this value is associated with the transition to anaerobe metabolism (Kurz, 2003). The aerobic proportion of the process is calculated according to E. 9.
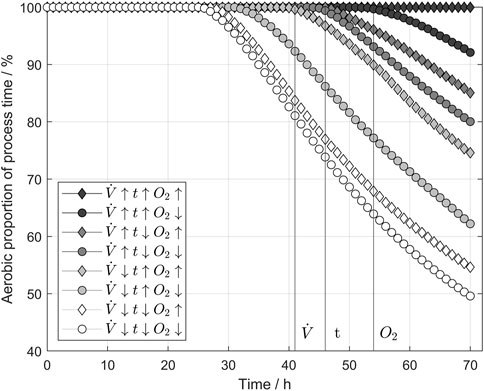
FIGURE 3. Influence of aeration parameters on the aerobic proportion of the process. If the dissolved oxygen level was above 0.5 mg/L, the metabolism was taken as aerobic to ensure enough oxygen supply to the yeast cells. All three tested parameters beneficially influenced the aerobic proportion increase. The parameter values refer to Table 1.
A dissolved oxygen concentration of 0.5 mg/L ensured an aerobic environment for the yeast cells, thus enabling aerobic metabolism. Conversely, when the dissolved oxygen concentration fell below this threshold after 26 h during the pause phases at the lowest settings tested, the aerobic proportion also decreased with each pause phase because of the increasing cell count. The order of the shown curves indicates the decreasing impact of the three parameters: airflow, pulse time, and oxygen concentration. Notably, the highest settings resulted in 100% aerobic proportion, meaning that even during pause phases, the dissolved oxygen did not fall below 0.5 mg/L, and aerobic metabolism was always enabled. However, reducing the oxygen content in the ingas led to a decrease in aerobic proportion from h 54. The results indicate that if only the pulse time had been reduced, a decrease in the aerobic proportion of the process time would have started at h 47. Reducing the airflow results in a decreasing aerobic proportion of the process at 41 h. The earlier a change can be detected, the higher the impact of the parameter on the aeration efficiency. But comparing the aerobic proportion at the end of the process, a higher oxygen concentration still increases the aerobic proportion by an average of 7.4%.
3.1.2 Foam formation
In industrial brewing, foaming during yeast propagation is a process challenge that is mostly faced by using massive tanks with a huge headspace for potential foam formation. As antifoam applications are unusual in industrial breweries due to the desired foam stability in the final product, aeration is a key factor in designing resource-efficient propagation systems with less headspace. Figure 4 shows the foam volume relative to the fluid volume during the conducted propagations parameters calculated according to Eq. 8 for different combinations of the tested. The airflow had the highest impact on the foam formation, dividing the tested propagation into two groups with high and low airflow. The maximal foam volume decreased in the group with the higher airflow if the pulse time was reduced or higher oxygen concentrations were applied. In contrast, differences between the batches were negligible for low airflow because hardly any foam formation occurred. The oxygen concentration influenced the foam formation and higher oxygen levels was able to decrease the foam volume in the tank. This potentially enables smaller headspaces in propagators.
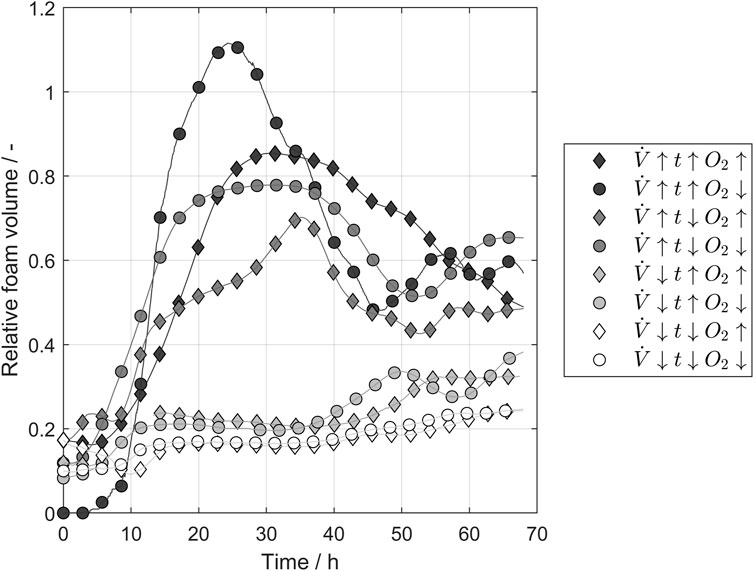
FIGURE 4. Laser sensor measurements of the foam volume relative to liquid volume in the tank over time. The airflow of the ingas mostly influenced the foam height. The parameter values refer to Table 1.
3.2 Influence of oxygen concentration during controlled aeration
The following experiments were conducted using a PID controller to generate a fixed dissolved oxygen concentration of 1 mg/L by controlling the airflow, thereby investigating the influence of oxygen concentration on the yeast propagation process more critically. To this end, we tested three scenarios in triplicates, varying the oxygen concentrations between 21%, 28%, and 36.5%.
3.2.1 Cell count
Figure 5 displays the cell count development for the three tested oxygen concentrations. The figure shows the normalized cell count to avoid any effect of cell count differences after inoculation. In the first few hours, no significant difference between the batches was observed as the cells still adapted to the medium and the temperature. After 20 h, the cell counts sperate from each other and the batches that had been aerated with 28% oxygen in the ingas showed the highest growth rate. This trend continued until the end of the propagation, showing a significantly higher cell count than the other two tested oxygen concentrations. The propagation using 36.5% oxygen in ingas showed similar behavior to the cells aerated with 21% oxygen. Notwithstanding, the final cell counts are significantly higher than those aerated with 21%. A comparison of the cell counts from propagations with 36.5% oxygen and 28% oxygen indicates the possibility of an optimal oxygen concentration in the ingas that leads to higher cell counts and faster-growing cells than the surrounding concentration of 21%. Both 36.5% oxygen and 28% oxygen lead to increased cell counts whereby the application of 28% oxygen generates the highest cell counts.
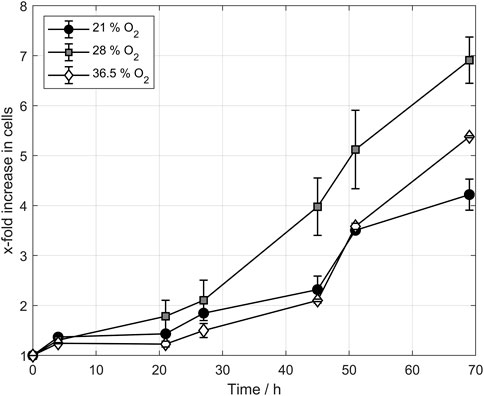
FIGURE 5. Cell count development of propagation triplicates during controlled aeration. Higher oxygen concentrations increased the cell count during yeast propagation, providing an optimal concentration as the 36.5% cell count was lower than the 28% cell count.
3.2.2 Yeast vitality
Subsequently, we conducted vitality tests to detect the impact of oxygen-enriched air on yeast cells. For this purpose, the ICP value is a common test in brewing science. The ICP value is regulated by proton pumps located in the plasma membrane (Bracey et al., 1998). Furthermore, as the active transport of hydrogen ions out of the cell into the extracellular space enables the uptake of nutrients into the yeast cell, the ICP is also an indirect marker for the yeast’s metabolic and vitality states. Besides, yeast with poor vitality has several disadvantages in practical applications, such as delaying fermentation or altering the formation of aroma compounds. For this reason, the ICP value is an important parameter for industrial applications of a yeast culture. In this study, the ICP was measured at the beginning of the propagation directly after inoculation. All measured cultures showed a high ICP and good vitality at the start of the propagation. Hence, two other sample times were chosen after 45 h and 69 h, during the exponential growth phase. Although the yeast showed a slightly lower ICP, it was still within the range of excellent vitality and the difference was not significant. The adaptation to a new medium and the temperature difference to the preculture reduced the ICP, but it remained within an excellent range, according to the literature (Weigert et al., 2009). The last sample was taken after 69 h at the end of the propagation and still showed very high vitality. Finally, a one-way analysis of variance of all three tested oxygen concentration triplicates was conducted to confirm our results during controlled propagation at 1 mg/L. The results showed no significant difference in vitality between the tested groups (p = .89), indicating no drawbacks or advantages in using higher oxygen concentrations for yeast production in terms of yeast vitality.
3.2.3 Aeration time for controlled aeration
An ideal aeration procedure enables optimal growth rates while simultaneously minimizing foam formation. As described in section 3.1.2, shorter aeration times per hour lead to less intense foam formation, indicating that the opening times of the aeration valve are a critical factor in the process. To examine the influence of the oxygen concentration of the ingas on the aeration time, a PID controller was used. The PID successfully kept an oxygen concentration of 1 mg/L in the propagation medium by controlling the airflow and the opening of the aeration valve. Figure 6 A) displays the dissolved oxygen concentration using the PID controller during a representative propagation. For the first 25 h, low cell counts led to little overshooting and a slow decrease of dissolved oxygen during the pause phases. With increasing cell counts an oxygen value of 1 mg/L with minor overshooting can be reached. Overall, the PID controller worked well reaching a mean dissolved oxygen concentration of 1.13 mg/L, 1.28 mg/L, and 1.35 mg/L with a standard deviation of 0.087 mg/L, 0.170 mg/L, and 0.213 mg/L after the first 24 h of the process. Figure 6 B) shows the resulting mean-opening times per hour of the aeration valve for the respective process hours. Our investigations revealed that higher oxygen concentrations shortened the aeration phases because of the higher oxygen gradient between the rising gas bubbles and the fermentation medium, resulting in a better oxygen transfer into the medium and enabling shorter aeration phases. Specifically, for the first 13 h, hardly any aeration was necessary because the cell count and the resulting oxygen uptake were still low. However, after the end of the lag phase at 9 h, the effect of higher oxygen concentrations started to become visible. After 40 h, the batches aerated with 36.5% oxygen had separated from the 28% oxygen batches and showed even lower aeration times. Hence, at the end of the propagation, the mean aeration times differed greatly between the used oxygen concentrations.
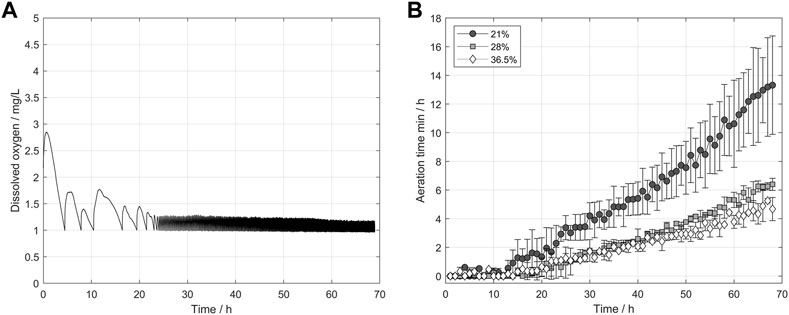
FIGURE 6. (A) Representative course of the dissolved oxygen concentration using the PID controller with a setpoint of 1 mg/L. (B) Opening time of the aeration valve per hour using a PID controller for aeration. Higher oxygen concentrations enabled shorter pulse phases to reach the setpoint.
3.3 Influence of the propagation medium on the oxygen concentration
Saccharomyces pastorianus is a bottom-fermenting yeast that prefers lower temperatures than other yeast strains for fermentations with desired aroma profiles. Therefore, the results shown in this study were generated at a temperature of 12°C. Although this low temperature may be unusual for yeast cell production in other industries, it was chosen to avoid temperature ramps between the two process steps of propagation and fermentation (Narziß et al., 2017). However, as the medium composition changes during propagation, these changes must be addressed in theoretical considerations and further calculations. Eq. 6 describes the correlation between the oxygen saturation point and the medium used for propagation. The saturation point is depending on the oxygen ingas content, the absolute pressure, a temperature-dependent solubility coefficient, and a correction factor for the wort. In Figure 7 low temperatures lead to high oxygen saturation points. The resulting gradient between the aeration gas bubbles and the propagation medium enhances the oxygen transition into the medium for the used temperatures. Extract consumption as a carbon source for the yeast additionally enhances oxygen transition into the medium during the end of the propagation. The roles of the ingas oxygen concentration and wort extract are shown in Figure 7. In this figure, Eq. 6, 7 were applied for different temperatures and oxygen concentrations to calculate the influence on the saturation concentration of oxygen. Additionally, the influence of the original wort extract was calculated to present the influence of the changing medium on the saturation point. By applying Eq. 6, 7 to an actual propagation, two important parameters can be derived: the saturation point and the transfer rate into the media. These factors are highly dependent on the oxygen concentration in the ingas, as shown in Eq. 2. Conversely, by metabolizing the extract and producing alcohol and other by-products, the saturation point changes constantly with the factor
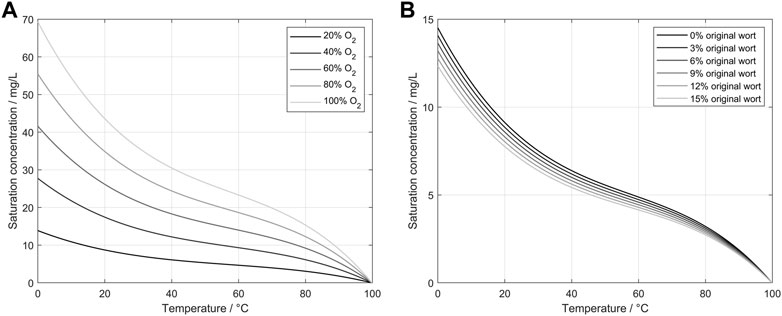
FIGURE 7. (A) Calculated saturation concentration of oxygen in water depending on the oxygen concentration of the ingas and the water temperature (Xing et al., 2014). (B) Calculated saturation concentrations of oxygen in wort depending on the original extract and wort temperature.
4 Discussion
In the brewing industry, Saccharomyces pastorianus, a genetic hybrid of Saccharomyces cerevisiae and Saccharomyces eubayanus, is an important yeast strain showing high phenotypic and genomic similarities to S. cerevisiae (Monerawela and Bond, 2018). Given its high relevance in industrial beer production, a sufficient supply in quantities and vitality is essential for this yeast. Hence, aeration to maintain optimal growing conditions throughout the process has been identified as an important factor for efficient yeast propagation. Based on the above facts, this study investigated the influence of three relevant parameters for pulsed aeration on industrial applications, including controlled aeration on yeast cells. Although a major drawback of pulsed aeration is the decrease in dissolved oxygen during the pause phases, these phases are necessary to reduce the foam volume in the propagation tank since antifoam usage would influence the upcoming process steps and the final product. During the pause phases, the aeration is stopped completely, and the dissolved oxygen is decreasing. Toward the end of the propagation, the dissolved oxygen dropped to 0 mg/L during the pause phase, hindering the more efficient aerobic metabolism for biomass formation. Therefore, it was necessary to analyze the impact of airflow, pulse time, and oxygen concentration of the ingas because these parameters represented possible adjustments for the aeration procedures of the existing process. The results showed a positive effect of all tested parameters on the aerobic proportion of the process when they were increased. In particular, the airflow showed the greatest influence on the aerobic proportion. Using a membrane filter system to increase the oxygen concentration of the ingas up to 36.5%, the oxygen-enriched air showed a significant prolongation of the aerobic environment during the pause periods. Because the tested membrane system allowed more effective aeration of the process without using expensive industrial gases, air flow or pulse times were reduced while maintaining aeration efficiency, and air pipe diameters and pressures can be reduced. As shown in Figure 4, the reduced airflow caused less foam formation. This study showed that although the oxygen concentration and the pulse time influenced foam formation, airflow had the most optimization potential for foam reduction during yeast propagation with pulsed aeration. Hence, by increasing the oxygen concentration of the ingas, the airflow and associated foam formation could be reduced without losing ventilation efficiency.
Conversely, the first part of this study dealt with pulsed aeration and fixed pulse times, whereas the second part addresses controlled aeration using a PID controller for airflow regulation. The experiments conducted showed a significant increase in final cell counts, using oxygen-enriched air. Notably, both oxygen concentrations of 28% and 36.5% positively influenced the cell count compared to the normal pressured air concentration of 21% oxygen. However, no further improvement was observed at 36.5% compared to 28%. There was still an improvement compared to 21%, but the cell count decreased compared to the experiments conducted with 28% oxygen concentration in ingas. These results suggest the beneficial impact of increased oxygen content in ingas on the final cell count of yeast propagation and oxygen optimum for cell growth.
Efficient yeast propagation aims to produce a huge quantity of cells with high vitality for pleasing fermentation performance. Thus, it is critical to clarify the yeasts’ reaction to different aeration conditions. Higher oxygen concentrations can cause oxidative stress in the cells and therefore damage the cells or reduce their vitality but oxidative stress can also increase the fermentative capacity of the yeast (Pérez-Torrado et al., 2005; Pérez-Torrado et al., 2009). Therefore, Figure 8 shows the results of the ICP measurement as an indicator of vitality with no significant negative of the tested ingas oxygen concentrations during controlled aeration of the propagation. Consequently, the possibility of using all the shown advantages of oxygen-enriched air in the tested concentration range without damaging the cells is proposed. In addition to the presented outcomes, the calculations displayed in Figure 7 should be considered. We observed that although the saturation point of oxygen in water is strongly dependent on the oxygen concentration in the ingas, the ongoing change of the medium during propagation also involved a change in the saturation point. Comparing this to Eq. 2 leads to a changing transmission rate of oxygen into the medium due to the changing oxygen gradient. At lower temperatures during brewer’s yeast propagation, a major impact on the transfer rate was observed, with results indicating that a faster transmission enables shorter pulse duration, lower airflows, and reduces foam formation.
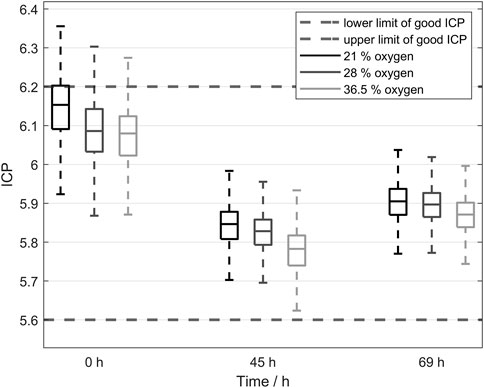
FIGURE 8. Yeast vitality measured using intracellular pH (ICP). No significant difference in ICP was observed, indicating that cells harvested after propagation were not negatively affected by oxygen-enriched air.
5 Conclusion
In this study, membrane filtration was successfully applied to enrich the oxygen content of ambient air to aerate the industrial process of Saccharomyces propagation. With this method, an increase in the oxygen concentration to 36.5% was achieved, which was introduced into the propagator. The increase in oxygen content allowed a mean extent of the aerobic environment during pulsed aeration of 7.4%. Additionally, the foam formation during propagation was reduced. When setting a constant dissolved oxygen concentration in the propagation medium, oxygen-enriched air led to increased cell counts, without any evidence of harmed cells. The ICP measurements as an indicator of yeast vitality showed no significant decrease when using elevated concentrations of oxygen. The higher oxygen concentrations also enabled shorter aeration periods to hold a certain amount of dissolved oxygen in the medium, reducing the overall foam formation. The higher concentration gradients generated by using membrane filtration of ambient air led to a faster and more effective phase transition of oxygen according to the two-film theory of Lewis and Whitman (Lewis and Whitman, 1924). The presented results lead to the following process recommendation: Higher oxygen concentrations should be used for yeast propagations with pulsed aeration due to longer aerobic conditions. Higher oxygen concentrations also result in lower foam formation. The highest oxygen concentration tested did not result in the highest cell count, therefore the oxygen concentration should not be set too high, but between the ambient concentration and 36.5%. This leads to the limitation of this work. More concentrations are to be tested for their impact on yeast cell development and a possible negative effect. Taking the above points into consideration, membrane filtration of ambient air for oxygen-enriched air forms a cost-effective basis for propagation aeration optimization. These results will provide a basis for further investigation of the effects of propagation aeration on the final product.
Data availability statement
The raw data supporting the conclusion of this article will be made available by the authors, without undue reservation.
Author contributions
AB Data collection and drafted the article, conception, or design of the work. DG Critical revision of the article TB. Final approval of the version to be published. All authors contributed to the article and approved the submitted version.
Funding
This Project (ZF4025035SK9) was part of the “ZIM” (Zentrales Innovationsprogramm Mittelstand) funding program and supported by the Federal Ministry for Economic Affairs and Energy (BMWi) on the basis of a decision by the German Bundestag.
Conflict of interest
The authors declare that the research was conducted in the absence of any commercial or financial relationships that could be construed as a potential conflict of interest.
Publisher’s note
All claims expressed in this article are solely those of the authors and do not necessarily represent those of their affiliated organizations, or those of the publisher, the editors and the reviewers. Any product that may be evaluated in this article, or claim that may be made by its manufacturer, is not guaranteed or endorsed by the publisher.
References
Alexander, M. A., and Jeffries, T. W. (1990). Respiratory efficiency and metabolite partitioning as regulatory phenomena in yeasts. Enzyme Microb. Technol. 12 (1), 2–19. doi:10.1016/0141-0229(90)90173-N
Atkinson, B., and Mavituna, F. (1991). Biochemical engineering and biotechnology handbook, 2. New York: Stockton Pr.
Baghban, R., Farajnia, S., Rajabibazl, M., Ghasemi, Y., Mafi, A. A., Hoseinpoor, R., et al. (2019). Yeast expression systems: Overview and recent advances. Mol. Biotechnol. 61 (5), 365–384. doi:10.1007/s12033-019-00164-8
Beugholt, A., Büchner, K., Geier, D. U., and Becker, T. (2022). Quantification of oxidative stress in Saccharomyces pastorianus propagation: Gene expression analysis using quantitative reverse transcription polymerase chain reaction and flow cytometry. Front. Chem. Eng. 4, 1035348. doi:10.3389/fceng.2022.1035348
Drewnowski, J., Remiszewska-Skwarek, A., Duda, S., and Łagód, G. (2019). Aeration process in bioreactors as the main Energy consumer in a wastewater treatment plant. Review of solutions and methods of process optimization. Processes 7 (5), 311. doi:10.3390/pr7050311
Garcia-Ochoa, F., Gomez, E., Santos, V. E., and Merchuk, J. C. (2010). Oxygen uptake rate in microbial processes: An overview. Biochem. Eng. J. 49 (3), 289–307. doi:10.1016/j.bej.2010.01.011
Garcı́a-Ochoa, F., Castro, E. G., and Santos, V. E. (2000). Oxygen transfer and uptake rates during xanthan gum production. Enzyme Microb. Technol. 27 (9), 680–690. doi:10.1016/S0141-0229(00)00272-6
Imai, T., and Ohno, T. (1995). The relationship between viability and intracellular pH in the yeast Saccharomyces cerevisiae. Appl. Environ. Microbiol. 61 (10), 3604–3608. doi:10.1128/aem.61.10.3604-3608.1995
Jacob, F. (2013). Collection of brewing analysis methods of the mitteleuropäische brautechnische analysenkommission. Mitteleuropäische brautechnische analysenkommission. Freising-weihenstephan. Freising: MEBAK.Wort, beer, beer-based beverages.
Kurz, T. (2003). Mathematically based management of Saccharomyces sp. batch propagations and fermentations. Düsseldorf: VDI Verlag (Fortschritt-Berichte VDI. Reihe 14 Landtechnik/Lebensmitteltechnik Nr 112).
Lewis, W. K., and Whitman, W. G. (1924). Principles of gas absorption. Industrial Eng. Chem. 16 (12), 1215–1220. doi:10.1021/ie50180a002
Mines, R., and Sherrard, J. (1987). “Biological enhancement of oxygen transfer in the activated sludge process,” in Water pollution control federation 59, 19–24. Online verfügbar unter Available at: https://www.jstor.org/stable/25043164.
Monerawela, C., and Bond, U. (2018). The hybrid genomes of Saccharomyces pastorianus: A current perspective. Yeast Chichester, Engl. 35 (1), 39–50. doi:10.1002/yea.3250
Munasinghe, P. C., and Khanal, S. K. (2010). Syngas fermentation to biofuel: Evaluation of carbon monoxide mass transfer coefficient (kLa) in different reactor configurations. Biotechnol. Prog. 26 (6), 1616–1621. doi:10.1002/btpr.473
Narziß, L., Back, W., Gastl, M., and Zarnkow, M. (2017). Abriss der Bierbrauerei. 8., vollständig überarbeitete und erweiterte Auflage. Weinheim: Wiley-VCH Verlag GmbH and Co. KGaA. Online verfügbar unter Available at: https://onlinelibrary.wiley.com/doi/book/10.1002/9783527812820.
Panda, D., Saharan, V. K., and Manickam, S. (2020). Controlled hydrodynamic cavitation: A review of recent advances and perspectives for greener processing. Processes 8 (2), 220. doi:10.3390/pr8020220
Pankhania, M., Stephenson, T., and Semmens, M. J. (1994). Hollow fibre bioreactor for wastewater treatment using bubbleless membrane aeration. Water Res. 28 (10), 2233–2236. doi:10.1016/0043-1354(94)90037-X
Pérez-Torrado, R., Bruno, B., Jose, M., and Matallana, E. (2005). Monitoring stress-related genes during the process of biomass propagation of Saccharomyces cerevisiae strains used for wine making. Appl. Environ. Microbiol. 71 (11), 6831–6837. doi:10.1128/AEM.71.11.6831-6837.2005
Pérez-Torrado, R., Gómez-Pastor, R., Larsson, C., and Matallana, E. (2009). Fermentative capacity of dry active wine yeast requires a specific oxidative stress response during industrial biomass growth. Appl. Microbiol. Biotechnol. 81 (5), 951–960. doi:10.1007/s00253-008-1722-9
Rahmat, E., and Kang, Y. (2020). Yeast metabolic engineering for the production of pharmaceutically important secondary metabolites. Appl. Microbiol. Biotechnol. 104 (11), 4659–4674. doi:10.1007/s00253-020-10587-y
Seidel, S., and Eibl, D. (2021). Influence of interfacial force models and population balance models on the kLa value in stirred bioreactors. Processes 9 (7), 1185. doi:10.3390/pr9071185
Tribe, L. A., Briens, C. L., and Margaritis, A. (1995). Determination of the volumetric mass transfer coefficient (k(L)a) using the dynamic "gas out-gas in" method: Analysis of errors caused by dissolved oxygen probes. Biotechnol. Bioeng. 46 (4), 388–392. doi:10.1002/bit.260460412
Weigert, C., Steffler, F., Kurz, T., Shellhammer, T. H., and Methner, F.-J. (2009). Application of a short intracellular pH method to flow cytometry for determining Saccharomyces cerevisiae vitality. Appl. Environ. Microbiol. 75 (17), 5615–5620. doi:10.1128/AEM.00650-09
Wilde, P. J., Husband, F. A., Cooper, D., Ridout, M. J., Muller, R. E., and Mills, E. N. C. (2003). Destabilization of beer foam by lipids: Structural and interfacial effects. J. Am. Soc. Brew. Chem. 61 (4), 196–202. doi:10.1094/ASBCJ-61-0196
Xing, W., Yin, M., Lv, Q., Hu, Y., Liu, C., and Zhang, J. (2014). “Oxygen solubility, diffusion coefficient, and solution viscosity,” in Wei Xing, Geping Yin und Jiujun Zhang (Hg.): Rotating electrode methods and oxygen reduction electrocatalysts (Waltham, MA: Elsevier), 1–31.
Keywords: aeration, biomass, membrane separation, oxygen enrichment, yeast, Saccharomyces
Citation: Beugholt A, Geier DU and Becker T (2023) Improvement of Saccharomyces propagation performance through oxygen-enriched air and aeration parameter variation. Front. Chem. Eng. 5:1193230. doi: 10.3389/fceng.2023.1193230
Received: 24 March 2023; Accepted: 08 May 2023;
Published: 18 May 2023.
Edited by:
Vasudeo Zambare, University of Technology Malaysia, MalaysiaReviewed by:
Subha M. Roy, GLA University, IndiaRafał Rakoczy, West Pomeranian University of Technology, Poland
Copyright © 2023 Beugholt, Geier and Becker. This is an open-access article distributed under the terms of the Creative Commons Attribution License (CC BY). The use, distribution or reproduction in other forums is permitted, provided the original author(s) and the copyright owner(s) are credited and that the original publication in this journal is cited, in accordance with accepted academic practice. No use, distribution or reproduction is permitted which does not comply with these terms.
*Correspondence: Dominik Ulrich Geier, ZG9taW5pay5nZWllckB0dW0uZGU=