- School of Chemical and Metallurgical Engineering, University of the Witwatersrand, Johannesburg, South Africa
Increasing freshwater costs and environmental concerns have necessitated the adoption of strategies for reducing freshwater consumption and effluent water discharge in chemical processes. Regeneration technologies increase opportunities for water reuse and recycle, and nanofiltration has emerged as a competitive wastewater regeneration technology. However, the optimal design of nanofiltration networks has not been extensively investigated. This study presents a framework for the optimal design and synthesis of multicontaminant nanofiltration membrane regenerator networks for application in water minimization problems. Mathematical optimization technique is developed based on a superstructure containing all system components and streams, incorporating nanofiltration units, pumps, and energy recovery devices. A linear approach and the modified Spiegler-Kedem model are explored in modelling the nanofiltration, and the steric-hindrance pore model is used to characterize the membrane. The objective of the optimization is to simultaneously minimize the water consumption and the total annual cost of the network. Furthermore, the optimal size, configuration, membrane properties and operating conditions of the equipment are determined. The applicability of the model is illustrated using a case study of an integrated pulp and paper plant. It was found that detailed models with customized modules are more useful when compared to the linear “black box” approach and approaches using fixed module specifications. The customized, detailed design of the regenerator network increased freshwater savings by 24% when compared to a black-box model, 31% when compared to a detailed model with fixed module specifications and 41% when compared to a reuse-recycle system with no regeneration. Similarly, cost savings of 38, 35 and 36% respectively were obtained. A trade-off was noted between the energy costs and the other components of the objective function since more energy was required to facilitate the reduction of water consumption and capital requirements.
Introduction
Process sustainability is considered the greatest challenge for chemical engineers in the 21st century (Gwehenberger and Narodoslawsky, 2008). The responsible consumption of resources such as water, energy and non-renewable raw materials is critical for ensuring that the industry meets the ever-increasing demand for products while guaranteeing that future generations are also able to meet their needs. Water is a critical resource in our ecosystem. However, there is uncertainty over future supplies due to depleting reserves, increased consumption, persistent droughts, and climate change (Hamiche et al., 2016). It is predicted that by 2050, global water demand will outstrip sustainable supply by 50 percent (Hieminga and Witteveen, 2015). This looming crisis has placed unprecedented financial, legislative, and social pressure on chemical industries, necessitating the implementation of creative strategies to reduce water consumption. These include the optimal design of sustainable water networks, which minimize the freshwater intake and wastewater disposal, as well as the optimization of existing processes to meet the prevailing standards.
The reduction of freshwater consumption and wastewater generation through water reuse, recycle and regeneration is known as water minimization (Wang and Smith, 1994). The differences between reuse, recycle and regeneration-reuse/regeneration-recycle are illustrated in Figure 1. In water reuse, wastewater from one operation is used in other operations except for the operation where it was originally used. Water recycling entails returning water to the operation in which it was originally used, whereas regeneration is the partial treatment of water before recycle or reuse to obtain water that has an acceptable contaminant load for the sink operation (Jeżowski, 2010).
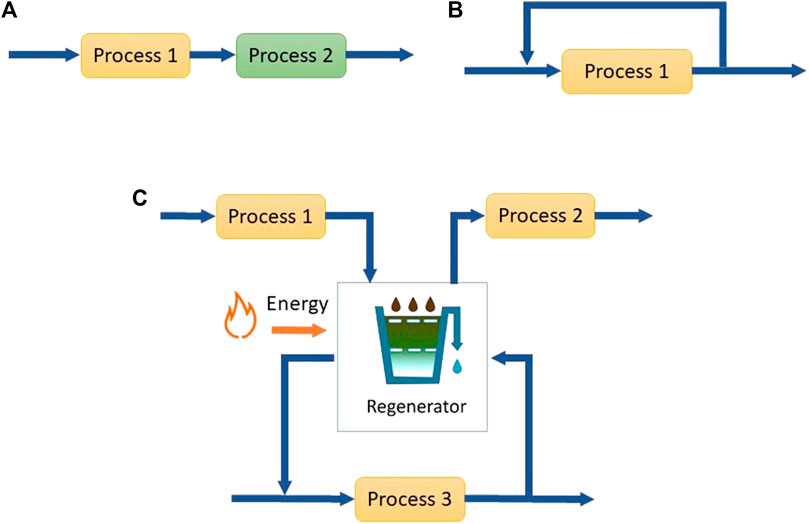
FIGURE 1. (A) Reuse of water from process 1 in process 2 (B) Recycle of water from process 1 (C) Regeneration reuse from process 1 to 2 and regeneration recycle in process 3.
Water minimization can result in a significant reduction in capital costs, operational costs, as well as the environmental footprint of chemical plants. In factories lacking water minimization schemes, about 85–96% of the water consumed in plant operations is discharged as wastewater (Sachidananda and Rahimifard, 2012). When performing water minimization, it is imperative to consider the complex interactions between different units and operations, rather than optimizing each separately. There are three classes of water minimization methods, namely graphical methods, algebraic methods, and mathematical optimization techniques. Whilst graphical methods have been proven to give reasonable insights with a low computational expense, their graphical nature necessitates substantial simplification, which may compromise the quality of the solution (Abass and Majozi, 2016). This limitation is exacerbated when the complexity is increased by introducing regenerators and/or multiple contaminants (Kuo and Smith, 1997). In addition, graphical methods mainly focus on the flowrate and contaminant concentration. They cannot intrinsically incorporate economic, geographical and safety constraints (Doyle and Smith, 1997). The algebraic methods on the other hand are an adapted version of the graphical methods, albeit without any need for graphical representation (Foo et al., 2006).
Mathematical optimization methods model the problem using a system of mathematical equations, which are solved simultaneously to obtain the best solution (Snyman, 2005). These techniques address the limitations of insight-based methods by enabling a more robust and rigorous approach to the solution procedure and allowing for the inclusion of complex scenarios. Mathematical optimization involves generating a network superstructure containing all streams and units in the network, and their respective connections. The interactions between the various components of the superstructure are represented using mathematical equations which are solved in order to obtain an optimal configuration targeting a specified objective such as maximum profit, minimum cost and/or minimum environmental impact, subject to operational or regulatory constraints (Khor et al., 2014). The optimal configuration is thus a subset of the superstructure, having been selected from the multiple alternative solutions that exist within the superstructure (Alnouri and Linke, 2012). Depending on the constraints involved, the resulting system of equations can be a linear program (LP), nonlinear program (NLP), mixed integer nonlinear program (MINLP) or mixed integer linear program (MILP) (Edgar et al., 2001). Current water network problems are mostly complex NLPs or MINLPs. A drawback of mathematical techniques is that they usually are computationally expensive, particularly when they involve nonconvexity and nonlinearity, and may thus require large amounts of time to solve (Abass and Majozi, 2016).
Takama et al. (1980) pioneered the water network synthesis problem by developing a superstructure based linear program to determine the configuration which minimized the cost of freshwater and wastewater treatment in a petroleum refinery. The network contained water-using and water-treating processes only. Subsequent research has significantly improved the understanding of water network synthesis problems and explored the inclusion of additional considerations such as multiple processes, multiple contaminants, pre-treatment, and regeneration.
Two approaches have been used to represent water regeneration technologies in water network models. The “black box” approach is a simplified method, employing linear relations that use a fixed removal ratio (RR) or fixed outlet concentrations to represent the regenerator. The “detailed” approach incorporates complex transport mechanisms, usually resulting in an NLP or MINLP. Although the simplified black-box approach allows for the design of multi-regenerator networks without the increased complexity, the resultant configurations tend to be less accurate in representing real-life water networks, as the true performance of the regenerator cannot be estimated adequately (Nezungai and Majozi, 2016). This discrepancy between the assumed performance and actual performance can result in high inaccuracies in costing and design, limiting the applicability of black-box models to non-complex designs (Yang et al., 2014). Detailed regenerator models are advantageous because they provide a more realistic representation of the water network. They also allow for the specification and comparison of different regeneration types. The drawback of detailed models is that they normally require a lot of data to be available and can be extremely time-consuming if the level of detail is high.
Many studies have investigated the synthesis of superstructure-based optimization models for the optimal design of membrane regenerator networks. Some examples are shown in Table 1. When designing and retrofitting water networks, such models aid the decision-making process by giving an indication of the most optimal setup and predicting its performance and associated costs. Various technologies are available for the regeneration of industrial wastewater. Membrane technologies such as reverse osmosis, electrodialysis, nanofiltration, ultrafiltration, microfiltration, and pervaporation have increasingly been applied in the process industry since their inception in the late 1950s. This can be attributed to their lower energy demand, lower capital costs and lower utility costs when compared to conventional separation technologies such as distillation, absorption, stripping, and extraction (Galan and Grossmann, 1998).
Nanofiltration membranes have a wide range of applications, encompassing industries such as source water and wastewater treatment (Shahmansouri and Bellona, 2015) food and beverage manufacture (Cassano et al., 2019), pharmaceuticals (Buonomenna and Bae, 2015), pulp and paper (Beril Gönder et al., 2011), textiles (Yaseen and Scholz, 2019) and oil refinery (Santos et al., 2016). The global nanofiltration market is currently growing at an annual rate of 5.3% and is expected to have reached $813 million by 2023 (Cassano et al., 2019). Nanofiltration membranes use steric and electrical effects as the driving force for separation. They have a molecular weight cut off (MWCO) of 200–1,000 Dalton and pore sizes of 0.1–2.0 nm (Mohammad, 2013). Their separation properties overlap those of reverse osmosis and ultrafiltration, resulting in a wide separation range (Mohammad et al., 2004). The lower operating pressures in nanofiltration significantly reduce energy costs when compared to reverse osmosis and electrodialysis making it more economically viable for many processes (Jye and Ismail, 2017). The technology is also superior in the treatment of potable water since it retains some trace minerals which are beneficial for human consumption and would need to be re-introduced in the case of reverse osmosis and electrodialysis (Bi et al., 2016).
When measuring the performance of nanofiltration membranes, the two major considerations are the solute removal ratio and the permeate flux. The removal ratio measures the membrane ability to remove a solute, whereas the permeate flux is the volume of permeate collected per unit area of the membrane, per unit time. Various models have been applied in predicting the performance of nanofiltration membranes. These can be classified into two main categories. The first is mechanistic models such as the Kimura-Sourirajan Analysis (Sourirajan, 1963), the solution diffusion model (Lonsdale et al., 1967), Nernst-Planck Equation (Nernst, 1888; Planck, 1890), Extended Nernst-Planck Equation (Tsuru et al., 1991), the Steric Hindrance Pore model (Nakao and Kimura, 1982) and the Donnan Steric Pore model (Bowen and Mohammad, 1998). The second category contains models based on irreversible thermodynamics such as the Kedem-Kachasky model (Kedem and Katchalsky, 1958) and Spiegler-Kedem model (Spiegler and Kedem, 1966). While there have been many investigations on the mechanisms governing rejection and flux in nanofiltration, the incorporation of these models into the optimal design and costing of water networks has not been studied extensively.
Wadley et al. (1995) designed a nanofiltration regeneration plant for brine and colourant removal in a sugar refinery. They explored a multicontaminant system and incorporated the Spiegler-Kedem model with two alternative nanofiltration module configurations. However, a detailed framework for a cost estimate was not included and superstructure optimization was not explored. Sethi and Wiesner (2000) presented a costing model for crossflow membranes. The model provided correlations for membrane capital and operating costs but did not dwell on the design aspects of the membrane modules and regenerator network. A black box approach was used. This study was later applied by Costa and de Pinho (2006), who proposed a tapered design for a 100,000 m3 d−1 nanofiltration plant for drinking water purification. The model considered multiple contaminants and used experimental data to generate a correlation between the permeate flowrate and solute rejection. However, only one configuration was considered and opportunities for energy recovery were not explored. Abejón et al. (2018) proposed the optimal design of a fractionation process incorporating ultrafiltration and nanofiltration membranes. Three alternative configurations were considered for the integration of three nanofiltration stages and three ultrafiltration stages, namely, the basic cascade, dual cascade, and linear co-current configurations. There is currently no model that incorporates a detailed nanofiltration model while simultaneously performing the design of a water network and nanofiltration regenerator network, accounting for all possible configurations of equipment, incorporating a pumping network and exploring opportunities for energy recovery.
Previous studies in the superstructure-based optimal design of pressure-driven membrane separation methods such as nanofiltration, ultrafiltration and reverse osmosis regenerator networks have used specified membrane modules, with known module sizes. The optimization was thus performed under the implicit assumption that the predetermined module was the best for the system. Whilst available heuristics and manufacturer guidelines are useful in selecting the correct size of modules for water networks, much benefit can be derived from a mathematical framework that selects the optimal characteristics of the membrane module based on the requirements of the system. This study attempts to address this gap by allowing the model to select the optimal values of the modules and membrane properties. The results can be used in selecting the most suitable membranes and modules from commercially available options, or in the fabrication of custom-made membranes and modules for specific water networks and contaminants.
The Spiegler-Kedem Model
The Spiegler-Kedem model (1966) has been widely used and experimentally validated in characterizing the removal of salts and organic compounds using nanofiltration in both single-contaminant and multicontaminant systems. When compared to mechanistic models, it is advantageous because it only requires three parameters to predict the transport of a solute through the membrane, i.e., the reflection coefficient,
• Steady state.
• Pressure and concentration differences are the driving force for separation.
• A non-ideal membrane, whose semi-permeability is represented by the reflection coefficient
• A solution where the volume fraction of the solute (contaminant) is considerably smaller than the volume fraction of the solvent (water).
• Negligible electrostatic interactions between the solute and the membrane.
In the study, we compare the Spiegler-Kedem transport model to the “black box” approach which employs a simplistic linear correlation, assuming a fixed removal ratio for each component.
The Steric Hindrance Pore Model
Whilst the simplicity of the Spiegler-Kedem model is a great advantage for modelling, its drawback is that it cannot be used to determine the structural properties of the membrane. Nair et al. (2018) proposed combining this model with the Steric Hindrance Pore (SHP) model developed by Nakao and Kimura in 1982. This model relates the reflection coefficient,
Problem Statement
The problem statement is formulated as follows.
Given:
1) A set,
2) A freshwater source, with a variable flowrate;
3) A set,
4) A wastewater stream, with a variable flowrate and known maximum allowable contaminant concentrations
5) Ranges of nanofiltration module design and operational parameters based on data obtained from manufacturers;
6) Costing parameters such as membrane costing factor, electricity costing factor, annual operating time, membrane life span;
It is desired to obtain the optimum water network and regenerator network which minimizes the amount of freshwater consumed, and wastewater disposed of, as well as the total annualized cost of the water network.
Model Formulation
In this section, a superstructure and an MINLP program encompassing the technical, operational, and financial aspects of the regenerator network are formulated using material balance equations, membrane model equations, equipment design equations, operation constraints, environmental constraints, and cost equations.
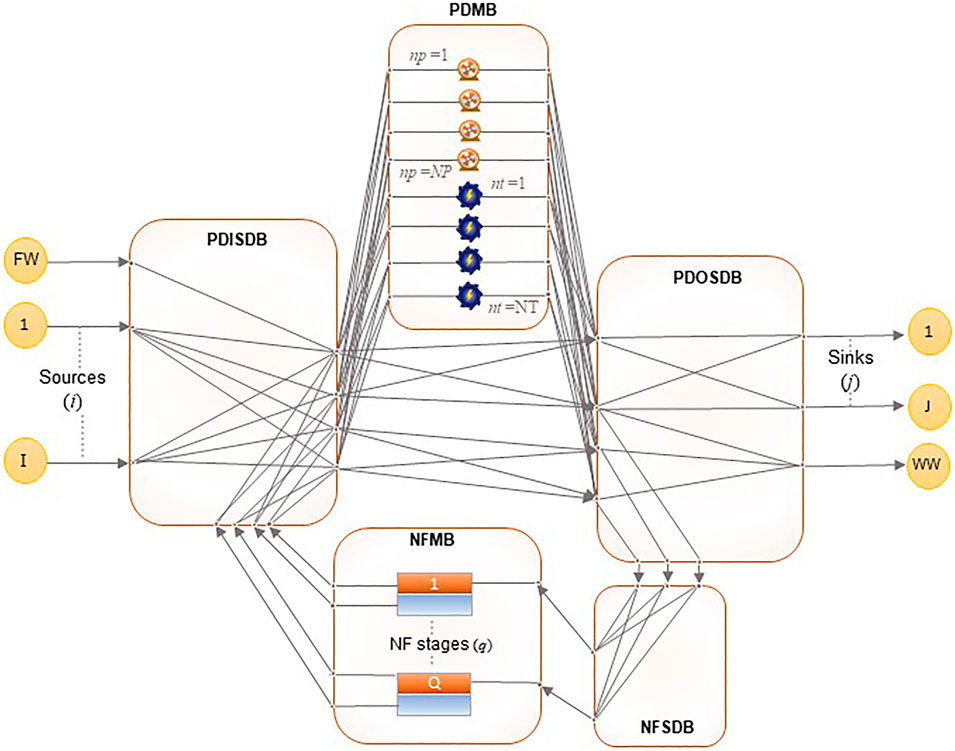
The model superstructure, presented in Figure 2, represents the nanofiltration regenerator network, based on the state-space approach for regenerator networks proposed by El-Halwagi (1992). Feed streams obtained from wastewater generating processes are fed to the pressurization/depressurization inlet stream distribution box (PDISDB). A freshwater stream, FW, is available to supplement the regenerator network in supplying feedwater to downstream processes. From the PDISDB, the streams can be distributed to the pressurization/depressurization matching box (PDMB) containing pumps and turbines, or directly to the pressurization/depressurization outlet stream distribution box (PDOSDB). The PDOSDB sends streams to the nanofiltration stream distribution box (NFSDB), which distributes them to regenerators in the nanofiltration matching box (NFMB) for treatment. Water from the PDOSDB can also be sent to the lean streams for reuse/recycle, and the concentrated waste stream for disposal. Permeate and retentate streams are prohibited from mixing in the PDOSDB to prevent recontamination. The sending of retentate streams to lean outlet streams and permeate streams to the waste stream is prohibited.
The PDOSDB is an additional feature to the superstructure originally proposed by El-Halwagi (1992). It was added to clearly illustrate several scenarios which are possible in the regenerator network:
1) Direct transfer of water from the freshwater stream and feed streams to the outlet lean and streams, provided they meet the concentration requirements of the outlet streams.
2) Transfer of water to the NFSDB without being pressurized or depressurized, provided they are at the same pressure as the pressure required in the outlet streams.
3) Transfer of pressurized or depressurized water to the outlet streams without passing through the NFMB again, provided they meet the concentration requirements of the outlet streams.
The superstructure has also been modified to show that a stream in the PDMB can either undergo pressurization or depressurization, but not both. This constraint was present in the model formulated by El-Halwagi (1992). However, it was not explicitly visible on the superstructure. Additionally, the pressurization and depressurization nodes previously contained in a common set N have been separated into a set for pumping nodes, NP, and a set of turbine nodes, NT, respectively. This removes ambiguity and negates the need for a constraint that prohibits direct pressurization after depressurization and vice versa.
Material Balances
Material balances are implemented around every unit, mixing point, and splitting point to ensure the conservation of mass. In addition to the overall material balance, component balances are also employed for each contaminant. The general forms of the material and contaminant balances are shown in Eqs 1, 2 respectively, Specific equations for each stream are provided in the Supplementary Material. For each balance, the total inlet flowrate must equal the total outlet flowrate. Contaminant flowrates are obtained by multiplying the total flowrate of the stream by the concentration of the contaminant in that stream.
The concentrations of some streams are subject to environmental regulations or design feasibility limits. Constraints in the form shown in Eqs 3, 4 are imposed to ensure that these limits are observed.
The removal ratio,
Pressure Constraints
Pumps can only increase, while turbines can only decrease pressure. This is ensured by Eqs 6, 7.
Streams must mix at equal pressures. This is ensured by constraints of the form shown in Eq. (8), which equate the product of the pressure difference between two mixing streams and the flowrate being added to 0. Where the pressure requirement is violated, the constraint forces the flowrate to become 0. Specific equations for each stream are provided in the Supplementary Material.
Regenerator Model
The permeate flux,
Where:
In the Spiegler-Kedem model, the removal ratio is calculated using the solute rejection coefficient and a dimensionless variable,
The retentate pressure is calculated using the feed pressure and transmembrane pressure drop as shown in Eq. 13. The permeate is assumed to be at atmospheric pressure. The number of modules per regenerator stage depends on the permeate flux and the required permeate flowrate. While it is desirable to minimize the number of modules in order to lower the capital costs of the membrane, this increases the feed pressure required for the same flowrate, thereby raising the operational cost due to energy. It is thus important to optimize this trade-off.
The effective area of a membrane module is calculated using its inner and outer diameters,
The cost of a module per unit area decreases as the size of the module increases. It was thus necessary to develop a correlation to represent this variation, thereby realistically representing the capital cost of the membrane. Eq. 16 shows the correlation obtained by plotting the area of the three most common module sizes (2,540, 4,040 and 400) against their average price in US dollars.
The following equations from the Steric Hindrance Pore model are used to characterize the physical properties of the membrane. The pure water permeability of the membrane is calculated using the Hagen-Poiseuille Eq. 17, where
The steric factors for the diffusion,
The solute permeability,
The reflection coefficient,
Objective Function
The objective function is to minimize the total annualized cost (TAC) of the network, comprising the annualized capital cost, annualized operation costs and annual water cost. The weighting of each component is embedded into the objective function using its associated costing factors. The optimization therefore automatically selects the proportion of each component that ultimately gives the optimal economic benefit.
The annualized capital cost, represented in Eq. 24, incorporates the annualized cost of purchasing membrane modules, pumps, turbines, as well as the installation cost, which is a function of the cost of membrane modules.
The operating costs are inclusive of cleaning and anti-fouling chemicals, repair, maintenance and replacement costs, labor costs, as well as the regenerator network’s energy costs. This is shown in Eq. 25. The energy costs are calculated by multiplying the energy consumption of the pumps and turbines with a cost factor for electricity. Maintenance costs are a function of the annualized capital cost.
The water cost consists of the cost of purchasing freshwater as well as the cost of wastewater disposal, as shown in Eq. 26.
This objective function was formulated with the aim of obtaining a result that provides the most optimal environmental benefit without compromising the profits of the operation, but rather enhancing them by reducing the water cost. This “win-win” approach makes the proposed framework lucrative and easily adoptable because businesses exist to make a profit, and decision-makers tend to only focus on their “bottom line”. There has, however, been a thrust for industries to consider other aspects in addition to the economics, and sometimes adopt strategies that promote such aspects, even when the changes are not economically optimal. In cases where the economics of the operation can be compromised in favor of other competing objectives, the framework can be reformulated into a multi-objective optimization problem by assessing the relative importance of each competing objective and thereafter assigning weighting factors to each objective.
Illustrative Example
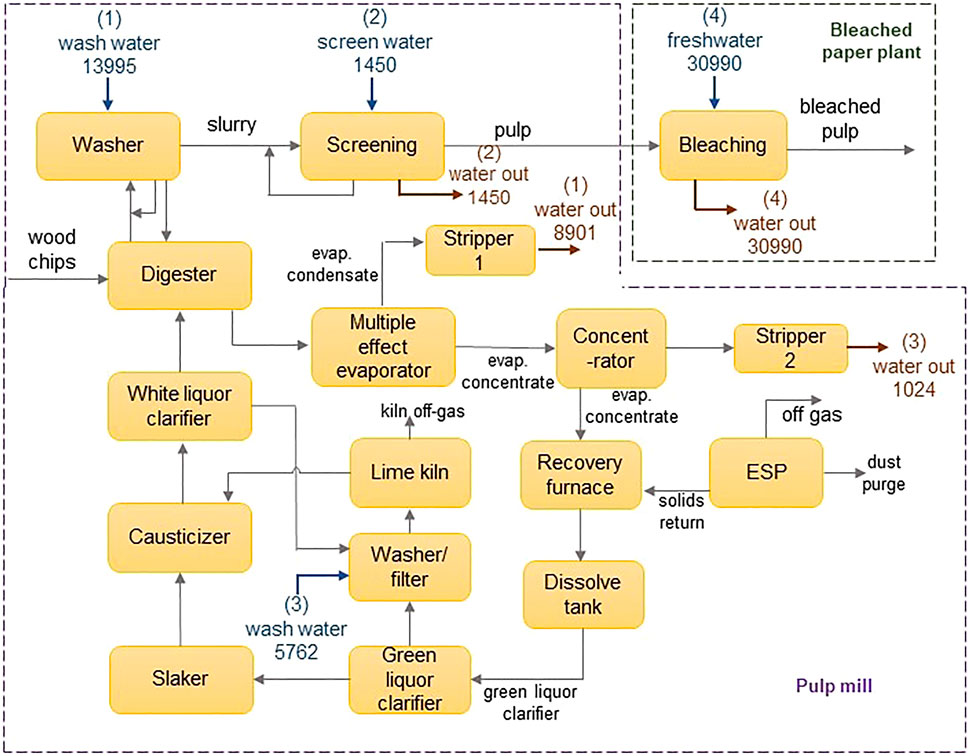
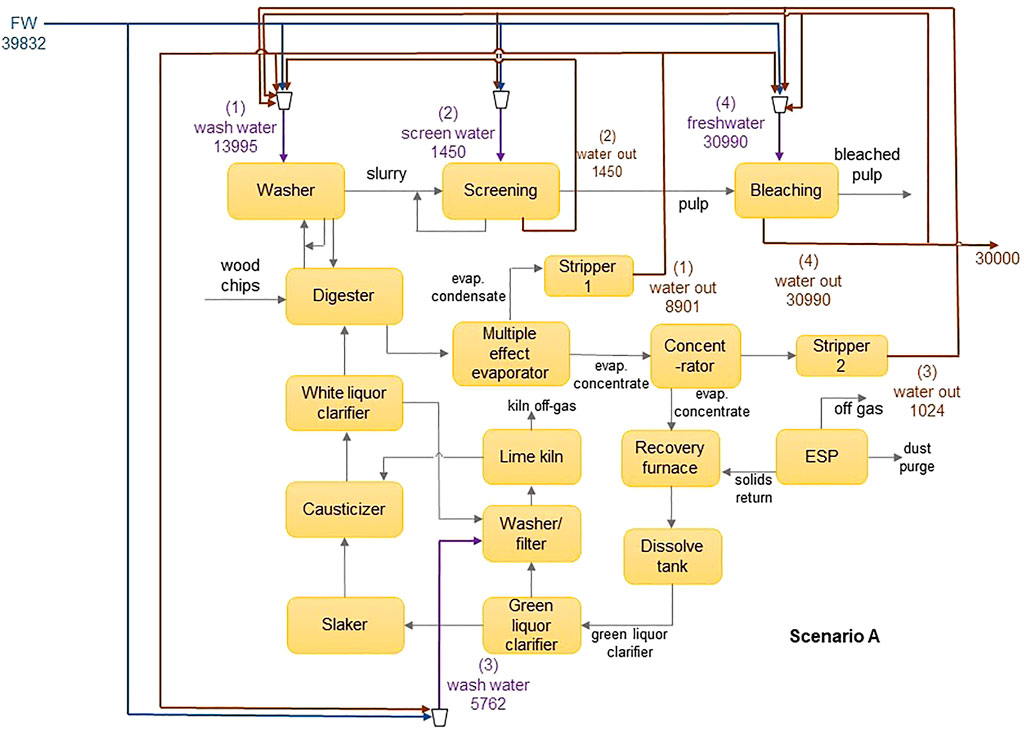
The applicability of the model is demonstrated using an illustrative example adapted from Chew et al. (2008). The water network is comprised of an integrated pulp mill and bleached paper plant, containing four sources and four sinks. The flowsheet of the water network is shown in Figure 3, and data for the sinks and sources are shown in Table 2. The contaminants present are chlorine (Cl−), magnesium (Mg2+) and sodium (Na+) ions. Their diffusivities and Stokes’ radii are shown in Table 3 (Hussain et al., 2006). In the absence of a regenerator network, the water network requires 39,832 m3 h−1 of freshwater and discharges 30,000 m3 h−1 of wastewater. Figure 4 shows the flowsheet for the base case containing no regeneration. While this example includes three contaminants, the fixed-flowrate approach used in the formulation allows the developed framework to be adapted to accommodate any number and type of contaminants in any sector of industry. This flexibility also means that contaminants can be added or removed at any stage of the design process and recalculations made as new information becomes available. This only entails modifying the set of contaminants, introducing the parameters applicable to additional contaminants, and recalculating the result. For example, in the context of the pulp and paper industry used in this illustrative example, it might be useful to also consider organic components, which normally also occur in the waste streams of this type of operation. In such a case, the properties of these solutes would need to be determined experimentally or otherwise, and thereafter incorporated into the calculation.
The optimization was performed in GAMS version 34.3.0 using version 21.1.13 of the Branch and Reduce Optimization Navigator (BARON). The criteria for convergence were an absolute gap (optcA) of 1 × 10⁻⁹ and relative optimality (optcR) of 0.1. Where convergence was not reached in 72 h, the best results obtained by that time were reported. Four scenarios were investigated:
• Scenario A: a base case containing no regenerator.
• Scenario B: variable-stage regenerator assuming fixed removal ratio (black box approach).
• Scenario C: variable stage regenerator network containing up to four stages of modules with fixed properties, having a variable removal ratio based on the Spiegler-Kedem model.
• Scenario D: variable stage regenerator network containing up to four stages of modules, having a variable removal ratio based on the Spiegler-Kedem model and variable module properties determined using the Steric Hindrance Pore model.
The following assumptions were made:
1) The plant operates for 8,000 h y−1
2) Isothermal operation at 298 K.
3) The background process effluent and feed streams, as well as the regenerator permeate streams are at atmospheric pressure, 1.013 bar.
4) Fluid is Newtonian and the flow is steady, fully developed, incompressible and laminar, with a constant velocity of 1 ms−1, a viscosity of 0.89 cP and a density of 1 kg m−3.
5) Freshwater has negligible contaminant concentration.
6) Regenerator stages have a liquid recovery of 70%.
7) Pumps and turbines have an efficiency of 70%.
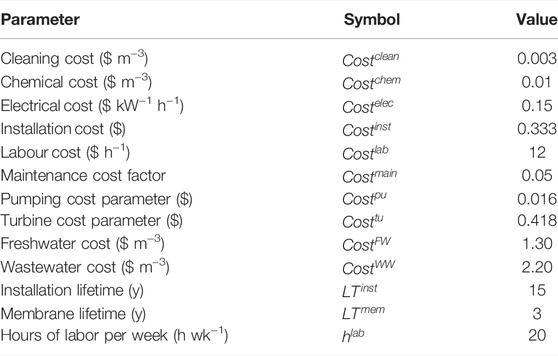
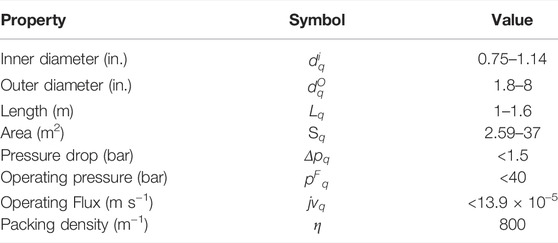
The costing parameters used are shown in Table 4. In scenarios B and C, the Dow FilmTec NF-90 module was assumed. Its properties were obtained from the manufacturer’s specification sheet (Dow Chemicals, 2022) and literature sources (Al-Zoubi and Omar, 2009; Nair et al., 2018). These are shown in Table 5. In scenario D, the ranges used as the lower and upper bounds for the properties of the customized modules were obtained from the datasheets of 76 modules, commercially available from several manufacturers, namely AMS Technologies, DeltaPore, Dow FilmTec ESNA Hydranautics, General Electric, Global Industrial Water, Koch Membrane Systems, Microdyn, Nair, Pentair and Synder. These ranges are shown in Table 6.
Table 7 contains the solution statistics for the four scenarios. It can be noted from the table that the introduction of a regeneration network greatly increases the number of variables and nonlinearity of the problem, which are exacerbated as the level of detail increases. The BARON solver uses the branch and reduce method to narrow down the search space and solve the problem (Tawarmalani and Sahinidis, 2005). Due to the great nonlinearity of the detailed model, it was necessary to provide feasible initial points. The initial points were generated by taking the solution of the previous scenario and assigning corresponding initial values to the newly added variables (e.g., using the solution of scenario B to generate the starting point of scenario C). Furthermore, it was necessary to provide upper and lower bounds for all variables. Reformulation by substitution of intermediary values was used to decompose equations containing multiple non-linear terms. An example is Eq. 12, which was reformulated into Eq. 12a-12c.
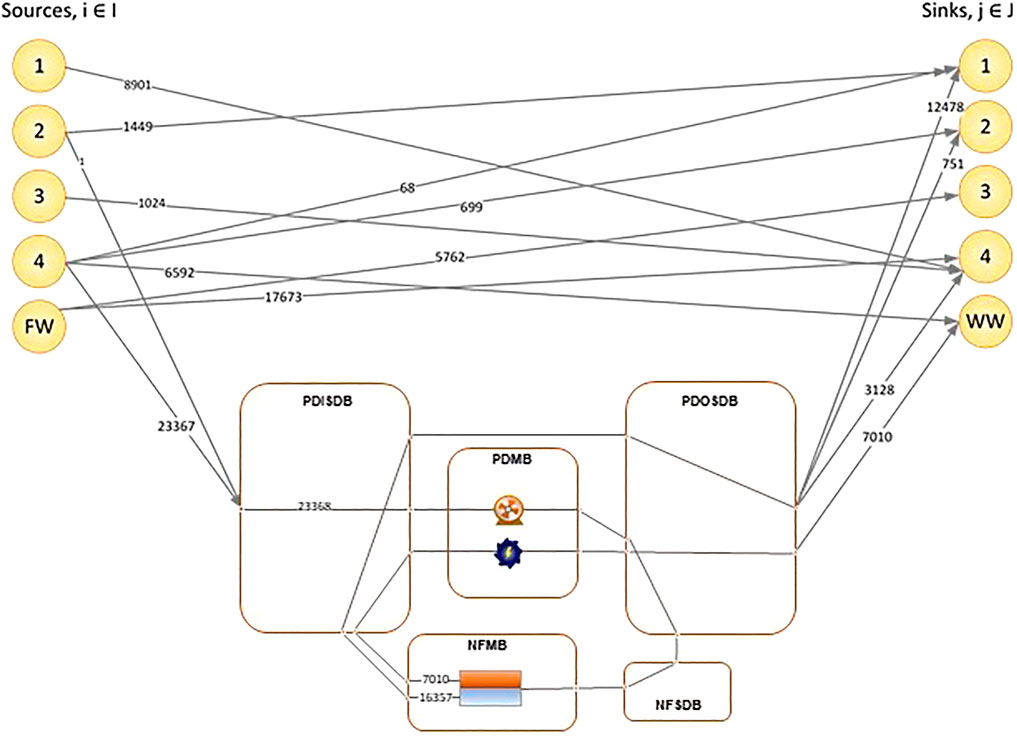
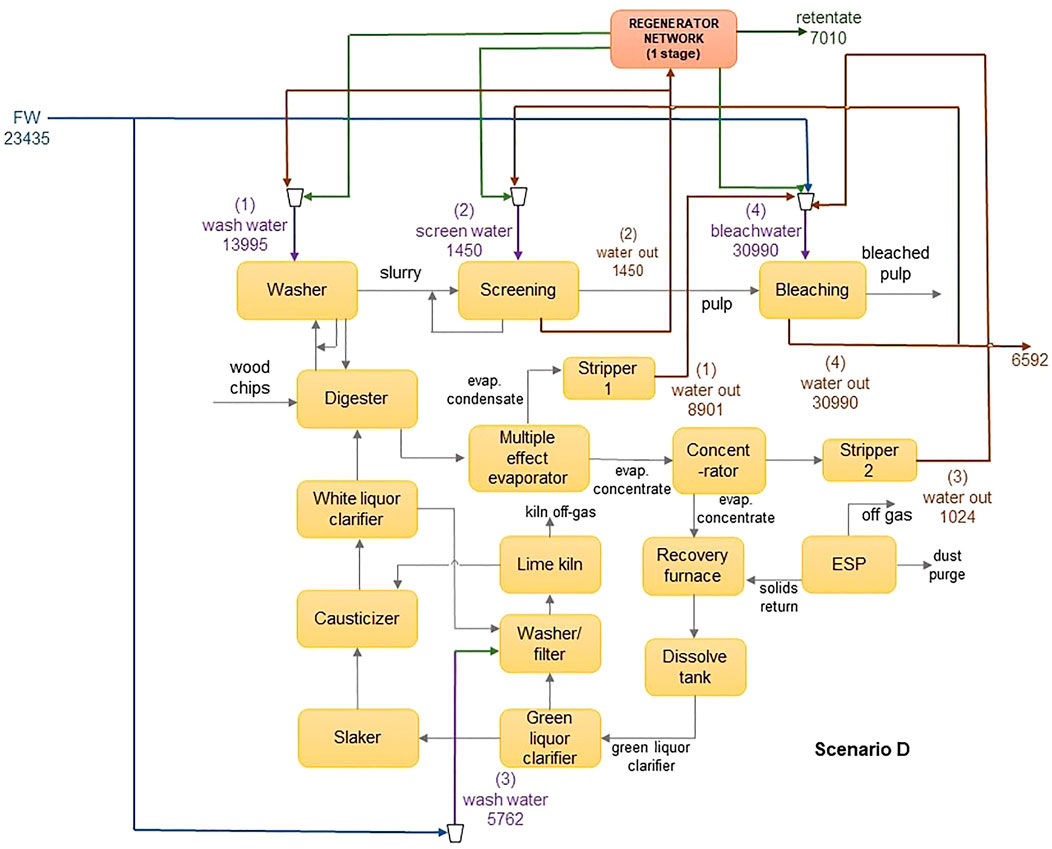
The results obtained from the optimization are shown in Table 8. In all scenarios, it was found that incorporating a regenerator network provided significant opportunities for cost reduction and environmental benefit when compared to just performing recycle and reuse. Figure 5 shows the optimal network for scenario D, and Figure 6 shows the corresponding flowsheet diagram. For scenarios B and C, which used the NF-90 module, the black box model predicted higher freshwater and cost savings when compared to the detailed model. This was an expected result since the black-box approach assumes a fixed removal ratio despite fluctuations in operational conditions such as the feed concentrations, inlet pressure and permeate flux. In reality, these conditions affect the removal ratio. This allows the black-box model to predict better performance at a lower cost when using the same parameters. The accuracy of any black-box model is thus heavily reliant on the quality of the assumptions made, and therefore more prone to error. Similar conclusions have been made in systems containing reverse osmosis (Abass and Majozi, 2016) and electrodialysis regenerators (Nezungai and Majozi, 2016). When a design based on incorrect assumptions is implemented, this can give rise to problems such as performance issues, unnecessarily high capital or operational expenditure and capacity constraints. The use of detailed regeneration models enables a more realistic design process, thereby reducing the risk of over-designing or under-designing. The black-box approach is thus ideal as a preliminary step but must be substituted with more detailed models as the design process progresses.
The model containing customized modules, scenario D resulted in significantly higher cost and water savings when compared to scenarios containing the black-box model (B), and the detailed model with predetermined modules (C). Freshwater reductions of 29 and 31%, as well as cost reductions of 35 and 36%, were obtained when comparing scenario D to scenarios B and C respectively. It was found that the use of customized membrane modules can generate savings of up to 41% on the water consumption and 38% on the total annualized cost of the network. Two major factors that influenced the improvement are the improved removal ratio due to a more suitable membrane, as well as the reduction in the number of modules required.
A high removal ratio increases the quantity and quality of water that is available for reuse and recycle. This has a dual effect on the objective as it increases the number of sinks that can accept undiluted water from the permeate streams, whilst also increasing the permeate stream potency to dilute water from the sources, which would otherwise have been discarded as wastewater. Source 4 is the highest contributor to the wastewater flowrate in this study. Where there is no regenerator, 30,000 m3 of water is sent from source 4 to the wastewater stream. In scenario C, the volume discarded is reduced to 16,522 m3, with 14,292 m3 being sent to the regenerator network. In scenario D however, only 6,592 m3 is discarded, and 23,367 m3 treated in the regenerator network. The product is used to dilute water from sources 2 and 3, allowing them to be fully utilized by the sinks without having to pass through the regenerator.
The bleaching section of a pulp and paper plant is a very sensitive area, and in some cases, water coming out of the departments before bleaching is expressly prohibited from being sent to the bleaching section. In this example, a minuscule amount of each component was allowed into this stream to facilitate the optimal usage of water, while not compromising the quality of the bleaching operation. As a result, most of the water used in the bleaching section was obtained from the freshwater stream in all four scenarios, as high dilution was required to achieve the maximum allowable contaminant concentration. There was, however, a significant reduction in the amount of freshwater directed to this stream after the incorporation of a customized regeneration network since it predicted a permeate of over 99% purity. In scenario A (no regeneration), 86% of water sent to bleaching was freshwater, whereas, in scenario D (containing a customized regeneration network), this amount was significantly reduced to 57%.
17,080 and 10,731 modules were required in scenarios B and C respectively, whereas scenario D only required 1,048 modules. Scenarios B and C required two regenerator stages and had a permeate recycle, therefore more regenerator modules were needed. Permeate recycles and multiple stages are useful when the desired concentration cannot be achieved in a single pass. Permeate recycles reduce the regenerator inlet concentration, thereby reducing concentration polarization. This results in an improvement in the overall removal ratio and product quality. The drawback of permeate recycles or systems containing permeate recycles and multiple stages in series is that they reduce the volume productivity of the regenerator. Another factor that affects the number of modules is the permeate flux. Based on Equation 43, permeate flux is directly proportional to permeate flowrate. This means that operating at a higher flux also reduces the number of modules required.
The number of modules has a significant effect on the annualized capital cost. There is, however, a trade-off between capital costs and operational costs. Whilst lower capital costs also imply lower labor, maintenance and cleaning costs, energy costs form the bulk of the operational costs in a regeneration facility. More energy is required to obtain the increased fluxes and higher removal ratios which enable better performance with lower capital investment. For example, Scenario B, whose capital cost was $6.1 million and an operational cost of $8.1 million, with an energy cost of $4.9 million. On the other hand, scenario D, whose capital cost was only $0.4 million, had a higher operational cost of $9.6 million, with an energy cost of $7.2 million. Furthermore, energy costs only account for 5% of the TAC in scenario B, but they account for 12% of the cost of scenario D. From the results obtained, it can be observed that the trade-off between energy costs, capital costs and water savings is complex. This complexity is further exacerbated by the fact that energy is also currently a finite and scarce resource. In future, multiple-objective optimization using weight factors can be explored to further incorporate these trade-offs into the optimization.
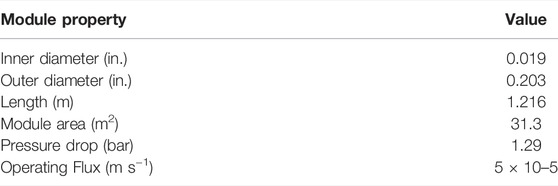
The properties of the module designed by the model in scenario D are shown in Table 9. The membrane has a pore radius of 0.121 nm. This radius allows a removal ratio of 100% to be theoretically achieved for all three contaminants in this system, as the ratio of solute radius to pore radius will be greater than one. Geometrically, the modules have an inner diameter of 0.019 in, outer diameter of 0.203 in, length of 1.216 m and area of 31.3 m2. This is comparable to most “large size” modules that are available in the market. There is a negative correlation between the module sizes and their cost per unit area. It is thus usually prudent to buy larger modules, especially for processes that have a high throughput. Based on a comparison between scenarios C and D, it is apparent that the choice of module has a significant impact on the effectiveness of the regenerator network in reducing costs and making the process more environmentally sustainable. The quality of water from sources, requirements in the sinks, and the nature of contaminants present are key factors when assessing the suitability of a membrane for treating water in a process. There are heuristics available for selecting modules, and salespeople and manufacturers are well versed with the limitations of the various available membranes, as well as the types of water that best suit them. There is, however, room for error in this type of qualitative analysis. The use of models such as the one developed in this study is useful in sense-checking qualitative decisions and providing ideas and opportunities for the development of innovative, process-specific solutions. In a case where multiple regenerator stages are present, the model can predict whether it is beneficial to have the same type and size of module in all stages, or if it would be better to vary the stages as the feed concentrations also vary.
Conclusion
This work addresses the optimal synthesis of multi-stage, multicontaminant nanofiltration regenerator networks for application in water minimization. The resultant MINLP formulation was applied to an illustrative example and solved using the BARON solver. It was found that optimally designed regenerator networks have the potential to reduce the environmental impact of a chemical process, whilst also providing significant economic benefits. The study found that it is important to ensure that the model used for regeneration is as representative of the actual process as possible, as this significantly affects the accuracy of equipment sizing and cost estimates. In future, this work can be expanded to incorporate multiple types of regenerators.
Data Availability Statement
The original contributions presented in the study are included in the article/Supplementary Material, further inquiries can be directed to the corresponding author.
Author Contributions
NJ—Research and write up of the manuscript. TM—Conceptualization, supervision.
Funding
This work was funded by the National Research Foundation (NRF), South Africa under the NRF/DST Chair in Sustainable Process Engineering at the University of the Witwatersrand, South Africa (grant number 47440).
Conflict of Interest
The authors declare that the research was conducted in the absence of any commercial or financial relationships that could be construed as a potential conflict of interest.
Publisher’s Note
All claims expressed in this article are solely those of the authors and do not necessarily represent those of their affiliated organizations, or those of the publisher, the editors and the reviewers. Any product that may be evaluated in this article, or claim that may be made by its manufacturer, is not guaranteed or endorsed by the publisher.
Acknowledgments
The authors would like to thank the National Research Foundation (NRF), South Africa for funding this work under the NRF/DST Chair in Sustainable Process Engineering at the University of the Witwatersrand, South Africa.
Supplementary Material
The Supplementary Material for this article can be found online at: https://www.frontiersin.org/articles/10.3389/fceng.2022.755467/full#supplementary-material
References
Abass, M., and Majozi, T. (2016). Optimization of Integrated Water and Multiregenerator Membrane Systems. Ind. Eng. Chem. Res. 55, 1995–2007. doi:10.1021/acs.iecr.5b03423
Abejón, R., Belleville, M. P., Sanchez-Marcano, J., Garea, A., and Irabien, A. (2018). Optimal Design of Industrial Scale Continuous Process for Fractionation by Membrane Technologies of Protein Hydrolysate Derived from Fish Wastes. Sep. Purif. Technol. 197, 137–146. doi:10.1016/j.seppur.2017.12.057
Al-Zoubi, H., and Omar, W. (2009). Rejection of Salt Mixtures from High saline by Nanofiltration Membranes. Korean J. Chem. Eng. 26, 799–805. doi:10.1007/s11814-009-0133-7
Alnouri, S. Y., and Linke, P. (2012). A Systematic Approach to Optimal Membrane Network Synthesis for Seawater Desalination. J. Membr. Sci. 417-418, 96–112. doi:10.1016/j.memsci.2012.06.017
Alnouri, S. Y., and Linke, P. (2014). Optimal Seawater Reverse Osmosis Network Design Considering Product Water boron Specifications. Desalination 345, 112–127. doi:10.1016/j.desal.2014.04.030
Bagheri, M., Roshandel, R., and Shayegan, J. (2018). Optimal Selection of an Integrated Produced Water Treatment System in the Upstream of Oil Industry. Process Saf. Environ. Prot. 117, 67–81. doi:10.1016/j.psep.2018.04.010
Bamufleh, H., Abdelhady, F., Baaqeel, H. M., and El-Halwagi, M. M. (2017). Optimization of Multi-Effect Distillation with Brine Treatment via Membrane Distillation and Process Heat Integration. Desalination 408, 110–118. doi:10.1016/j.desal.2017.01.016
Beril Gönder, Z., Arayici, S., and Barlas, H. (2011). Advanced Treatment of Pulp and Paper Mill Wastewater by Nanofiltration Process: Effects of Operating Conditions on Membrane Fouling. Separat. Purif. Techn. 76, 292–302. doi:10.1016/j.seppur.2010.10.018
Bi, F., Zhao, H., Zhou, Z., Zhang, L., Chen, H., and Gao, C. (2016). Optimal Design of Nanofiltration System for Surface Water Treatment. Chin. J. Chem. Eng. 24, 1674–1679. doi:10.1016/j.cjche.2016.05.012
Bowen, W. R., and Mohammad, A. W. (1998). Characterization and Prediction of Nanofiltration Membrane Performance-A General Assessment. Chem. Eng. Res. Des. 76, 885–893. doi:10.1205/026387698525685
Buonomenna, M. G., and Bae, J. (2015). Organic Solvent Nanofiltration in Pharmaceutical Industry. Separat. Purif. Rev. 44, 157–182. doi:10.1080/15422119.2014.918884
Cassano, A., Conidi, C., and Castro-Muñoz, R. (2019). “Current and Future Applications of Nanofiltration in Food Processing,” in Separation of Functional Molecules in Food by Membrane Technology. Editor C. M. Galanakis. London, United Kingdom: Elsevier Science, 305–348. doi:10.1016/B978-0-12-815056-6.00009-7
Chauhan, V. M., Alnouri, S. Y., Linke, P., and Abdel-Wahab, A. (2016). Synthesis of Integrated Membrane Desalination and Salt Production Networks. Desalination 400, 25–37. doi:10.1016/j.desal.2016.09.010
Chew, I. M. L., Tan, R., Ng, D. K. S., Foo, D. C. Y., Majozi, T., and Gouws, J. (2008). Synthesis of Direct and Indirect Interplant Water Network. Ind. Eng. Chem. Res. 47, 9485–9496. doi:10.1021/ie800072r
Costa, A. R., and de Pinho, M. N. (2006). Performance and Cost Estimation of Nanofiltration for Surface Water Treatment in Drinking Water Production. Desalination 196, 55–65. doi:10.1016/j.desal.2005.08.030
Dow Chemicals (2022). Dow Chemicals FILMTEC NF90-400 Element. Available at: https://www.lenntech.com/Data-sheets/Dow-Filmtec-NF90-400.pdf (Accessed January 9, 2022).
Doyle, S. J., and Smith, R. (1997). Targeting Water Reuse with Multiple Contaminants. Process Saf. Environ. Prot. 75, 181–189. doi:10.1205/095758297529020
Du, Y., Xie, L., Liu, Y., Zhang, S., and Xu, Y. (2015). Optimization of Reverse Osmosis Networks with Split Partial Second Pass Design. Desalination 365, 365–380. doi:10.1016/j.desal.2015.03.019
Edgar, T. F., Himmelblau, D. M., and Lasdon, L. S. (2001). Optimization of Chemical Processes. 2nd ed. Colombia: McGraw-Hill.
El-Halwagi, M. M. (1992). Synthesis of Reverse-Osmosis Networks for Waste Reduction. Aiche J. 38, 1185–1198. doi:10.1002/aic.690380806
Foo, D. C. Y., Kazantzi, V., El-Halwagi, M. M., and Abdul Manan, Z. (2006). Surplus Diagram and cascade Analysis Technique for Targeting Property-Based Material Reuse Network. Chem. Eng. Sci. 61, 2626–2642. doi:10.1016/j.ces.2005.11.010
Galan, B., and Grossmann, I. E. (1998). Optimal Design of Distributed Wastewater Treatment Networks. Ind. Eng. Chem. Res. 37, 4036–4048. doi:10.1021/ie980133h
Gekas, V. (1988). Terminology for Pressure-Driven Membrane Operations. Desalination 68, 77–92. doi:10.1016/0011-9164(88)80045-6
González-Bravo, R., Elsayed, N. A., Ponce-Ortega, J. M., Nápoles-Rivera, F., and El-Halwagi, M. M. (2015). Optimal Design of thermal Membrane Distillation Systems with Heat Integration with Process Plants. Appl. Therm. Eng. 75, 154–166. doi:10.1016/j.applthermaleng.2014.09.009
Gwehenberger, G., and Narodoslawsky, M. (2008). Sustainable Processes-The challenge of the 21st century for Chemical Engineering. Process Saf. Environ. Prot. 86, 321–327. doi:10.1016/j.psep.2008.03.004
Hamiche, A. M., Stambouli, A. B., and Flazi, S. (2016). A Review of the Water-Energy Nexus. Renew. Sustain. Energ. Rev. 65, 319–331. doi:10.1016/j.rser.2016.07.020
Hieminga, G., and Witteveen, J. (2015). Too Little, Too Much. Available at: https://www.ing.com/Newsroom/All-news/Industrialisation-is-putting-the-worlds-water-resources-under-huge-pressure.htm (Accessed June 10, 2021).
Hussain, A. A., Abashar, M. E. E., and Al-Mutaz, I. S. (2006). Effect of Ion Sizes on Separation Characteristics of Nanofiltration Membrane Systems. J. King Saud Univ. - Eng. Sci. 19, 1–18. doi:10.1016/S1018-3639(18)30844-4
Jeżowski, J. (2010). Review of Water Network Design Methods with Literature Annotations. Ind. Eng. Chem. Res. 49, 4475–4516. doi:10.1021/ie901632w
Jye, L. W., and Ismail, A. F. (2017). Nanofiltration Membranes: Synthesis, Characterization, and Applications. Boca Raton, FL: Taylor & Francis Group.
Kedem, O., and Katchalsky, A. (1958). Thermodynamic Analysis of the Permeability of Biological Membranes to Non-electrolytes. Biochim. Biophys. Acta 27, 229–246. doi:10.1016/0006-3002(58)90330-5
Khor, C. S., Chachuat, B., and Shah, N. (2014). Fixed-flowrate Total Water Network Synthesis under Uncertainty with Risk Management. J. Clean. Prod. 77, 79–93. doi:10.1016/j.jclepro.2014.01.023
Khor, C. S., Foo, D. C. Y., El-Halwagi, M. M., Tan, R. R., and Shah, N. (2011). A Superstructure Optimization Approach for Membrane Separation-Based Water Regeneration Network Synthesis with Detailed Nonlinear Mechanistic Reverse Osmosis Model. Ind. Eng. Chem. Res. 50, 13444–13456. doi:10.1021/ie200665g
Koch, K., Sudhoff, D., Kreiß, S., Górak, A., and Kreis, P. (2013). Optimisation-based Design Method for Membrane-Assisted Separation Processes. Chem. Eng. Process. Process Intensification 67, 2–15. doi:10.1016/j.cep.2012.09.013
Koleva, M. N., Styan, C. A., and Papageorgiou, L. G. (2017). Optimisation Approaches for the Synthesis of Water Treatment Plants. Comput. Chem. Eng. 106, 849–871. doi:10.1016/j.compchemeng.2016.12.018
Kuo, W.-C. J., and Smith, R. (1997). Effluent Treatment System Design. Chem. Eng. Sci. 52, 4273–4290. doi:10.1016/S0009-2509(97)00186-3
Lonsdale, H. K., Merten, U., and Tagami, M. (1967). Phenol Transport in Cellulose Acetate Membranes. J. Appl. Polym. Sci. 11, 1807–1820. doi:10.1002/app.1967.070110917
Lu, Y.-Y., Hu, Y.-D., Zhang, X.-L., Wu, L.-Y., and Liu, Q.-Z. (2007). Optimum Design of Reverse Osmosis System under Different Feed Concentration and Product Specification. J. Membr. Sci. 287, 219–229. doi:10.1016/j.memsci.2006.10.037
Mafukidze, N. Y., and Majozi, T. (2016). Synthesis and Optimisation of an Integrated Water and Membrane Network Framework with Multiple Electrodialysis Regenerators. Comput. Chem. Eng. 85, 151–161. doi:10.1016/j.compchemeng.2015.11.005
Mohammad, A. W. (2013). Editorial: Nanofiltration Membranes. Desalination 315, 1. doi:10.1016/j.desal.2013.02.012
Naidu, Y., and Malik, R. K. (2011). A Generalized Methodology for Optimal Configurations of Hybrid Distillation-Pervaporation Processes. Chem. Eng. Res. Des. 89, 1348–1361. doi:10.1016/j.cherd.2011.02.025
Nair, R., Protasova, E., Strand, S., and Bilstad, T. (2018). Implementation of Spiegler-Kedem and Steric Hindrance Pore Models for Analyzing Nanofiltration Membrane Performance for Smart Water Production. Membranes 8, 78. doi:10.3390/membranes8030078
Nakao, S.-I., and Kimura, S. (1982). Models of Membrane Transport Phenomena and Their Applications for Ultrafiltration Data. J. Chem. Eng. Jpn. 15, 200–205. doi:10.1252/jcej.15.200
Nernst, W. (1888). Zur Kinetik der in Lösung befindlichen Körper. Z. Für Phys. Chem. 2U, 613–637. doi:10.1515/zpch-1888-0274
Nezungai, C. D., and Majozi, T. (2016). Optimum Synthesis of an Electrodialysis Framework with a Background Process-I: A Novel Electrodialysis Model. Chem. Eng. Sci. 147, 180–188. doi:10.1016/j.ces.2016.03.032
Oke, D., Majozi, T., Mukherjee, R., Sengupta, D., and El-Halwagi, M. (2018). Simultaneous Energy and Water Optimisation in Shale Exploration. Processes 6, 86. doi:10.3390/pr6070086
Planck, M. (1890). Ueber die Erregung von Electricität und Wärme in Electrolyten. Ann. Phys. Chem. 275, 161–186. doi:10.1002/andp.18902750202
Sachidananda, M., and Rahimifard, S. (2012). “Reduction of Water Consumption within Manufacturing Applications,” in Leveraging Technology for a Sustainable World (Heidelberg: Springer Science & Business Media), 455–460. doi:10.1007/978-3-642-29069-5_77
Santos, B., Crespo, J. G., Santos, M. A., and Velizarov, S. (2016). Oil Refinery Hazardous Effluents Minimization by Membrane Filtration: An On-Site Pilot Plant Study. J. Environ. Manage. 181, 762–769. doi:10.1016/j.jenvman.2016.07.027
See, H. J., See, D. I., Vassiliadis, V. S., and Parks, G. T. (2004). Design of Reverse Osmosis (RO) Water Treatment Networks Subject to Fouling. Water Sci. Technol. 49, 263–270. doi:10.2166/wst.2004.0139
Sethi, S., and Wiesner, M. R. (2000). Simulated Cost Comparisons of Hollow-Fiber and Integrated Nanofiltration Configurations. Water Res. 34, 2589–2597. doi:10.1016/S0043-1354(00)00017-8
Shahmansouri, A., and Bellona, C. (2015). Nanofiltration Technology in Water Treatment and Reuse: Applications and Costs. Water Sci. Technol. 71, 309–319. doi:10.2166/wst.2015.015
Snyman, J. (2005). Practical Mathematical Optimisation: An Introduction to Basic Optimisation Theory and Classical and New Gradient-Based Algorithms. New York: Springer Science & Business Media.
Sourirajan, S. (1963). Mechanism of Demineralization of Aqueous Sodium Chloride Solutions by Flow, under Pressure, through Porous Membranes. Ind. Eng. Chem. Fund. 2, 51–55. doi:10.1021/i160005a010
Spiegler, K. S., and Kedem, O. (1966). Thermodynamics of Hyperfiltration (Reverse Osmosis): Criteria for Efficient Membranes. Desalination 1, 311–326. doi:10.1016/s0011-9164(00)80018-1
Suárez, A., and Riera, F. A. (2016). Using the Spiegler-Kedem Model to Predict Solute Rejection in the Treatment of Industrial UHT Condensates by Reverse Osmosis. Desalination Water Treat. 57, 24176–24186. doi:10.1080/19443994.2016.1140083
Takama, N., Kuriyama, T., Shiroko, K., and Umeda, T. (1980). Optimal Water Allocation in a Petroleum Refinery. Comput. Chem. Eng. 4, 251–258. doi:10.1016/0098-1354(80)85005-8
Tawarmalani, M., and Sahinidis, N. V. (2005). A Polyhedral branch-and-cut Approach to Global Optimization. Math. Program 103, 225–249. doi:10.1007/s10107-005-0581-8
Tsiakis, P., and Papageorgiou, L. G. (2005). Optimal Design of an Electrodialysis Brackish Water Desalination Plant. Desalination 173, 173–186. doi:10.1016/j.desal.2004.08.031
Tsuru, T., Nakao, S.-i., and Kimura, S. (1991). Calculation of Ion Rejection by Extended Nernst-Planck Equation with Charged Reverse Osmosis Membranes for Single and Mixed Electrolyte Solutions. J. Chem. Eng. Jpn. 24, 511–517. doi:10.1252/jcej.24.511
Wadley, S., Brouckaert, C. J., Baddock, L. A. D., and Buckley, C. A. (1995). Modelling of Nanofiltration Applied to the Recovery of Salt from Waste Brine at a Sugar Decolourisation Plant. J. Membr. Sci. 102, 163–175. doi:10.1016/0376-7388(94)00284-6
Wahab Mohammad, A., Ali, N. a., Ahmad, A. L., and Hilal, N. (2004). Optimized Nanofiltration Membranes: Relevance to Economic Assessment and Process Performance. Desalination 165, 243–250. doi:10.1016/j.desal.2004.06.028
Wang, Y. P., and Smith, R. (1994). Wastewater Minimisation. Chem. Eng. Sci. 49, 981–1006. doi:10.1016/0009-2509(94)80006-5
Yang, L., Salcedo-Diaz, R., and Grossmann, I. E. (2014). Water Network Optimization with Wastewater Regeneration Models. Ind. Eng. Chem. Res. 53, 17680–17695. doi:10.1021/ie500978h
Yaseen, D. A., and Scholz, M. (2019). Textile Dye Wastewater Characteristics and Constituents of Synthetic Effluents: a Critical Review. Int. J. Environ. Sci. Technol. 16, 1193–1226. doi:10.1007/s13762-018-2130-z
Zhu, Q., Zhang, B., Chen, Q., Pan, M., and He, C. (2017). Optimal Synthesis of Property-Based Wastewater Network with Multiple Regenerators in Coal. -Based Chem. Plants 61, 1807–1812. doi:10.3303/CET1761299
Glossary
Sets:
Parameters:
Variables:
Superscripts:
Keywords: water integration, water networks, water reuse, water recycling, process industry, sustainability
Citation: Jakata N and Majozi T (2022) A Superstructure Based Optimization Approach for Regeneration Reuse of Water Network: Optimal Design of a Detailed Nanofiltration Regenerator Network. Front. Chem. Eng. 4:755467. doi: 10.3389/fceng.2022.755467
Received: 08 August 2021; Accepted: 17 February 2022;
Published: 08 April 2022.
Edited by:
Luciana Savulescu, Canadian Forest Service, CanadaReviewed by:
Zuwei Liao, Zhejiang University, ChinaChun Deng, China University of Petroleum, Beijing, China
Copyright © 2022 Jakata and Majozi. This is an open-access article distributed under the terms of the Creative Commons Attribution License (CC BY). The use, distribution or reproduction in other forums is permitted, provided the original author(s) and the copyright owner(s) are credited and that the original publication in this journal is cited, in accordance with accepted academic practice. No use, distribution or reproduction is permitted which does not comply with these terms.
*Correspondence: Thokozani Majozi, VGhva296YW5pLk1ham96aUB3aXRzLmFjLnph
 Nyasha Jakata
 Thokozani Majozi
