 Anett Kondor
 Alba Santmarti2
 Andreas Mautner
 Daryl Williams
 Koon-Yang Lee
94% of researchers rate our articles as excellent or good
Learn more about the work of our research integrity team to safeguard the quality of each article we publish.
Find out more
ORIGINAL RESEARCH article
Front. Chem. Eng., 14 September 2021
Sec. Chemical Reaction Engineering
Volume 3 - 2021 | https://doi.org/10.3389/fceng.2021.738995
This article is part of the Research TopicEmerging Cellulosic Materials: Characterization of Structure and PropertiesView all 7 articles
Volumetric N2 adsorption at −196°C is generally accepted as “gold standard” for estimating the Brunauer-Emmet-Teller (BET) surface area of nanocellulose. It is unclear however, whether the BET surface area of nanocellulose obtained at such low temperatures and pressures is meaningful at an absolute sense, as nanocellulose is used at ambient temperature and pressure. In this work, a systematic evaluation of the BET surface area of nanocellulose using highly crystalline bacterial cellulose (BC) as model nanocellulose was undertaken to achieve a comprehensive understanding of the limitations of BET method for nanocellulose. BET surface area obtained using volumetric N2 adsorption at −196°C was compared with the BET surface area acquired from gravimetric experiments based on n-octane adsorption using dynamic vapour sorption (DVS) and n-octane adsorption determined by inverse gas chromatography (iGC), both at 25°C. It was found that the BET surface area calculated from volumetric N2 adsorption data was 25% lower than that of n-octane adsorption at 25°C obtained using DVS and iGC adsorption methods. These results supported the hypothesis that the BET surface area of nanocellulose is both a molecular scale (N2vs n-octane, molecular cross section of 0.162 nm2vs 0.646 nm2) and temperature (−196°C vs 25°C) dependent property. This study also demonstrates the importance of selecting appropriate BET pressure range based on established criteria and would suggest that room temperature measurement is more relevant for many nanocellulose applications.
Over the last decade, cellulose fibres with lateral width and thickness in the nanometre range, more commonly known as nanocellulose, have emerged as an exciting class of bio-based materials with the potential of making a significant impact in a plethora of applications, including water purification (Voisin et al., 2017; Abouzeid et al., 2019; Wang, 2019), sustainable packaging (Li et al., 2015; Ferrer et al., 2017; Hubbe et al., 2017), substrate for printed electronics (Hoeng et al., 2016) (bio)sensing technologies (Golmohammadi et al., 2017) and nano-reinforcement for polymers (Lee et al., 2014a). The motivation behind the utilisation of nanocellulose as building block for advanced materials stems from the fact that nanocellulose combines the chemical modification capacity of cellulose molecules with the physical properties of cellulose crystals, such as high stiffness and strength, as well as the key features of a nanomaterial, such as high specific surface energy and surface area (Klemm et al., 2011). Despite its similarity to cellulose pulp both chemically and crystallographically, the main defining characteristic that differentiates nanocellulose from micrometre-sized cellulose pulp is its surface area.
Nanocellulose is reported to possess a surface area typically >30 m2g−1 (Mautner et al., 2018), depending on the type of nanocellulose (i.e., biological origin and production method) and drying route used (free, supercritical or freeze-drying). In contrast, cellulose pulp has a surface area of only ∼2 m2 g−1 (Fortea-Verdejo et al., 2016). This specific attribute of nanocellulose opens new applications that cannot be achieved with pulp fibres. The high surface area of nanocellulose leads to large number of contact points between adjacent fibres, which in turn gives rise to cellulose nanopaper with superior mechanical properties over conventional paper (Mao et al., 2017; Kontturi et al., 2021) that can be used as two-dimensional reinforcement for polymers (Santmarti et al., 2019; Santmarti et al., 2020). The high surface area of nanocellulose also leads to higher coverage of micrometre-sized natural or waste fibres, binding them into robust and rigid fibreboards (Lee et al., 2014b; Fortea-Verdejo et al., 2016; Vilchez et al., 2020). Therefore, the reliable characterisation of the surface area of nanocellulose is important for the future development of nanocellulose-based advanced materials.
Surface area is commonly reported as Brunauer, Emmett and Teller (BET) surface area calculated by applying the BET theory (Brunauer et al., 1938) (see Equation 1) typically to the adsorption isotherm of N2 determined at −196°C.
Whilst this method is described in an ISO standard developed for the characterisation of porous inorganic materials, it has become a convenient and commonly used method for the surface area determination of all materials. It is unclear whether N2 adsorption at cryogenic temperatures under vacuum is meaningful in an absolute sense, as well as being a relevant measure for real-world applications of nanocellulose. When used for water (Mautner et al., 2015) and air (Nemoto et al., 2015) filtrations for example, nanocellulose is typically employed at room temperature and up to 10 bar of pressure. In addition to this, BET surface area obtained from N2 adsorption at cryogenic temperature is calibrated against the surface area of inorganic materials, such as silica and alumina at room temperature (see Annex B of BS ISO 9277:2010 for the list of certified BET reference materials). Consequently, the BET surface area calculated for an organic material based on N2 adsorption at cryogenic temperature may be erroneous. In fact, a recent study (Minelli et al., 2019) has shown that the adsorption behaviour of N2, Ar and CO2 on a high free volume glassy polymer, whereby the voids between the polymer chains can hardly be observed beyond the molecular scale, is different between cryogenic and ambient temperatures.
Given the exponential increase in the number of publications focussing on the design of nanocellulose-enhanced advanced materials based on its high specific surface area, a critical evaluation of the use of N2 adsorption at cryogenic temperature, as applied to estimating the surface area of nanocellulose, is thus needed. In this context, nanocellulose synthesised by cellulose producing Komagataeibacter, more commonly known as bacterial cellulose (BC), offers the possibility to test the applicability of N2 adsorption for the surface area determination of nanocellulose. BC is an ideal nanocellulose model as it is a highly crystalline and ultrapure form of cellulose without hemicellulose or traces of lignin that are often present in wood-derived nanocellulose (Florea et al., 2016), which could complicate the delineation of BET surface area from chemical heterogeneity of the material. In this work, a comparison of the surface areas of BC extracted from volumetric N2 adsorption isotherms determined at −196°C with n-octane adsorption at 25°C measured gravimetrically using dynamic vapour sorption (DVS), as well as inverse gas chromatography (iGC) methods are reported.
N2 (purity ≥99.95%) was purchased from BOC (Morden, United Kingdom) and used as the adsorbent for volumetric N2 adsorption/desorption measurement, as well as carrier gas for iGC and DVS experiments. n-Octane (purity ≥99.97%) was purchased from Sigma-Aldrich (Dorset, United Kingdom) and used as the adsorbent for iGC and DVS. Sodium hydroxide pellets (AnalaR NORMAPUR®, purity ≥98.5%) were purchased from VWR International Ltd (Leicestershire, United Kingdom). These chemicals were used as received without further purification. BC was purchased from a commercial retailer (Vietcoco International Co. Ltd., Ho Chi Minh City, Vietnam).
The purification of BC was performed following a previously described protocol (Santmarti et al., 2020). Briefly, the as-received BC (ca. 175 g, wet basis) was first suspended in 4 L of deionised water and heated to 80°C under magnetic stirring. To this suspension, 16 g of NaOH pellets were added to form a 0.1 N NaOH solution and the BC was left to stir in this suspension for 2 h at 80°C to remove any soluble polysaccharides or remaining microorganisms. The purified BC was then left to cool to ambient temperature prior to rinsing it with deionised water until neutral pH was obtained. The BC suspension was then blended (Breville BVL065) at a concentration of 1 g L−1 for 4 min to form a homogenous BC-in-water suspension and freeze-dried (Alpha 1–2 LDplus, Martin Christ, Osterode, DE) prior to subsequent use.
N2 adsorption/desorption isotherms of BC at −196°C were obtained using TriStar II 3020 (Micrometrics Ltd., Aachen, DE). Prior to the measurement, the freeze-dried BC sample was degassed (Flow prep 06, Micromeritics, Aachen, DE) at 120°C for 24 h in continuous dry N2 flow to remove any adsorbed water molecules. A freeze-dried BC sample mass of 15 mg was used for this measurement.
DVS was used to quantify the n-octane adsorption/desorption isotherms of BC. This measurement was carried out using DVS Resolution (Surface Measurement Systems Ltd., Alperton, United Kingdom). For consistency between different surface area measuring methods, N2 was used as the carrier gas. Approximately 4 mg of freeze-dried BC was placed in the sample chamber and dried in-situ at 120°C for 24 h in continuous dry N2 flow. The sample was then pre-conditioned at 0% partial pressure (
The n-octane adsorption isotherm of BC was also evaluated using iGC (iGC-SEA, Surface Measurement Systems Ltd., Alperton, United Kingdom). Approximately 6 mg of freeze-dried BC was packed into a glass column with internal and external diameters of 4 and 6 mm, respectively. Prior to the measurement, the sample was conditioned at 120°C under continuous dry N2 flow for 24 h to remove any residual moisture. n-Octane was then injected at different
Figure 1 presents the volumetric N2 adsorption-desorption isotherms of freeze-dried BC determined at −196°C. The measurements were repeated thrice to investigate the reproducibility of the N2 adsorption-desorption data. The first adsorption-desorption run presented in Figure 1A corresponds to the N2 adsorption-desorption isotherms of BC immediately after the degassing step. Figures 1B,C show the N2 adsorption-desorption isotherms of BC immediately after the first and second adsorption-desorption runs, respectively, without removing the BC specimen from the measuring chamber. It can be seen from these figures that the N2 adsorption-desorption isotherms of BC are Type IVa, characterised by a reversible Type II isotherm, followed by a capillary condensation with hysteresis. The adsorption-desorption isotherms are also identical, implying that prolonged exposure to cryogenic temperature does not alter the adsorption behaviour of BC. This observation is consistent with the highly crystalline nature of BC, with a measured degree of crystallinity of 90% (Santmarti and Lee, 2018), as well as the low thermal expansion coefficient of only 0.1 ppm °C−1 (Yano et al., 2005).
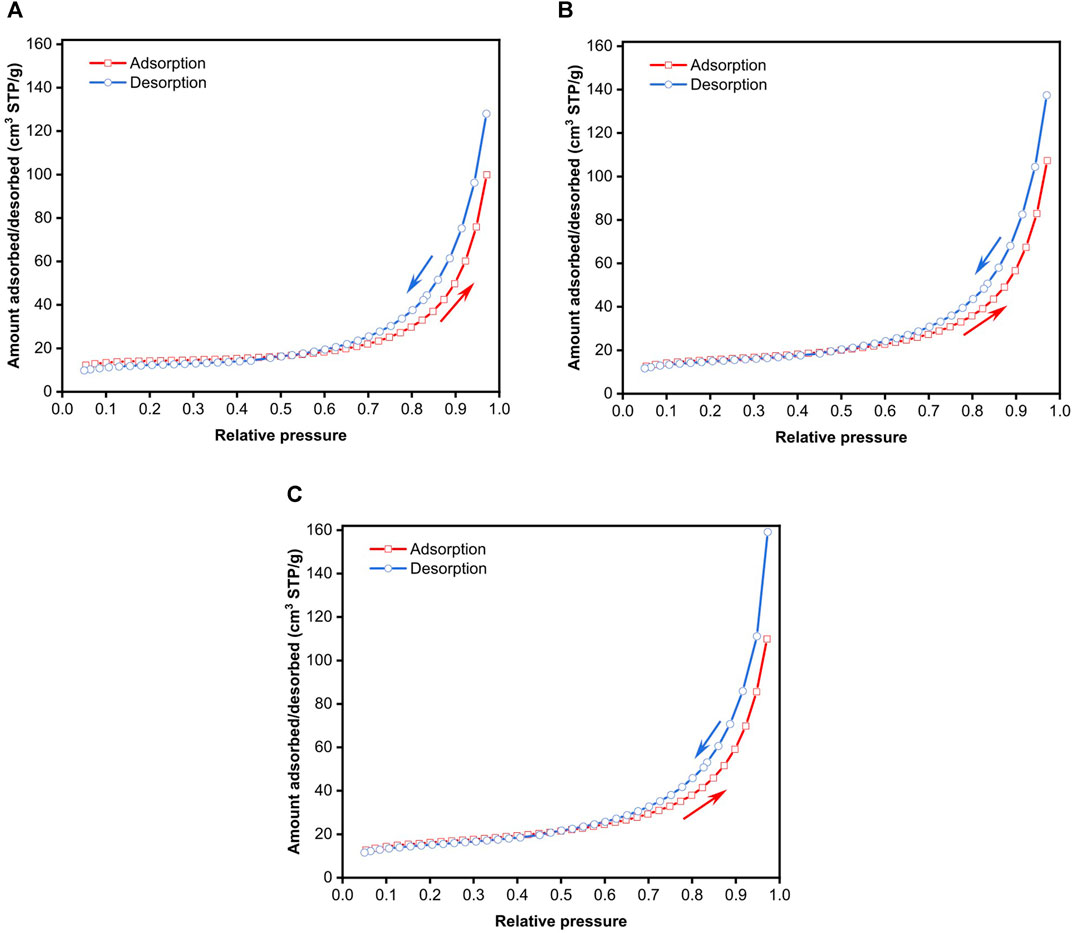
FIGURE 1. N2 adsorption-desorption isotherms of freeze-dried BC based on the (A) first adsorption-desorption run immediately after degassing, (B) second adsorption-desorption immediately after the first run and (C) third adsorption-desorption run immediately after the second run.
The BET plots from the various adsorption-desorption runs are presented in Figures 2A–C. By default, BET analysis is usually performed over the range of 0.05 ≤ P/Po ≤ 0.35, with the implicit assumption that a monolayer is formed is within this relative pressure range without the consideration of the type of material used. The BET surface area from the various N2 adsorption-desorption runs calculated from this default range, marked by the green dashed line in Figure 2, is tabulated in Table 1. The three adsorption-desorption runs of the same BC specimen yielded different BET surface areas, with a variation of up to 25% between the repeated measurements. More importantly, the
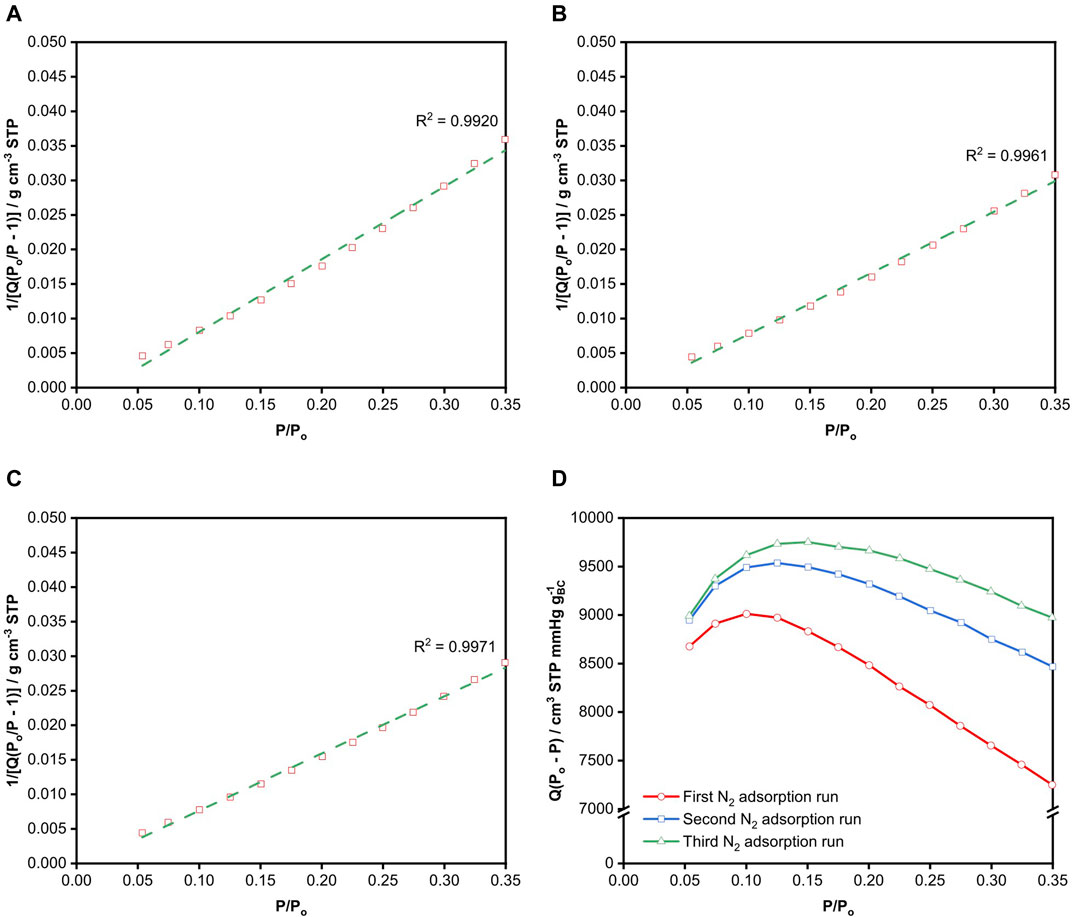
FIGURE 2. BET plots of freeze-dried BC obtained from the (A) first, (B) second and (C) third N2 adsorption runs. The dotted green lines correspond to the linear fit of the data within the BET range of 0.05 ≤
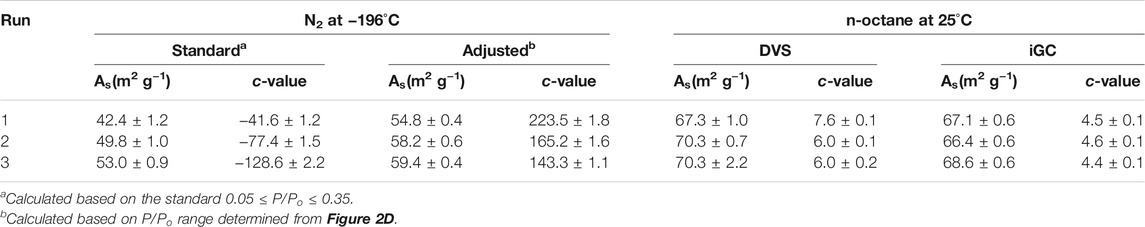
TABLE 1. BET surface area (As) of freeze-dried BC calculated from various adsorption runs.
Figure 3A shows a typical example of the dynamic n-octane adsorption-desorption on freeze-dried BC. As the measurement was run in
FIGURE 3. n-Octane adsorption-desorption isotherms on freeze-dried BC measured using DVS. (A) Experimental mass change as a function of time due to n-octane adsorption-desorption, (B) first adsorption-desorption run immediately after pre-conditioning, (C) second adsorption-desorption immediately after the first run and (D) third adsorption-desorption run immediately after the second run.
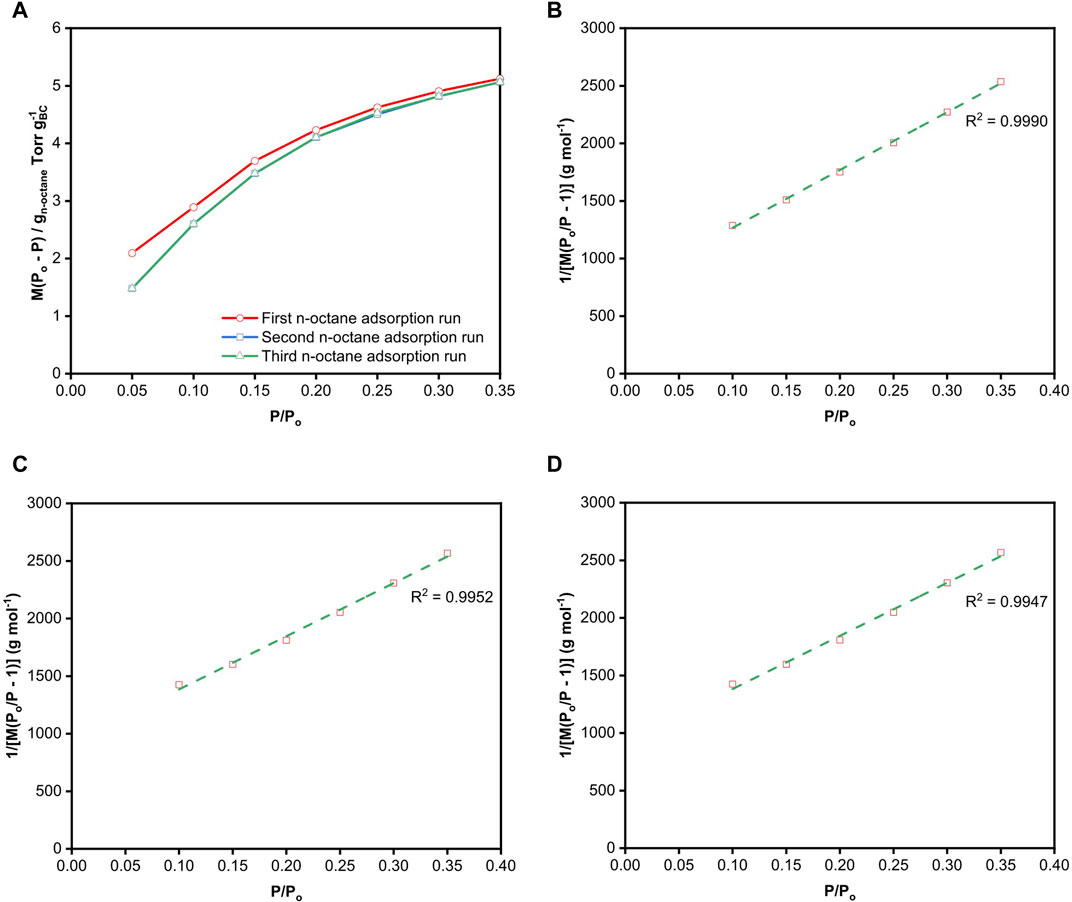
FIGURE 4. (A)
Since alkanes are non-spherical molecules, the correct choice of the cross-sectional area of n-octane depends on its orientation. One can readily envisage the existence of different conformations of n-octane adsorbing on BC, which depends on the strength and number of interfacial interactions. The cross-sectional area of n-octane used in the calculation of surface area was 0.646 nm2, which was determined by McClellan and Harnsberger (1967) as the average surface area of n-octane obtained from BET measurements of different solid surfaces. Table 1 summarises the BET surface areas of freeze-dried BC obtained gravimetrically via the various n-octane adsorption runs at 25°C. Their respective BET plots are presented in Figures 4B–D. A BET range of 0.10
IGC was also employed to evaluate the BET surface area of BC. Due to the nature of this experimental technique, whereby n-octane molecules are injected into the iGC column and the retention volume of these molecules measured when they desorb, only an adsorption isotherm can be generated. Figure 5A shows the adsorption isotherm of n-octane on freeze-dried BC immediately after the initial pre-conditioning step at 120°C for 24 h. The isotherms presented in Figures 5B,C correspond to measurements conducted immediately after the first and second adsorption runs, respectively. All adsorption isotherms are identical. Similar to the n-octane adsorption isotherm obtained using DVS, no identifiable “knee” was observed on the isotherm obtained by iGC. We also plotted
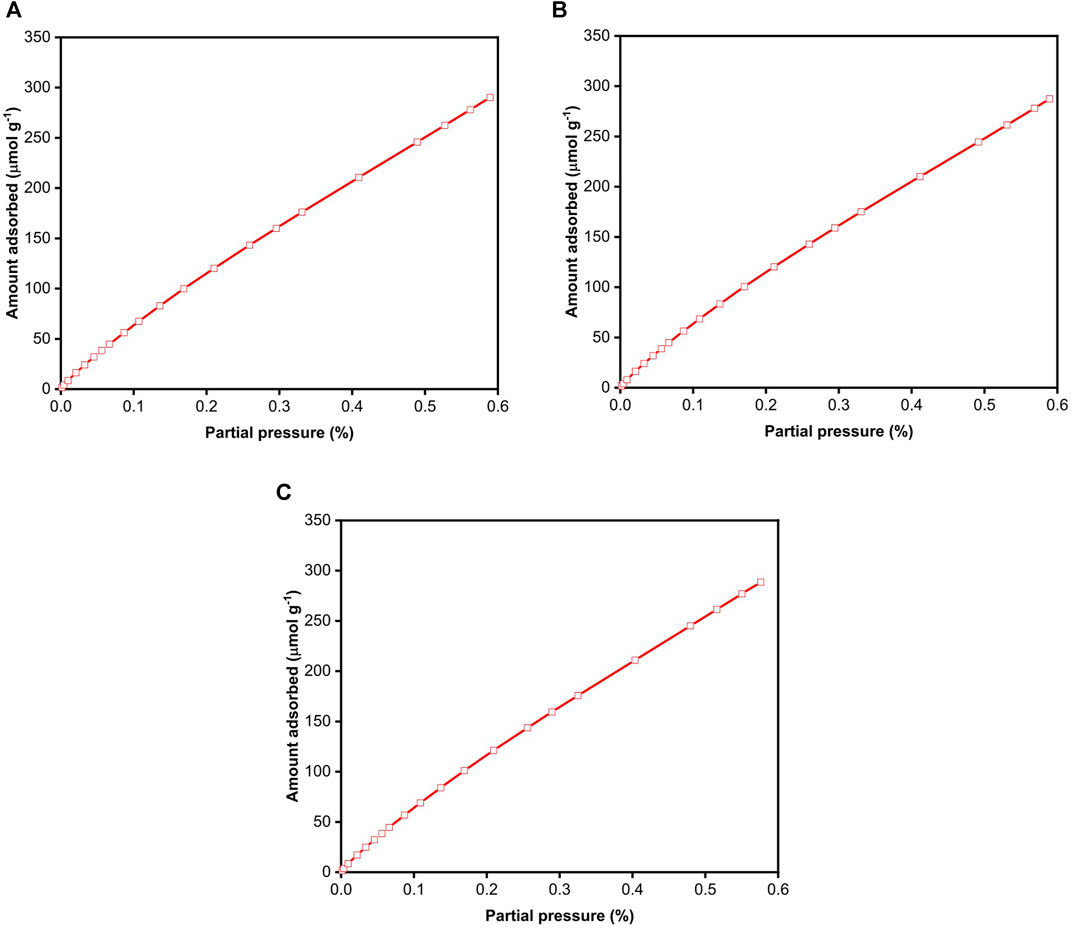
FIGURE 5. n-Octane adsorption isotherms on freeze-dried BC measured using iGC. (A) First adsorption-desorption run immediately after pre-conditioning, (B) second adsorption-desorption immediately after the first run and (C) third adsorption-desorption run immediately after the second run.
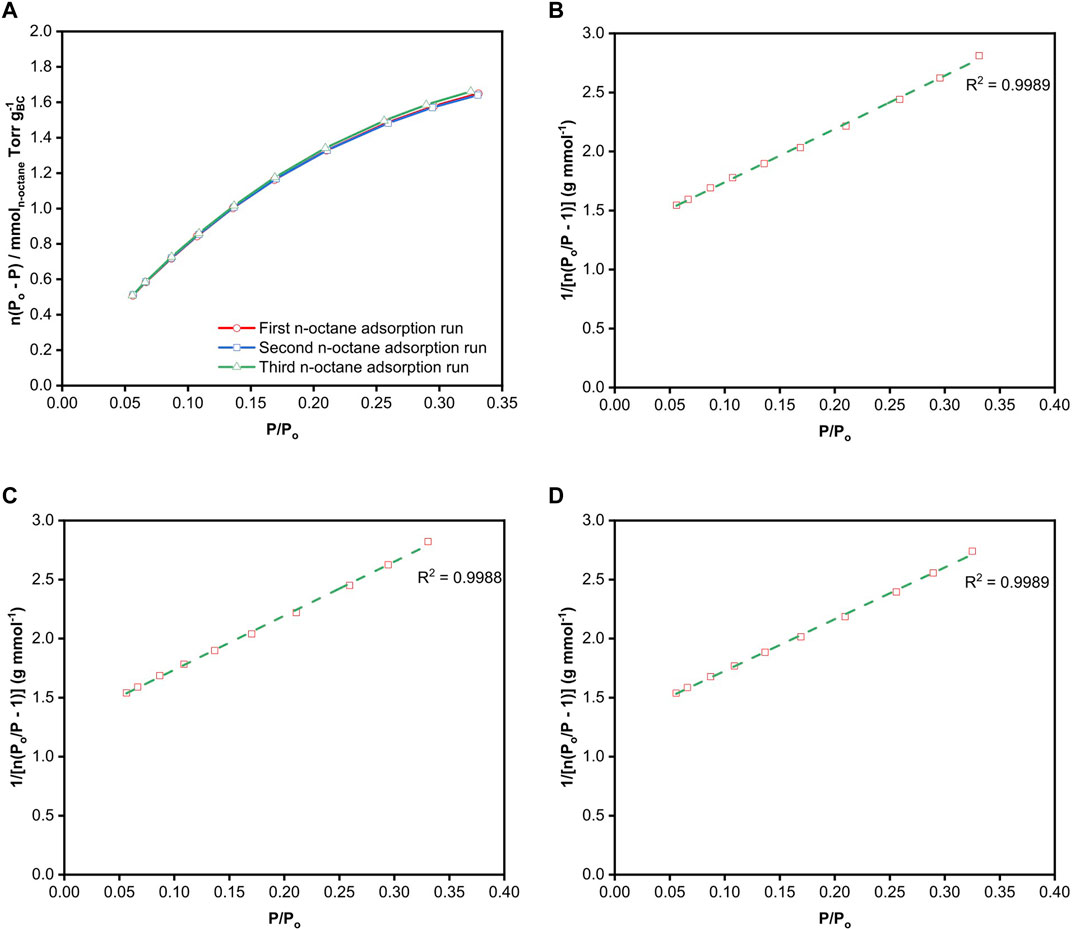
FIGURE 6. (A)
The results presented in this work show that the surface area of freeze-dried BC evaluated at 25°C based on n-octane adsorption using both gravimetric and inverse gas chromatography methods is 25% higher than that of volumetric N2 adsorption performed at −196°C. This discrepancy is attributed to the poor N2 adsorption on BC at −196°C as evident from its
In addition, the geometric surface area of BC has been estimated to compare with the experimental values reported in this work. It is generally accepted that BC is first extruded as an elementary fibril with a thickness of 1.5 nm through the BcsC subunits of the cell into the surrounding environment (Haigler et al., 1982). Several of these elementary fibrils then aggregate into a microfibril outside of the cell. The thickness of a BC microfibril at this stage is estimated to be between 3 and 12 nm (White and Brown, 1981; Nicolas et al., 2021). These microfibrils are then stacked together, forming the BC ribbons that are typically used. The rate at which these ribbons are produced has been estimated to be 2 μm min−1 (Brown et al., 1976). The width of a BC ribbon depends on the strain of the cellulose-producing bacteria and growth condition (Brown et al., 1976; Haigler et al., 1982) but generally, they are within the range of 30 and 130 nm (Brown et al., 1976; Haigler et al., 1982; Tokoh et al., 1998; Nicolas et al., 2021). The thickness of a BC ribbon has been reported to be 15 ± 7 nm (Nicolas et al., 2021). Assuming that BC ribbon is an idealised rectangular slab and factoring in the variations in both thickness and width, the geometric surface area of BC is estimated to be within the range of 66–196 m2 g−1. Therefore, the room temperature BET surface area reported here are at the lower end of this expected surface area range.
An important consideration when measuring the surface area of any material, along with its accuracy, is the speed of measurement. Excluding the degassing/drying of BC at 120°C for 24 h prior to the measurement, the time taken for each volumetric N2 adsorption/desorption run was 4 h. The actual adsorption/desorption process however, occurred over a course of only 3 min but a substantial amount of time was used for system equilibration. Gravimetric n-octane measurements took the longest experimental run time of 9 h per adsorption-desorption experiment due to the time required to establish a
In this work, it has been clearly demonstrated that there is a real and significant difference between the BET surface area of freeze-dried BC measured at −196°C under vacuum using N2 and those obtained at 25°C at ambient pressure with n-octane. The BET surface area of freeze-dried BC calculated from volumetric N2 adsorption at −196°C was ∼55–59 m2g−1 and using gravimetric n-octane adsorption at 25°C was ∼67–70 m2g−1. These results were also independently verified using iGC based on n-octane adsorption at 25°C, which also resulted in a similar BET surface area of ∼67–69 m2g−1. The discrepancy between the volumetric BET surface area using N2 molecules and the gravimetric/chromatographic surface area determined using n-octane molecules stems from the fact that N2 adsorption at cryogenic temperature is hypothesised to cluster only around the high energy sites of BC surfaces, potentially leading to an underestimation of the surface area of BC. This work also implies that the BET surface area of BC, as well as nanocellulose broadly speaking, is both a molecular scale and temperature dependent property. It should also be noted that the BET surface area obtained from all three measurements experimentally are still lower than the ideal geometric surface area of BC ribbons. This study highlights the fact that BET surface area measurement for nanocellulose should ideally be viewed as an expedient ranking tool (at the same temperature using the same adsorbate) as opposed to the viewing the obtained BET surface area as absolute area.
The raw data supporting the conclusion of this article will be made available by the authors, without undue reservation.
AK: Conceptualisation, investigation, validation, writing—review and edit, AS: Resources, writing—review and edit, AM: Investigation, writing—review and edit, DW: Writing—review and edit, supervision, AB: Writing—review and edit, supervision, KYL: Conceptualisation, Writing—review and edit, supervision, funding acquisition.
AK and DW are employed by Surface Measurement Systems Ltd.
The remaining authors declare that the research was conducted in the absence of any commercial or financial relationships that could be construed as a potential conflict of interest.
The handling Editor declared a past co-authorship with the authors AS, KL, AM.
All claims expressed in this article are solely those of the authors and do not necessarily represent those of their affiliated organizations or those of the publisher, the editors, and the reviewers. Any product that may be evaluated in this article, or claim that may be made by its manufacturer, is not guaranteed or endorsed by the publisher.
The authors would like to thank the United Kingdom Engineering and Physical Science Research Council (EP/M012247/1 and EP/N026489/1) for funding this work and Imperial College London for funding AS.
Abouzeid, R. E., Khiari, R., El-Wakil, N., and Dufresne, A. (2019). Current State and New Trends in the Use of Cellulose Nanomaterials for Wastewater Treatment. Biomacromolecules 20, 573–597. doi:10.1021/acs.biomac.8b00839
Ambroz, F., Macdonald, T. J., Martis, V., and Parkin, I. P. (2018). Evaluation of the BET Theory for the Characterization of Meso and Microporous MOFs. Small Methods 2, 1800173. doi:10.1002/smtd.201800173
Brown, R. M., Willison, J. H., and Richardson, C. L. (1976). Cellulose biosynthesis in Acetobacter xylinum: visualization of the site of synthesis and direct measurement of the in vivo process. Proc. Natl. Acad. Sci. United States America 73, 4565–4569. doi:10.1073/pnas.73.12.4565
Brunauer, S., Emmett, P. H., and Teller, E. (1938). Adsorption of Gases in Multimolecular Layers. J. Am. Chem. Soc. 60, 309–319. doi:10.1021/ja01269a023
Ferrer, A., Pal, L., and Hubbe, M. (2017). Nanocellulose in packaging: Advances in barrier layer technologies. Ind. Crops Prod. 95, 574–582. doi:10.1016/j.indcrop.2016.11.012
Florea, M., Hagemann, H., Santosa, G., Abbott, J., Micklem, C. N., Spencer-Milnes, X., et al. (2016). Engineering control of bacterial cellulose production using a genetic toolkit and a new celluloseproducing strain. Proc. Natl. Acad. Sci. United States America 113, E3431–E3440. doi:10.1073/pnas.1522985113
Fortea-Verdejo, M., Lee, K.-Y., Zimmermann, T., and Bismarck, A. (2016). Upgrading flax nonwovens: Nanocellulose as binder to produce rigid and robust flax fibre preforms. Composites A: Appl. Sci. Manufacturing 83, 63–71. doi:10.1016/j.compositesa.2015.11.021
Golmohammadi, H., Morales-Narváez, E., Naghdi, T., and Merkoçi, A. (2017). Nanocellulose in Sensing and Biosensing. Chem. Mater. 29, 5426–5446. doi:10.1021/acs.chemmater.7b01170
Haigler, C. H., White, A. R., Brown, R. M., and Cooper, K. M. (1982). Alteration of in vivo cellulose ribbon assembly by carboxymethylcellulose and other cellulose derivatives. J. Cel Biol. 94, 64–69. doi:10.1083/jcb.94.1.64
Hoeng, F., Denneulin, A., and Bras, J. (2016). Use of nanocellulose in printed electronics: a review. Nanoscale 8, 13131–13154. doi:10.1039/c6nr03054h
Hubbe, M. A., Ferrer, A., Tyagi, P., Yin, Y., Salas, C., Pal, L., et al. (2017). Nanocellulose in thin films, coatings, and plies for packaging applications: A review. BioResources 12, 2143–2233. doi:10.15376/biores.12.1.2143-2233
Klemm, D., Kramer, F., Moritz, S., Lindström, T., Ankerfors, M., Gray, D., et al. (2011). Nanocelluloses: A New Family of Nature-Based Materials. Angew. Chem. Int. Edition 50, 5438–5466. doi:10.1002/anie.201001273
Kontturi, K. S., Lee, K.-Y., Jones, M. P., Sampson, W. W., Bismarck, A., and Kontturi, E. (2021). Influence of biological origin on the tensile properties of cellulose nanopapers. Cellulose 28, 6619–6628. doi:10.1007/s10570-021-03935-2
Lee, K.-Y., Aitomäki, Y., Berglund, L. A., Oksman, K., and Bismarck, A. (2014a). On the use of nanocellulose as reinforcement in polymer matrix composites. Composites Sci. Tech. 105, 15–27. doi:10.1016/j.compscitech.2014.08.032
Lee, K.-Y., Shamsuddin, S. R., Fortea-Verdejo, M., and Bismarck, A. (2014b). Manufacturing of robust natural fiber preforms utilizing bacterial cellulose as binder. J. visualized experiments : JoVE, 51432. doi:10.3791/51432
Li, F., Mascheroni, E., and Piergiovanni, L. (2015). The potential of nanocellulose in the packaging field: A review. Packaging Tech. Sci. 28, 475–508. doi:10.1002/pts.2121
Mao, R., Goutianos, S., Tu, W., Meng, N., Yang, G., Berglund, L. A., et al. (2017). Comparison of fracture properties of cellulose nanopaper, printing paper and buckypaper. J. Mater. Sci. 52, 9508–9519. doi:10.1007/s10853-017-1108-4
Mautner, A., Hakalahti, M., Rissanen, V., and Tammelin, T. (2018). “Crucial Interfacial Features of Nanocellulose Materials,” in Nanocellulose and Sustainability: Production, Properties, Applications and Case Studies. Editor K. Y. Lee (Boca Raton: CRC Press). doi:10.1201/9781351262927-6
Mautner, A., Lee, K.-Y., Tammelin, T., Mathew, A. P., Nedoma, A. J., Li, K., et al. (2015). Cellulose nanopapers as tight aqueous ultra-filtration membranes. Reactive Funct. Polym. 86, 209–214. doi:10.1016/j.reactfunctpolym.2014.09.014
Mcclellan, A. L., and Harnsberger, H. F. (1967). Cross-sectional areas of molecules adsorbed on solid surfaces. J. Colloid Interf. Sci. 23, 577–599. doi:10.1016/0021-9797(67)90204-4
Minelli, M., Pimentel, B. R., Jue, M. L., Lively, R. P., and Sarti, G. C. (2019). Analysis and utilization of cryogenic sorption isotherms for high free volume glassy polymers. Polymer 170, 157–167. doi:10.1016/j.polymer.2019.03.012
Nemoto, J., Saito, T., and Isogai, A. (2015). Simple Freeze-Drying Procedure for Producing Nanocellulose Aerogel-Containing, High-Performance Air Filters. ACS Appl. Mater. Inter. 7, 19809–19815. doi:10.1021/acsami.5b05841
Nicolas, W., J., Ghosal, D., Tocheva, E., I., Meyerowitz, E., M., Jensen, G., J., and Brun Yves, V. (2021). Structure of the Bacterial Cellulose Ribbon and its Assembly-Guiding Cytoskeleton by Electron Cryotomography. J. Bacteriol. 203, e00371–00320. doi:10.1128/JB.00371-20
Nishiyama, Y., Isogai, A., Okano, T., Müller, M., and Chanzy, H. (1999). Intracrystalline Deuteration of Native Cellulose. Macromolecules 32, 2078–2081. doi:10.1021/ma981563m
Rouquerol, J., Llewellyn, P., and Rouquerol, F. (2007). Is the bet equation applicable to microporous adsorbents. Stud. Surf. Sci. Catal. 160, 49–56. doi:10.1016/s0167-2991(07)80008-5
Santmarti, A., and Lee, K.-Y. (2018). “Crystallinity and thermal stability of nanocellulose,” in Nanocellulose and Sustainability: Production, properties, applications, and case Studies. Editor K. Y. Lee (Boca Raton, FL: Taylor Francis Group)), 67–86. doi:10.1201/9781351262927-5
Santmarti, A., Teh, J. W., and Lee, K.-Y. (2019). Transparent Poly(methyl methacrylate) Composites Based on Bacterial Cellulose Nanofiber Networks with Improved Fracture Resistance and Impact Strength. ACS Omega 4, 9896–9903. doi:10.1021/acsomega.9b00388
Santmarti, A., Zhang, H., Lappalainen, T., and Lee, K.-Y. (2020). Cellulose nanocomposites reinforced with bacterial cellulose sheets prepared from pristine and disintegrated pellicle. Composites Part A: Appl. Sci. Manufacturing 130, 105766. doi:10.1016/j.compositesa.2020.105766
Thommes, M., Kaneko, K., Neimark, A. V., Olivier, J. P., Rodriguez-Reinoso, F., Rouquerol, J., et al. (2015). Physisorption of gases, with special reference to the evaluation of surface area and pore size distribution (IUPAC Technical Report). Pure Appl. Chem. 87, 1051–1069. doi:10.1515/pac-2014-1117
Tokoh, C., Takabe, K., Fujita, M., and Saiki, H. (1998). Cellulose Synthesized by Acetobacter Xylinum in the Presence of Acetyl Glucomannan. Cellulose 5, 249–261. doi:10.1023/a:1009211927183
Vilchez, V., Dieckmann, E., Tammelin, T., Cheeseman, C., and Lee, K.-Y. (2020). Upcycling Poultry Feathers with (Nano)cellulose: Sustainable Composites Derived from Nonwoven Whole Feather Preforms. ACS Sust. Chem. Eng. 8, 14263–14267. doi:10.1021/acssuschemeng.0c04163
Voisin, H., Bergström, L., Liu, P., and Mathew, A. P. (2017). Nanocellulose-based materials for water purification. Nanomaterials 7 (3), 57. doi:10.3390/nano7030057
Wang, D. (2019). A critical review of cellulose-based nanomaterials for water purification in industrial processes. Cellulose 26, 687–701. doi:10.1007/s10570-018-2143-2
White, A. R., and Brown, R. M. (1981). Enzymatic hydrolysis of cellulose: Visual characterization of the process. Proc. Natl. Acad. Sci. United States America 78, 1047–1051. doi:10.1073/pnas.78.2.1047
Yano, H., Sugiyama, J., Nakagaito, A. N., Nogi, M., Matsuura, T., Hikita, M., et al. (2005). Optically Transparent Composites Reinforced with Networks of Bacterial Nanofibers. Adv. Mater. 17, 153–155. doi:10.1002/adma.200400597
Keywords: nanocellulose, bacterial cellulose, surface area, inverse gas chromatography, adsorption, dynamic vapour sorption
Citation: Kondor A, Santmarti A, Mautner A, Williams D, Bismarck A and Lee K-Y (2021) On the BET Surface Area of Nanocellulose Determined Using Volumetric, Gravimetric and Chromatographic Adsorption Methods. Front. Chem. Eng. 3:738995. doi: 10.3389/fceng.2021.738995
Received: 09 July 2021; Accepted: 25 August 2021;
Published: 14 September 2021.
Edited by:
Tekla Tammelin, VTT Technical Research Centre of Finland Ltd., FinlandCopyright © 2021 Kondor, Santmarti, Mautner, Williams, Bismarck and Lee. This is an open-access article distributed under the terms of the Creative Commons Attribution License (CC BY). The use, distribution or reproduction in other forums is permitted, provided the original author(s) and the copyright owner(s) are credited and that the original publication in this journal is cited, in accordance with accepted academic practice. No use, distribution or reproduction is permitted which does not comply with these terms.
*Correspondence: Koon-Yang Lee, a29vbnlhbmcubGVlQGltcGVyaWFsLmFjLnVr
Disclaimer: All claims expressed in this article are solely those of the authors and do not necessarily represent those of their affiliated organizations, or those of the publisher, the editors and the reviewers. Any product that may be evaluated in this article or claim that may be made by its manufacturer is not guaranteed or endorsed by the publisher.
Research integrity at Frontiers
Learn more about the work of our research integrity team to safeguard the quality of each article we publish.