 Marc Escribà-Gelonch
 Nghiep Nam Tran
 Volker Hessel
94% of researchers rate our articles as excellent or good
Learn more about the work of our research integrity team to safeguard the quality of each article we publish.
Find out more
ORIGINAL RESEARCH article
Front. Chem. Eng., 15 September 2021
Sec. Microfluidic Engineering and Process Intensification
Volume 3 - 2021 | https://doi.org/10.3389/fceng.2021.724036
This article is part of the Research TopicFundamentals, Design and Applications in Process-Intensifying EquipmentView all 4 articles
Process analytical technology has become a relevant topic in both industry and academia as a mechanism to control process quality by measuring critical parameters; being mainly applied in pharmaceutical industry. An emerging topic is process monitoring with subsequent process automation in flow chemistry using inline, online and atline analyzers. Flow chemistry often deliberately and favorably uses harsh conditions (termed Novel Process Windows) to achieve process intensification which raises the need for sampling under these conditions. This demands for setting in place a stabilization of the sample before exposing it to the processing. Ignoring this may result in being unable to use inline/online analytics and posing the need for a separation step before quantitative analysis, leaving atline analysis as the only feasible option. That means that sampling and connected operations need also to be automated. This is where this study sets in, and this is enabled by a modified high-performance liquid chromatography (HPLC) autosampler coupled to the photo-high-p,T flow synthesis of vitamin D3. It shows that sampling variables, such as decompression speed, can be even more critical in terms of variability of results than process variables such as concentration, pressure, and temperature. The modification enabled the autosampler fully automated and unattended sampling from the reactor and enabled pressure independent measurements with 89% accuracy, >95% reproducibility, and >96% repeatability, stating decompression speed as the primary responsibility for measurements’ uncertainty.
Flow chemistry has become, in the last decades, a prominent topic in process design (Jähnisch et al., 2004; Hessel et al., 2013; Plutschack et al., 2017). It allows enhanced process control and process optimization not only in terms of intensification (shorter residence times) and yield, but also in terms of controlled waste production and improved sustainability (Escribà-Gelonch et al., 2021). On top of that, photochemical reactions have been described to be a cleaner process with shorter reaction paths, mainly applied for photo-halogenation, photopolymerization, sulfochlorination, nitrosation and oxidation, among others (Bottcher et al., 1991). In photochemistry, single reaction steps can have complex reaction schemes, as given for example in the synthesis of vitamin D3 (VD3), where side products are produced as a result of parallel competitive reactions derived from light absorption of intermediate isomeric compounds in a complex equilibrium, resulting in both efficiency and selectivity reduction of the reaction (Escribà-Gelonch et al., 2018a). Continuous-flow microreactors often use small diameter capillaries in order to increase the surface-to-volume ratio, enhancing mass and heat transfer abilities. The way to transfer light to such capillaries has been widely studied especially in the last 10 years (Cambie et al., 2016), since the small dimensions of microreactors ensure the equal irradiation of the reaction mixture. Yet, the specific wavelength demanded in the reactions, such as VD3 synthesis, requires the use of monochromatic laser light sources, asking for a specific design for tubing irradiation. In this context, we have previously reported a method to transfer light to 0.55 mm internal diameter capillary placed in a continuous microreactor using a conical curled-fashioned coil, which enabled deep light penetration along the walls, irradiating equally throughout the tube within the beam section (Escribà-Gelonch et al., 2018b). This effect combined with faster mass and heat transfer allowed by the microreactor made it possible to achieve photo-high-p,T intensification using also high pressure (p) and temperature (T) (Escribà-Gelonch et al., 2018b).
A key to process intensification is the deliberate use of harsh operating conditions in a secure fashion (Hessel 2009); mainly to boost kinetics in a productive and economic mode. This concept has been coined Novel Process Windows (NPW) (Hessel et al., 2013; Hessel et al., 2014), and can utilize intrinsic kinetics, and then even more needs to the favorable mass and heat transfer capabilities of microfluidic devices. Otherwise, it would run in transport limitations, leading to the less effective kinetics. Batch processing, with its bigger equipment size cannot realize easily these extreme conditions and not switch as fast between these as needed. As a result, NWP has enabled massive reaction time reductions – from formerly hours to minutes or seconds – not only for single reactions (Escribà et al., 2011; Illg et al., 2011), but also for whole multi-step processes performed in continuous fashion (Escribà-Gelonch et al., 2019). Several other process advantages have been reported and demonstrated such as the possibility to operate with higher concentrations or even solventfree, or to use designer solvents for enhanced and selective solubilization (Hessel et al., 2013; Hessel et al., 2014). NPW can provide enhanced sustainability of intensified continuous flow chemistry (Grimaldi et al., 2020). Finally and in the context of this paper, NPW in flow chemistry need even more advanced and faster process control, and possibly sampling and analysis has to be done (partly) under harsh conditions.
The reduction in reaction times eased by process intensification, such as in photo-high-p,T, comes together with the need for process control and a subsequent fast measurements. Thus, analytical technology needs to be adapted in order to deliver fast detection, fast results, and consequently, fast analytics, which brings to the process automation concept (Ley et al., 2015). In this framework, Process Analytical Technology (PAT) offers a pathway for process control by measuring critical quality and performance attributes in a process, increasing its efficiency by fast correction of any leverage (Rasheed and Wirth, 2011; Holmes and Bourne, 2014; Fabry et al., 2016). Short reaction times of highly intensified processes make relevant any single deviation, so PAT allows a reduction of variability, enhances efficiency while reducing over-processing and minimizing waste. In these rapid processes, where the residence time evenly measured in the range of a few seconds, inline, online and/or atline analytics are assumed to be essential (Escribà-Gelonch et al., 2018c). In the case of VD3, the use of photo-high-p,T in a microfluidic system allowed residence time reduction to the order of seconds. Therefore, the integration of an inline/online/atline measurement with automated feedback for full process control was demanded to eliminate delays associated with off-line measurements.
In flow chemistry, PAT measurements are based on two main principles: The first involves direct measuring using inline sensors or cells placed either directly in the flowing stream (inline) or a bypass splitter (online), if the analytical methodology is sensitive to the internal flowrate (e.g. online NMR). Yet, in both cases, the analytics are not destructive and any extraction is needed from the stream. The second encompasses measurement of a sample – or representative amount of the channel content – extracted from the reactor, which is carried out by an atline analyzer (Morin et al., 2021). In both cases, process control is achieved using the PAT results obtained at a certain frequency according to the reactor volume, the process dynamics, and the residence time distribution. In the case of atline measurements, usually connected with liquid/gas chromatography, lower frequency is allowed because of the need for sample preparation (dilution), and parallel running for chromatographic separations. This fact makes the samples not suitable to be returned to the reactor anymore (Browne et al., 2012; Holmes et al., 2016). Yet, highly time-optimized processes demand not only fast analysis, but also innovative approaches for an efficient, fast and representative sampling where inline/online detections are not possible, keeping the integrity of the reactor content, for real-time monitoring (Simon et al., 2015). In the case of VD3, where all species present in the final mixture are isomers, a previous chromatographic separation is mandatory before measuring, which disables the possibility to use inline/online detectors, such as UV, since they could not provide enough accuracy. In a similar situation, we previously reported the QuIProLi system based on the coupling of a modified ultra-high-performance liquid chromatography (UHPLC) system to a continuous flow platform applied to photo-Claisen rearrangement reaction (Escribà-Gelonch et al., 2018c). In consideration of VD3 synthesis, which is performed in only a few seconds of irradiation, a fast sampling-analysis sequence is essential to keep the process under control.
Besides process monitoring, PAT can also be used for process development, which highlights the relevance of a proper sampling operation without alteration of the steady-state (Workman et al., 2011). A malfunction during this operation due to the sample sensitivity to small perturbations may generate remarkable errors with subsequent further data inconsistencies (Schwedt, 1995). The combination of sampling and analysis automation offer an opportunity for artificial intelligence (AI) implementation (Taylor et al., 2021), which has computer-aided tools integrated to guide the sequence of experiment iterations (Gent, 2020; Coley et al., 2019). Sampling in microreactors for atline monitoring is challenging because of three following main reasons. Firstly, the sample needs to be representative, but the small dimensions and low volumes of the whole microreactor demand extremely low sampling volume in the range of a few microliters with minimal disturbance. Secondly, this operation typically includes preparatory techniques, such as dilution, which are expected to be performed unattended in the context of process automation (Ahmed-Omer et al., 2016). An optimal sampling is performed within process conditions (i.e. pressure, temperature, etc…), without cross contaminations, being aware that analytical conditions are rather different than synthesis ones. Finally, the intensified VD3 microfluidic system, herewith under assessment, has the additional challenge to operate at high-p,T conditions in the outlet. Consequently, the sampling operation has to be performed in the same conditions. This fact demands a supplementary depressurization to ambient pressure in high-p,T sampling for UHPLC measurement preparation before the chromatographic separation, which is performed in high pressure. Therefore, the sample has to go from high pressure to atmospheric pressure, and high pressure again (usually higher than the initial) for the measurement. These changes in operating conditions can cause several effects to the sample which are not always obvious (Peper and Dohrn, 2012). The use of capillaries has been reported to be an effective solution to mitigate these changes due to the favorable low ratio of sample to reactor volume in milli-scale reactors (Galicia-Luna et al., 2000). Yet, this solution is not applicable to microreactors since both diameters are in the same range.
The sampling operation on continuous flow for atline monitoring can be performed either by aspiration of a fraction of the reaction mixture or by trapping the sampling volume in a customized rotating or monolithic valve (Somerville et al., 2014). The first solution is generally better suited to pressurized reactors while the second is likewise for low-pressure performances (Kenichi, 2019). An example of these kinds of samplers are the one proposed by Metler-Toledo (Brown and Schober, 2019), which extends and successively retracts a cup, isolating the collected and successively quenching and analyzing, or Eli Lilly (Lambertus et al., 2019), where a set of consecutive valves isolate a section of the coil where the diluent is added and followed to the analyzer. Rotary valves with a sampling loop are also used e.g. as a part of a microwave reactor (Somerville et al., 2014), which can deliver small sample volumes with high accuracy directly to the analytical system: this is the case of HPLC-valves (Duarte et al., 2002), pneumatic or electromagnetic valves (Valtz et al., 2004). If the sample does not require further preparation, the autosampler could be directly coupled via capillaries to analytical equipment such as gas chromatography (Seredynska et al., 2007), high-performance liquid chromatography (HPLC) (Wagner et al., 2000), or supercritical fluid chromatography (Duarte et al., 2002). Yet, this is not the case of VD3 synthesis, since the chromatographic and reaction solvents are not the same.
The study presented herewith describes the effects of the fully automated sampling operation using a photo-high-p,T microreactor for the synthesis of VD3. The operating conditions are always taken according to previous process optimization described in the literature (Escribà-Gelonch et al., 2018b). In the case presented herewith, the sampling was performed by pressure drop, since the slow increase of the volume promoted by the extraction system contributed to a controlled depressurization. Errors regarding the cross-contamination from previous sampling operations or solvent evaporation by pressure change were properly handled by an appropriate automated cleaning and further flushing of the sampler, and a slow microvolume extraction respectively. The immediate transfer of the sample to a temperature-controlled capsule performed by a robotic mechanism, contributed to a smooth adjustment of the new p,T conditions for further automatic sample preparation and subsequent injection using UHPLC. The aim of the study is therefore the evaluation of the differences in automated at-line measurements, when sampling under different conditions regarding pressure, concentration and decompression speed, in terms of individual significance and possible interaction effects. This will contribute to the reliability of the sampling process, through an evaluation of accuracy (meaning the difference between the measurement and the actual value), reproducibility (meaning the difference between multiple measurements obtained in different conditions) and repeatability (meaning the difference between multiple measurements obtained in identical conditions) parameters. The automated mechanism described herewith is suitable to be combined with AI implementation for successive experiment iterations fully unattended.
Considering that all chemicals were used as received from the supplier, when operating in VD3 synthesis mode the starting solution was composed of 480 mg of 7- dehydrocholesterol — 7DHC (>90% Cayman Chemical Company) dissolved in 25 ml of methyl tert-butyl ether (tBME) (99% Alfa Aesar), giving 0.05 M concentration of 7DHC. When operating in validation mode the standard validation solution was composed of 240.5 mg of 7DHC and 48 mg of vitamin D3 – VD3 (Alfa Aesar 99% Lot: 10186907) dissolved in 25 ml of tBME.
In a standard operation (Scheme 1), the solution was loaded in an ISCO pump (100D series) before filling and purging the microreactor. Then, the pressure was set to the operating target using the corresponding back pressure regulator (IDEX). The pressure was continuously monitored using the pressure sensor of the ISCO pump (Scheme 1). Once pressurized the reactor, the laser beam was directed towards the coil and the oven was set to the target temperature. Residence times were calculated according to the reactor volume and the flow rate. Every sampling test was performed after three residence times under the desired photo-high-p,T conditions. Each experiment was repeated at least 3 times.
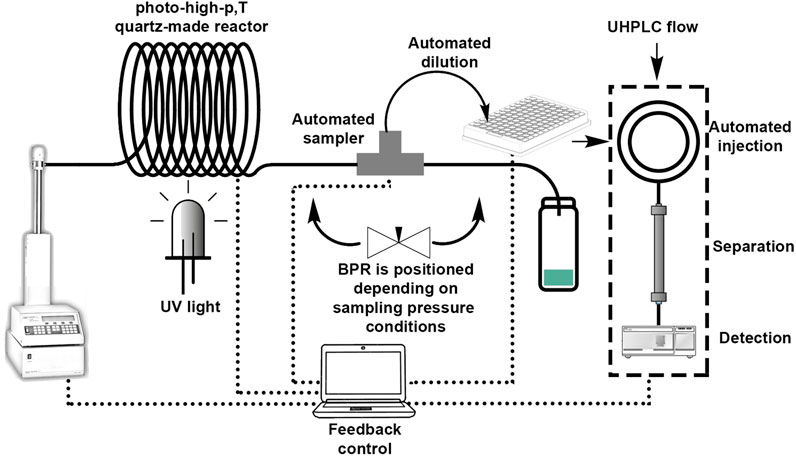
SCHEME 1. Experimental setup and process monitoring.
The autosampler (Agilent Technologies, Inc.) was “in-house” modified (an item of a patent application) and included a series of multi-port valves, which allowed for trapping 40 μL solution volume followed by progressive depressurization and expansion. The sample was directly taken from the microreactor. A robotic system performed automatically the sample dilution after cleaning and flushing to a total volume of 100 μL. The dilution was followed by an automated chromatographic injection and further 2.5 min runtime separation of just 1 μL aliquote. This autosampler already gave good performance for fast reaction optimization sampling in the same conditions (Escribà-Gelonch et al., 2018c). This study aims for a step beyond sampling at different conditions, testing features for Quality-In(Process)Line (QuIProLi) applications. In this context variables such as pressure, decompression speed and concentration are considered, based on an already optimized reaction.
The UHPLC-based setup was composed of an Agilent 1,290 Infinity II LC (Scheme 1, right hand), which included a binary pump, the mentioned modified autosampler unit, a Multicolumn Thermostat with a thermostated column (UHPLC Zorbax Eclipse Plus C18 3.0 × 50 mm 1.8 micron), and a diode array detector equipped with a 10 mm Max-Light Cartridge Cell. The isocratic separation was performed using acetonitrile 100% (99% Merck) as mobile phase. Quantification was carried out at 270 nm. Cholesterol (95% Alfa Aesar) was used as an internal standard (IS) when needed. For sampling and analysis operations as well as for data analysis, the Agilent OpenLAB ChemStation software was used.
Comparative offline experiments were performed using HPLC (Shimadzu UFLC-XR) with a GraceSmart RP 18 5u column (150 mm × 4.6 mm). The quantification was provided by a UV-visible Shimadzu diode array detector (RID–10 A) at 190 nm. Both IS and mobile phases were used as described in atline mode.
This study was performed using two procedures: In the first, the setup worked in-production using photo-high-p,T synthesis of VD3 from a starting solution of 7DHC. Samples were collected atline using the tested autosampler and offline after the backpressure regulator. The difference in the flow rate defined the irradiation time. Offline tests were processed manually to collect both work-up processing times and results in offline HPLC. This enabled reproducibility results above 95%. The automated autosampler avoided random errors due to the standard procedure, isolating systematic errors derived from the device’s performance. Due to the random error decrease, the required sampling volume was reduced by a factor of x25 with respect to offline sampling, being required 20 and 500 μL respectively, generating consequently much less waste.
As a second procedure, a standard solution prepared as described above was pumped in dark conditions in order to disallow further synthesis. Different concentrations, pressures, and depressurization speeds were tested as described below. This procedure allowed for an average accuracy of 89%. Nevertheless, the distribution of results was different concerning the two main species involved (VD3 and 7DHC). In this connection, Figure 1 shows the box plot of the distribution of the whole results obtained. In red (continuous line) the concentration target is the concentration of the pumped solution. Red-dotted lines show the 95% deviation of the confidence interval. The plot shows the high level of accuracy, but also shows the different dispersion of results. Yet, different of VD3 results where most of them are located inside the confidence interval, 7DHC results are much more dispersed, being part of them out of the confidence interval. This would suggest a different pattern behavior in both species with the atline high-p,T auto sampling unit. Encouraged by these results, we followed up the study of the effect of atline sampling at different pressure and different decompression speeds as described in the next sections.
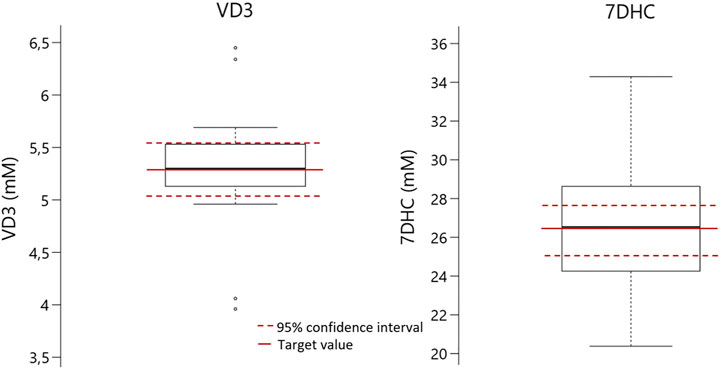
FIGURE 1. Degree of accuracy obtained by different experiments performed in the same dark conditions (in red the target value, in red doted lines the 95 % interval of confidence).
In terms of time, the new autosampler performed an automated calibration at the beginning of each working day, performing automatically the solutions bank from a predefined mother solution. This allowed for an automated calibration in 20 min, which included six dilutions preparation, the triplicate injection of each sample, and the quantification of results. The equivalent operation performed by an experienced analyst took more than 1 hour. Besides the operation speed, the automation allowed for time optimization, since the researcher worked in parallel on other tasks while the device was getting auto-calibrated, with the consequent cost savings. Furthermore, in terms of time per sample, the time required by the automation was 40% less than in the manual offline management, which spent an average of 10 min per sample, being 6 min in the case of the automated system, which operated fully unattended. These operations included sampling, preparation, dilution, shaking, injection, as well as data collection, where x25 less waste was generated as compared with offline methodology.
Sampling at high-p,T may bring associated mass losses because of solvent evaporation in the stage of decompression. Too fast depressurization may even allow operating above the boiling point of the solvent dispersing the mass of dissolved species on the walls of the sampling compartment. This mass can be relevant because of the small size of the sample or because of the low concentration of compounds. Yet, in the case of VD3 synthesis, despite having a cooler after the reactor, the reaction demands still some temperature in order to control parallel competitive reactions. Figure 2 shows the parity plot of the assessment of the autosampler’s performance in terms of concentration. Tolerance lines were set assuming a 15% target deviation. Figure 2 shows that the accuracy in the measurements at higher concentrations was higher than in lower concentrations, meaning that the mass losses were relevant at lower concentrations. It is interesting to note that, in this case, losses were independent of the species. But even so, the highest variation coefficient was 1.0% in concentrations in the range of 12.5 mM, being 0.83% in the lowest concentrations tested. The lowest variation coefficient of 0.12% was achieved at 25.0 mM concentration. Therefore, the precision of the results was notably acceptable as compared with usual analytical UHPLC measurements.
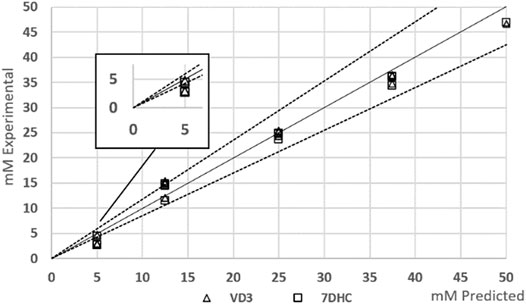
FIGURE 2. Effect of mass losses using automated high-p,T autosampler.
In terms of repeatability, VD3 offered a better score than 7DHC, with a variation coefficient of 1.2 and 3.8% respectively. In this case, it can be concluded that there is no substantial change in the measurements of the same sample performed sequentially. Yet, the sampling of VD3 was more reliable under high-p,T conditions.
As shown in Figure 1, the results of 7DHC and VD3 measurements delivered different data dispersions. Especially for the case of 7DHC, some of the data obtained were clearly out of 95% confidence level. In order to give light and establish the causes of these outcomes, the effect of the pressure and the depressurization speed as well as their interactions in both VD3 and 7DHC measurements was studied using analysis of variance. For this purpose, a sequential sum of squares for two-factor interaction design (2FI) was performed separately for both species using the Design-Expert software (Version-13.0.1.0).
Table 1 describes de ANOVA analysis performed using the results operating with different pressures (p) and different decompression speeds (E). The assessed levels of the first were 1, 7, and 32 atm respectively, while 50, 100, and 200 μL/min were the ones for the second variable. The model resulted to be significant with a 95% interval of confidence. This confirmed that there are significant differences between measurements due to the factors (p, E) under study. The sum of squares was considered as Type III – Partial sum of squares – because the order of measurements was not relevant for this study (non-sequential measurements), but so was the interaction effect. The model concludes that the noise is only relevant with a 3.1% chance, and therefore the results can be considered significant. Table 1 detects relevant differences due to variable E, and therefore suggests that the decompression speed caused, with statistical significance, the variation of 7DHC results. Interesting to note that the measurements were pressure independent, not being enhanced by the effect of the decompression speed since the interaction was not significant. Figure 3B (right) shows the normalized residuals of p factor with respect to 7DHC, where it may be observed the similar distribution of residues with different pressures, which confirms the p independence of the measurements. Moreover, the concentration of out-ranged observations (dark blue and red) is clearly concentrated in low-pressure measurements, being the average ones (green) mainly distributed in medium p, and a bit more dispersed at high pressure. These results suggest difficulties while sampling at atmospheric pressure. Different than for the variable p, the residuals plot for E variable shown in Figure 4 exhibits different data dispersion operating with different decompression speeds. In this case, some issues are detected by operating both with high and low speeds (dark blue and red dots), being more balanced a medium decompression speed. Table 1 also suggests an important dispersion of measurements, matching the observations in Figure 1. Despite the lack of fit term is not significant, which means that the model fits rather well, the overall variation coefficient raises to 10.25% when overall data are considered. This is in accordance also with the interaction plot (Figure 5), where some deviation values can be found when measuring at different pressures, enhancing the variability.

TABLE 1. 2FI assessment for the effect of pressure (p) and decompression speed (E) on 7DHC measurements.
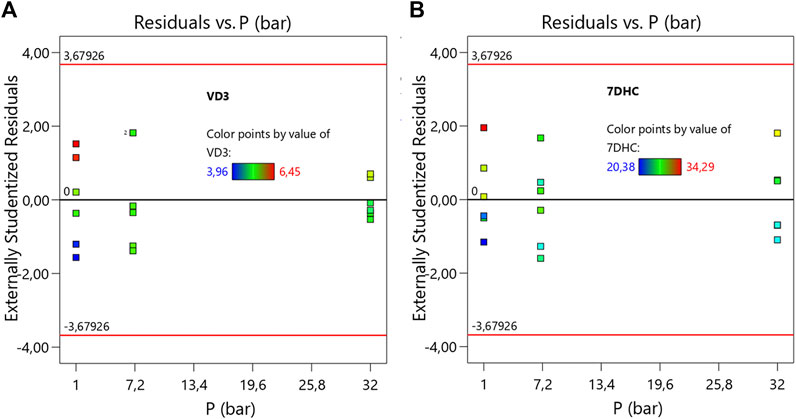
FIGURE 3. Normalized residuals plot of VD3 (A) and 7DHC (B) with respect of pressure (p). (Average points in green. In blue and in red the lower and the upper leveraged values respectively)
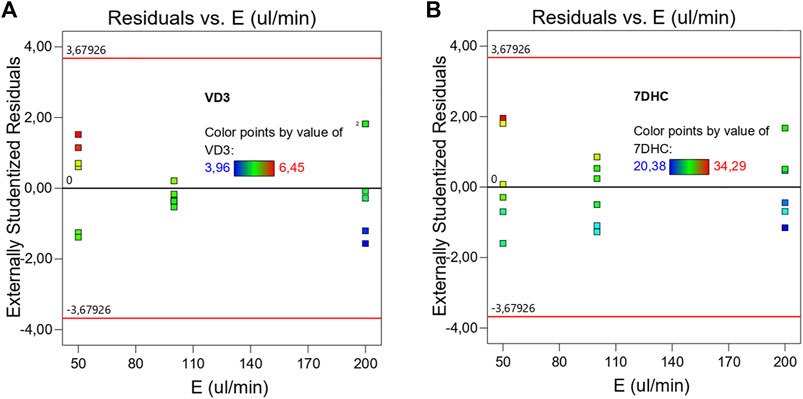
FIGURE 4. Normalized residuals plot of VD3 (A) and 7DHC (B) with respect of decompression speed (E). (Average points in green. In blue and in red the lower and the upper leveraged values respectively)
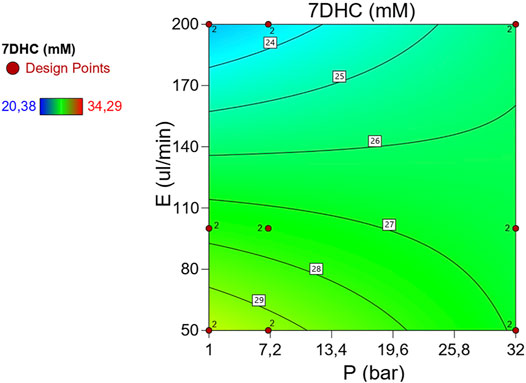
FIGURE 5. Interaction plot of p, E effect in 7DHC measurements using high-p,T autosampler. (Average points in green. In blue and in red the lower and the upper leveraged values respectively)
Following an analogous methodology as described for 7DHC, Table 2 describes de ANOVA analysis performed for p, E variables in VD3 measurements. This model also detects significant differences between measurements due to p, E factors at 95% interval of confidence, yet with a much lower chance (0.13%) of noise interaction, which is favored by an overall variation coefficient of 7.4% and a standard deviation of ±0.39 mM. The fact that the lack of fit term is significant means that in some intervals the model may not be fully adjusted. In the same line as described by 7DHC results, the decompression speed appears to be significant, and therefore, the main cause of the variance in observations. Yet, in this case, the differences are more significant, as shown in Figure 4A, where medium decompression speeds are clearly appearing more consistent than higher and lower. The colored dark blue and red dots located at extreme speeds shows also possible issues while operating with extreme decompression speeds. In this case, pressure (p) also remains independent of the measurements. Figure 3A shows a comparable distribution of the residuals, meaning a similar distribution of error at different pressures. This is very important regarding the possibility to efficiently sample and quantify at high p conditions in flow chemistry. Despite not being significant the P-E interaction, Figure 6 shows a much simple and therefore higher stability in VD3 measurements with respect to the ones for 7DHC.
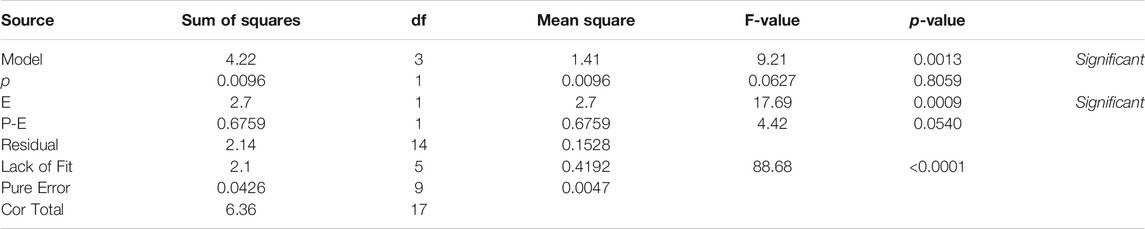
TABLE 2. 2FI assessment for the effect of pressure (p) and decompression speed (E) on VD3 measurements.
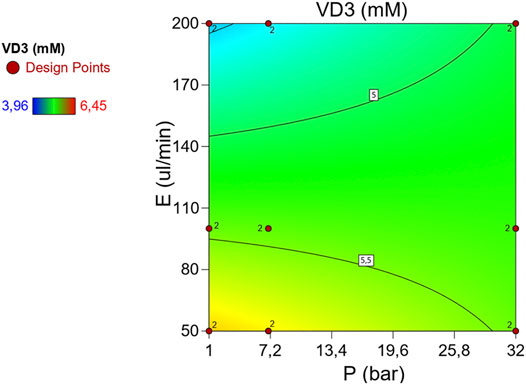
FIGURE 6. Interaction plot of p, E effect in VD3 measurements using high-p,T autosampler. (Average points in green. In blue and in red the lower and the upper leveraged values respectively)
Process Analytical Technology can be applied for process control of flow chemistry under harsh conditions, so-called NPW. Nevertheless, when inline/online sensors are not suitable to be coupled because species need to be separated from previous quantification, an atline assessment is demanded which requires inevitably a sampling operation. This is the case of reactions involving isomers such as vitamin D3 synthesis. Sampling in reaction monitoring using flow chemistry can become very challenging because of the extremely low volume demands, as well as the fact that flow chemistry is commonly used to operate under harsh pressure and temperature conditions. These features demand extreme precision in measurements, but also an accurate and significant sampling methodology. In this study, an “in house” modified autosampler was tested operating at high-p,T conditions. Two major results were gathered: the independence of the pressure with the measurements, and the relevance of the decompression speed when processing samples before analysis. The first enables the possibility to couple the analyzer to all processes with the independence of the pressure. Regarding the second, the optimal decompression speed resulted to be 100 μL/min, which is the medium speed tested. Extreme speed levels are derived in issues in terms of residuals dispersion. Overall, the automated atline analyzer showed a prominent performance not only in terms of accuracy, scoring 89%, but also with a reproducibility above 95% and repeatability with a variation coefficient below 4%. The accuracy was lower when operating with lower concentrations due to measurements were taken close to the limit of quantification. The high degree of automation allowed for a x25 lower waste generation as well as 40% time savings with respect to the corresponding offline experiment.
The datasets presented in this article are not readily available because of a patent. Requests to access the datasets should be directed to the corresponding authors.
ME-G contributed to conception, design, analytics, writing the draft and statistical analysis. NT contributed to statistical analysis and interpretation, as well as writing the draft. VH contributed to conception, design, Agilent contacts, and writing the draft. All authors contributed to manuscript revision, read, and approved the submitted version.
This project was funded by the Horizon 2020: Marie Skolodowska-Curie Individual Fellowship awarded by ME-G under grant agreement number 659233. The authors acknowledge Bettina Schuhn, Thomas Ortmann, and Dr. Thomas Glauner (Agilent Technologies) for supporting the modification of the UHPLC system for atline sampling.
The authors declare that the research was conducted in the absence of any commercial or financial relationships that could be construed as a potential conflict of interest.
All claims expressed in this article are solely those of the authors and do not necessarily represent those of their affiliated organizations, or those of the publisher, the editors and the reviewers. Any product that may be evaluated in this article, or claim that may be made by its manufacturer, is not guaranteed or endorsed by the publisher.
Ahmed-Omer, B., Sliwinski, E., Cerroti, J. P., and Ley, S. V. (2016). Continuous Processing and Efficientin SituReaction Monitoring of a Hypervalent Iodine(III) Mediated Cyclopropanation Using Benchtop NMR Spectroscopy. Org. Process. Res. Dev. 20, 1603–1614. doi:10.1021/acs.oprd.6b00177
Bottcher, H., Bendig, J., Fox, M. A., Hopt, G., and Timpe, H. (1991). Technical Applications of Photochemistry. Leipzig: Deutscher Verlag fur Grundstoffindustrie.
Brown, P., and Schober, M. (2019). Continuous Flow Process Development: Sampling Reactions over Extended Periods. Available at: https://www.mt.com/dam/0autochem/RapidFlowProcessDevelopment_AN_en_20190212_Original_58061.pdf (Accessed May, , 2021).
Browne, D. L., Wright, S., Deadman, B. J., Dunnage, S., Baxendale, I. R., Turner, R. M., et al. (2012). Continuous Flow Reaction Monitoring Using an On-Line Miniature Mass Spectrometer. Rapid Commun. Mass. Spectrom. 26, 1999–2010. doi:10.1002/rcm.6312
Cambié, D., Bottecchia, C., Straathof, N. J. W., Hessel, V., and Noël, T. (2016). Applications of Continuous-Flow Photochemistry in Organic Synthesis, Material Science, and Water Treatment. Chem. Rev. 116, 10276–10341. doi:10.1021/acs.chemrev.5b00707
Coley, C. W., Thomas, D. A., Lummiss, J. A. M., Jaworski, J. N., Breen, C. P., Schultz, V., et al. (2019). A Robotic Platform for Flow Synthesis of Organic Compounds Informed by AI Planning. Science 365 (6453), eaax1566. doi:10.1126/science.aax1566
Duarte, C. M. M., Crew, M., Casimiro, T., Aguiar-Ricardo, A., and Nunes da Ponte, M. (2002). Phase Equilibrium for Capsaicin+water+ethanol+supercritical Carbon Dioxide. J. Supercrit. Fluids. 22, 87–92. doi:10.1016/S0896-8446(01)00114-0
Escribà, M., Hessel, V., Rothstock, S., Eras, J., Canela, R., and Löb, P. (2011). Applying a Continuous Capillary-Based Process to the Synthesis of 3-Chloro-2-Hydroxypropyl Pivaloate. Green. Chem. 13 (7), 1799–1805. doi:10.1039/C0GC00655F
Escribà‐Gelonch, M., Halpin, A., Noël, T., and Hessel, V. (2018b). Laser‐mediated Photo‐high‐p,T Intensification of Vitamin D3 Synthesis in Continuous Flow. ChemPhotoChem 2 (10), 922–930. doi:10.1002/cptc.201800102
Escribà-Gelonch, M., de Leon Izeppi, G. A., Kirschneck, D., and Hessel, V. (2019). Multistep Solvent-free 3 M2 Footprint Pilot Miniplant for the Synthesis of Annual Half-Ton Rufinamide Precursor. ACS Sustain. Chem. Eng. 7 (20), 17237–17251. doi:10.1021/acssuschemeng.9b03931
Escribà-Gelonch, M., Shahbazali, E., Honing, M., and Hessel, V. (2018c). Quality-In(Process)Line (QuIProLi) Process Intensification for a Micro-flow UV-Photo Synthesis Enabled by Online UHPLC Analysis. Tetrahedron 74 (25), 3143–3151. doi:10.1016/j.tet.2018.02.016
Escribà-Gelonch, M., Bricout, J., and Hessel, V. (2021). Circular Economy Metrics for the Photo-High-P,T Continuous Multistep Synthesis of Vitamin D3. ACS Sust. Chem. Eng. 9 (4), 1867–1879. doi:10.1021/acssuschemeng.0c08330
Escribà-Gelonch, M., Noël, T., and Hessel, V. (2018a). Microflow High-P,T Intensification of Vitamin D3 Synthesis Using an Ultraviolet Lamp. Org. Proc. Res. Dev. 22 (2), 147–155. doi:10.1021/acs.oprd.7b00318
Fabry, D. C., Sugiono, E., and Rueping, M. (2016). Online Monitoring and Analysis for Autonomous Continuous Flow Self-Optimizing Reactor Systems. React. Chem. Eng. 1, 129–133. doi:10.1039/C5RE00038F
Galicia-Luna, L. A., Ortega-Rodriguez, A., and Richon, D. (2000). New Apparatus for the Fast Determination of High-Pressure Vapor−Liquid Equilibria of Mixtures and of Accurate Critical Pressures. J. Chem. Eng. Data. 45, 265–271. doi:10.1021/je990187d
Gent, E. (2020). Artificial Intelligence Is Evolving All by Itself. Science. Available at: https://www.sciencemag.org/news/2020/04/artificial-intelligence-evolving-all-itself (Accessed May, 2021). doi:10.1126/science.abc2274
Grimaldi, F., Leon Izeppi, G. A., Kirschneck, D., Lettieri, P., Escribà‐Gelonch, M., and Hessel, V. (2020). Life Cycle Assessment and Cost Evaluation of Emerging Technologies at Early Stages: The Case of Continuous Flow Synthesis of Rufinamide. Jnl Adv. Manuf Process. 2 (2), e10043. doi:10.1002/amp2.10043
Hessel, V., Kralisch, D., Kockmann, N., Noël, T., and Wang, Q. (2013). Novel Process Windows for Enabling, Accelerating, and Uplifting Flow Chemistry. ChemSusChem 6 (5), 746–789. doi:10.1002/cssc.201200766
Hessel, V., Kralisch, D., and Kockmann, N. (2014). Novel Process Windows: Innovative gates to Intensified and Sustainable Chemical Processes. Weinheim: Wiley‐VCH Verlag GmbH & Co. KGaA.
Hessel, V. (2009). Novel Process Windows - Gate to Maximizing Process Intensification via Flow Chemistry. Chem. Eng. Technol. 32, 1655–1681. doi:10.1002/ceat.200900474
Holmes, N., Akien, G. R., Savage, R. J. D., Stanetty, C., Baxendale, I. R., Blacker, A. J., et al. (2016). Online Quantitative Mass Spectrometry for the Rapid Adaptive Optimisation of Automated Flow Reactors. React. Chem. Eng. 1, 96–100. doi:10.1039/C5RE00083A
Holmes, N., and Bourne, R. A. (2014). “Analysis and Optimisation of Continuous Processes” in Chemical Process Technology for a Sustainable Future. Editors T. M. Letcher, J. L. Scott, and D. A. Paterson. 1st edn (Cambridge: RSC Publishing), 28–45.
Illg, T., Hessel, V., Löb, P., and Schouten, J. C. (2011). Novel Process Window for the Safe and Continuous Synthesis of tert.-butyl Peroxy Pivalate in a Micro-reactor. Chem. Eng. J. 167 (2-3), 504–509. doi:10.1016/j.cej.2010.08.081
Jähnisch, K., Hessel, V., Löwe, H., and Baerns, M. (2004). Chemistry in Microstructured Reactors. Angew. Chem. Int. Ed. 43 (4), 406–446. doi:10.1002/anie.200300577
Lambertus, G. R., Webster, L. P., Braden, T. M., Campbell, B. M., McClary Groh, J., Maloney, T. D., et al. (2019). Development of Universal, Automated Sample Acquisition, Preparation, and Delivery Devices and Methods for Pharmaceutical Applications. Org. Process. Res. Dev. 23, 189–210. doi:10.1021/acs.oprd.8b00280
Ley, S. V., Fitzpatrick, D. E., Ingham, R. J., and Myers, R. M. (2015). Organic Synthesis: March of the Machines. Angew. Chem. Int. Ed. 54, 3449–3464. doi:10.1002/anie.201410744
Morin, M. A., Zhang, W., Mallik, D., and Organ, M. G. (2021). Sampling and Analysis in Flow: The Keys to Smarter, More Controllable, and Sustainable Fine‐Chemical Manufacturing. Angew. Chem. Int. Ed. 60, 2–23. doi:10.1002/anie.202102009
Peper, S., and Dohrn, R. (2012). Sampling from Fluid Mixtures under High Pressure: Review, Case Study and Evaluation. J. Supercrit. Fluids. 66, 2–15. doi:10.1016/j.supflu.2011.09.021
Plutschack, M. B., Pieber, B., Gilmore, K., and Seeberger, P. H. (2017). The Hitchhiker's Guide to Flow Chemistry. Chem. Rev. 117, 11796–11893. doi:10.1021/acs.chemrev.7b00183
Rasheed, M., and Wirth, T. (2011). Intelligent Microflow: Development of Self-Optimizing Reaction Systems. Angew. Chem. Int. Ed. 50, 357–358. doi:10.1002/anie.201006107
Schwedt, G. (1995). Analytische Chemie—Grundlagen Methoden und Praxis. Stuttgart, Germany: Thieme Verlag.
Seredynska, D., Ullrich, G., Wiegand, G., Dahmen, N., and Dinjus, E. (2007). High-Pressure Vapor−Liquid Equilibria for CO2 + Hexanal at (323.15, 353.15, and 383.15) K. J. Chem. Eng. Data. 52, 2284–2287. doi:10.1021/je700303v
Simon, L. L., Pataki, H., Marosi, G., Meemken, F., Hungerbühler, K., Baiker, A., et al. (2015). Assessment of Recent Process Analytical Technology (PAT) Trends: A Multiauthor Review. Org. Process. Res. Dev. 19, 3–62. doi:10.1021/op500261y
Somerville, K., Tilley, M., Li, G., Mallik, D., and Organ, M. G. (2014). A Flow Reactor with Inline Analytics: Design and Implementation. Org. Process. Res. Dev. 18, 1315–1320. doi:10.1021/op5002512
Taylor, C. J., Booth, M., Manson, J. A., Willis, M. J., Clemens, G., Taylor, B. A., et al. (2021). Rapid, Automated Determination of Reaction Models and Kinetic Parameters. Chem. Eng. J. 413, 127017. doi:10.1016/j.cej.2020.127017
Valtz, A., Coquelet, C., and Richon, D. (2004). Vapor-Liquid Equilibrium Data for the Sulfur Dioxide (SO2) + Difluoromethane (R32) System at Temperatures from 288.07 to 403.16 K and at Pressures up to 7.31 MPa. Int. J. Thermophys. 25, 1695–1711. doi:10.1007/s10765-004-7730-9
Wagner, K.-D., Dahmen, N., and Dinjus, E. (2000). Solubility of Triphenylphosphine, Tris(p-Fluorophenyl)phosphine, Tris(pentafluorophenyl)phosphine, and Tris(p-Trifluoromethylphenyl)phosphine in Liquid and Supercritical Carbon Dioxide. J. Chem. Eng. Data. 45, 672–677. doi:10.1021/je9902995
Keywords: flow chemistry, atline analysis, process automation, sampling, process monitoring
Citation: Escribà-Gelonch M, Tran NN and Hessel V (2021) Automated High-Pressure Atline Analysis of Photo-High-P,T Vitamin D3 Microfluidic Synthesis. Front. Chem. Eng. 3:724036. doi: 10.3389/fceng.2021.724036
Received: 11 June 2021; Accepted: 27 July 2021;
Published: 15 September 2021.
Edited by:
Adam Philip Harvey, Newcastle University, United KingdomReviewed by:
Xunli Zhang, University of Southampton, United KingdomCopyright © 2021 Escribà-Gelonch, Tran and Hessel. This is an open-access article distributed under the terms of the Creative Commons Attribution License (CC BY). The use, distribution or reproduction in other forums is permitted, provided the original author(s) and the copyright owner(s) are credited and that the original publication in this journal is cited, in accordance with accepted academic practice. No use, distribution or reproduction is permitted which does not comply with these terms.
*Correspondence: Marc Escribà-Gelonch, bWFyYy5lc2NyaWJhQHVkbC5jYXQ=; Volker Hessel, dm9sa2VyLmhlc3NlbEBhZGVsYWlkZS5lZHUuYXU=
Disclaimer: All claims expressed in this article are solely those of the authors and do not necessarily represent those of their affiliated organizations, or those of the publisher, the editors and the reviewers. Any product that may be evaluated in this article or claim that may be made by its manufacturer is not guaranteed or endorsed by the publisher.
Research integrity at Frontiers
Learn more about the work of our research integrity team to safeguard the quality of each article we publish.