- 1Branch for Bioresources of the Fraunhofer Institute for Molecular Biology and Applied Ecology, Giessen, Germany
- 2Institute of Bioprocess Engineering and Pharmaceutical Technology, University of Applied Sciences Mittelhessen, Giessen, Germany
- 3Faculty of Biology and Chemistry, Justus Liebig University, Giessen, Germany
The characterization of membrane fouling provides valuable information about the performance and operational range of filtration processes. The range of operational parameters for the purification and concentration of protein aggregates from cell lysates by ultrafiltration is determined by evaluating the filtration resistances. We therefore investigated the cross-flow ultrafiltration of ovalbumin (OVA) aggregates with a mean size of 304 nm using a 50 nm cut-off ceramic membrane. We observed a 90% decline in flux within the first 10 min of filtration, demanding an in-depth analysis of membrane fouling. Resistance-in-series analysis revealed that the main filtration resistance originated from the cell lysate in the feed solution. Flux decline was monitored at different transmembrane pressures (TMPs) and concentrations for the most significant fouling phenomenon, indicating that the intermediate pore blocking model correlated best with the observed filtration data. The TMP for purification and concentration was set at 1.5 bar based on the prediction of a limited, mostly pressure-independent flux of 12 L·m−2·h−1 for solutions with an OVA aggregate concentration of 0.5 g·L−1. Higher pressure increased the filtration performance only slightly, but led to a linear increase in filtration resistance. A 10-fold variation in protein aggregate concentration strongly influenced filtration performance, with higher protein concentrations increasing the filtration resistance by 413% and causing an 85% decline in flux.
Introduction
Protein aggregates are often considered as undesirable by-products of recombinant protein production because they tend to be insoluble and inactive, but these amyloid-like protein structures can also provide a valuable resource for protein production (García-Fruitós et al., 2012). Insoluble protein aggregates such as inclusion bodies (IBs) are highly concentrated and relatively pure protein accumulations that are easily recovered from cell lysates due to their particulate nature. The main disadvantage of IBs is the loss of activity caused by incorrect protein folding, necessitating a complex and empirical refolding procedure. However, this can be overcome by the use of pull-down fusion tags, which enable new downstream processing strategies (Hoffmann et al., 2017). For example, IBs with conserved activity have been produced by adding an N-terminal TdoT tag (Diener et al., 2016). Such protein aggregates can also be used to prepare quasi-immobilized enzymes, so-called catalytically-active inclusion bodies (cat-IBs), which offer a cost-effective alternative to classical enzyme immobilization (Krauss et al., 2017). Furthermore, IBs are often produced in bacteria such as Escherichia coli, which require a removal of endotoxins from the target protein (Hoffmann et al., 2019). For some proteins produced in bacteria, post-translational modification is necessary after in vitro refolding to ensure activity, but this is rendered unnecessary by the production of cat-IBs in eukaryotic hosts such as the yeast Yarrowia lipolytica. This well-characterized yeast, in which several enzymes have already been produced recombinantly, is a promising host cell for endotoxin-free protein production in the form of aggregates (Vandermies and Fickers, 2019). The larger size and insolubility of protein aggregates also provide advantages during downstream processing, allowing recovery or purification by centrifugation and/or membrane ultrafiltration, avoiding the need for expensive chromatography steps. This work aimed to develop an inexpensive, simple, and scalable ultrafiltration for the separation and purification of protein aggregates.
Ultrafiltration has been widely used in the food and pharmaceutical industry for the separation and purification of proteins, including processes such as protein concentration or buffer exchange via diafiltration (Charcosset, 2012; Mohammad et al., 2012). However, the efficiency of these steps is limited by flux decline caused by membrane fouling, which has been investigated in detail to determine the underlying mechanisms (Laîné et al., 2003). Interaction between suspended material in the feed and the membrane surface leads to the partial blocking of membrane pores, ultimately causing the severe restriction or even complete abolition of flux. The retention of proteins can also lead to persistent membrane fouling, which limits the reusability of membranes. Membrane cleaning must therefore be considered when selecting a filter matrix. Ceramic membranes are more resistant against mechanical, thermal, and chemical stress than polymeric counterparts. Thermal stability also allows the inactivation of contaminants and even steam sterilization in situ. These advantages ensure the better recovery of membrane performance, making ceramic membranes ideal for ultrafiltration (Abadi et al., 2011). We therefore used a ceramic tubular membrane to investigate fouling phenomena during the filtration of protein aggregates.
Given the diversity of industrial proteins, it is necessary to establish a model protein aggregate system for filtration experiments. Ovalbumin (OVA) is the main protein found in chicken egg white and is well-characterized, with a molecular mass of 44.5 kDa (Strixner and Kulozik, 2011). It has already been applied as a model protein to optimize the ultrafiltration of versatile peroxidase using a ceramic membrane (Busse et al., 2017). At higher temperatures, OVA forms protein aggregates in a manner dependent on protein concentration, salt concentration, and incubation time (Weijers et al., 2003). Therefore, we prepared OVA aggregates by heat treatment and added them to Y. lipolytica cell lysate. Insights gained from the filtration of this model aggregate suspension can be transferred to real systems such as the separation of IBs or cat-IBs.
The composition of the feed plays a key role in the increase of resistance during filtration. Because proteins are macromolecules that adsorb to different surfaces, they contribute significantly to filtration resistance. Depending on the protein size and membrane cut-off, proteins either penetrate the membrane or remain in the retentate. To evaluate the filtration behavior of protein aggregates, the resistance of the feed composition must be analyzed using the resistance-in-series model. Furthermore, fouling phenomena were figured out by fitting the flux with fouling models. In addition, appropriate filtration parameters such as transmembrane pressure (TMP) and working range of protein concentration was also determined to ensure effective purification and concentration.
Theory
Transmembrane pressure is a critical parameter affecting membrane fouling, and is especially important during the ultrafiltration of proteins due to the formation of a gel layer on the membrane surface (Astudillo-Castro, 2015) via a mechanism known as concentration polarization (Clark et al., 1991). Solutes retained by the membrane accumulate and build a mass transfer boundary layer. The difference in osmotic pressure between the boundary layer and the feed solution, also known as backwards diffusion, causes the decline in flux. Concentration polarization is unavoidable due to the retention of solutes, but it is reversible because the accumulated solutes can be removed by mechanical flushing and cleaning to restore filtration performance. Similarly, suspended particles form a deposit on the membrane surface known as the filter cake, which acts as an additional filter barrier. Like concentration polarization, cake formation is a reversible form of fouling because the cake can be mechanically removed (Meng et al., 2009). In contrast, irreversible fouling is caused by the adsorption of molecules and particles to the membrane surface, which resists rinsing or cleaning and thus leads to a sustainable loss of flux by blocking or adsorption on or in the membrane pores (Shi et al., 2014). Flux can therefore be limited by reversible and/or irreversible fouling through various mechanisms that sterically block or narrow membrane pores or form additional mass transfer boundaries (Bruijn et al., 2005). The influence of TMP on the fouling of ceramic membranes during the ultrafiltration of protein aggregates must be determined to describe the membrane fouling mechanism in detail. The resistance-in-series model provides valuable information about the contribution of single resistances to the total filtration resistance, which determines the apparent filtration flux. The major fouling mechanisms can be determined by comparing experimental data to theoretical fouling models.
Resistance-In-Series Model
The ultrafiltration of protein solutions applies pressure as a driving force for the separation. Mass transfer therefor follows Darcy's law, which can be expressed as shown in Equation (1):
Here, the flux (J) is dependent on the TMP, the dynamic viscosity of the feed (η), and the total filtration resistance (Rtotal). Resistance-in-series analysis considers the total filtration resistance as the sum of all partial resistances of different causes, here defined as membrane resistance (RM), gel layer resistance caused by concentration polarization of protein aggregates (Rg), and adsorption resistance from the adsorption of cell lysate proteins to the membrane (Ra). This model has been successfully applied to the filtration of biological solutions containing cells (Fan et al., 2015), viruses (Loewe et al., 2019), and enzymes (Fan et al., 2020). Different approaches to applying resistance-in-series have recently been reviewed extensively (Di Bella and Di Trapani, 2019).
Fouling Modeling
A constant TMP during the filtration of a protein solution leads to a progressive decline in flux due to increasing resistance caused by different fouling phenomena, as shown in Equation (2) (Hermia, 1985).
Here, V is the volume of filtrate collected in time t, and k and n are constants that depend on the fouling mechanism. This approach has been used to model the effect of fouling on ultrafiltration with a ceramic membrane (Nehring et al., 2004). Fouling phenomena can be classified as four different types according to different values of the exponent n.
The formation of filter cake is caused by the deposition of particles on the membrane surface and is expressed by the cake filtration model, in which the filter cake area is a key component of the parameter k. Intermediate pore blocking is caused by the adsorption of molecules onto the membrane and considers the steric blocking of membrane pores, where an adsorbed molecule can either have no direct effect on the pore or cause a partial blockage. Other molecules can attach to the adsorbed molecule to exacerbate the pore blocking. In this model, pores are not necessarily sealed by the adsorbed molecules. Standard pore blocking is also based on adsorption, but in this case the adsorbed molecules limit the pore diameter by attaching to the channel surface. This not only affects membrane flux, but also influences the retention of other solutes. The coverage of the membrane surface increases with time, but the probability of adsorption decreases because the model predicts a monolayer of adsorbed molecules. Complete pore blocking involves the complete occlusion of membrane pores by individual solute molecules, which are large enough to seal the pore and thus prevent further filtration. Complete pore blocking therefore inhibits membrane penetration progressively as more pores are blocked.
Equation (2) has been adapted for cross-flow filtration (Field et al., 1995) as shown in Equation (3).
Here, the time dependent flux (J) can be described as a function of the initial flux (J0), the steady-state flux under equilibrium conditions (Jss), and the model parameter k. Accordingly, characteristic model equations can be derived for the four different fouling phenomena by using values of 0, 1, 1.5, or 2 for n as shown in Equations (4–7) in Table 1.

Table 1. Fouling models for cross-flow filtration, where J = permeate flux, Jss = steady-state permeate flux, J0 = initial permeate flux, and k is a model parameter.
Materials and Methods
Protein Aggregates
Aggregates were prepared using a 1 g·L−1 solution of OVA crude extract (AppliChem, Darmstadt, Germany) in 0.1 M NaCl heated for 24 h at 72°C. The solution was stored at 4°C before use.
Cell Lysate
We grew Y. lipolytica Po1f cells overnight in YPD medium and harvested them by centrifugation at 16,000 g for 20 min. The cell pellet was resuspended to an optical density at 600 nm (OD600) of 100 in 0.1 M NaCl, 10 mM EDTA (pH 6.9). Cells were lysed by high-pressure homogenization (five passes at 1,500 bar) and the lysate was diluted to the desired cell dry weight (CDW) concentration and incubated with 0.01% (w/v) chitosan in 0.1 M acetic acid for 10 min at 300 rpm on a magnetic stirrer. The solution was then allowed to settle for 10 min to precipitate chitosan-bound cell debris. The clarified lysate supernatant (hereafter “lysate”) was then collected for filtration experiments.
Filtration Setup
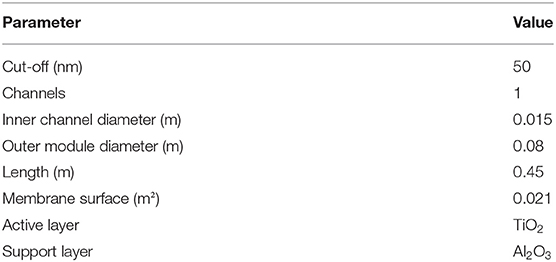
Filtration was carried out using a ceramic monochannel membrane (Atech Innovations, Gladbeck, Germany) with the properties listed in Table 2. To ensure turbulent flow, the cross-flow velocity (CFV) was set to 0.3 m·s−1 and a constant TMP was applied in each experiment. Permeate flux was measured using a PFB 3000-2 electrical balance (Kern & Sohn, Balingen-Frommern, Germany) connected to a laptop with data transfer in LabVision (HiTec Zang, Herzogenrath, Germany) as shown in Figure 1. Permeate was transferred back to the feed tank, so that the system was operated in total recycling mode with a total feed solution volume of 2 L. The permeate was transferred back at a permeate weight of 50 g to ensure the fluctuation of feed concentration <2.5%.
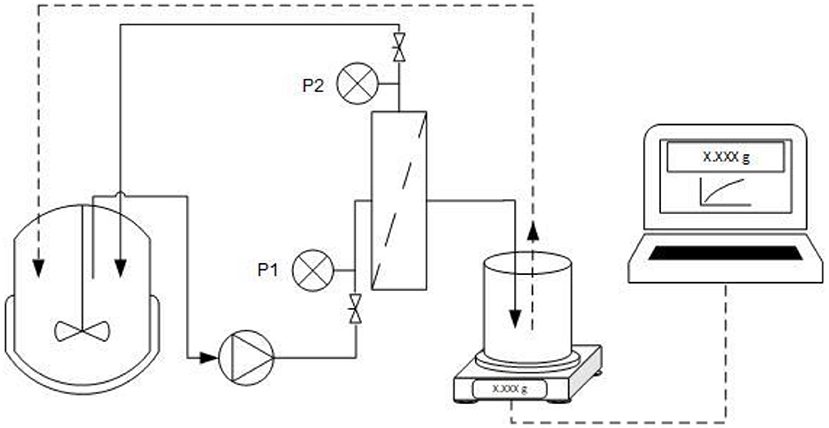
Figure 1. Experimental setup for ultrafiltration. The setup includes pressure indicators (P1 and P2), a balance to determine mass transfer through the membrane, and a computer to record filtrate data. The filtration was operated in total recycling mode with a cross-flow velocity of 0.3 m·s−1.
Membrane Cleaning
Water flux was measured before and after each filtration run to determine whether the membrane permeability was completely restored. The flux could not be restored to the performance of a brand new membrane after the first filtration (data not shown) due to irreversible fouling. Membrane resistance was therefore adapted to the new resistance value as the new target value for cleaning. To remove fouling on the membrane surface, the system was heated to 50°C and flushed with preheated 2% P3 Ultrasil 14 (Ecolab Deutschland, Monheim am Rhein, Germany) for 30 min in total recycling mode. This was repeated with fresh Ultrasil solution at a TMP of 1 bar. The Ultrasil was washed out thoroughly with distilled water. If the membrane resistance was not restored to the level before filtration, 2% citric acid was circulated through the system for 1.5 h at 50°C at a TMP of 1 bar, then washed out with distilled water as above before allowing the system to cool down to 28°C. A resistance within 5% of the original value was considered to represent a cleaned membrane. When not in use, the membrane was stored in 0.1% Ultrasil.
Analytics
The size of OVA protein aggregates was measured by dynamic light scattering using a Zetasizer Nano ZS90 (Malvern Panalytical, Kassel, Germany) and was characterized in terms of size distribution by number. Samples were equilibrated to 28°C in the cuvette for 2 min before triplicate measurements and the calculation of mean values. The kinetic profile of aggregation was characterized by preheating the Zetasizer to 72°C and applying an equilibration time of 2 min to allow heating of the quartz glass cuvette before measurement. For the determination of the zeta potential of OVA aggregates a 1 g·L−1 solution was measured in triplicate at pH 6.9. The protein concentration was determined using a colorimetric assay (Bradford, 1976), with samples prepared in triplicate and measured as described elsewhere (Noble and Bailey, 2009).
Filtration Data Modeling
Filtration data were used to determine the dominant fouling phenomenon according to the equations shown in Table 1. Non-linear curve fitting was carried out using Origin (Origin Lab, Northampton, Massachusetts, USA). The Levenberg-Marquardt algorithm used for fitting, fitted to all filtration experiments until convergence. R2-values were used to estimate the dominant phenomenon. Initial flux (J0), steady-state flux (Jss), and the model parameter (k) were calculated using the fitting model. Deviations between these values and empirical data were used for deeper analysis of the model fits.
Results
Aggregation Kinetics of OVA
The heat-induced aggregation of OVA was characterized by dynamic light scattering. Figure 2A shows the aggregate size as a function of the heating time with a mean aggregate size of 304 nm after 24 h. As previously observed, the aggregation of OVA follows first-order time-dependent kinetics (Weijers et al., 2003). In agreement, we observed time-dependent aggregation when using low OVA concentrations of 1 g·L−1 at high ionic strength and neutral pH. The aggregate size was dependent on temperature, concentration, ionic strength, pH, and heating time. The increase in size due to aggregation also affected the size distribution (Figure 2B). From the sharp distribution of the native protein with a mean size of 25.5 nm, aggregation widened the distribution after 1 h, and resulted in a monomodal size distribution with an average size of 304 nm after heat-induced aggregation for 24 h.
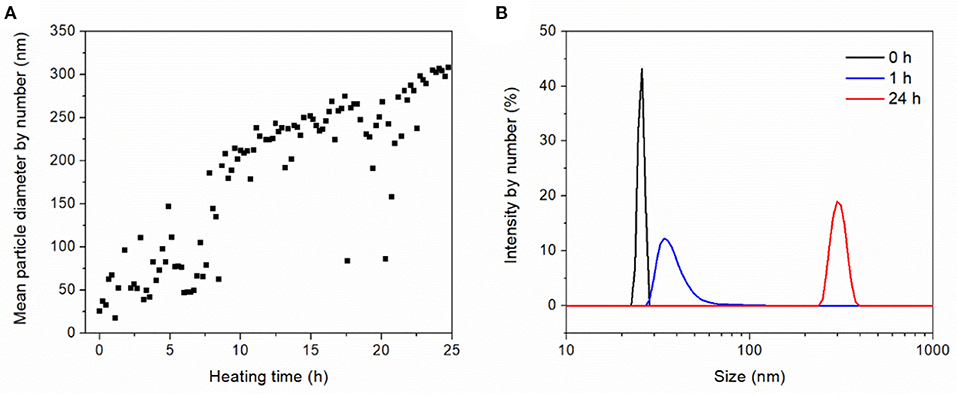
Figure 2. Dynamic light scattering to characterize the heat-induced aggregation behavior of 1 g·L−1 OVA dissolved in 0.1 M NaCl (pH 6.9) and heated in a quartz glass cuvette at 72°C for 25 h. (A) Aggregation kinetics. (B) Size distribution after heating for 0, 1, and 24 h.
Flux Decline During the Purification of Protein Aggregates
The filtration of OVA aggregates in the chitosan-clarified Y. lipolytica cell lysate caused the flux to decline by 90% in the first 10 min (Figure 3). After 2 h, the flux became constant indicating that the fouling phenomena had reached steady-state equilibrium. The flux value declined from 348.37 L·m−2·h−1 at the start of filtration to 14.74 L·m−2·h−1 when this steady-state was achieved. This loss of performance highlights the importance of characterizing membrane fouling during the ultrafiltration of protein aggregates.
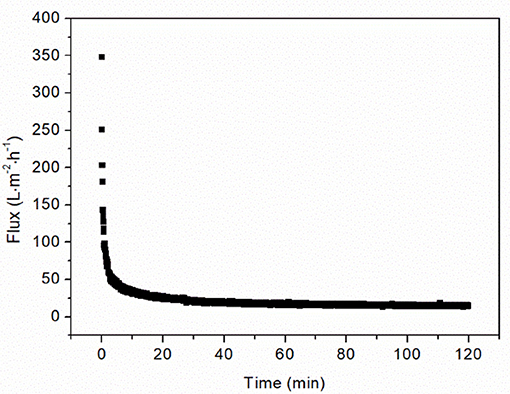
Figure 3. Filtration of 0.5 g·L−1 OVA aggregates in 1 g CDW·L−1 lysate at 1.5 bar TMP using a 50 nm cut-off ceramic membrane.
Resistance-In-Series Analysis
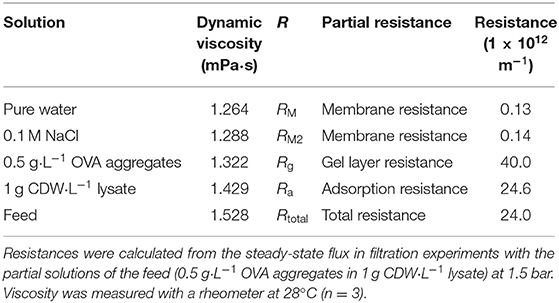
To evaluate the contribution of fouling to the total filtration resistance, the feed solution (0.5 g·L−1 OVA aggregates in 1 g CDW·L−1 lysate) was divided into components with individual expected fouling characteristics. First, the membrane resistance (RM) was determined by the filtration of pure water over the TMP range 0.5–1.5 bar. From the slope of the function, the resistance calculated using Equation (1) was 1.26 ± 0.04 × 10¹¹ m−1. Pure water flux was the criterion used to confirm complete membrane cleaning, so the data from every experiment contributed to this value. The membrane resistance was also determined by the filtration of 0.1 M NaCl (RM2). This second method yielded a comparable membrane resistance, with a minor difference in total resistance. The resistance caused by the gel layer of protein aggregates (Rg) and the adsorption of lysate proteins on the membrane surface (Ra), as well as the total filtration resistance of the feed solution (Rtotal) were calculated from the steady-state fluxes of the corresponding filtrations using Equation (1). Subtraction of the membrane resistance resulted in the partial resistances listed in Table 3.
The highest resistance was recorded for the filtration of OVA aggregates, indicating that the resistance solely caused by aggregates was 67% higher than the total resistance determined in the filtration of aggregates mixed with lysate. The filtration of lysate alone showed nearly the same resistance value as the feed solution. The membrane resistance was two orders of magnitude lower. The fouling caused by OVA aggregates was therefore analyzed in more detail given its dominant effect on the overall resistance.
Influence of TMP on OVA Aggregate Filtration
The steady-state flux increased in a non-linear manner as the TMP increased, heading toward a limit of 12 L·m−2·h−1 (Figure 4). However, there was a linear relationship between TMP and filtration resistance. In order to keep the resistance low while maintaining a high flux, we selected a TMP of 1.5 bar to investigate the influence of aggregate concentration on the filtration flux.
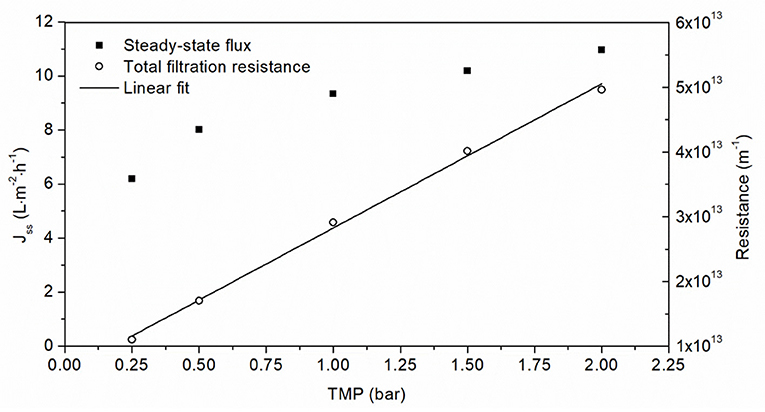
Figure 4. Filtration of 0.5 g·L−1 OVA aggregate solution using a 50 nm cut-off ceramic membrane at different TMPs. The linear fit of total filtration resistance correlated with the TMP (R2 = 0.9988).
Influence of Concentration on OVA Aggregate Filtration
Due to the mechanism of concentration polarization, protein concentration plays a significant role in the formation of the gel layer. For the gel polarization model, steady-state flux is based on the assumption of a gel layer with a constant concentration, which can be determined by linear regression of steady-state flux vs. the logarithmic protein concentration. For our filtration data, there was insufficient fit (adj. R2 = 0.8350) for the logarithmic equation of the gel polarization model (Supplementary Figure 1) but we observed a linear correlation for the double logarithmic plot (Figure 5). The resulting power equation described the steady-state flux as a function of the aggregate concentration with a good correlation (adj. R2 = 0.9988). This equation allowed us to derive operating ranges for the concentration of protein aggregates. For lower concentrations of OVA aggregates, high steady-state fluxes can be achieved. For example, a concentration of 1 g·L−1 resulted in a steady-state flux of 6.68 L·m−2·h−1, whereas higher concentrations would lead to unfavorably low fluxes. The equation indicated that increasing the concentration by a factor of 10 would reduce the flux by 85%.
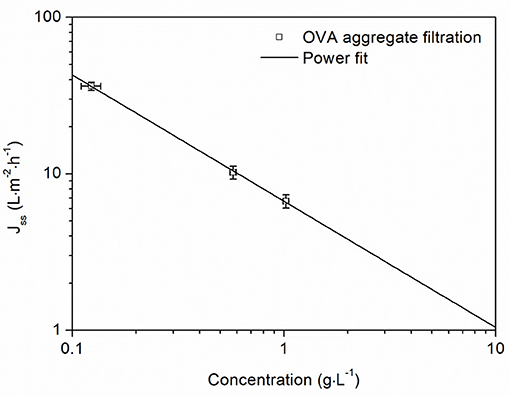
Figure 5. Steady-state flux as a function of OVA aggregate concentration. Vertical error bars are standard deviations from the Bradford assay (n = 3) and horizontal error bars are standard deviations from the average steady-state flux during the last 5 min of filtration. Filtrations were carried out at 1.5 bar TMP and 28°C with a 50 nm cut-off ceramic membrane. The power fit gave the equation Jss = 6.68 × (adj. R2 = 0.9988).
Modeling of Fouling Phenomena
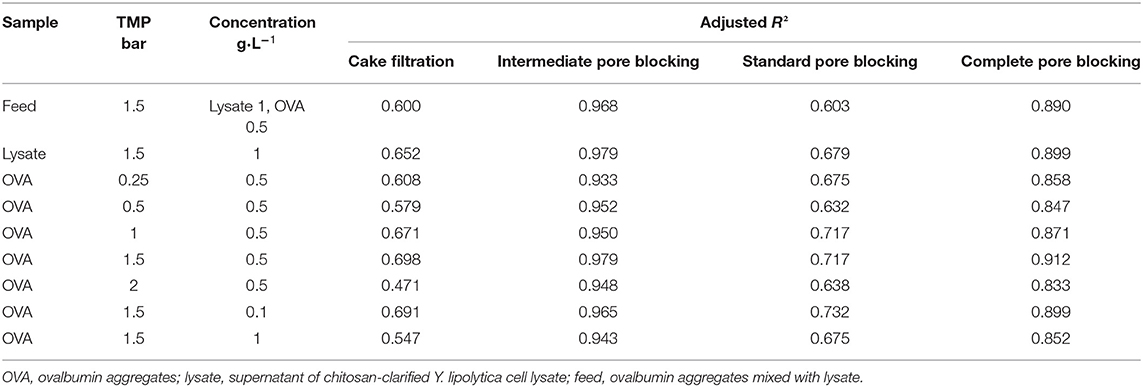
To estimate the contribution of different fouling phenomena, we fitted the equations from Table 1 to the filtration data and calculated the adj. R2-values. To identify the dominant fouling phenomenon, it is only necessary to consider the time period during which most fouling occurs, up to the point at which only minor further changes are detected. Accordingly, only the first 30 min of each filtration was included in the fits. All models reached convergence and the resulting adj. R2-values are presented in Table 4. The intermediate pore blocking model achieved the best fit regardless of the TMP, OVA concentration or feed composition, with adj. R2-values of 0.933–0.979. This provides strong evidence that the reduction in flux we observed was mainly caused by the adsorption of proteins, resulting in the partial blocking of pores. The standard pore blocking and cake filtration models showed poor fits, whereas complete pore blocking achieved a good correlation with adj. R2-values of 0.833–0.912. Figure 6 shows model fits for filtrations with different OVA aggregate concentrations. As the concentration increases from 0.1 to 0.5 g·L−1, the initial flux falls by more than 50% and the steady-state flux falls by 75%. Further doubling of the concentration had little further impact on the initial flux but reduced the steady-state flux by a further 24%. Furthermore, the model parameter k was linearly correlated with the concentration, confirming the faster decline in flux toward the steady-state equilibrium shown in Figure 6.
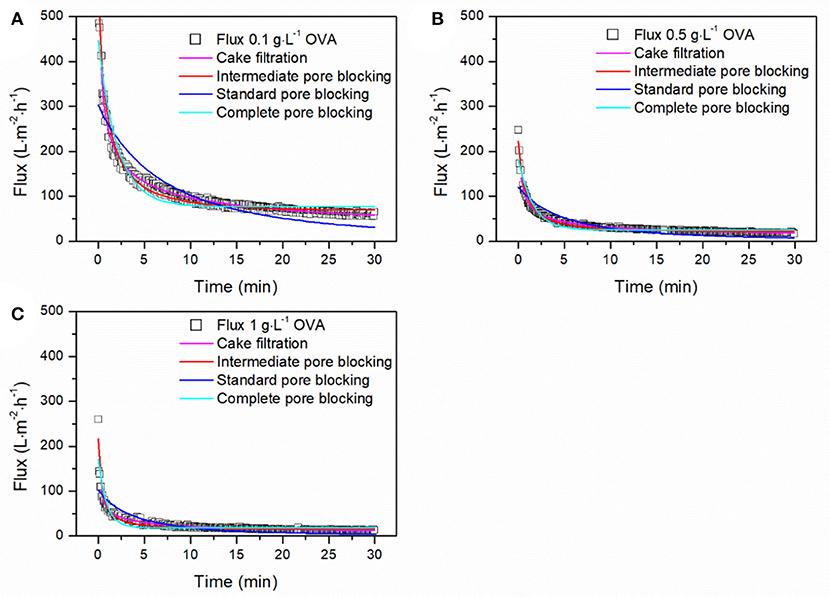
Figure 6. Fitting of fouling models to the filtration data for different concentrations of OVA aggregates. (A) Filtration of 0.1 g·L−1 OVA aggregates. (B) Filtration of 0.5 g·L−1 OVA aggregates. (C) Filtration of 1 g·L−1 OVA aggregates. Filtration was carried out using a 50 nm cut-off ceramic membrane in total recycling mode at 1.5 bar and 28°C.
Discussion
In this study, we prepared and characterized model protein aggregates for ultrafiltration by heat-induced aggregation of OVA. Resistance-in-series model was applied to analyze the limiting factor during the filtration. According to the limiting flux, the operating TMP, and a concentration factor was determined for the filtration. Furthermore, we figured out the predominant fouling mechanism during these filtrations by modeling the filtration using different models.
According to the heat-induced aggregation data of OVA the aggregate size kinetics fluctuated significantly, which is unlikely to solely reflect aggregation. Indeed, this variation may be caused by gas bubbles, which formed on the walls of the heated quartz cuvette. Such bubbles can interfere with light backscattering, causing background noise and signal outliers. Nevertheless, the pattern of increasing aggregate size up to a mean of 304 nm after 24 h was clear, and the monomodal size distribution from 250 to 400 nm (Figure 2B) suggested the OVA aggregates would be fully retained by the 50 nm cut-off membrane. However, protein rejection of 90–100% were measured for the OVA filtrations at different TMPs and concentrations (data not shown), suggesting that a small amount of OVA passed through the membrane. This proportion did not change greatly during filtration, confirming aggregate retention, and stability. One potential explanation for the OVA present in the permeate is the persistence of a constant fraction of monomers that resist heat-induced denaturation, previously estimated to represent 20–27% of the total depending on the batch (Weijers et al., 2002). However, our particle size distribution data suggested complete aggregation (Figure 2B). Alternatively, some of the aggregates may be unstable, allowing them to deform under pressure or partially break apart under shear stress, to the start of filtration. The drop in flux caused by the aggregate suspension demanded further investigation because the flux declined to a stable 4.2% of the initial value after filtration for 2 h (Figure 3).
To evaluate the origin of the increasing filtration resistance, the single components of the feed solution were examined individually in order to develop a resistance-in-series model. With a partial resistance of 40.0 ± 6.4 × 10¹² m−1, OVA aggregates caused the greatest increase in filtration resistance of all components. In comparison, the membrane resistance played a minor role. Unexpectedly, the resistance of the OVA aggregates alone exceeded the total filtration resistance by 67%. However, the total filtration resistance was very similar to the individual resistance of the lysate. A total filtration resistance of 24 ± 2.1 × 10¹² m−1 is within the expected order of magnitude comparing the resistance range of 2.3–8.5 × 10¹² m−1 reported for the ultrafiltration of aqueous egg white solution with a 150 kDa ceramic membrane at different TMPs and CFVs (Borysiak and Gietz, 2018). Without the retention of protein aggregates, the filtration resistance is expected to be lower than the values determined in our study. Comparable filtration resistances have also been described for the ultrafiltration of enzyme solutions (Fan et al., 2020). However, our values indicate that the resistance-in-series model cannot be applied in this simplified manner to the problem described herein because two fouling types (Rg and Ra) each describe the interaction of proteins with the membrane surface, and superposition can occur when they are considered together. Given their potential higher affinity for the membrane, soluble proteins in the lysate could help to block the attachment of larger protein aggregates to the membrane and thus avoid the additional resistance. Alternatively, the soluble proteins in the lysate could adsorb to the OVA aggregates and thus increase flux, as reported for the filtration of microspheres with bovine serum albumin (Choi et al., 2000). Protein loss during filtration supports this behavior, because the protein mass lost by adsorption was slightly greater for lysate filtration containing OVA aggregates than the pure lysate solution. This is consistent with the observed adsorption of OVA during ultrafiltration with polymer membranes (Nabetani et al., 1990). For pure OVA aggregate solutions, protein loss was higher and highly dependent on the filtration parameters (5.5–23.0 g·m−2). Nevertheless, the resistance analyses revealed that the lysate solution was the main contributor to the total filtration resistance, given that resistance deviated by only 2.5%. Accordingly, the flux during the filtration of OVA aggregates from the lysate settled to a steady-state value of 14.74 L·m−2·h−1 for the concentrations described. Because OVA aggregates become purer and the adsorption/desorption equilibrium for lysate proteins on the membrane surface shifts, the steady-state flux can increasingly shift toward that for a pure OVA aggregate solution. In conclusion, during the purification of OVA aggregates from the lysate, the steady-state flux should be 10.20–14.74 L·m−2·h−1.
We next investigated the relationship between flux and TMP. The ultrafiltration of solutions that build a gel layer is usually carried out at the critical TMP, which is the transition between linear and non-linear behavior (Astudillo-Castro, 2015). For lower pressures flux increases linearly with increasing TMP until the critical TMP, beyond which further increases in TMP influence mass transfer and elicit a non-linear increase in flux due to the increasing impact of fouling (Field, 2010). The flux at the critical TMP is known as the critical flux, and a distinction is made between strong and weak forms of critical flux. The weak form is characterized by a gradual transition from the linear pressure-dependent range to the pressure-independent region (Bacchin et al., 2005). A linear change in flux is not apparent in Figure 4, suggesting that fouling already applies at low TMPs (≤0.25 bar) during the ultrafiltration of OVA aggregates. Given the absence of a pressure-dependent range, it was not possible to determine the critical TMP and the flux in this range would in any case be too low for consideration as a practical working point. The fluxes driven by the TMPs applied in Figure 4 follow weak forms of critical flux and cover the transition region to the pressure-independent steady-state flux. These flux values tend toward a maximum of 12 L·m−2·h−1, which was confirmed by extrapolation of the linear increase in filtration resistance that can be used to calculate the steady-state flux. The same linear resistance behavior was observed for the ultrafiltration of another protein solution in the same pressure range (Fan et al., 2020). An increase in TMP with a non-linear increase in confined flow and a concomitant linear increase in filtration resistance indicates that lower pressures are beneficial for the filtration of OVA aggregates. Furthermore, higher TMPs can cause the loss of enzyme activity, which would be incompatible with cat-IB purification applications (Burghardt et al., 2019). Higher TMPs can also promote the formation of a fouling layer, causing more protein retention and inhibiting protein purification (Thomassen et al., 2005). In contrast, lower pressures extend the purification time or require a greater membrane surface area. Therefore, we selected a TMP of 1.5 bar as a compromise between filtration resistance and flux.
For the concentration of protein aggregates, fluxes at different protein concentrations showed a strong influence on aggregate concentrations. The gel polarization model did not fit the recorded data sufficiently. Indeed, the estimated gel concentration from the logarithmic fit often fails to match the real values (Clark et al., 1991). On the other hand, the power fit from Figure 5 describes a less idealistic and more realistic flux behavior, which is severely limited by the protein concentration but not completely blocked. According to this equation, a 10-fold increase in the protein concentration causes an 85% reduction in flux. For lower concentration ranges, this approach would be ideal because the steady-state flux remains high, but for protein concentrations of 0.5 g·L−1 or more the loss of flux becomes increasingly challenging. In summary, when concentrating protein aggregates, the concentration factor must be adjusted to match the aggregate concentration of the solution in order to avoid undesirably low fluxes. This limits the working range, but avoids long filtration times. Therefore, a concentration of 2 g·L−1 appears to be an effective operational limit.
The testing of different filtration models showed that intermediate pore blocking was the dominant fouling phenomenon during the filtration of OVA aggregates. This supports the resistance-in-series analysis of membrane fouling and the theory of superimposed adsorption in the feed solution. The data from the intermediate pore blocking model generated values that were closer to the anticipated values for Jss and J0 for the filtration of different concentrations than expected from the empirical data (data not shown). Because they were not subject to fluctuations, the modeled values revealed even clearer patterns for flux decline. A good correlation with the complete blocking model suggested that the adsorption of proteins to the membrane not only partially blocks the pores, as described in the intermediate pore blocking model, but can also seal the pores to a significant degree.
All filtrations were carried out at neutral pH to avoid the strong adsorption of proteins that occurs at the isoelectric point (Clark et al., 1991). Similarly, a change in pH would affect the zeta potential of the OVA aggregate and the surface charge of the TiO2/Al2O3 membrane. The zeta potential of the protein aggregates in a 0.1 M NaCl solution at pH 6.9 was −11.7 ± 0.25 mV. However, electrostatic interaction with the membrane surface is not expected to be the driving force for adsorption, as a zeta potential of −50 mV at pH 6 was reported for a comparable membrane (Joachim, 2020). Nevertheless, we propose that the adsorption of protein aggregates makes the most significant contribution to membrane fouling. To our knowledge, the mechanism of fouling during the ultrafiltration of protein aggregates has not been investigated in detail. Our modeling results provide insight into this process, yielding critical information for the further optimization of filtration parameters such as the selection of membrane cut-off values, operating conditions, and the cleaning strategy. Particularly in view of an industrial application of this purification technique, these factors should be further investigated in order to reduce adsorption and thus fouling and to achieve a better performance of the process. For the low fluxes determined for purification and concentration, an increase in membrane surface area is necessary to limit filtration time. However, the easy scalability of the membrane surface of tubular membranes in the form of multichannel or hollow fiber membranes also leads to the disadvantage of higher protein loss due to adsorption on the membrane surface, which means significant losses in an industrial scale application. Likewise, the cleaning of the membrane would be facilitated and thus also the service life shortened.
Conclusion
We successfully used a 50 nm cut-off ceramic membrane to recover and separate heat-induced aggregates of OVA from a mixture of protein aggregates and cell lysate. Resistance-in-series modeling suggested that proteins in the lysate interact with OVA aggregates to reduce the filtration resistance. We also found that the filtration of cell lysates containing protein aggregates was predominantly limited by fouling driven by the intermediate pore blocking mechanism. Accordingly, a steady-state flux of 10.20–14.74 L·m−2·h−1 at a TMP of 1.5 bar was predicted for the purification of OVA aggregates from the lysate. The dependence of flux on the OVA aggregate concentration was expressed using a power equation, which revealed that increasing the concentration by a factor of 10 causes the flux to decline by 85%. The concentration factor must therefore be adjusted to match the aggregate concentration of the solution to avoid undesirably low fluxes. For purification, the protein concentration should be set below 0.5 g·L−1 to guarantee fluxes exceeding 10 L·m−2·h−1. For concentration, the aggregate solution should not exceed a concentration of 2 g·L−1 to ensure that the steady-state flux remains above 3 L·m−2·h−1 and thus avoids a need for extended filtration durations. Given the observed flux reducing phenomena and correlations, we concluded that protein adsorption to the membrane surface is the key mechanism contributing to filtration resistance. To reduce adsorption, future experiments should address the role of pH, salt concentration and CFV to control adsorption and the formation of a gel layer by OVA aggregates (Bacchin et al., 2002; Zhao et al., 2005; Nakamura and Matsumoto, 2006).
Data Availability Statement
The raw data supporting the conclusions of this article will be made available by the authors, without undue reservation.
Author Contributions
OB conceived and designed the experiments, and wrote the paper. FF assisted in the experiments. ME, RF, and PC helped to draft and revise the manuscript, and supervised the research. All authors contributed to the article and approved the submitted version.
Funding
This research was funded by the Hessian State Ministry of Higher Education, Research, Science and the Arts within the state offensive for the development of scientific and economic excellence (LOEWE-Program).
Conflict of Interest
The authors declare that the research was conducted in the absence of any commercial or financial relationships that could be construed as a potential conflict of interest.
Supplementary Material
The Supplementary Material for this article can be found online at: https://www.frontiersin.org/articles/10.3389/fceng.2021.656345/full#supplementary-material
Supplementary Figure 1. Steady-state flux as a function of OVA aggregate concentration. Vertical error bars are standard deviations from the Bradford assay (n = 3) and horizontal error bars are standard deviations from the average steady-state flux during the last 5 min of filtration. Filtrations were carried out at 1.5 bar TMP and 28°C with a 50 nm cut-off ceramic membrane. The power fit of the gel polarization model gave the equation Jss =12.5 × ln(1.6/cOVA) with a correlation of adj. R2 = 0.8350.
References
Abadi, S. R. H., Sebzari, M. R., Hemati, M., Rekabdar, F., and Mohammadi, T. (2011). Ceramic membrane performance in microfiltration of oily wastewater. Desalination 265, 222–228. doi: 10.1016/j.desal.2010.07.055
Astudillo-Castro, C. L. (2015). Limiting flux and critical transmembrane pressure determination using an exponential model: the effect of concentration factor, temperature, and cross-flow velocity during casein micelle concentration by microfiltration. Ind. Eng. Chem. Res. 54, 414–425. doi: 10.1021/ie5033292
Bacchin, P., Espinasse, B., and Aimar, P. (2005). Distributions of critical flux: modelling, experimental analysis and consequences for cross-flow membrane filtration. J. Memb. Sci. 250, 223–234. doi: 10.1016/j.memsci.2004.10.033
Bacchin, P., Si-Hassen, D., Starov, V., Clifton, M., and Aimar, P. (2002). A unifying model for concentration polarization, gel-layer formation and particle deposition in cross-flow membrane filtration of colloidal suspensions. Chem. Eng. Sci. 57, 77–91. doi: 10.1016/S0009-2509(01)00316-5
Borysiak, M., and Gietz, D. (2018). Ceramic membrane fouling in ultrafiltration process of chicken egg white aqueous solution. Chem. Process Eng. 39, 295–308. doi: 10.24425/122951
Bradford, M. M. (1976). A rapid and sensitive method for the quantitation of microgram quantities of protein utilizing the principle of protein-dye binding. Anal. Biochem. 72, 248–254. doi: 10.1016/0003-2697(76)90527-3
Bruijn, J., de Salazar, F. N., and Bórquez, R. (2005). Membrane blocking in ultrafiltration. Food Bioprod. Process. 83, 211–219. doi: 10.1205/fbp.04012
Burghardt, J. P., Coletta, L. A., van der Bolt, R., Ebrahimi, M., Gerlach, D., and Czermak, P. (2019). Development and characterization of an enzyme membrane reactor for fructo-oligosaccharide production. Membranes 9:148. doi: 10.3390/membranes9110148
Busse, N., Kraume, M., and Czermak, P. (2017). Optimal permeate flux for an enzymatic oxidation of technical lignins in a membrane reactor. Sep. Sci. Technol. 52, 374–380. doi: 10.1080/01496395.2016.1213748
Charcosset, C. (2012). “Ultrafiltration,” in Membrane Processes in Biotechnology and Pharmaceutics, ed C. Charcosset (Burlington, VT: Elsevier Science), 43–99.
Choi, S.-W., Yoon, J.-Y., Haam, S., Jung, J.-K., Kim, J.-H., and Kim, W.-S. (2000). Modeling of the permeate flux during microfiltration of BSA-adsorbed microspheres in a stirred cell. J. Colloid Interface Sci. 228, 270–278. doi: 10.1006/jcis.2000.6940
Clark, W. M., Bansal, A., Sontakke, M., and Ma, Y. H. (1991). Protein adsorption and fouling in ceramic ultrafiltration membranes. J. Memb. Sci. 55, 21–38. doi: 10.1016/S0376-7388(00)82325-X
Di Bella, G., and Di Trapani, D. (2019). A brief review on the resistance-in-series Model in Membrane Bioreactors (MBRs). Membranes 9:24. doi: 10.3390/membranes9020024
Diener, M., Kopka, B., Pohl, M., Jaeger, K.-E., and Krauss, U. (2016). Fusion of a coiled-coil domain facilitates the high-level production of catalytically active enzyme inclusion bodies. ChemCatChem 8, 142–152. doi: 10.1002/cctc.201501001
Fan, R., Burghardt, J. P., Prell, F., Zorn, H., and Czermak, P. (2020). Production and purification of fructo-oligosaccharides using an enzyme membrane bioreactor and subsequent fermentation with probiotic Bacillus coagulans. Sep. Purif. Technol. 251:117291. doi: 10.1016/j.seppur.2020.117291
Fan, R., Ebrahimi, M., Quitmann, H., and Czermak, P. (2015). Lactic acid production in a membrane bioreactor system with thermophilic Bacillus coagulans: fouling analysis of the used ceramic membranes. Sep. Sci. Technol. 50, 2177–2189. doi: 10.1080/01496395.2015.1031401
Field, R. (2010). “Fundamentals of fouling,” in Membranes for Water Treatment, eds K.-V. Peinemann and S. Pereira Nunes (Weinheim: Wiley-VCH), 1–23.
Field, R., Wu, D., Howell, J. A., and Gupta, B. B. (1995). Critical flux concept for microfiltration fouling. J. Memb. Sci. 100, 259–272. doi: 10.1016/0376-7388(94)00265-Z
García-Fruitós, E., Vázquez, E., Díez-Gil, C., Corchero, J. L., Seras-Franzoso, J., Ratera, I., et al. (2012). Bacterial inclusion bodies: making gold from waste. Trends Biotechnol. 30, 65–70. doi: 10.1016/j.tibtech.2011.09.003
Hermia, J. (1985). “Blocking filtration. application to non-newtonian fluids,” in Mathematical Models and Design Methods in Solid-Liquid Separation, ed A. Rushton (Dordrecht: Springer), 83–89.
Hoffmann, D., Ebrahimi, M., Gerlach, D., Salzig, D., and Czermak, P. (2017). Reassessment of inclusion body-based production as a versatile opportunity for difficult-to-express recombinant proteins. Crit. Rev. Biotechnol. 38, 729–744. doi: 10.1080/07388551.2017.1398134
Hoffmann, D., Eckhardt, D., Gerlach, D., Vilcinskas, A., and Czermak, P. (2019). Downstream processing of Cry4AaCter-induced inclusion bodies containing insect-derived antimicrobial peptides produced in Escherichia coli. Protein Expr. Purif. 155, 120–129. doi: 10.1016/j.pep.2018.12.002
Joachim, M. (2020). Prozessintensivierung der Rekombinanten Herstellung und Neuartigen Membranbasierten Aufreinigung Eines Elastin-Like-Polypeptid Gekoppelten Antimikrobiellen Peptids. Düren: Shaker Verlag. doi: 10.2370/9783844074567
Krauss, U., Jäger, V. D., Diener, M., Pohl, M., and Jaeger, K.-E. (2017). Catalytically-active inclusion bodies-carrier-free protein immobilizates for application in biotechnology and biomedicine. J. Biotechnol. 258, 136–147. doi: 10.1016/j.jbiotec.2017.04.033
Laîné, J.-M., Campos, C., Baudin, I., and Janex, M.-L. (2003). Understanding membrane fouling: a review of over a decade of research. Water Supply 3, 155–164. doi: 10.2166/ws.2003.0162
Loewe, D., Grein, T. A., Dieken, H., Weidner, T., Salzig, D., and Czermak, P. (2019). Tangential flow filtration for the concentration of oncolytic measles virus: the influence of filter properties and the cell culture medium. Membranes 9:160. doi: 10.3390/membranes9120160
Meng, F., Chae, S.-R., Drews, A., Kraume, M., Shin, H.-S., and Yang, F. (2009). Recent advances in membrane bioreactors (MBRs): membrane fouling and membrane material. Water Res. 43, 1489–1512. doi: 10.1016/j.watres.2008.12.044
Mohammad, A. W., Ng, C. Y., Lim, Y. P., and Ng, G. H. (2012). Ultrafiltration in food processing industry: review on application, membrane fouling, and fouling control. Food Bioprocess Technol. 5, 1143–1156. doi: 10.1007/s11947-012-0806-9
Nabetani, H., Nakajima, M., Watanabe, A., Nakao, S.-I., and Kimura, S. (1990). Effects of osmotic pressure and adsorption on ultrafiltration of ovalbumin. AIChE J. 36, 907–915. doi: 10.1002/aic.690360612
Nakamura, K., and Matsumoto, K. (2006). Properties of protein adsorption onto pore surface during microfiltration: effects of solution environment and membrane hydrophobicity. J. Memb. Sci. 280, 363–374. doi: 10.1016/j.memsci.2006.01.039
Nehring, D., Gonzalez, R., Pörtner, R., and Cermak, P. (2004). Experimental and modeling study of a membrane filtration process using ceramic membranes to increase retroviral pseudotype vector titer. J. Memb. Sci. 237, 25–38. doi: 10.1016/j.memsci.2004.02.027
Noble, J. E., and Bailey, M. J. (2009). “Quantitation of protein, Chapter 8,” in Guide to Protein Purification, eds R. R. Burgess and M. P. Deutscher (San Diego, CA: Elsevier Academic Press), 73–95.
Shi, X., Tal, G., Hankins, N. P., and Gitis, V. (2014). Fouling and cleaning of ultrafiltration membranes: a review. J. Water Process Eng. 1, 121–138. doi: 10.1016/j.jwpe.2014.04.003
Strixner, T., and Kulozik, U. (2011). “Egg proteins,” in Handbook of Food Proteins, eds G. O. Phillips and P. A. Williams (Cambridge: Woodhead Pub), 150–209.
Thomassen, J. K., Faraday, D., Underwood, B. O., and Cleaver, J. (2005). The effect of varying transmembrane pressure and crossflow velocity on the microfiltration fouling of a model beer. Sep. Purific. Technol. 41, 91–100. doi: 10.1016/j.seppur.2004.05.002
Vandermies, M., and Fickers, P. (2019). Bioreactor-scale strategies for the production of recombinant protein in the yeast Yarrowia lipolytica. Microorganisms 7:40. doi: 10.3390/microorganisms7020040
Weijers, M., Barneveld, P. A., Cohen Stuart, M. A., and Visschers, R. W. (2003). Heat-induced denaturation and aggregation of ovalbumin at neutral pH described by irreversible first-order kinetics. Protein Sci. 12, 2693–2703. doi: 10.1110/ps.03242803
Weijers, M., Visschers, R. W., and Nicolai, T. (2002). Light scattering study of heat-induced aggregation and gelation of ovalbumin. Macromolecules 35, 4753–4762. doi: 10.1021/ma0120198
Keywords: ultrafiltration, ceramic membrane, membrane fouling, resistance-in-series, protein aggregates, ovalbumin
Citation: Birrenbach O, Faust F, Ebrahimi M, Fan R and Czermak P (2021) Recovery and Purification of Protein Aggregates From Cell Lysates Using Ceramic Membranes: Fouling Analysis and Modeling of Ultrafiltration. Front. Chem. Eng. 3:656345. doi: 10.3389/fceng.2021.656345
Received: 20 January 2021; Accepted: 01 March 2021;
Published: 19 March 2021.
Edited by:
Frank Lipnizki, Lund University, SwedenReviewed by:
Luca Fortunato, King Abdullah University of Science and Technology, Saudi ArabiaJingwei Wang, Beijing Normal University, China
Copyright © 2021 Birrenbach, Faust, Ebrahimi, Fan and Czermak. This is an open-access article distributed under the terms of the Creative Commons Attribution License (CC BY). The use, distribution or reproduction in other forums is permitted, provided the original author(s) and the copyright owner(s) are credited and that the original publication in this journal is cited, in accordance with accepted academic practice. No use, distribution or reproduction is permitted which does not comply with these terms.
*Correspondence: Peter Czermak, cGV0ZXIuY3plcm1ha0Bsc2UudGhtLmRl; Rong Fan, cm9uZy5mYW5AbHNlLnRobS5kZQ==
 Oliver Birrenbach
 Frederik Faust
 Mehrdad Ebrahimi2
 Rong Fan
 Peter Czermak