- 1Department of Process Analysis and Plant Design, National Technical University of Athens (NTUA), Athens, Greece
- 2Department of Engineering, Aarhus University (AU), Aarhus, Denmark
- 3Compagnie Industrielle de la Matière Végétale (CIMV), Toulouse, France
Biorefinery processes are challenged to make effective use of commercial flowsheeting software. Challenges include the lack of property data, complexity of raw materials, and emerging non-conventional processes and technologies. Surrogate models could assist by combining data-based models (by means of surrogate models) with conventional models available from flowsheeting vendors. The challenge would be to translate experimental data into property and process parameters compatible with models used by commercial software. The paper introduces an iterative approach for the systematic evaluation of such parameters. Degrees of freedom include options for pseudo-components, thermodynamic methods, and process models. The approach is applied for the modeling of a real-life biorefinery. Three case studies demonstrate the potential of the proposed scheme. The first case study has fixed options for the property and process models, while the second one has them as a degree of freedom. The third case study extrapolates the resulted metamodels to different capacities and six different feedstock types (wheat and rice straw, wood, sugarcane bagasse, banana stem, and miscanthus). Degrees of freedom expand as the cases address limited options for surrogate models, gradually incorporating additional options and, apparently, better regression results. The proposed framework could embed additional levels of sophistication using machine learning and artificial intelligence technology. The emphasis of the paper stands on the methodological framework and its demonstration with real-life examples.
Introduction
Biorefineries are promising developments for the sustainable production of food, energy, chemicals, and materials. Renewable biomass has many sources and types, including algae, agricultural, industrial, municipal, or animal waste (Vassilev et al., 2010). New technologies and new thermo-, bio-, or physico-chemical conversion paths are introduced to handle these complex and non-conventional substrates. Effectively, new products arise from these new raw materials and processing paths. Notably, a portfolio on combinations of feedstocks, technologies, and products will contain virtually an unlimited number of cases. Technological innovation, cost-efficient value chains, and sustainability are some of the challenges biorefineries have to tackle to reach industrial scale (Tursi, 2019). Process modeling integrated with optimization tools assist in the systematic analysis of supply chain, process optimization, technological alternatives, and product portfolios (RENESENG, 2018). The development of a reliable simulation model is the first step in a series of evaluation and optimization studies.
An increased number of new methods are reviewed in early-stage studies, heavily depending on flowsheeting technology (Aristizábal-Marulanda and Cardona-Alzate, 2019; De Buck et al., 2020). Moreover, there is a strong incentive to capitalize on existing technology (Ng et al., 2015). However, process modeling for biorefining processes is still facing challenges due to lack of property data, complexity of raw materials, and a constant influx of new processes and technologies (Aristizábal-Marulanda and Cardona-Alzate, 2019; De Buck et al., 2020). Data originate from a variety of sources (experimental vs. literature) and are available at different levels of confidence, especially when dealing with processes at a low technology readiness level. By a similar token, biomass is a complex complex substance of varying composition and stream properties that would need to adjust with experiments. The selection of the appropriate models still hinges on the design engineer (Upreti, 2017).
Surrogate models by means of black-box models are developed outside the remits of biorefineries. Existing methods can be generic, by fitting the fine model directly (e.g., by polynomial models), or by getting trained to fit the data (e.g., by artificial neural networks) (Li et al., 2010; Alizadeh et al., 2020). In biorefining, large-scale problems, intelligent sampling, flexibility, and uncertainty are some of the major challenges surrogate modeling has to tackle (Chen et al., 2006; Wang and Shan, 2007; Bhosekar and Ierapetritou, 2018). Caballero and Grossmann (2008) presented a methodology for the rigorous optimization of non-linear programming problems in which the objective function and/or some constraints were noisy implicit black-box functions. They substituted the black-box modules by metamodels based on kriging interpolation and used a refining stage and successive bound contraction in the domain of independent variables until reaching the acceptable accuracy level. Boukouvala and Ierapetritou (2013) combined surrogate-based optimization tools, black-box feasibility, and noise-handling tools to optimize expensive, noisy flowsheet models. Boukouvala and Floudas (2017) presented an algorithmic optimization framework that combines variable selection, bounds tightening, and constrained sampling techniques to develop accurate surrogate representations of unknown equations. Bergamini et al. (2019) introduced a method to identify systematically process parameters that need precise measurements and reduce the data acquisition time. Hao et al. (2020) integrated simulation data and monotonicity knowledge through Bayesian optimization to reduce the required number of computer simulations for finding the optimal design solution.
Nevertheless, intelligent sampling should be adjusted to the nature of the problem so as to generate a minimum number of sampling points to reflect the real “black-box” function in areas of interest. New modeling and decomposition techniques are required to address problems with a large number of design variables. Flexible and generic metamodeling approaches are needed to deal with the variable fidelity across the design space. Hüllen et al. (2020) identified the open challenges in surrogate-based optimization as (i) sampling techniques, (ii) model development, (iii) training, (iv) validation, and (v) sample-fit-validate adaptive algorithms. However, property and process parameters are ignored, even though they represent useful knowledge to exploit. The quality of the simulation model and, consequently, the quality of the metamodel depends on the successful physical and chemical representation of the real system. Existing methodologies are deprived of property-based parameters and deviate from engineering principles that are useful to retain in the model. Simulation software and libraries are not integrated into the metamodeling approach. Moreover, problems with mixed discrete and continuous variables are not sufficiently studied.
This paper introduces a generic approach to develop surrogate models for biorefining processes by integrating first-principle knowledge. The representation of the problem, the mathematical formulation, and the proposed methodology are presented in the next section. The background process and the options for the property and process models are discussed in Section Materials and Background Process. The framework is applied for the modeling of a real-life lignocellulosic organosolv technology developed by Compagnie Industrielle de la Matière Végétale (CIMV). Three case studies demonstrate the potential of the suggested procedure. The first case study has fixed options for the property and process models, while the second one has them as a degree of freedom. The third case study extrapolates the resulted metamodels to different capacities and feedstock types. The final metamodels of the CIMV process are available for the reader to use.
Methods
This section introduces the representation of the problem, the mathematical formulation, and the proposed methodology. The systematic framework involves an iterative procedure that gradually increases the complexity of the system used for the development of the surrogate model. Initially, a simulation model is created to obtain the values of the process and property variables that were previously unknown. These variables relate to the process and property effects. Next, a surrogate model is developed to describe the simulation model. Different experiments are performed by regressing the surrogate model with the same parameters as the ones used in the simulation. If the discrepancy between the experimental and the surrogate values is not as small as desired, then additional details or subprocesses are incorporated. Finally, an optimization problem monitors the convergence of the iterative procedure and evaluates the feasible region within which the models can be used.
Problem Representation
From a systems perspective, a flowsheet is an ordered combination of process units that transforms incoming material, energy, and information streams to new output streams, which continue as feed streams to other process units. A process unit (i) stands for a piece of equipment or a process step that integrates the property and the process system. A component (j) stands for material (e.g., water, cellulose) that enters or exits a process unit, while m identifies which components can be present in process unit i. An ordered list (Lij) of components includes all the alternative representations (e.g., conventional, user-defined) and pseudo-components used to simulate complex materials present in a process unit. The property system consists of components and thermodynamic models . Property model parameters include the parameters used by the thermodynamic models (e.g., critical temperature, heat of formation). The process system comprises unit operation models (Qi) and operating parameters. Process model parameters include parameters used by the process units (e.g., operating temperature, efficiency).
Let the following sets stand for:
I = { i| process units}
J = { j| components}
Let
M = {m| represents all components j that are present in process unit} ≡ [JxI]
The discrete variables of the problem are:
Qi Candidate models in I
Candidate models in J
Lm = Lij Ordered list of components j–in I, where i, j ∈ M
The binary variables of the problem are:
zi For the choices in Qi
ẑj For the choices in
The continuous variables of the problem are:
uj Property model parameters related to component j
pi Process model parameters related to process unit i
xij Input stream for each process unit i
yij Output stream for each process unit i
Let also the set of constraints be:
hi Mass/energy balances
gj Thermodynamic calculations
Streams entering a process unit are transformed to exit streams by the combined effect of the property and process systems (Figure 1).
Let us postulate a surrogate model for the regression of a process unit.
where
hi = hi(xij, pi) mass/energy balances for each jϵM
gj = gj(xij, uj) property models for each jϵM
Given is a set of:
• Processes and components M
• Candidate process and property models
• Experimental data to regress
The objective is to compose surrogates for each process by selecting:
• Models and parameters
• Existing components in Lm
so as to minimize the error between the surrogates and the experimental data. The degrees of freedom of the model are the number of the selected components from the list Lm, the selection of the thermodynamic model and its parameters uj, and the selection of the process model Qi and its parameters pi.
The mathematical formulation takes the form:
For a given choice of process and property models (e.g., for a known flowsheet model), (Π) reduces to (Π′):
The Inner-Outer Regression Cycle
The optimization problem for the development of the surrogates can be decomposed into two subproblems. The first one considers the characteristics of the property system, and the second one considers the characteristics of the process system. The inner-outer regression cycle is the iterative procedure to solve those two subproblems. The outer cycle selects the Qi, which relates to unit operation models available for use (discrete options). Each process unit i has ui parameters to optimize. The selection of ui has a continuous nature as it relates to model parameters and flowrates that regress available experimental data. The inner cycle selects the , which relates to thermodynamic models available to use (discrete options). The selection in gj relates to Lm components available to use (discrete options). Given that gj are typically procedural models (e.g., external subroutines called by mass/energy balances), the degrees of freedom Qi and are naturally decomposed so that (Π) and (Π′) can be relaxed in the form:
or, in a more general form:
The procedure builds surrogate models based on simulation software that follow an iterative modular sequential approach. Effectively, the procedure introduced is iterative, whereby:
• binary variables zi, ẑj select choices in
• each iteration k solves successfully the inner and outer regression problem
• permutes zi and ẑj using integer cuts until convergence in the regression objective
The above process can be formulated as follows:
a) Inner regression
b) Outer regression
c) Check convergence on and permute j using integer cuts on ẑj
d) Check convergence on and permute i using integer cuts on zi
The convergence criteria include:
• maximum number of iterations k < kmax
• acceptable margin of error
• improvement of the solution between iterations
where δ1 and δ2 are determined by the user.
If the margin of error criterion is not satisfied, but the criterion for the improvement between iterations is, the number of components is increased using integer cuts (e.g., Kalvelagen, 2009). Previously selected models are excluded by integer cuts and new ones can be selected from a hierarchical list or by permutation (e.g., Thomson, 1993). The inner- and outer-regression problems are actually non-linear problems (NLP) that can be addressed by a superstructure formulation or by a dedicated software (e.g., Aspen, gproms). The selection in process and property models is a mixed integer linear problem (MILP). The iterative procedure validates both, the surrogate and the fine model.
Inner Regression
For the purposes of inner regression, the set of components J is partitioned into a set of subgroups:
where r accounts for different functional groups (e.g., alkanes, alcohols), each featuring different chemical candidates (e.g., methane, butanol) that could be selected or deselected. The definition of Jir is part of the problem description and could be adjusted differently for each i according to the nature of each substream involved. The inner regression solves (Π) and (Π′).
With degrees of freedom that include the
i. property models
ii. parameters of the property models (uj)
At each iteration k the property models are fixed , and the degrees of freedom only include uj.
• Options for uj may include pressure, volume, temperature, internal energy, Henry's law constants, equilibrium constants, activity coefficients, etc.
• Options for may include models like Soave-Redlich-Kwong (SRK), non-random two-liquid (NRTL), universal quasichemical (UNIQUAC), etc.
The optimization results into an NLP, which could be solved externally, on behalf of the simulator, or internally, using internal optimization packages available.
Outer Regression
For the purposes of outer regression, the set of processes I is partitioned into a set of subgroups:
where s accounts for different processing (e.g., reaction, separation), each featuring different design configuration (e.g., fermenter, double effect distillation) that could be selected or deselected. The outer regression solves (Π) and (Π′).
With degrees of freedom that include the
i. process models (Qi)
ii. parameters of the process models (pi)
At each iteration k, the process models are fixed , and the degrees of freedom only include pi.
• Options for pi may include pressure, temperature, number of theoretical stages, stage efficiency, etc.
• Options for Qi may include reactor models (e.g., CSTR, PFR), separation columns (e.g., distillation, extraction, absorption), solid treatment (e.g., filter, crusher), etc. or combination of library models, by means of superstructures, with the degrees of freedom projected at each iteration.
The optimization results into an NLP, which could be solved externally, on behalf of the simulator, or internally, using internal optimization packages available.
Convergence and Iterations
The purpose of this stage is to
i. monitor accuracy and convergence by checking and adjusting the
• number of iterations
• quality of the regressions
• combinatorial options to consider
ii. prepare new iterations considering
• functional groups available in the inner regressions
• process groups available in the outer regression
The stage is adopted as an optimization problem:
are limiting the number of process models and components subgroups:
Problem Π2 could be expanded with additional options that may include:
• physical and chemical properties of the components involved
• stoichiometric analysis of the selected chemical elements (e.g., C:H:O)
• other experimental data valuable to integrate
• feasibility and uncertainty analysis
Materials and Background Process
This section presents the background process and the options for the property and process models used for the case studies.
Process Description
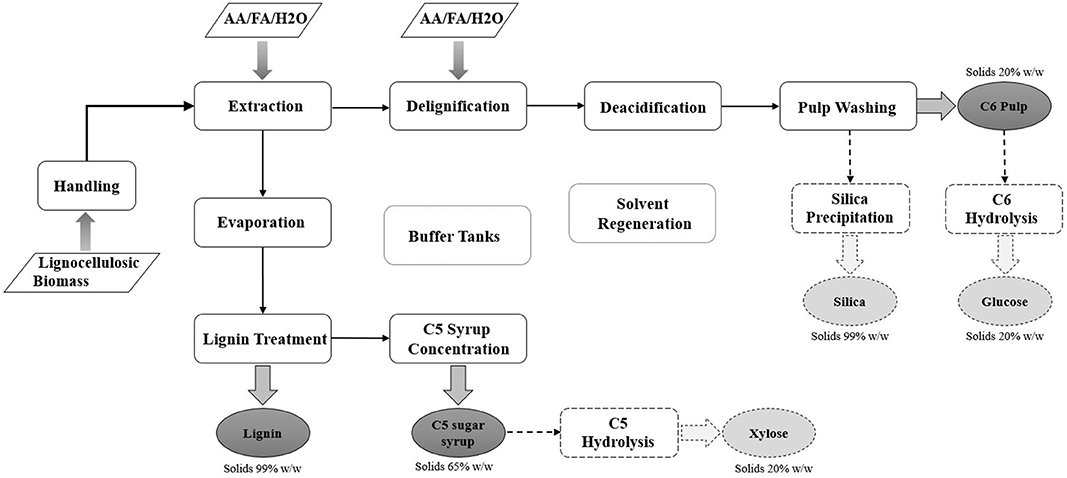
The lignocellulosic biorefinery of CIMV organosolv offers a proven technology for the fractionation of a wide range of non-food-related lignocellulosic resources coming from agricultural residues (e.g., straw, bagasse) (Lam et al., 2001a,b; Snelders et al., 2014), fibrous plants (e.g., miscanthus, hemp, flax, stem) (Mire, 2004; Mire et al., 2005), and forest residues (e.g., softwood, hardwood) (BIOCORE, 2014; Wild et al., 2015). The process consists of 10 process sections (Figure 2). If necessary, the cellulosic pulp and the syrup of hemicelluloses can be further hydrolyzed to glucose and xylose, respectively. Silica production is an additional option, which depends on the feedstock type and the interest in this additional investment cost.
- Handling section prepares raw materials whereby biomass may be sieved or chopped as needed.
- Extraction is a patented process (Benjelloun-Mlayah et al., 2011). This first reaction stage combines biomass impregnation with an aquatic mixture of organic acids (AA/FA/H2O at 55/30/15 wt.%) and fractionation at 105°C and atmospheric pressure. After extraction, the experimental value of kappa (Li and Gellerstedt, 1998), is maximum 25, which means that lignin is maximum at 4.5 wt.% dry mass. The solid content of the liquor stream ranges from 10 to 15 wt.%.
- Delignification is a second reaction stage. The extracted mixture is delignified at 85°C using the organic solvent mixture (AA/FA/H2O at 55/30/15 wt.%) enriched by hydrogen peroxide (H2O2). The delignification section is a patented process (Benjelloun-Mlayah et al., 2012). The hydrogen peroxide oxidizes the organic acids to peroxo-acids (RCOOH + H2O2 → RCOOOH + H2O). Peroxo-acids act as a solvent for the lignin and improve the delignification efficiency and its selectivity (Kham et al., 2005). After the delignification step, kappa is lower or equal to 12 (maximum lignin dried solid content 2.2 wt.%).
- Deacidification removes the acids from the cellulosic pulp before the washing step. The operating temperature must not exceed the 105°C to avoid degradation of C5 sugars. Total solid mass (MS) in the dried pulp does not exceed 92 ± 3 wt.%.
- Pulp washing section treats deacidified pulp with an aquatic mixture of sodium hydroxide (NaOH). Bleached pulp undergoes a two-stage washing with process water, until its water content is raised at 90 wt.%. The process is patented (Delmas and Avignon, 2004). After the first washing stage, kappa is lower or equal to 7 (maximum lignin MS, 1.3 wt.%). The water content in product C6 pulp is 90 ± 5 wt.%.
- Evaporation involves a number of stages that concentrate the extraction liquor from 10 to 65 wt.% dry, so that the product achieves high (the highest possible) concentration in lignin and hemicelluloses.
- Lignin treatment separates lignin from the concentrated extraction liquor. Lignin treatment is a patented process (Delmas and Benjelloun-Mlayah, 2013). The total MS after the first washing stage is between 63 and 65 wt.%, after the second 55 and 57 wt.%, and after the third 51 and 53 wt.%. Lignin product comes in the form of powder.
- C5 syrup concentration section separates the C5 sugars from the organic solvent after the precipitation of lignin. The maximum allowed temperature is 105°C to avoid C5 degradation. The concentration of the C5 syrup is between 60 and 65 wt.%.
- Solvent regeneration section recovers the water and the organic solvent from streams coming from evaporation, pulping, C5 sugars concentration, and deacidification sections. The desirable mass purity is 99.2 wt.% for distillate water and 92 wt.% for bottoms acids. The operating temperature should not exceed 170°C due to corrosion issues.
- Storage tanks are used for the central management of the solvent. The central tank accepts pure solvent steams (without solids), such as recycles acids from the solvent regeneration and the evaporation sections. The intermediate tank is used to shortly store streams coming from the extraction and delignification sections, which contain impurities. Both tanks accept make-up streams for the acids, so as to control the composition of the solvent (55/30/15).
It is postulated that if any handling is required, it is only mechanical; therefore, no model is developed for the handling section. Aspen Plus (RRID: SCR_017101, version 9) is selected as the flowsheeting software since is widely used in the industry and offers links (through CAPE-OPEN) with most of the commercial tools on simulation (e.g., SuperPro, gProms). Biomass components can be simulated as a mixture of conventional components available in commercial and online databanks (Wooley and Putsche, 1996; Phyllis, 2012; S2Biom, 2015). Following the findings of Rönsch and Wagner (2012), model HCOALGEN is used as the property method for the combustion correlation (option 4), and model DCOALIGT is used for the density correlation of the non-conventional components. The feasibility index (Halemane and Grossmann, 1983) is used to explore the feasible region for which the surrogates can be safely extrapolated. Microsoft Excel (RRID: SCR_016137) is used for data organization and basic calculations, and GAMS (RRID: SCR_018312) is used for optimization.
Options for Property and Process Models
Following the presentation of Section Methods, CIMV has nine processes and the set I consists of:
I = {Extraction, Delignification, Deacidification, PulpWashing, Evaporation, LigninTreatment, C5Concentration, Regeneration, Storage}
Non-conventional materials in the CIMV process include biomass (feed stream), pulp (after extraction), glucan (after delignification), C5 syrup (product), C6 pulp (product), and biolignin (product). The complex materials can be simulated either as user-defined non-conventional components or as a mixture of pseudo-components. Data for the user-defined components are available in the supplementary material (Tables S1–S3). The set of components J is partitioned in seven subgroups:
r = {Conventional, User-defined, C5, C6, Lignin, Minerals, Other}
Following the presentation of Section Methods, the set of components Jjr includes:
Jjr = {H2O, AA, FA, H2O2, NaOH} for r ∈ Conventional
Jjr = {Biomass, Pulp, Glucan_d} for r ∈ User-defined
Jjr = {Xylan, Arabinan, Lyxan, Riban} for r ∈ C5
Jjr = {Glucan, Galactan, Mannan, Rhamnan, Fructan} for r ∈ C6
Jjr = {Insoluble, Soluble, Oxidized} for r ∈ Lignin
Jjr = {SiO2, Acetyl, KCl, Si, K, Ca} for r ∈ Minerals
Jjr = {Rest_soluble, Rest_insoluble, Fat, Oils, Waxes, Pigments} for r ∈ Other
Options in property methods include the NRTL, UNIQUAC (UNIQ), UNIFAC (UNIF), Peng-Robinson (PENG-ROB), Soave-Redlich-Kwong (SRK), and modifications with the Hayden-O'Connell (HOC), the Nothnagel (NTH), or Redlich-Kwong (RK) equation of state. The thermodynamic models are related with the existing components based on existing decision trees (Carlson, 1996; Edwards, 2000) (Figure S1).
Following the presentation of Section Methods, the set of thermodynamic models includes:
Parameters of the property models (uj) include temperature, enthalpy, fugacity, etc. Constraints for the thermodynamic calculations ensure the maximum temperature to avoid degradation of the C5 components (g1), the composition of the organic solvent (g2 to g7), the summation of compositions (g8), and the mass conservation when no reaction is taking place (g9).
g1: j ∈ C5
g2: j = {AA} ∩ i = {Extraction, Delignification, Storage}
g3: j = {AA} ∩ i = {Extraction, Delignification, Storage}
g4: j = {FA}∩ i = {Extraction, Delignification, Storage}
g5: j = {FA} ∩ i = {Extraction, Delignification, Storage}
g6: j = {H2O} ∩ i = {Extraction, Delignification, Storage}
g7: j = {H2O} ∩ i = {Extraction, Delignification, Storage}
g8: i, j ∈ M
g9: {Extraction, Delignification, PulpWashing,}
Non-conventional process models can be user-defined or synthesized by combining conventional models. For example, a fermenter can be introduced either as an aggregated non-conventional model or as a combination of conventional models for heating, mixing, reaction, and separation. In this work, it is a deliberate choice to leave out user-defined models and explore the performance of different configurations using conventional models. The information available limits the selection of the models. For example, rigorous reactor models cannot be used unless knowing the reaction kinetics. It is postulated that solid separation processes can be simulated based on either the split fraction, or the flow split, or the resulted purity. Reaction of solids can be a combination of stoichiometric or yield models and solid separation units. Washing of solids can be either a multiple stage model, or a combination of single stage and solid separation models. Shortcut or rigorous models can be used for columns separations. The set of processes I is partitioned in four subgroups:
s1: Solid_Separation = {FractionSplit, FlowSplit, Purity}
s2: Solid_Reaction = {Stoichiometric+Solid_Separation, Yield+Solid_Separation}
s3: Solid_Washing = {SingleStage, MultipleStage, Solid_Separation}
s4: Columns = {Shortcut, Rigorous}
Following the presentation of section Methods, the set of process models Qi includes:
Qi = {Solid_Reaction, Solid_Separation} for i = {Extraction, Delignification, PulpWashing}
Qi = {Columns, Solid_Separation} for i = {Deacidification, Evaporation, LigninTreatment, C5Concentration, Regeneration, Storage}
Parameters of the process models (pi) include operating temperature, operating pressure, efficiency, number of theoretical stages, etc. Constraints for the mass/energy balances follow the process description (h1 to h22) and the connectivity among the units (h23).
h1: i = {Extraction}
h2: j = {Lignin} ∩ i = {Delignification}
h5: i = {Delignification}
h6: ≤ 0.022 j = {Lignin} ∩ i = {Deacidification}
h7: i = {Deacidification}
h8: i = {Deacidification}
h9: j = {Lignin} ∩ i = {PulpWashing}
h10: j = {H2O} ∩ i = {PulpWashing}
h11: j = {H2O} ∩ i = {PulpWashing}
h12: i = {Evaporation}
h13: i = {Evaporation}
h14: i = {Evaporation, C5Concentration}
h15: i = {Evaporation, C5Concentration}
h16: j = {Lignin} ∩ i = {LigninTreatment}
h17: j = {Lignin} ∩ i = {LigninTreatment}
h18: i = {LigninTreatment}
h19: i = {LigninTreatment}
h20: i = {Regeneration}
h21: j = {H2O} ∩ i = {Regeneration}
h22: Ti ≤ 170 i = {Regeneration}
h23: yij = xi+1 j i, j ∈ M
The threshold for the accuracy error is set at 10% for the internal flows and at 5% for the outflows:
εij = 0.10 i, j ∈ M i = {Extraction, Delignification, Deacidification, Evaporation, Regeneration, Storage}
εij = 0.05 i, j ∈ M i = {PulpWashing, LigninTreatment, C5Concentration}
Results and Discussion
The CIMV process treats lignocellulosic biomass and has patented products and technologies. Effectively, it is not evident which components and/or process models to choose from the ready-to-use libraries in simulation software. The quality of the simulation model affects the quality of the surrogate models. Two different case studies demonstrate the potential of the inner-outer regression procedure by solving (Π') and (Π), respectively. The initial point considers stand-alone flowsheets for each process models and biomass simulated as a mixture of pseudo-components (k = 0). A third case study extrapolates the metamodels to different capacities and feedstock types. It is possible to automate the link between the model and the simulator through CAPE-OPEN. However, in this work, the user is the link between the simulator and the model. For reasons of space economy, information about the design per process section is available in the supporting material.
Case 1: Fixed Process and Property Models (Π′)
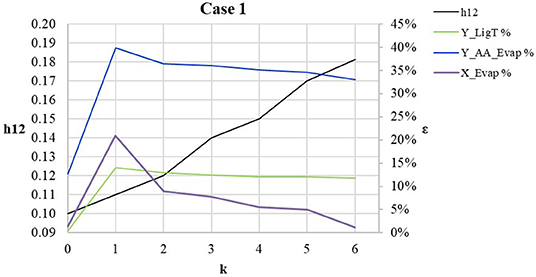
The type of the process and property models is fixed. Degrees of freedom are the selection of the existing components and the property models. Each iteration increases the cardinality of the subgroups. The iterations stopped because of the condition . The resulted models violate four process constraints (h2 = 5.64; h6 = 6.30; h9 = 4.22; h12 = 18.25).
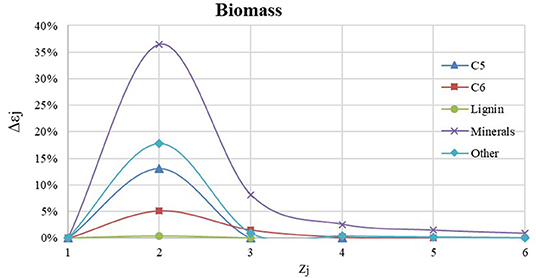
Figure 3 shows how the relative error changes when increasing the number of the components for the simulation in the feedstock stream (r = Biomass) for the extraction. The threshold for adding a new component is set at 5%.
Figure 4 shows how the error in calculations is progressing during the iterations. The spike between the initial point (k = 0) and the first iteration (k = 1) is because models in the initial flowsheet are converged as stand-alone units, while k = 1 considers the models connected (constraint: h23). The increase in components cardinality has a significant impact on constraint h12 and the inflow of the evaporation unit (X_Evap). This is due to the fact that those two factors indicate the solid treatment in the extraction stage. The total flow of the lignin product (Y_LigT) mainly includes the components from the lignin subgroup, which is not significantly affected. The outflow of the acetic acid after evaporation (Y_AA_Evap) improves slightly when the property model changes from NRTL to NRTL-HOC, but it is not significantly improved farther after that.
Table 1 compares the composition of the product streams as calculated by the experimental groups to those calculated by the model. The error in the composition per component is <5%, which is within the acceptable margin of error.
Case 2: Inner-Outer Regression Cycle (Π)
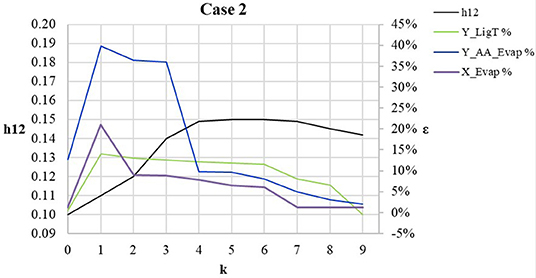
Degrees of freedom are the selection of the existing components, the configuration of the process models, and the type of the process and property models. Figure 5 shows how the error in calculations is progressing during the iterations. The spike between the initial point (k = 0) and the first iteration (k = 1) is for the same reason as in case 1. For k = 4, the model NRTL-HOC is regressed with experimental data. This regression of the model parameters results in a drastic improvement on the evaporation outflow (Y_AA_Evap). Iteration k = 7 chooses the user-defined components (Biomass, Pulp, Glucan_d) and improves significantly the error in the inflow of the evaporation unit (X_Evap). Iteration k = 9 selects solid_separation units for the simulation of solids washing in the lignin treatment section and the error in the lignin product (Y_LigT) drops below 5%. The resulted models satisfy the convergence criteria and all the constraints, so the iterations stop.
Figure 6 compares the regressed model with some of the existing thermodynamic models for P = 1 atm. It seems that the available thermodynamic models cannot predict correctly the azeotrope between FA-H2O (107.2°C and 77 wt.%). Figure 6A shows that after 30 wt.% in water, NRTL-HOC overestimates the vapor composition in the solvent mixture, while the other models underestimate it. Figure 6B shows that only model NRTL predicts well the vapor phase of AF, but when it comes to the AA vapor composition (Figure 6C), it underestimates it until around 30 wt.% H2O. Figure 6D shows that model NRTL-HOC overestimates the temperature of the AA vapor phase, model UNIF-HOC underestimates it, while NRTL underestimates it until the region of 0.75–0.82, after which it overestimates the temperature of vapor AA-H2O mixture.
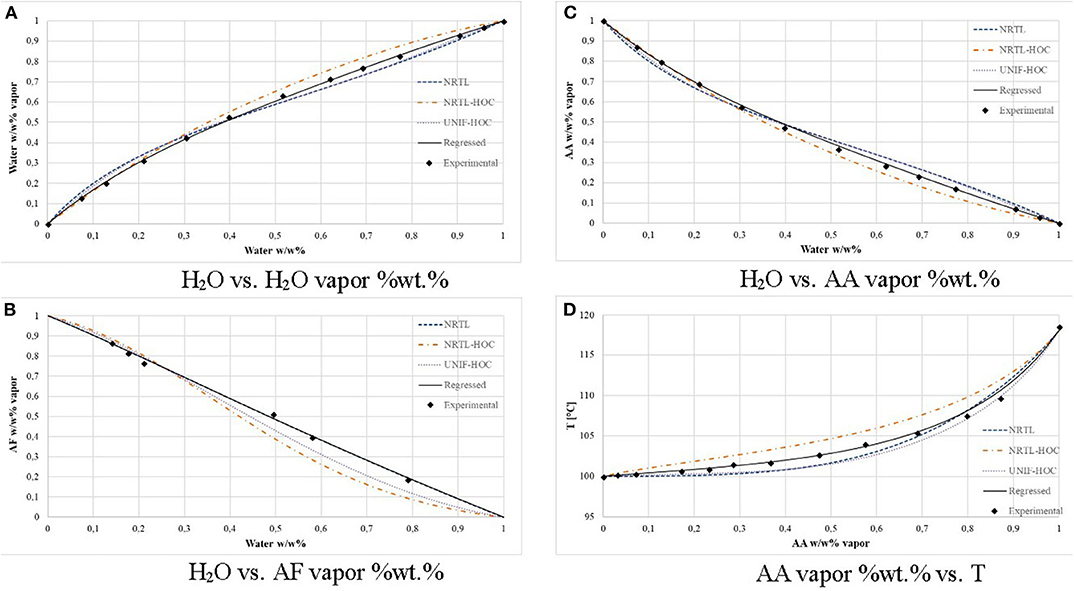
Figure 6. Comparison of VLE thermodynamic models. (A) H2O liquid vs. vapor. (B) H2O liquid and AF vapor. (C) H2O liquid and AA vapor. (D) AA vapor as a function of T.
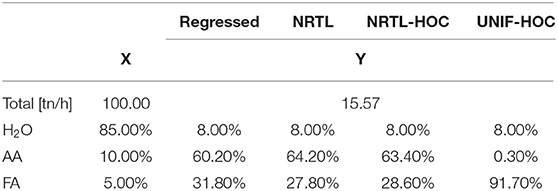
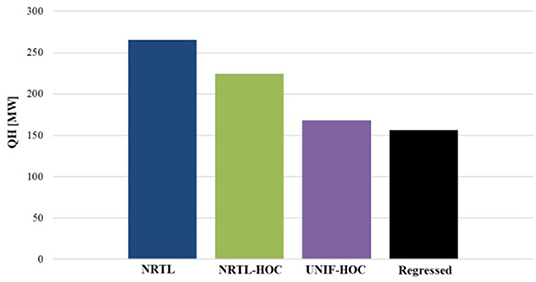
The question is what the impact of the optimization of the property parameters is. Table 2 shows how the mass balances of the distillation column change with the different thermodynamic models. For all cases, the distillation feed and the design specifications are the same. Even though the error of the NRTL and NRTL-HOC model is within the 5% limit, this deviation provokes significant errors in the mass balances of the organic solvent (AA and FA). The most notable impact of the improved thermodynamic models is on the energy balances (Figure 7). The mass balance estimations of the NRTL-HOC model, for example, are the closest to those of the regressed model, but the reboiler duty is overestimated by 43%. Model UNIF-HOC, on the other hand, overestimates the reboiler duty only by 7% but has large deviations in the mass balance calculations.
Table 3 compares the error per component composition in the product streams. The accuracy error is <0.5%.
Case 3: Model Extrapolation
Metamodels from case 2 are extrapolated to different treatment capacities and feedstocks. The inflow is ranged from 8 to 1,000 ktn/year (dry biomass). Figure 8 shows how the accuracy error is affected as the capacity of the model changes. Results show that the model is resilient to capacity fluctuations. The accuracy error in the composition of the products remains below ±3%. The highest deviation appears in the total flows, where the model underestimates the total flow by −2.5%.
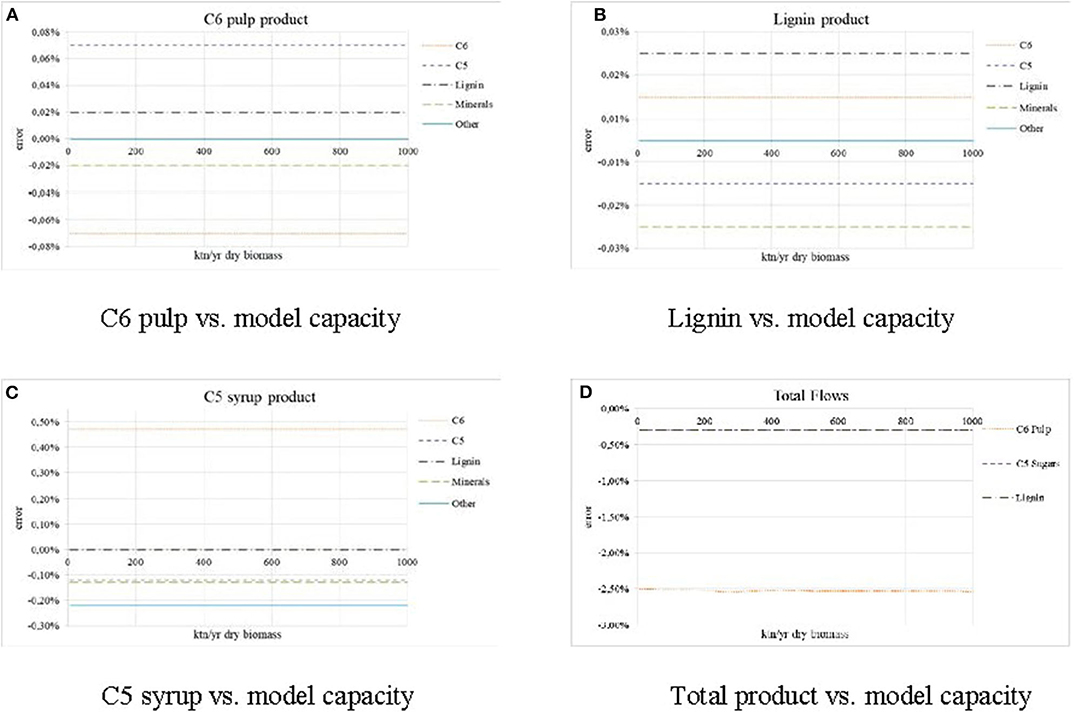
Figure 8. Accuracy error in the product streams for different model capacities. (A) Cellulosic pulp product. (B) Lignin product. (C) Hemicelloloses syrup product. (D) Total flow of products.
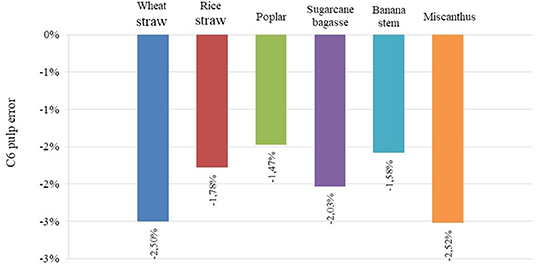
Figure 9 shows how the accuracy error of the C6 pulp flow changes with different feedstock types. In all cases, the models underestimate the total flow. The error is below 3%, which is within the acceptable margin of error.
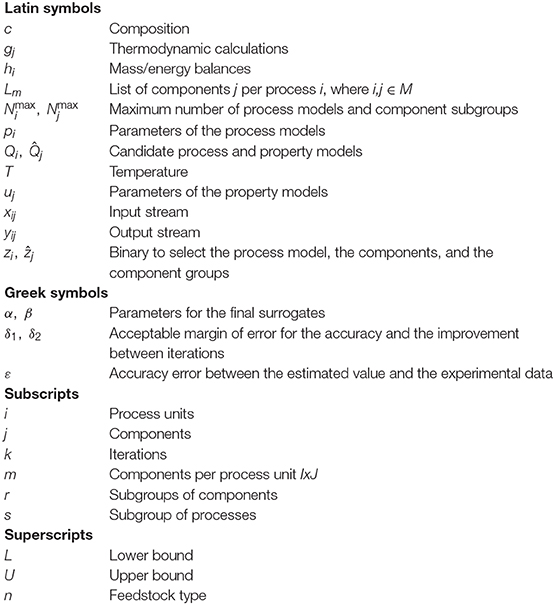
The metamodels produced for the mass flows are linear per biomass type and per component:
where n is the feedstock, X the mass inflow on dry basis, Y the mass outflow on total basis, r the component subgroups (product streams), j the components, α the parameter for the total mass flows, and β the parameter for the component flows. The parameters α and β are available in the supplementary material (Tables S23–S34). The accuracy is within 5% for 8 ≤ X ≤ 1,000 ktn/year (dry biomass, annual operation, 8,000 h/year). Surrogates about the consumption of utilities (mass and energy), the production of effluent streams, and the cost estimation depend on the integration strategy. For example, for a capacity of 170 kt/years dry biomass, the equipment cost is estimated at $157.32 MM ($2019) (±20%) when choosing a double effect distillation column in the regeneration section and at $153.93 MM (2019) (±20%) when choosing a single effect.
Conclusion
Existing techniques develop surrogates by fitting the model to the available data and then evaluating its safe use within known boundaries. No method accounts heretofore the engineering principles. The quality of the simulation model and, consequently, the quality of the metamodels depend on the successful physical and chemical representations of the real system. This paper introduces a new iterative method to assist in the development of low granularity models and the decision-making of biorefinery flowsheeting. Two different case studies demonstrate the potential of the inner-outer procedure. The first case study solves the regression problem with fixed options for the process and property models. Degrees of freedom include the selection of the existing components and property models. The second case study has degrees of freedom the selection of the existing components, the configuration of the process models, and the type of the process and property models. A third study extrapolates the resulted metamodels to different capacities and feedstocks.
The first case results in metamodels in relatively good agreement with the experimental data. However, process units with a high dependency on the property models (evaporation and distillation) do not meet all the process constraints. This outcome indicates a shortcoming of the initially given thermodynamic models. The second case study results in metamodels that meet all the process and property constraints. The parameters of the initial thermodynamic model are regressed with the experimental data. The improvement of the thermodynamic calculations in the simulation model allows the selection of more rigorous process units for evaporation and distillation, further improving the estimation of the mass and energy balances. Case 3 extrapolates the metamodels to different capacities and feedstock types (wheat and rice straw, wood, sugarcane bagasse, banana stem, and miscanthus), without losing in liability. The inner-outer regression cycle produces metamodels that gain in accuracy, flexibility, and simplicity and gives valuable insight into the shortcomings of the available simulation models by filling the gap through regression with experimental data. However, the introduced method is limited by the availability in libraries of process and property models of the selected simulation software. Each cycle is tailored to the process under study and the simulation software. The suggested model can be integrated with other tools to automatize the link with the commercial software.
Data Availability Statement
The authors confirm that the data supporting the findings of this study are available within the article and its Supplementary Materials.
Author Contributions
AM collected and prepared the data, did the modeling and the analysis, designed the in situ experiments, and wrote the manuscript. BB-M collected the experimental data, supervised the applicability of the method on the industrial concept, and reviewed the manuscript. AK developed the concept, supervised the modeling and the overall analysis, and reviewed the manuscript. All authors contributed to the article and approved the submitted version.
Funding
The authors gratefully acknowledge financial support from the consortium of Marie Curie; RENESENG (FP7-607415) for AM's salary and training, software license and equipment supply, and for research dissemination; and RENESENG II (H2020-EU.1.3.3–778332) for equipment and software license supply, for research dissemination, and for the publication fee.
Conflict of Interest
BB-M is employed by the company CIMV. AM was part of the CIMV staff within the framework of the ITN Marie Curie RENESENG (FP7-607415), while being a Ph.D. candidate in the NTUA. Today, AM is employed by the AU.
The remaining author declares that the research was conducted in the absence of any commercial or financial relationships that could be construed as a potential conflict of interest.
Acknowledgments
We would like to thank the R&D group of CIMV for their knowledge sharing and excellent collaboration.
Supplementary Material
The Supplementary Material for this article can be found online at: https://www.frontiersin.org/articles/10.3389/fceng.2020.568196/full#supplementary-material
References
Alizadeh, R., Allen, J. K., and Mistree, F. (2020). Managing computational complexity using surrogate models: a critical review. Res. Eng. Design 31, 275–298. doi: 10.1007/s00163-020-00336-7
Aristizábal-Marulanda, V., and Cardona-Alzate, C. A. (2019). Methods for designing and assessing biorefineries. Biofuel. Bioprod. Bior. 13, 789–808. doi: 10.1002/bbb.1961
Benjelloun-Mlayah, B., Delmas, M., and Levasseur, G. (2012). Installation for Implementing a Method for Producing Paper Pulp, Lignin, and Sugars and Production Method using Such an Installation. U.S. Patent No 8,157,964B2. Levallois-Perret, FR.
Benjelloun-Mlayah, B., Delmas, M., Levasseur, G., and Scholastique, T. (2011). Method for Pretreating Plant Starting Material for The Production, from Sacchariferous and Lignocellulosic Resources, of Bioethanol and of Sugar, and Plant. U.S. Patent No 2011/0105737 A1. Levallois-Perret, FR.
Bergamini, R., Nguyen, T. V., and Elmegaard, B. (2019). Simplification of data acquisition in Process Integration retrofit studies based on uncertainty and sensitivity analysis. Front. Energy Res. 7:108. doi: 10.3389/fenrg.2019.00108
Bhosekar, A., and Ierapetritou, M. (2018). Advances in surrogate based modeling, feasibility analysis and optimization: a review. Comp. Chem. Eng. 108, 250–267. doi: 10.1016/j.compchemeng.2017.09.017
BIOCORE (2014). Final publishable summary report. Available Online at: https://cordis.europa.eu/result/rcn/157876_en.html (accessed May 09, 2020).
Boukouvala, F., and Floudas, C. A. (2017). ARGONAUT: algorithms for global optimization of constrained grey-box compUTational problems. Optim. Lett. 11, 895–913. doi: 10.1007/s11590-016-1028-2
Boukouvala, F., and Ierapetritou, M. G. (2013). Surrogate-based optimization of expensive flowsheet modeling for continuous pharmaceutical manufacturing. J. Pharm. Innov. 8, 131–145. doi: 10.1007/s12247-013-9154-1
Caballero, J. A., and Grossmann, I. E. (2008). An algorithm for the use of surrogate models in modular flowsheet optimization. AIChE J. 54, 2633–2650. doi: 10.1002/aic.11579
Chen, V. C., Tsui, K. L., Barton, R. R., and Meckesheimer, M. (2006). A review on design, modeling and applications of computer experiments. IIE Trans. 38, 273–291. doi: 10.1080/07408170500232495
De Buck, V., Polanska, M., and Van Impe, J. (2020). Modeling biowaste biorefineries: a review. Front. Sustain. Food Syst. 4:11. doi: 10.3389/fsufs.2020.00011
Delmas, M., and Avignon, G. (2004). Method for Bleaching Paper Pulp. U.S. Patent No 2004/0035537 A1, Levallois-Perret, FR.
Delmas, M., and Benjelloun-Mlayah, B. (2013). Process for the Separation of Lignins and Sugars from an Extraction Liquor. U.S. Patent No 2013/0085269 A1, Levallois-Perret, FR.
Edwards, J. E. (2000). Process Modeling Selection of Thermodynamic Methods. UK ChemCAD Seminar. Available online at: https://www.chemicalprocessing.com/assets/Media/MediaManager/thermo.pdf (accessed May 07, 2020).
Halemane, K. P., and Grossmann, I. E. (1983). Optimal process design under uncertainty. AIChE J. 29, 425–433. doi: 10.1002/aic.690290312
Hao, J., Zhou, M., Wang, G., Jia, L., and Yan, Y. (2020). Design optimization by integrating limited simulation data and shape engineering knowledge with Bayesian optimization (BO-DK4DO). J. Intell. Manuf. 1–19. doi: 10.1007/s10845-020-01551-8
Hüllen, G., Zhai, J., Kim, S. H., Sinha, A., Realff, M. J., and Boukouvala, F. (2020). Managing uncertainty in data-driven simulation-based optimization. Comp. Chem. Eng. 136:106519. doi: 10.1016/j.compchemeng.2019.106519
Kalvelagen, E. (2009). Some MINLP solution Algorithms. Available online at https://www.researchgate.net/profile/Erwin_Kalvelagen/publication/250195711_SOME_MINLP_SOLUTION_ALGORITHMS/links/0a85e53624811a44ac000000.pdf (accessed July 23, 2020).
Kham, L., Le Bigot, Y., Benjelloun-Mlayah, B., and Delmas, M. (2005). Bleaching of solvent delignified wheat straw pulp. Appita J. 58:135.
Lam, H. Q., Le Bigot, Y., and Delmas, M. (2001b). Formic acid pulping of rice straw. Ind. Crops Prod. 14, 65–71. doi: 10.1016/S0926-6690(00)00089-3
Lam, H. Q., Le Bigot, Y., Delmas, M., and Avignon, G. (2001a). A new procedure for the destructuring of vegetable matter at atmospheric pressure by a catalyst/solvent system of formic acid/acetic acid. Applied to the pulping of triticale straw. Ind. Crops Prod. 14, 139–144. doi: 10.1016/S0926-6690(01)00077-2
Li, J., and Gellerstedt, G. (1998). On the structural significance of the kappa number measurement. Nordic Pulp Paper Res. J. 13, 153–158. doi: 10.3183/npprj-1998-13-02-p153-158
Li, Y. F., Ng, S. H., Xie, M., and Goh, T. N. (2010). A systematic comparison of metamodeling techniques for simulation optimization in decision support systems. Appl. Soft Comput. 10, 1257–1273. doi: 10.1016/j.asoc.2009.11.034
Mire, M. A. (2004). Separation des biopolymeres du tronc de bananier en milieu acide organique: cellulose, lignines et sucres (Ph. D. dissertation). Antilles-Guyane, French.
Mire, M. A., Benjelloun-Mlayah, B., Delmas, M., and Bravo, R. (2005). Formic acid/acetic acid pulping of banana stem (Musa Cavendish). Appita Technol. Innov. Manufac. Environ. 58, 393–396.
Ng, D. K., Tan, R. R., Foo, D. C., and El-Halwagi, M. M. (2015). Process Design Strategies for Biomass Conversion Systems. West Sussex: John Wiley & Sons. doi: 10.1002/9781118699140
Phyllis, E. C. N. (2012). Database for Biomass and Waste. Energy Research Centre of the Netherlands. Avaliable online at: https://www.ecn.nl/phyllis2/ (accessed May 09, 2020).
RENESENG (2018). Final Publishable Summary Report. Available online at: https://cordis.europa.eu/project/id/607415/reporting (accessed May 09, 2020).
Rönsch, S., and Wagner, H. (2012). Calculation of Heating Values for the Simulation of Thermo-Chemical Conversion Plants With Aspen Plus. Available online at: https://www.dbfz.de/fileadmin/prozesssimulation/data/downloads/workshop_juni2011/Roensch_und_Wagner_2012_Calculation_of_heating_values_with_Aspen_Plus.pdf (accessed May 10, 2020).
S2Biom (2015). S2Biom Project Grant Agreement n°608622, a Method for Standardized Biomass Characterization and Minimal Biomass Quality Requirements for Each Biomass Conversion Technology, Deliverable D2.1 30 April 2015. Available online at: https://library.wur.nl/WebQuery/wurpubs/fulltext/517728 (accessed May 09, 2020).
Snelders, J., Dornez, E., Benjelloun-Mlayah, B., Huijgen, W. J. J., de Wild, P. J., Gosselink, R. J. A., et al. (2014). Biorefining of wheat straw using an acetic and formic acid based organosolv fractionation process. Bioresour. Technol. 156, 275–282. doi: 10.1016/j.biortech.2014.01.069
Thomson, W. (1993). Divide and Permute and the Implementation of Solutions to the Problem of Fair Division (No. 360). University of Rochester-Center for Economic Research (RCER). Available online at: https://econpapers.repec.org/article/eeegamebe/v_3a52_3ay_3a2005_3ai_3a1_3ap_3a186-200.htm (accessed July 23, 2020).
Tursi, A. (2019). A review on biomass: importance, chemistry, classification, and conversion. Biofuel Res. J. 6, 962–979. doi: 10.18331/BRJ2019.6.2.3
Upreti, S. R. (2017). Process modeling and simulation for chemical engineers: Theory and practice. Toronto, Canada: John Wiley & Sons.
Vassilev, S. V., Baxter, D., Andersen, L. K., and Vassileva, C. G. (2010). An overview of the chemical composition of biomass. Fuel 89, 913–933. doi: 10.1016/j.fuel.2009.10.022
Wang, G. G., and Shan, S. (2007). Review of metamodeling techniques in support of engineering design optimization. J.Mech. Des. 129, 370–380. doi: 10.1115/1.2429697
Wild, P. D., Huijgen, W. J. J., Linden, R., Uil, H. D., Snelders, J., and Benjelloun-Mlayah, B. (2015). Organosolv fractionation of lignocellulosic biomass for an integrated biorefinery. NPT Procestechnol. 1, 10-11. Available online at: https://publications.ecn.nl/BEE/0/ECN-V-14-010 (accessed May 09, 2020).
Wooley, R. J., and Putsche, V. (1996). Development of an ASPEN PLUS physical property database for biofuels components, NREL/MP-425–20685. doi: 10.2172/257362
Nomenclature
Keywords: modeling, flowsheeting, surrogate, optimization, biorefinery
Citation: Mountraki AD, Benjelloun-Mlayah B and Kokossis AC (2020) A Surrogate Modeling Approach for the Development of Biorefineries. Front. Chem. Eng. 2:568196. doi: 10.3389/fceng.2020.568196
Received: 31 May 2020; Accepted: 24 August 2020;
Published: 23 October 2020.
Edited by:
Seyed Soheil Mansouri, Technical University of Denmark, DenmarkReviewed by:
José María Ponce-Ortega, Michoacana University of San Nicolás de Hidalgo, MexicoDenny K. S. Ng, Heriot-Watt University Malaysia, Malaysia
Copyright © 2020 Mountraki, Benjelloun-Mlayah and Kokossis. This is an open-access article distributed under the terms of the Creative Commons Attribution License (CC BY). The use, distribution or reproduction in other forums is permitted, provided the original author(s) and the copyright owner(s) are credited and that the original publication in this journal is cited, in accordance with accepted academic practice. No use, distribution or reproduction is permitted which does not comply with these terms.
*Correspondence: Aikaterini D. Mountraki, YWlrYXRlcmluaUBtb3VudHJha2kuY29t; Antonis C. Kokossis, YWtva29zc2lzQG1haWwubnR1YS5ncg==
 Aikaterini D. Mountraki
 Bouchra Benjelloun-Mlayah3
 Antonis C. Kokossis
