- 1Hubei Key Laboratory of Digital Finance Innovation, Hubei University of Economics, Wuhan, China
- 2School of Information Engineering, Hubei University of Economics, Wuhan, China
- 3Hubei Internet Finance Information Engineering Technology Research Center, Hubei University of Economics, Wuhan, China
- 4School of Mathematics and Computer Science, Nanchang University, Nanchang, China
- 5School of Mechanical Engineering, Beijing Institute of Petrochemical Technology, Beijing, China
- 6School of Information Engineering, Nanchang University, Nanchang, China
Introduction: Retinal diseases significantly impact patients’ quality of life and increase social medical costs. Optical coherence tomography (OCT) offers high-resolution imaging for precise detection and monitoring of these conditions. While deep learning techniques have been employed to extract features from OCT images for classification, convolutional neural networks (CNNs) often fail to capture global context due to their focus on local receptive fields. Transformer-based methods, on the other hand, suffer from quadratic complexity when handling long-range dependencies.
Methods: To overcome these limitations, we introduce the Multi-Resolution Visual Mamba (MRVM) model, which addresses long-range dependencies with linear computational complexity for OCT image classification. The MRVM model initially employs convolution to extract local features and subsequently utilizes the retinal Mamba to capture global dependencies. By integrating multi-scale global features, the MRVM enhances classification accuracy and overall performance. Additionally, the multi-directional selection mechanism (MSM) within the retinal Mamba improves feature extraction by concentrating on various directions, thereby better capturing complex, orientation-specific retinal patterns.
Results: Experimental results demonstrate that the MRVM model excels in differentiating retinal images with various lesions, achieving superior detection accuracy compared to traditional methods, with overall accuracies of 98.98\% and 96.21\% on two public datasets, respectively.
Discussion: This approach offers a novel perspective for accurately identifying retinal diseases and could contribute to the development of more robust artificial intelligence algorithms and recognition systems for medical image-assisted diagnosis.
1 Introduction
The human body relies on the eyes to perceive external information. However, the eyes are easily damaged because of prolonged screen exposure, resulting in frequent vision problems and serious interference with daily life Rauchman et al. (2022). In today’s society, the popularity of electronic devices such as mobile phones and computers makes it almost impossible to work and study without using electronic screens, which undoubtedly poses a direct challenge to vision. Long-term immersion in front of electronic screens often leads to varying degrees of vision damage Lanzani et al. (2024). Due to the large population base and uneven distribution of medical resources, not everyone can receive high-quality medical diagnosis and treatment in time, which increases the risk of delayed illness and makes some patients miss the best time for treatment. According to the World Health Organization, approximately 2.2 billion people in the world have vision problems caused by eye diseases Bashshur and Ross (2020). It is particularly noteworthy that nearly half of these vision impairments could have been avoided or recovered through effective preventive measures or early and timely intervention. Therefore, in the field of clinical research, early detection and accurate diagnosis of eye diseases Xu et al. (2022); Wan et al. (2023b); Wan et al. (2024b) are particularly important. Accurate diagnosis of eye diseases can not only reduce avoidable vision loss, but also improve the quality of patients’ life.
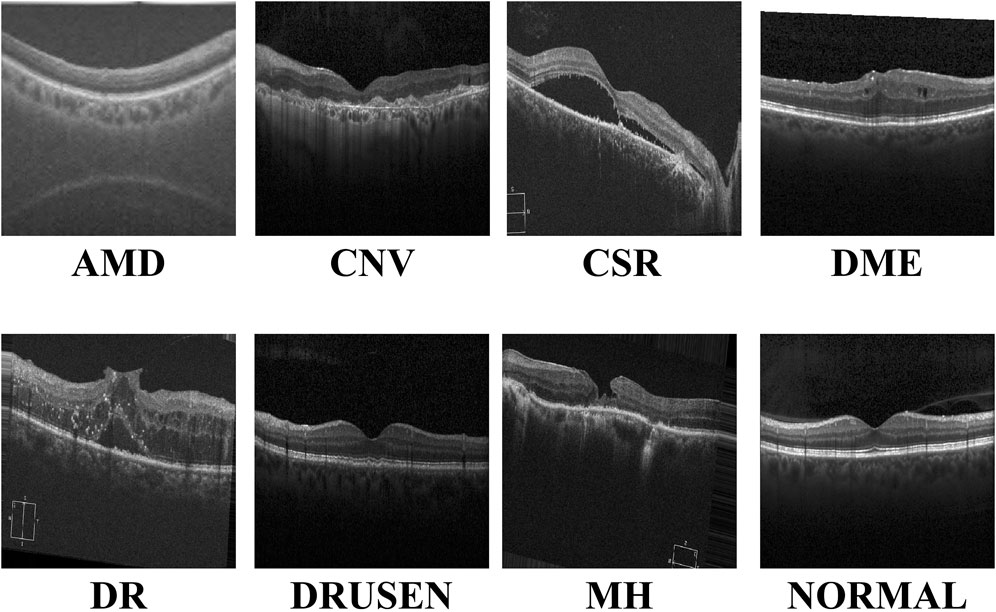
With the continuous advancements in optimal theory and technology Wan et al. (2023a); Wan et al. (2024a); Ji et al. (2024), optical coherence tomography (OCT) technology has emerged and rapidly penetrated into the medical field Bouma et al. (2022). OCT has significant advantages such as high resolution, efficient detection, and non-invasiveness. It can be used for the detection and diagnosis of retinopathy and has now become an indispensable routine method in eye examinations Xu et al. (2023). Figure 1 shows eight examples of retinal disease, namely, age-related macular degeneration (AMD), choroidal neovascularization (CNV), central serous chorioretinopathy (CSR), diabetic macular edema (DME), macular hole (MH), Drusen, diabetic retinopathy (DR), and normal. However, due to hardware and equipment factors, OCT images are often mixed with unavoidable noise during the imaging process, which undoubtedly increases the complexity and challenge of diagnosis for doctors. Moreover, OCT is a grayscale imaging technique. Since the characteristics of small lesions are not clear enough at the grayscale level, these subtle changes are often difficult to detect, which increases the risk of missed diagnosis by doctors. At the same time, although the number of patients with retinal eye diseases increases year by year, the number of doctors with professional diagnostic capabilities is relatively scarce. This contradiction is becoming increasingly prominent, making it difficult to effectively meet the diagnosis and treatment needs of a large patient population Daich Varela et al. (2023). This technology can assist doctors in accurately assessing patients’ conditions, effectively reducing doctors’ workload, while improving the accuracy of eye disease screening and diagnosis. It has far-reaching significance for optimizing the allocation of medical resources and improving the quality of medical services.
In the field of medical image processing, convolutional neural networks (CNNs) have performed well in medical image segmentation Li et al. (2024); Hong et al. (2022b); Zhang et al. (2023), image generation You et al. (2022); You et al. (2024), and image classification Yu et al. (2022); Zong et al. (2024); Zuo et al. (2023a). By stacking multiple layers of convolution and pooling layers, CNNs can effectively extract complex features and subtle lesions in images Hong et al. (2022a), such as microaneurysms and exudates, which are key signs of diseases such as diabetic retinopathy. Combined with fully connected layers for feature integration and classification, CNN models can accurately distinguish different types of retinal diseases, providing ophthalmologists with fast and objective preliminary diagnostic references, thereby improving the diagnostic efficiency and accuracy and speeding up patient treatment. However, CNN models have difficulty modeling long-distance dependencies in images and are sensitive to position translation, which limits their application in certain complex retinal disease classification tasks.
Due to its remarkable work in natural language processing, the transformer network is now gradually entering the field of medical image computing Zuo et al. (2024); Zuo et al. (2023b), bringing improvements in performance of the task of retinal disease image classification Parvaiz et al. (2023). Due to the unique self-attention mechanism, the transformer-based network is able to deeply analyze the complex relationship between each pixel and other pixels in the image, thereby capturing small but important pathological features in retinal disease images, such as subtle vascular abnormalities and exudate distribution. This global information integration capability enables the transformer network to more accurately identify different types of retinal diseases during the classification process, providing ophthalmologists with a more reliable and timely diagnostic basis. Since the network does not consider the spatial locality of the image, it may not capture detailed features as finely as CNNs when processing high-resolution medical images and requires larger data sets and computing resources to train, all of which limit the application scenarios of transformer-based models in medical image diagnosis.
Recently, the Mamba network, an innovative deep learning architecture, has excelled in long-distance relationship modeling Gu and Dao (2023); Zhu et al. (2024). Through its unique selection state mechanism, it effectively captures the spatial dependencies between distant regions in an image and ignores noise interference, thereby improving the learning efficiency and prediction accuracy of the model. Inspired by the above observations, we combined the CNN and Mamba networks and proposed the multi-resolution visual Mamba (MRVM) model for OCT image classification. The MRVM model first extracts local features from OCT images using convolution and then captures global long-range dependencies through the retinal Mamba. Next, by integrating multi-scale global features, the model enhances the classification accuracy and overall performance. The multi-directional selection mechanism (MSM) within the retinal Mamba improves feature extraction by focusing on various directions, thereby boosting the model’s ability to detect complex, orientation-specific retinal patterns. Finally, the fused multi-scale features are sent to the classifier to discriminate disease-related OCT images. The proposed model has the potential to accurately detect retinal diseases and can be extended to other medical image classifications. The main contributions of this work are summarized as follows.
The subsequent sections of this work are structured as follows: In Section 2, we review the literature on retinal disease detection. We detail the innovative MRVM model in Section 3 to introduce a novel approach for detecting retinal disease using OCT images. Subsequently, Sections 4 and 5 present the experimental setup alongside comparative prediction outcomes utilizing alternative methods. Lastly, Section 6 delves into the credibility of this work and provides concise key findings.
2 Related works
The classification performance of retinal OCT images is also constantly improving with the advancement of artificial intelligence. These improved methods mainly focus on local feature learning and global feature learning.
The first approach focuses on local lesion characteristics. It deeply analyzes the key lesion signs in the image, such as changes in the vascular morphology, edema of the optic disc, and abnormal manifestations of the macular area, and accurately captures the specific characteristics of these lesions to achieve accurate classification of the retinal diseases. Rong et al. (2018) proposed a CNN-based automatic classification method to effectively classify OCT images through image denoising, mask extraction, and proxy image generation. This CNN-based method performs well in evaluation on different databases. Alqudah, (2020) developed a more powerful CNN-based model to classify five types of retinal diseases (including AMD, CNV, DME, Drusen, and normal) with an overall accuracy of 95.3%. Karthik and Mahadevappa (2023) replaced the residual connection with the contrast of derivatives in the standard ResNet model. Experimental results on the two public OCT datasets show at least 1% improvement in the accuracy estimation. To reduce the model size, Sunija et al. (2021) designed only six convolutional blocks with downsampling and weight sharing mechanisms to classify four-label OCT images. Compared with the existing ResNet-50 model, it uses 6.9% of the learnable parameters but has a better classification performance. Considering the previous methods may ignore useful discriminative information at different scales, Wang and Wang (2019) designed a novel CNN-based method to automatically detect AME and AMD, which shows good classification performance in cross-dataset adaptability. In addition, Das et al. (2021) proposed a deep multi-scale fusion convolutional neural network (DMF-CNN) to extract and fuse different scale features for AMD/DME/normal classification. The multi-label classification results show excellent performance and good versatility on the UCSD and NEH datasets.
The second approach is modeling the global diseased areas, which focuses on the overall information of the image, comprehensively considers multiple visual elements and structural features in the image, and does not need to identify specific lesions separately but directly performs intelligent analysis on the entire image so as to determine the label of retinal diseases from a global perspective. Yu et al. (2021) applied the vision transformer (VIT) to the task of retinal disease classification. Their framework outperforms CNN models on two publicly funded image datasets. Shen et al. (2023) incorporated the clinical prior knowledge to guide the transformer-based network for retinal disease prediction and achieved superior classification and good generality on the public nAMD dataset. Hammou et al. (2023) used the pre-trained state-of-the-art models as the prior knowledge and fine-tuned these models to classify OCT videos. This method has potential application in the real-time diagnosis of retinal diseases. To improve the accuracy and interpretability of these classification models, He et al. (2023) proposed a transformer-based model with Swin-poly strategy to classify retinal OCT images. They achieved state-of-the-art performance on the OCT2017 dataset, which is superior to that of both vision transformer (VIT) and convolutional neural network approaches. A similar work is presented in Playout et al. (2022). Wen et al. (2022) combined the transformer and CNN to train this hybrid model for ophthalmic disease classification. This model extracts both local and global contexts for lesion area extraction and understanding with considerable accuracy improvement. In addition, they Laouarem et al. (2024) designed a hybrid model to classify seven retinal diseases by combining visual transformers and CNN. They extracted multi-scale local features from OCT images by a hierarchical CNN and achieved good results on three public datasets. Hemalakshmi et al. (2024) proposed a SqueezeNet-Vit model to extract local and global features for more accurate OCT classification.
3 Methods
The proposed MVRM model is illustrated in Figure 2. The input is an image with the size
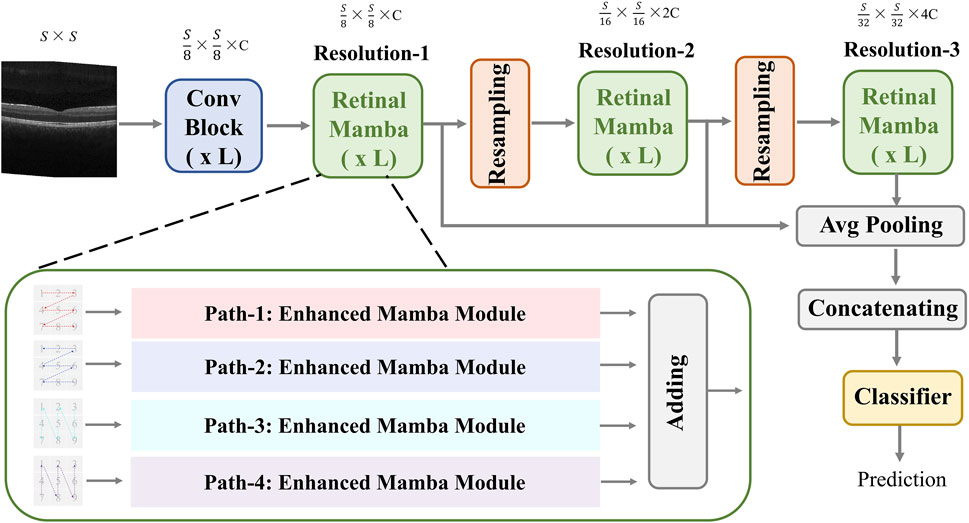
Figure 2. Architecture of the proposed MVRM model, consisting of the Conv block, retinal Mamba module, sampling module, and classifier. The input is a two-dimensional image, and the output is a vector representing the retinal disease label.
3.1 Convolutional block
In the convolution module, we designed three residual layers, and the output sizes of these three residual layers are as follows:
where, Equations 1–3 are based on the Equation 4. In Equation 4, it contains 2 sub-convolution layers. The first sub-convolution layer contains a 3 × 3 convolution (Conv) kernel with a step size of 2, a batch normalization layer (BN), a
3.2 Retinal Mamba
This module extracts global disease-related patterns by selectively modeling different parts of the OCT image. To capture multi-scale patterns, we designed two resampling modules to obtain multi-resolution feature maps and utilize the retinal Mamba (RM) to learn the global lesion area relations from multi-scale perspectives. The resampling module between retinal Mamba modules consists of a batch-normalized
where
The fused feature
3.2.1 Enhanced Mamba
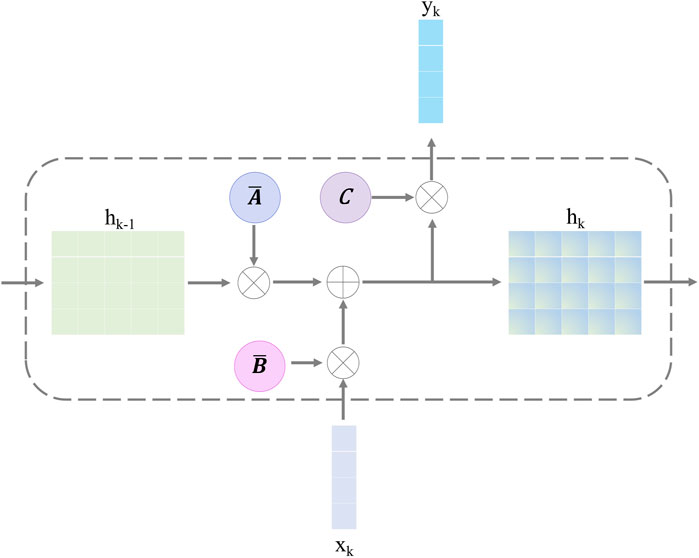
In the retinal Mamba, four paths are used to extract different direction features from the retinal OCT image. Considering the rich pattern correlations in different directions of time series and the complexity of spatial location dependencies, the output of each enhanced Mamba is added to fuse different directional features. The structure of each enhanced Mamba is shown in Figure 3.
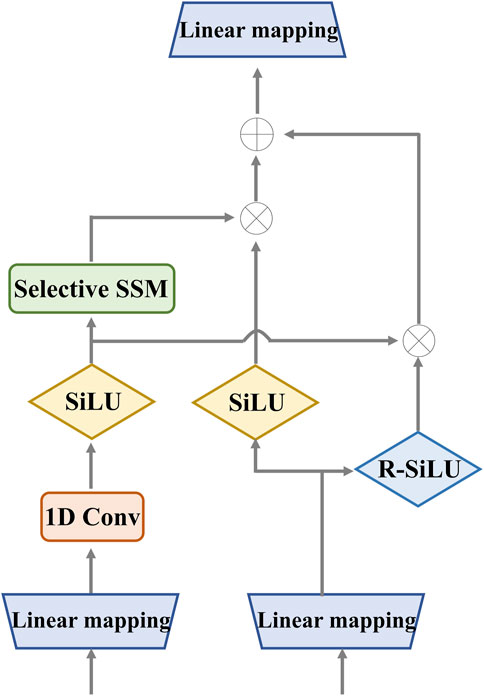
Figure 3. Detailed structure of the enhanced Mamba. It utilizes two gates to capture sequence dependencies for global complementary information. The input and output have the same dimension.
We designed the enhanced Mamba with two pathways. The first pathway leverages a linear mapping (LM), a 1-D convolutional module, and a selective state-space model (SSM) to learn long-range sequence dependencies. The selective SSM can memorize long-term historical information in the HIPPO matrix. The second pathway generates two gates: the sigmoid-weighted linear unit (SiLU) and the reversed SiLU (R-SiLU). The SiLU gate processes the longer-term historical context, and the R-SiLU gate filters the complementary historical information to more comprehensively preserve the valuable long-term information. This designed enhanced Mamba facilitates a more nuanced and effective handling of long-term sequence modeling tasks. The computation process is illustrated in the Algorithm 1.
Algorithm 1.Computation process of enhanced Mamba.
Input:
Output:
1:
2:
3:
4:
6:
7:
8:
9:
10:
11:
12: Return
3.2.2 Selective state-space model
The selective SSM can help the retinal Mamba to capture global dependencies in OCT images, capturing rich semantic disease-related information. The structure of the selective SSM is shown in Figure 4; it is a discretized version of the SSM, where the input is
Here,
After discretizing with the step size
Finally, we employ a convolution operation for convenient optimization of the proposed model. The SSM computation is expressed as follows:
where, in Equation 15,
3.3 Classifier
The classifier is a five-layer perceptron network, including the three hidden layers. The input layer receives the fused feature
where, in Equation 17,
4 Experimental configuration
4.1 Dataset description
Due to the confidentiality and sensitivity of medical data, as well as the high expertise and time costs required for medical image annotation, the use of public datasets has become a common and effective practice in the field of medical image analysis research. Public datasets, such as OCT (optical coherence tomography) image datasets, have been carefully collected and annotated by professional teams to ensure the quality and accuracy of the data. To evaluate our model’s effectiveness, we selected the two public OCT datasets: the OCT-2017 and the OCT-C8. The OCT-2017 dataset1 covers four types of retinal disease images: age-related wet maculopathy (CNV), diabetic macular edema (DME), age-related dry maculopathy (DRUSEN), and normal retinal images (NORMAL). The dataset comes from 4,686 patients with different eye diseases and contains a total of 84,484 images. There are 37,205 CNV images, 8,616 DRUSEN images, 11,348 DME images, and 26,315 NORMAL images in the training set. The testing set contains 1,000 images, with 250 each of various lesions and normal images, which are used to evaluate model performance. The OCT-C8 dataset2 contains a total of 24,000 images with eight categories. Each category has 2,300, 350, and 350 images for training, validation, and testing, respectively. The largest resolution of the OCT image is
In order to develop a unified model framework, we resize every OCT image into the same size:
4.2 Model training details
In the Conv block,
4.3 Evaluation metrics
In the multi-category classification task, we use the mean accuracy (mACC), mean sensitivity (mSEN), mean specificity (mSPE), mean precision (mPRE), mean F1-score (mF1), and overall accuracy (OACC). First, we compute the ACC, SEN, SPE, and PRE for each category and then average them for all the categories. During the evaluation, for each category, we treat it as a binary classification, where the positive label is itself and the negative label is the remaining categories. Therefore, TP represents the count of samples that are correctly identified as belonging to the positive category by the network’s predictions, matching their true-positive labels. FP denotes the number of samples that are incorrectly labeled as positive by the network’s predictions, despite their true labels being negative. TN stands for the count of samples that are accurately classified as negative by the network’s predictions, aligning with their genuine negative labels. FN signifies the number of samples that are erroneously classified as negative by the network, whereas their true labels are positive.
where
Equations 19–24 are used to evaluate the diagnosis performance of different methods on the ADNI and ABIDE datasets.
5 Results
5.1 Prediction results
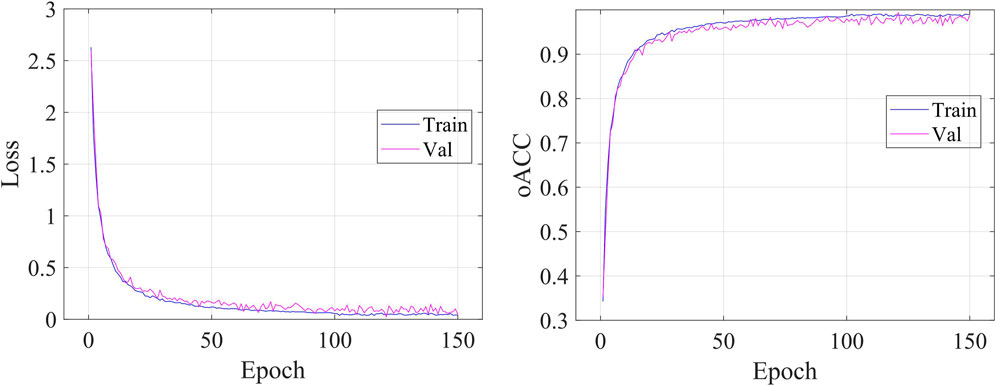
Figure 5 shows the details during the training. The left graph shows the curve of loss changing with epochs, and the right subfigure shows the curve of overall accuracy changing with the epochs. Both the training and validating losses show a stable trend. The little gap between them indicates that our model is a good fit model. The confusion matrix of the classification results is shown in Figure 6. Our model shows accurate classification performance on the OCT2017 dataset, with almost no errors in each category. In the OCT-C8 dataset, our model also performs well on most categories, except the CNV and DME categories. Table 2 shows the classification performance of the model on two different datasets (OCT2017 and OCT-C8). For each category, the ACC, SEN, PRE, F1, and SPE of each category are calculated according to the binary classification algorithm. For the OCT-2017 dataset, the average accuracy (mACC) and overall accuracy (oACC) of the model are 99.49% and 98.98%, respectively. For the OCT-C8 dataset, the overall accuracy of the model is 96.21%. Although the model achieved 100% of the indicators in the AMD category, the sensitivity in the CNV and DME classifications was relatively low (92.67% and 91.00%, respectively), resulting in a slight decrease in the
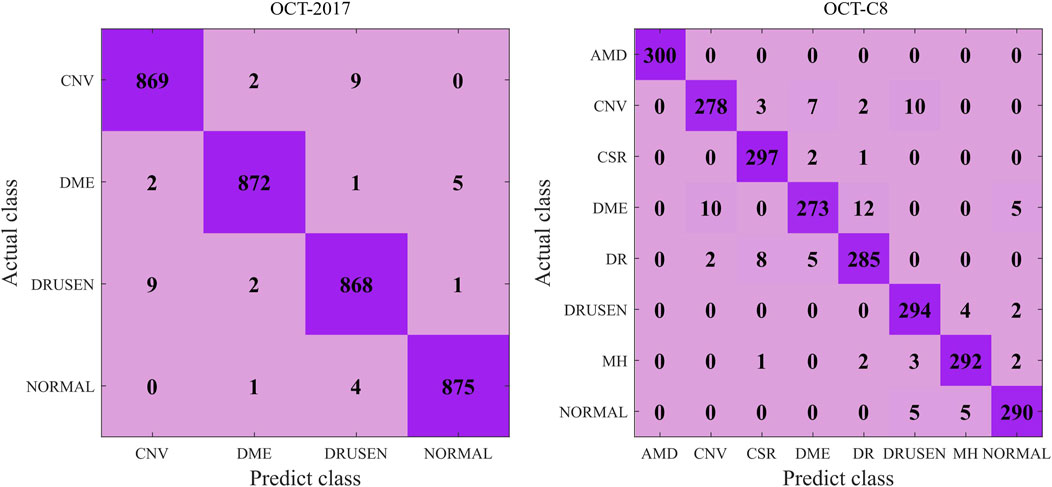
Figure 6. Confusion matrix of the predicted results on the OCT-2017 and OCT-C8 datasets using our model.
5.2 Comparative analysis
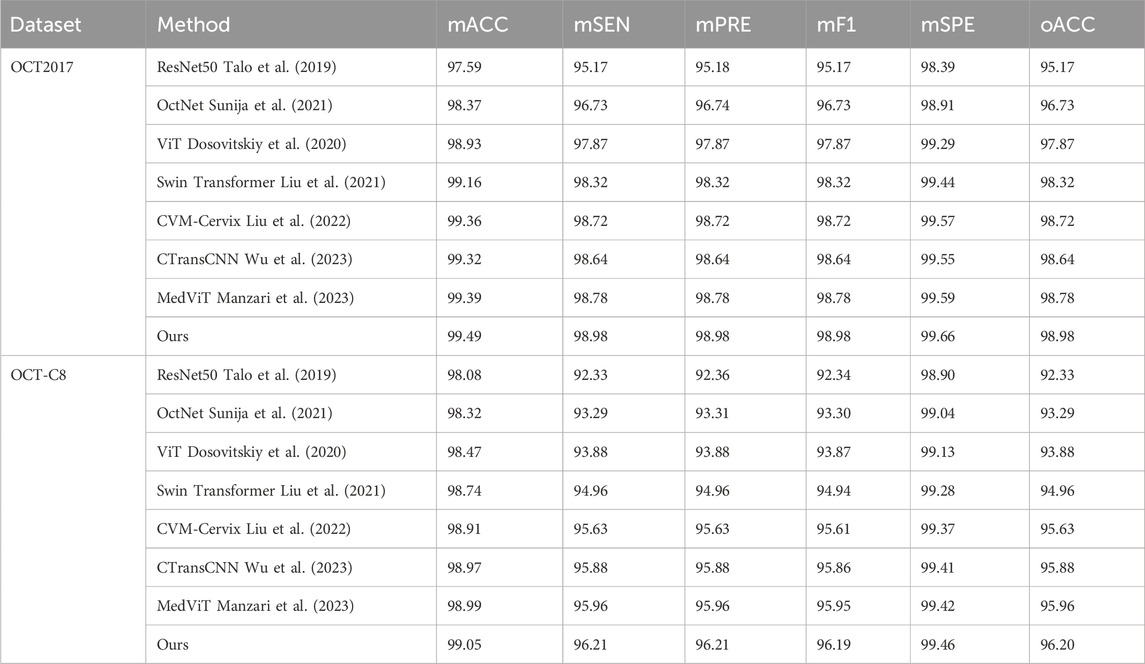
To demonstrate our model’s superiority, we select seven competing methods to test on our model and compare the classification performance. These methods include the baseline ResNet Talo et al. (2019), the CNN-based OctNet method Sunija et al. (2021), the ViT model Dosovitskiy et al. (2020), the Swin transformer model Liu et al. (2021), the CVM-Cervix model Liu et al. (2022), the CTransCNN model Wu et al. (2023), and the MedVit model Manzari et al. (2023). The last three hybrid models combine the CNN and transformer to conduct image classifications.
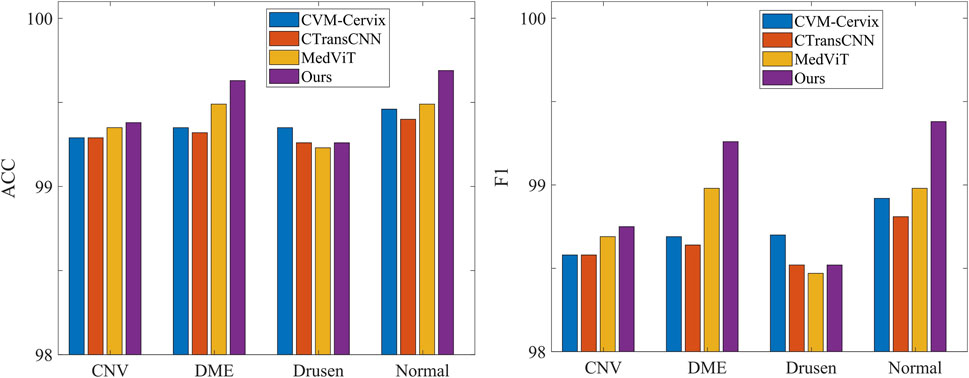
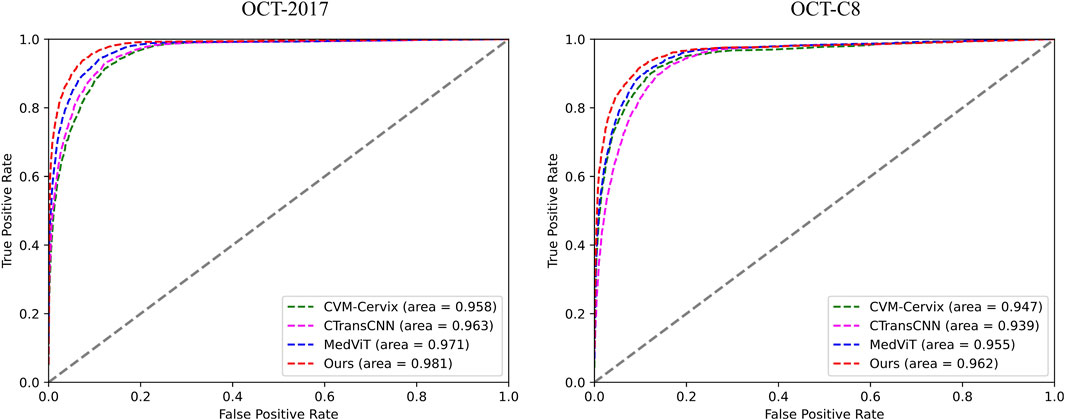
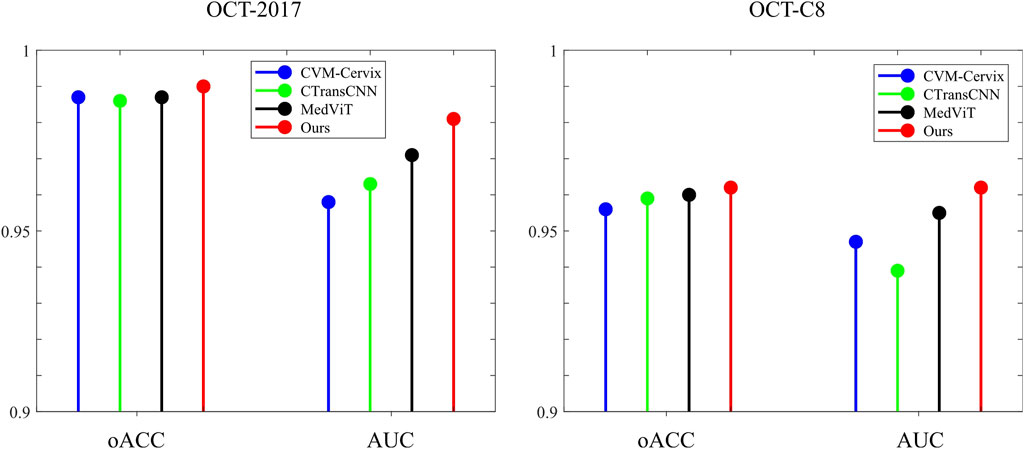
Table 3 demonstrates the comparison of the performance of different methods in multi-category classification tasks on the OCT2017 and OCT-C8 data sets. The evaluation indicators in the table include average accuracy (mACC), average sensitivity (mSEN), average precision (mPRE), average F1 value (mF1), average specificity (mSPE), and overall accuracy (oACC). On the OCT2017 dataset, our model performs best on all metrics, reaching an mACC value of 99.49% and an oACC value of 98.98%. On the OCT-C8 data set, our model also demonstrates strong generalization capabilities, outperforming other methods with an mACC of 99.05% and an oACC of 96.20%. Furthermore, we compare our model with the three hybrid models in terms of the ACC and F1 for each category. Figures 7, 8 show the classification performance of four methods (CVM-Cervix, CTransCNN, MedViT, and Ours) on the OCT-2017 dataset and OCT-C8 dataset, respectively. For the CNV category, our method slightly outperforms other methods in both ACC and F1 values, but the advantage is not obvious. For the DME category, our method significantly outperforms other methods, especially on the F1 value. For the Drusen category, both ACC and F1 values of our method are better than CVM-Cervix and CTransCNN, but slightly lower compared to MedViT. For the normal category, our method has significant advantages in both ACC and F1 values. We also compare the ROC of these four methods, and the results are shown in Figures 9, 10. Our model has the highest AUC value of 0.981 and 0.962 for OCT-2017 and OCT-C8, respectively. Our method has the best classification performance in overall accuracy and high AUC among these competing methods.
5.3 Ablation studies
To investigate the influence of different modules on the evaluation performance, we focus on the convolutional module (Conv), the multi-resolution (MR) strategy, the multi-path (MP) in the retinal Mamba, and the enhanced Mamba (EM). The MR removal means that we only keep the retinal Mamba in resolution-1. The MP removal means we remove the path-2, path-3, and path-4 in the retinal Mamba network. Removing EM means we delete the R-SiLU module in the enhanced Mamba.
Table 4 shows the impact of different modules (Conv, MR, MP, and EM) on the classification performance of our model. Specifically, the combination of all modules (Conv, MR, MP, and EM) performed best on both OCT2017 and OCT-C8 datasets. After removing the EM module, the classification performance shows an approximately 0.1 percent decrease. The Conv and MR modules both contribute to the improvement of our model’s classification performance. We further remove the Mamba-related modules (including MR, MP, and EM), and the oACC decreased by approximately 2.1 percentage and 1.2 percentage points on the OCT-2017 dataset and OCT-C8 dataset, respectively. This shows that each module plays an important role in the model, especially the Conv module and MR module, which are particularly critical to improving the overall performance. The lack of any module will lead to a decrease in the classification performance.
5.4 Discussion
Our model demonstrates good classification performance and generalization on two public datasets. Comparative analysis using different competing methods also shows our model’s superiority. The good performance of our model can be attributed to its great ability in feature extraction at multi-scales. Both global dependencies and local receptive fields can explore the underlying complex disease-related cues. The gradient-weighted class activation mapping (Grad-CAM) visualization can analyze and understand activation regions of different classes. We use it to show how our model captures the key cues in the retinal OCT image classification. As shown in Figure 11, the use of the Grad-CAM generates a heatmap with the size of the raw OCT image and shows the key areas in the OCT image that contribute most to the predicted label. To investigate our model’s robustness, we added a certain degree of noise to the original OCT images and followed the same training procedures. Table 5 shows the classification performance of our model under multiple noise levels. For the OCT2017 dataset, as the noise level increases from 0% to 10%, the mACC and oACC decrease from 99.49% and 99.98% to 99.19% and 98.38%, respectively. For the OCT-C8 dataset, the mACC and oACC decrease from 99.05% and 96.21% to 98.93% and 95.71%, respectively. Similarly, despite the slight performance degradation caused by noise, the model still maintains high accuracy and robustness under the influence of noise. Overall, the performance of the model under different noise conditions shows strong stability, especially under low-to-medium noise levels (1% and 5%); the classification performance only fluctuates slightly, indicating that the model has good resistance to noise.
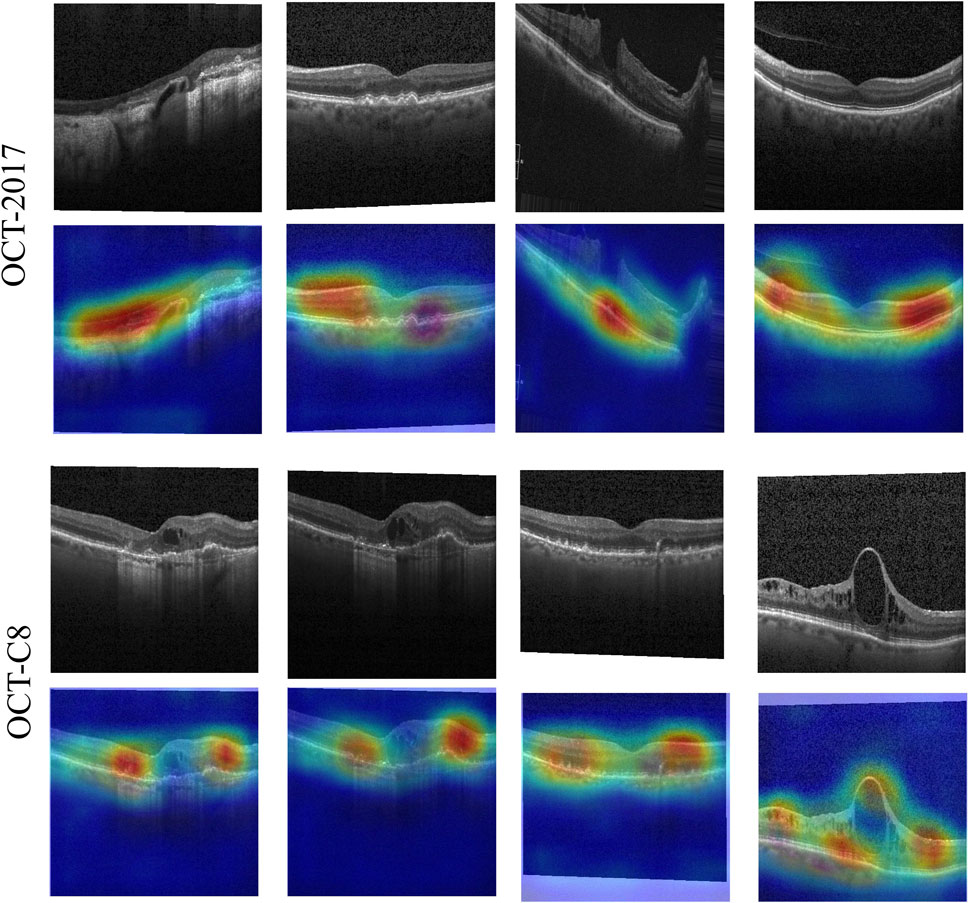
Figure 11. Activation heatmaps of different retinal OCT images using our model. The upper row is the raw OCT images, and the bottom row is the activation heatmaps using the Grad-CAM method.
The main limitation of our model is the lack of multimodal retinal images. Single-modality retinal OCT images may not capture all pathological features of the retina. Single-modality retinal images can only provide information on one aspect but lack a comprehensive understanding of the global perspective. A single modality may not be able to fully assess the progression of the disease or other relevant pathological features. In the next study, we will add multimodal retinal images (i.e., fundus images) to more precisely detect retinal diseases.
6 Conclusion
This paper presents the multi-resolution visual Mamba (MRVM) model, designed to enhance OCT image classification performance by addressing long-range dependencies with linear computational complexity. The MRVM model first utilizes convolution operations to extract local features from OCT images and then leverages the retinal Mamba to capture global dependencies. By integrating multi-scale global features, the model not only improves classification accuracy but also boosts overall performance and robustness. A key innovation of the MRVM is its multi-directional selection mechanism, which enhances feature extraction by focusing on various directions to capture intricate, orientation-specific retinal patterns. Experimental results demonstrate that the MRVM model excels in distinguishing diverse retinopathy images, achieving a significant accuracy improvement over traditional methods—0.2 percentage points higher—with overall accuracies of 98.98% and 96.21% on the OCT2017 and OCT-C8 datasets, respectively. This advancement holds promise for automatic retinal disease diagnosis and could be valuable in clinical settings.
Data availability statement
The raw data supporting the conclusion of this article will be made available by the authors, without undue reservation.
Author contributions
QZ: conceptualization, formal analysis, funding acquisition, methodology, resources, software, validation, visualization, and writing–original draft. ZS: formal analysis, investigation, validation, and writing–review and editing. BL: conceptualization, formal analysis, software, validation, and writing–review and editing. NP: data curation, formal analysis, investigation, and writing–review and editing. JW: conceptualization, formal analysis, investigation, software, and writing–review and editing. XC: data curation, formal analysis, methodology, and writing–review and editing. KZ: data curation, software, validation, and writing–review and editing. JG: conceptualization, methodology, validation, visualization, and writing–review and editing. YW: data curation, investigation, software, and writing–review and editing. JH: investigation, project administration, resources, supervision, and writing–review and editing.
Funding
The author(s) declare that financial support was received for the research, authorship, and/or publication of this article. This work was supported in part by the National Natural Science Foundation of China (62406107, 62466033), in part by the Natural Science Foundation of Hubei Province (2023AFB004 and 2023AFB003), in part by the Jiangxi Provincial Natural Science Foundation (20242BAB20070), in part by the Education Department Scientific Research Program Project of Hubei Province of China (Grant Number Q20232206).
Conflict of interest
The authors declare that the research was conducted in the absence of any commercial or financial relationships that could be construed as a potential conflict of interest.
Publisher’s note
All claims expressed in this article are solely those of the authors and do not necessarily represent those of their affiliated organizations, or those of the publisher, the editors, and the reviewers. Any product that may be evaluated in this article, or claim that may be made by its manufacturer, is not guaranteed or endorsed by the publisher.
Footnotes
1http://data.mendeley.com/datasets/rscbjbr9sj/2
2http://kaggle.com/datasets/obulisainaren/retinal-oct-c8
References
Alqudah, A. M. (2020). Aoct-net: a convolutional network automated classification of multiclass retinal diseases using spectral-domain optical coherence tomography images. Med. and Biol. Eng. and Comput. 58, 41–53. doi:10.1007/s11517-019-02066-y
Bouma, B. E., de Boer, J. F., Huang, D., Jang, I.-K., Yonetsu, T., Leggett, C. L., et al. (2022). Optical coherence tomography. Nat. Rev. Methods Prim. 2, 79. doi:10.1038/s43586-022-00162-2
Daich Varela, M., Sen, S., De Guimaraes, T. A. C., Kabiri, N., Pontikos, N., Balaskas, K., et al. (2023). Artificial intelligence in retinal disease: clinical application, challenges, and future directions. Graefe’s Archive Clin. Exp. Ophthalmol. 261, 3283–3297. doi:10.1007/s00417-023-06052-x
Das, V., Dandapat, S., and Bora, P. K. (2021). Automated classification of retinal oct images using a deep multi-scale fusion cnn. IEEE Sensors J. 21, 23256–23265. doi:10.1109/jsen.2021.3108642
Dosovitskiy, A., Beyer, L., Kolesnikov, A., Weissenborn, D., Zhai, X., Unterthiner, T., et al. (2020). “An image is worth 16x16 words: transformers for image recognition at scale,” in International conference on learning representations.
Gu, A., and Dao, T. (2023). Mamba: linear-time sequence modeling with selective state spaces. arXiv Prepr. arXiv:2312.00752. doi:10.48550/arXiv.2312.00752
Hammou, B. A., Antaki, F., Boucher, M.-C., and Duval, R. (2023). Mbt: model-based transformer for retinal optical coherence tomography image and video multi-classification. Int. J. Med. Inf. 178, 105178. doi:10.1016/j.ijmedinf.2023.105178
He, J., Wang, J., Han, Z., Ma, J., Wang, C., and Qi, M. (2023). An interpretable transformer network for the retinal disease classification using optical coherence tomography. Sci. Rep. 13, 3637. doi:10.1038/s41598-023-30853-z
Hemalakshmi, G., Murugappan, M., Sikkandar, M. Y., Begum, S. S., and Prakash, N. (2024). Automated retinal disease classification using hybrid transformer model (svit) using optical coherence tomography images. Neural Comput. Appl. 36, 9171–9188. doi:10.1007/s00521-024-09564-7
Hong, J., Yu, S. C.-H., and Chen, W. (2022a). Unsupervised domain adaptation for cross-modality liver segmentation via joint adversarial learning and self-learning. Appl. Soft Comput. 121, 108729. doi:10.1016/j.asoc.2022.108729
Hong, J., Zhang, Y.-D., and Chen, W. (2022b). Source-free unsupervised domain adaptation for cross-modality abdominal multi-organ segmentation. Knowledge-Based Syst. 250, 109155. doi:10.1016/j.knosys.2022.109155
Ji, Y.-K., Hua, R.-R., Liu, S., Xie, C.-J., Zhang, S.-C., and Yang, W.-H. (2024). Intelligent diagnosis of retinal vein occlusion based on color fundus photographs. Int. J. Ophthalmol. 17 (1), 1–6. doi:10.18240/ijo.2024.01.01
Karthik, K., and Mahadevappa, M. (2023). Convolution neural networks for optical coherence tomography (oct) image classification. Biomed. Signal Process. Control 79, 104176. doi:10.1016/j.bspc.2022.104176
Lanzani, G., Chiaravalli, G., Colombo, E., Manfredi, G., Di Marco, S., Vurro, V., et al. (2024). Nanotechnology for vision restoration. Nat. Rev. Bioeng., 1–20. doi:10.1038/s44222-024-00210-4
Laouarem, A., Kara-Mohamed, C., Bourennane, E.-B., and Hamdi-Cherif, A. (2024). Htc-retina: a hybrid retinal diseases classification model using transformer-convolutional neural network from optical coherence tomography images. Comput. Biol. Med. 178, 108726. doi:10.1016/j.compbiomed.2024.108726
Li, S., Zhao, S., Zhang, Y., Hong, J., and Chen, W. (2024). Source-free unsupervised adaptive segmentation for knee joint mri. Biomed. Signal Process. Control 92, 106028. doi:10.1016/j.bspc.2024.106028
Liu, W., Li, C., Xu, N., Jiang, T., Rahaman, M. M., Sun, H., et al. (2022). Cvm-cervix: a hybrid cervical pap-smear image classification framework using cnn, visual transformer and multilayer perceptron. Pattern Recognit. 130, 108829. doi:10.1016/j.patcog.2022.108829
Liu, Z., Lin, Y., Cao, Y., Hu, H., Wei, Y., Zhang, Z., et al. (2021). “Swin transformer: hierarchical vision transformer using shifted windows,” in Proceedings of the IEEE/CVF international conference on computer vision, 10012–10022.
Manzari, O. N., Ahmadabadi, H., Kashiani, H., Shokouhi, S. B., and Ayatollahi, A. (2023). Medvit: a robust vision transformer for generalized medical image classification. Comput. Biol. Med. 157, 106791. doi:10.1016/j.compbiomed.2023.106791
Parvaiz, A., Khalid, M. A., Zafar, R., Ameer, H., Ali, M., and Fraz, M. M. (2023). Vision transformers in medical computer vision—a contemplative retrospection. Eng. Appl. Artif. Intell. 122, 106126. doi:10.1016/j.engappai.2023.106126
Playout, C., Duval, R., Boucher, M. C., and Cheriet, F. (2022). Focused attention in transformers for interpretable classification of retinal images. Med. Image Anal. 82, 102608. doi:10.1016/j.media.2022.102608
Rauchman, S. H., Albert, J., Pinkhasov, A., and Reiss, A. B. (2022). Mild-to-moderate traumatic brain injury: a review with focus on the visual system. Neurol. Int. 14, 453–470. doi:10.3390/neurolint14020038
Rong, Y., Xiang, D., Zhu, W., Yu, K., Shi, F., Fan, Z., et al. (2018). Surrogate-assisted retinal oct image classification based on convolutional neural networks. IEEE J. Biomed. health Inf. 23, 253–263. doi:10.1109/JBHI.2018.2795545
Shen, J., Hu, Y., Zhang, X., Gong, Y., Kawasaki, R., and Liu, J. (2023). Structure-oriented transformer for retinal diseases grading from oct images. Comput. Biol. Med. 152, 106445. doi:10.1016/j.compbiomed.2022.106445
Sunija, A., Kar, S., Gayathri, S., Gopi, V. P., and Palanisamy, P. (2021). Octnet: a lightweight cnn for retinal disease classification from optical coherence tomography images. Comput. methods programs Biomed. 200, 105877. doi:10.1016/j.cmpb.2020.105877
Talo, M., Yildirim, O., Baloglu, U. B., Aydin, G., and Acharya, U. R. (2019). Convolutional neural networks for multi-class brain disease detection using mri images. Comput. Med. Imaging Graph. 78, 101673. doi:10.1016/j.compmedimag.2019.101673
Wan, C., Fang, J., Hua, X., Chen, L., Zhang, S., and Yang, W. (2023a). Automated detection of myopic maculopathy using five-category models based on vision outlooker for visual recognition. Front. Comput. Neurosci. 17, 1169464. doi:10.3389/fncom.2023.1169464
Wan, C., Fang, J., Li, K., Zhang, Q., Zhang, S., and Yang, W. (2024a). A new segmentation algorithm for peripapillary atrophy and optic disk from ultra-widefield photographs. Comput. Biol. Med. 172, 108281. doi:10.1016/j.compbiomed.2024.108281
Wan, C., Hua, R., Li, K., Hong, X., Fang, D., and Yang, W. (2023b). Automatic diagnosis of different types of retinal vein occlusion based on fundus images. Int. J. Intelligent Syst. 2023, 1–13. doi:10.1155/2023/1587410
Wan, C., Mao, Y., Xi, W., Zhang, Z., Wang, J., and Yang, W. (2024b). Dbpf-net: dual-branch structural feature extraction reinforcement network for ocular surface disease image classification. Front. Med. 10, 1309097. doi:10.3389/fmed.2023.1309097
Wang, D., and Wang, L. (2019). On oct image classification via deep learning. IEEE Photonics J. 11, 1–14. doi:10.1109/jphot.2019.2934484
Wen, H., Zhao, J., Xiang, S., Lin, L., Liu, C., Wang, T., et al. (2022). Towards more efficient ophthalmic disease classification and lesion location via convolution transformer. Comput. Methods Programs Biomed. 220, 106832. doi:10.1016/j.cmpb.2022.106832
Wu, X., Feng, Y., Xu, H., Lin, Z., Chen, T., Li, S., et al. (2023). Ctranscnn: combining transformer and cnn in multilabel medical image classification. Knowledge-Based Syst. 281, 111030. doi:10.1016/j.knosys.2023.111030
Xu, J., Shen, J., Jiang, Q., Wan, C., Zhou, F., Zhang, S., et al. (2023). A multi-modal fundus image based auxiliary location method of lesion boundary for guiding the layout of laser spot in central serous chorioretinopathy therapy. Comput. Biol. Med. 155, 106648. doi:10.1016/j.compbiomed.2023.106648
Xu, J., Shen, J., Yan, Z., Zhou, F., Wan, C., and Yang, W. (2022). An intelligent location method of key boundary points for assisting the diameter measurement of central serous chorioretinopathy lesion area. Comput. Biol. Med. 147, 105730. doi:10.1016/j.compbiomed.2022.105730
You, S., Lei, B., Wang, S., Chui, C. K., Cheung, A. C., Liu, Y., et al. (2022). Fine perceptive gans for brain mr image super-resolution in wavelet domain. IEEE Trans. neural Netw. Learn. Syst. 34, 8802–8814. doi:10.1109/TNNLS.2022.3153088
You, S., Yuan, B., Lyu, Z., Chui, C. K., Chen, C. P., Lei, B., et al. (2024). Generative ai enables synthesizing cross-modality brain image via multi-level-latent representation learning. IEEE Trans. Comput. Imaging 10, 1152–1164. doi:10.1109/tci.2024.3434724
Yu, S., Ma, K., Bi, Q., Bian, C., Ning, M., He, N., et al. (2021). “Mil-vt: multiple instance learning enhanced vision transformer for fundus image classification,” in Medical image computing and computer assisted intervention–MICCAI 2021: 24th international conference, strasbourg, France, september 27–october 1, 2021, proceedings, Part VIII 24 (Springer), 45–54.
Yu, W., Lei, B., Wang, S., Liu, Y., Feng, Z., Hu, Y., et al. (2022). Morphological feature visualization of alzheimer’s disease via multidirectional perception gan. IEEE Trans. Neural Netw. Learn. Syst. 34, 4401–4415. doi:10.1109/TNNLS.2021.3118369
Zhang, Y., Hong, J., and Chen, S. (2023). Medical big data and artificial intelligence for healthcare. Dataset 13, 3745. doi:10.3390/app13063745
Zhu, L., Liao, B., Zhang, Q., Wang, X., Liu, W., and Wang, X. (2024). Vision mamba: efficient visual representation learning with bidirectional state space model. arXiv Prepr. arXiv:2401.09417. doi:10.48550/arXiv.2401.09417
Zong, Y., Zuo, Q., Ng, M. K.-P., Lei, B., and Wang, S. (2024). A new brain network construction paradigm for brain disorder via diffusion-based graph contrastive learning. IEEE Trans. Pattern Analysis Mach. Intell., 1–16. doi:10.1109/TPAMI.2024.3442811
Zuo, Q., Chen, L., Shen, Y., Ng, M. K.-P., Lei, B., and Wang, S. (2024). Bdht: generative ai enables causality analysis for mild cognitive impairment. IEEE Trans. Automation Sci. Eng., 1–13. doi:10.1109/tase.2024.3425949
Zuo, Q., Shen, Y., Zhong, N., Chen, C. P., Lei, B., and Wang, S. (2023a). Alzheimer’s disease prediction via brain structural-functional deep fusing network. IEEE Trans. Neural Syst. Rehabilitation Eng. 31, 4601–4612. doi:10.1109/TNSRE.2023.3333952
Keywords: retinal disease detection, state-space model, global–local feature, multi-scale fusion, multi-directional selective learning
Citation: Zuo Q, Shi Z, Liu B, Ping N, Wang J, Cheng X, Zhang K, Guo J, Wu Y and Hong J (2024) Multi-resolution visual Mamba with multi-directional selective mechanism for retinal disease detection. Front. Cell Dev. Biol. 12:1484880. doi: 10.3389/fcell.2024.1484880
Received: 22 August 2024; Accepted: 20 September 2024;
Published: 11 October 2024.
Edited by:
Yanwu Xu, Baidu, ChinaReviewed by:
Siyuan Lu, Nanjing University of Posts and Telecommunications, ChinaRongli Zhang, The University of Hong Kong, Hong Kong, SAR China
Cunjing Zheng, Sun Yat-sen University, China
Copyright © 2024 Zuo, Shi, Liu, Ping, Wang, Cheng, Zhang, Guo, Wu and Hong. This is an open-access article distributed under the terms of the Creative Commons Attribution License (CC BY). The use, distribution or reproduction in other forums is permitted, provided the original author(s) and the copyright owner(s) are credited and that the original publication in this journal is cited, in accordance with accepted academic practice. No use, distribution or reproduction is permitted which does not comply with these terms.
*Correspondence: Jia Guo, Z3VvamlhQGhidWUuZWR1LmNu; Jin Hong, aG9uZ2ppbkBuY3UuZWR1LmNu
 Qiankun Zuo
 Zhengkun Shi2
 Jia Guo
 Jin Hong