 Chanjuan He1,2†
 Yuehan Wu1,3†
 Xiaoxu Nan1,3Weifang Zhang4Yu Luo1,3Honglan Wang1,3Mengqi Li1,3Changyue Liu1,3Jiaming Liu1,3Xuelin Mou1,3
 Ying Liu1,3*
- 1Department of Stomatology, Affiliated Hospital of North Sichuan Medical College, Nanchong, China
- 2Changsha Stomatological Hospital, Changsha, China
- 3Department of Stomatology, North Sichuan Medical College, Nanchong, China
- 4Hunan Prevention and Treatment Institute for Occupational Diseases, Changsha, China
Purpose: This study aimed to explore the expression of CX3CL1 induced by lipopolysaccharide (LPS) in oral squamous cell carcinoma (OSCC) and its impact on biological characteristics such as invasion and migration, taking the foundation for new targets for the treatment and prognosis of OSCC.
Methods: This study utilized a variety of techniques, including bioinformatics, molecular biology, and cell experiments, to investigate the expression of CX3CL1 and its receptor CX3CR1 in OSCC patients’ cancer tissues or OSCC cell lines. Extracting, organizing, and analyzing the TCGA database on the expression of CX3CL1 and its receptor CX3CR1 in cancer tissues and corresponding paracancerous normal tissues of OSCC patients by bioinformatics methods. The expression of CX3CL1 in cancerous and normal tissues of OSCC patients was verified by IHC, and the changes in mRNA and protein expression of CX3CL1 and its receptor CX3CR1 in OSCC cell lines were detected before and after lipopolysaccharide LPS stimulation by RT-PCR, ELISA, and WB. Changes in cell biological behavior by overexpression of CX3CL1 in OSCC cell lines were detected by CCK-8, Transwell, scratch healing assay, and cloning assay. The effects of overexpressing cell lines on the AKT pathway and Epithelial-mesenchymal Transition (EMT)-related protein expression before and after LPS stimulation were detected by Western Blot.
Results: (1) CX3CL1 and its receptor CX3CR1 were found to be downregulated in OSCC tissues of patients or OSCC cell lines. (2) After LPS stimulation, CX3CL1 gene expression increased in both OSCC cell lines, while CX3CR1 expression remained unchanged. (3) OSCC cell lines overexpressing CX3CL1 showed changes in cell biological characteristics, including decreased proliferation, invasion, migration, and stemness, which were more pronounced after LPS stimulation. (4) Overexpression of CX3CL1 in OSCC cell lines decreased EMT-related protein expression and AKT phosphorylation. On the contrary were promoted by LPS stimulation.
Conclusion: CX3CL1 and CX3CR1 are downregulated in OSCC cancer tissues and cell lines compared to adjacent normal tissues and cells. LPS stimulation increases CX3CL1 expression in OSCC cell lines, suggesting that inflammation may induce CX3CL1 expression and that the CX3CL1 gene may play an important role in OSCC progression. Overexpression of CX3CL1 inhibits OSCC cell proliferation, migration, invasion, and stemness, suggesting that CX3CL1 plays a critical role in suppressing OSCC development. CX3CL1 suppresses OSCC invasion and migration by affecting EMT progression and AKT phosphorylation, and partially reverse the process that LPS causes and affects the development of OSCC.
1 Introduction
Oral squamous cell carcinoma (OSCC) is one of the most common cancers of the oral and maxillofacial, and is considered one of the most prevalent cancers worldwide. It is characterized by high incidence, strong recurrence ability, and low 5-year survival rate, making it a significant public health issue worldwide (Bray et al., 2018; Madhura et al., 2020; Ling et al., 2021). Although surgical treatment with adjuvant radiotherapy or chemotherapy remains the mainstay of therapy, it can cause irreversible damage to patients’ quality of life and psychological health. Therefore, studying and understanding the mechanisms and processes of OSCC can help identify new genetic targets, and is of great significance for improving the treatment and survival rates of OSCC.
The occurrence and development of OSCC are closely related to complex genetic and environmental factors. Research has shown that inflammation is caused by the body’s immune response to foreign substances, and that patients with OSCC have a large number of pathogenic microorganisms in their oral cavity. When the microenvironment is disrupted, it may have an impact on the occurrence and development of OSCC (He et al., 2015; Zhang et al., 2019; Kakabadze et al., 2020; Kong et al., 2020). Lipopolysaccharide (LPS) is the main component of the cell wall and endotoxin of Gram-negative bacteria, and is an important molecule in bacterial pathogenesis. Numerous studies have shown that LPS plays an important role in promoting invasion and migration of OSCC (Huang et al., 2017; Oliveira et al., 2017; Ye et al., 2021; Omori et al., 2024). Our previous studies have shown that LPS stimulates the NLRP3/Caspase-1 inflammatory signaling pathway to promote the proliferation and migration of oral squamous cell cancer cells (He et al., 2023).
Inflammation is a process that is caused by a local or systemic immune response involving many cytokines, immune cells, and other factors. Chemokines are a class of proteins secreted by various types of cells that have functions such as chemotaxis (Brennan et al., 2024), regulating leukocyte migration and homing, and participating in inflammatory and immune regulatory processes. They play an especially important role in inflammation control and maintaining homeostasis in the body (Bhatia and Burtness, 2023). Chemokines and their receptors also play important roles in the occurrence and development of various types of cancers, such as cervical cancer (Dreyer et al., 2021) and colorectal cancer (Garrido et al., 2021), and some chemokines are closely related to the poor clinical prognosis of various cancers.
CX3CL1, also known as Fractalkine, is the only member of the CX3C chemokine family, and its only receptor is CX3CR1. It has two forms: membrane-bound and soluble, which mediate different biological activities. The membrane-bound form enhances cell adhesion, while soluble CX3CL1 has the function of chemotaxis towards cells expressing CX3CR1. CX3CL1 is the only member of the CX3C chemokine subfamily and has been shown to have anti-cancer effects in other tumors such as colon cancer (Hughes and Nibbs, 2018), breast cancer (Kadomoto et al., 2020), and cervical cancer (Khare et al., 2021). It also has important implications in regulating inflammation and cancer metastasis. However, the role of CX3CL1 in OSCC is not well understood and has been subject to controversy.CX3CL1 exhibits markedly different effects in different types of tumors, especially in OSCC, where research is limited and whether it promotes or inhibits cancer remains unclear (Li et al., 2020; Kavarthapu and Gurumoorthy, 2021).
Currently, there are some studies on LPS and other types of tumors, but there has been no research that combines LPS, CX3CL1-CX3CR1 axis, and oral cancer. Therefore, it is crucial to explore the relationship between LPS, CX3CL1, and OSCC, which is important for early diagnosis, treatment, prognosis prediction, improving the quality of life for patients, and increasing the 5-year survival rate. This research also provides a new perspective for exploring the development of OSCC.
2 Materials and methods
2.1 Bioinformatics analysis
The genetic data related to cancer tissues and adjacent tissues of oral squamous cell carcinoma (OSCC) patients were downloaded from the TCGA database (GDC(cancer.gov)), and the expression profiles of CX3CL1 and CX3CR1 in cancer tissues and corresponding adjacent tissues of OSCC patients were constructed through data analysis.
2.2 Patients, specimens and tissue collection
We collected clinical and pathological specimens from 25 patients who underwent radical surgery for OSCC in the Department of Oral and Maxillofacial Surgery at the Affiliated Hospital of North Sichuan Medical College between September 2020 and December 2022, after excluding and including according to strict criteria. Immediately after tumor resection, OSCC tissues of 0.5 cm–1 cm size without necrosis were excised from the tumor site, and adjacent normal tissues (ANTs) of 0.5 cm–1 cm size were collected from areas more than 3 cm away from the tumor margin. These tissues were aliquoted into enzyme-free EP tubes, labeled, and rapidly cooled in liquid nitrogen before being stored at −80°C.The study was approved by the Ethics Committee of the Affiliated Hospital of North Sichuan Medical College (ethics approval number: 2022ER111-1).
2.3 Cell culture
The OSCC cell lines HSC3, SCC25, CAL27 and UM1, as well as the normal oral mucosal epithelial cell line HOK, were used in this study and authenticated by Short Tandem Repeat (STR) analysis. These cells were cultured in a humidified incubator at 37°C and 5% CO2.
2.4 Stimulation of OSCC cell lines with lipopolysaccharide (LPS)
When the cell growth reached 70%–80% confluence, the cells were extracted and counted as described above, and then seeded. After the cells adhered to the culture dish, LPS was added. LPS was diluted to 1 μg/mL and 10 μg/mL using complete culture medium, and the cell lines were stimulated for 6 h, 12 h, 24 h, 36 h, and 48 h. The cells were harvested for subsequent experiments.
2.5 qRT-PCR
The cell pellets were lysed and total RNA was extracted using TRIzol reagent. The extracted RNA was then reverse transcribed into cDNA using HiScript II Q RT SuperMix from Vazyme (Beijing, China). Subsequently, quantitative real-time polymerase chain reaction (qPCR) analysis was conducted using ChamQ™ SYBR Color qPCR Master Mix (Vazyme). The specific sequences of primers used for the qPCR analysis can be found in Table 1. The qPCR results were analysed using the 2−ΔΔCT method. Each sample was run in triplicate and the experiment was repeated three times independently. The primer sequences are listed in Table 1 below.
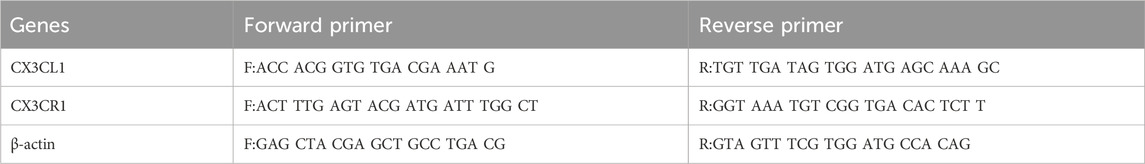
Table 1. Primer sequences.
2.6 Enzyme-linked immunosorbent assay (ELISA)
50 μL of standard solution and the test sample were added to each well of a 96-well plate, followed by the addition of 50 μL of antibody cocktail solution. The plate was covered with a sealing film and incubated for 1 h at room temperature in a dark and shaking incubator at 400 rpm. Each well was washed three times with 1 × washing buffer PT. The liquid in each well was aspirated, and 100 μL of TMB substrate chromogenic reagent was added to each well. The plate was then incubated at room temperature on a shaker in the dark for 10 min. Finally, 100 μL of stop solution was added to each well, mixed gently, and the OD value was recorded at a wavelength of 450 nm using a microplate reader. ELISA kit manufacturer (ZCIBIO, China).
2.7 Western Blot (WB)
The tissue samples were taken out from −80°C freezer and placed on ice. The tissues were cleaned and homogenized in cell lysis buffer. After thorough shaking and centrifugation, the supernatant was collected and the protein concentration was determined using the BCA (Solarbio, Beijing, China) protein assay kit. Protein samples were separated by electrophoresis and transferred to a PVDF membrane, which was then blocked. The membrane was incubated with primary antibodies including CX3CL1 rabbit polyclonal antibody (1:2000, DF12376, Affinity), CX3CR1 rabbit polyclonal antibody (1:2000, DF7096, Affinity), E-cadherin mouse monoclonal antibody (1:2000, U3254, Santa Cruz), N-cadherin rabbit polyclonal antibody (1:500 ER0503,HuaBio), Vimentin rabbit polyclonal antibody (1:1000, R1308-6, HuaBio), Snail rabbit polyclonal antibody (1:500 ER1706-22,HuaBio), AKT rabbit polyclonal antibody (1:1000 9272S, CST) and p-AKT rabbit polyclonal antibody (1:1000 9271S, CST)overnight at 4°C. After washing with TBST for three times (10 min each time), the membrane was incubated with appropriate secondary antibodies for 2 h, followed by washing for three times. The protein bands on the PVDF membrane were visualized by exposure and the gray values were analyzed using ImageJ.
2.8 Cell proliferation (cell counting Kit-8, CCK-8)
Cells with good growth status and fusion degree of 70%–80% were counted, and 2000 cells were evenly seeded in each well of a 96-well plate. Four replicate wells were set for each group. After the cells adhered to the wall, the medium was replaced and LPS and the same volume of sterile PBS were added, and the cells were incubated for different time periods. After different stimulation times, 10 μL of CCK-8 reagent was added to each well and incubated in a 37°C, 5% CO2, saturated humidity incubator for 2 h. The OD value of each well was detected at a wavelength of 450 nm using an ELISA reader.
2.9 Scratch wound healing assay
To measure cell migration, 5 × 10⁵ cells were seeded in each well of a 6-well plate and allowed to form a monolayer. A plastic micropipette tip was used to create a scratch wound, and the wound area was immediately recorded. During this period, serum-free medium was used for culture, and the gap area was recorded 24 h and 36 h after scratching using an inverted microscope. ImageJ software was used to quantify changes in gap area.
2.10 Transwell
Preparing ECM gel by diluting it in serum-free medium at a ratio of 1:5, the diluted ECM gel was added to the upper chamber and incubated in a humidified incubator for 2 h. Meanwhile, cells with 70%–80% confluence and starved for 12 h were counted, resuspended in serum-free medium, and added to the upper chamber. Complete medium was added to the lower chamber. After incubation for 36 h or 48 h, cells were fixed with formalin, washed, dried, and stained. After washing with PBS for 3 times and drying, images were captured.
2.11 Clonal assay
In a six-well plate with a diameter of 35 mm, 500 cells per well were added for cloning assay. The cells were incubated for a period of time and the number of cloned cells over 50 cells was counted using ImageJ software.
2.12 Flow cytometry cell cycle experiment
Collect cells with a fusion rate of 70%–80% by centrifugation, resuspend in PBS, and take 1 × 10⁶ cells per well for the flow cytometry cell cycle experiment. Remove the supernatant after centrifugation and resuspend in freshly prepared 70% ice-cold ethanol for fixation at 4°C overnight for 24 h. Remove the supernatant after centrifugation at 1000 rpm for 5 min and mix with the working solution prepared by adding Rnase A and PI staining solution from the flow cytometry cell cycle kit. Analyze the cell staining results at 488 nm red fluorescence using a flow cytometer.
2.13 Statistical analysis
The experiments were independently repeated three times, and statistical analysis was performed using GraphPad Prism 8.0. One-way ANOVA, t-test, or non-parametric test was used to determine significance, with p < 0.05 considered statistically significant.
3 Result
3.1 Expression of CX3CL1 and CX3CR1 genes in oral squamous cell carcinoma (OSCC) tissue and cell lines
The expression of CX3CL1 and its receptor CX3CR1 in OSCC was validated through bioinformatics analysis, immunohistochemistry, PCR, ELISA, and WB.
3.1.1 Expression of CX3CL1 and CX3CR1 proteins in OSCC tissue was validated by bioinformatics analysis and immunohistochemistry
Bioinformatics analysis showed that CX3CL1 gene expression was significantly lower in OSCC (tissue from 520 patients) compared to pericancerous tissues (tissue from 44 patients) (Figure 1A), and this difference was also observed in OSCC patients in the TCGA database (Figure 1B). Similarly, bioinformatics analysis showed that CX3CR1 expression was significantly lower in OSCC compared to pericancerous tissues (Figure 1C), and this difference was also observed in OSCC patients and their corresponding pericancerous tissues (Figure 1D). These findings were further validated through immunohistochemistry.
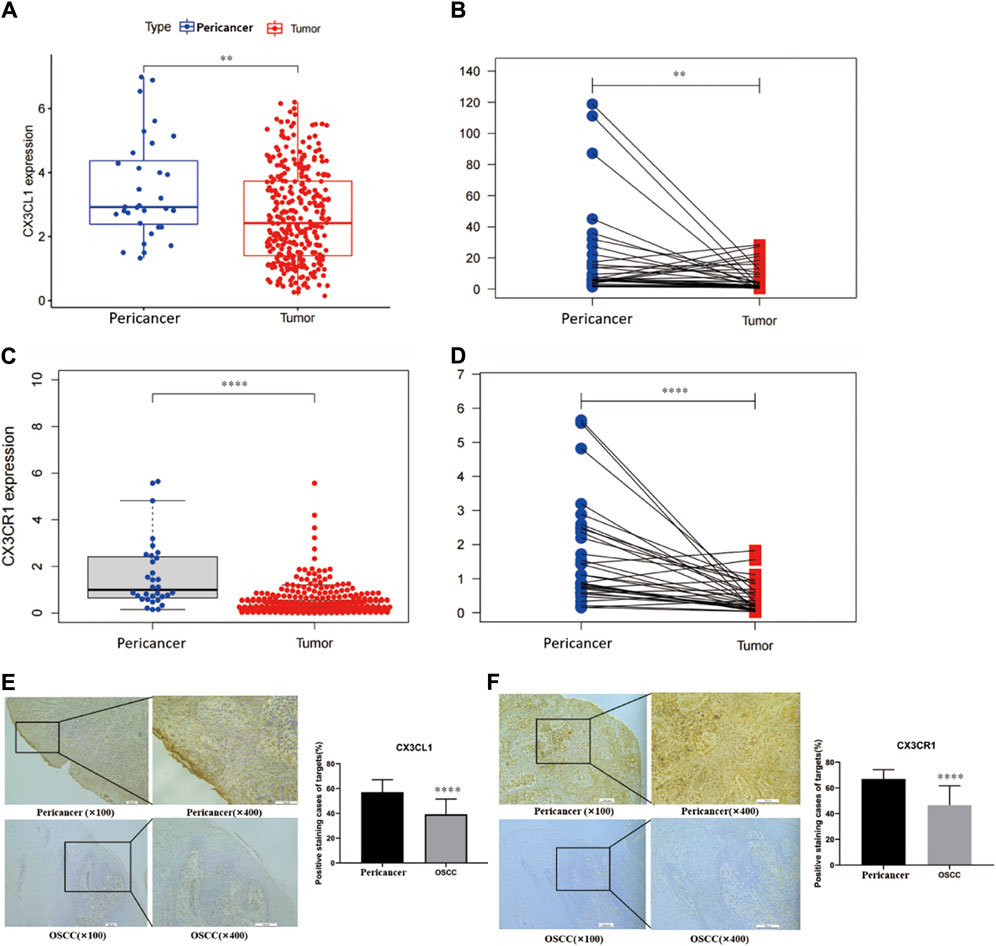
Figure 1. Expression analysis of CX3CL1 and CX3CR1 in OSCC and pericancerous tissues using bioinformatics and immunohistochemistry. Notes: (A) and (C) show the expression levels of CX3CL1 and CX3CR1 in OSCC and pericancerous tissues analyzed by bioinformatics. (B) and (D) show the relative expression levels of CX3CL1 and CX3CR1 in OSCC and pericancerous tissues of patients analyzed by bioinformatics. The results indicate that the expression of CX3CL1 and CX3CR1 is decreased in OSCC compared to pericancerous tissues. Pericancerous tissues are those surrounding tissues in which no cancerous cells are found on pathologic examination, and tumor refers to OSCC tissues. Immunohistochemical staining and corresponding scoring of CX3CL1 (E) and CX3CR1 (F) were performed in 25 OSCC patients and pericancerous tissues. The yellow or brown staining was mainly located at the basal cell membrane and connective tissue of the epithelial cells. Results showed that the expression levels of CX3CL1 and CX3CR1 were significantly lower in OSCC tissues compared to pericancerous tissues. ns p > 0.05; *p < 0.05; **p < 0.01; ***p < 0.001; ****p < 0.0001. Pericancer, pericancerous tissues; Tumor, OSCC tissue.
Through immunohistochemistry, we verified the downregulation of CX3CL1 and CX3CR1 genes in OSCC tissues compared to pericancerous tissues. The yellow or light brown staining was mainly located on the basal cell membrane and connective tissue of epithelial cells (Figure 1E). Similarly, the immunohistochemical analysis showed that CX3CR1 was primarily located on the cell membrane and connective tissue of epithelial cells, and its expression was decreased in OSCC tissues compared to pericancerous tissues (Figure 1F).
3.1.2 CX3CL1 and CX3CR1 gene expression of mRNA and protein in OSCC cell lines
The mRNA and protein expression of CX3CL1 and CX3CR1 genes in OSCC cell lines were validated by PCR, ELISA, and WB. PCR analysis showed different mRNA expression patterns of CX3CL1 and CX3CR1 genes in various cell lines compared to the normal oral keratinocyte cell line HOK. Except for CAL27 and SCC25, CX3CL1 mRNA was downregulated in OSCC cell lines (Figure 2A), while CX3CR1 mRNA was downregulated in all OSCC cell lines except for SCC25 and FADU (Figure 2B).
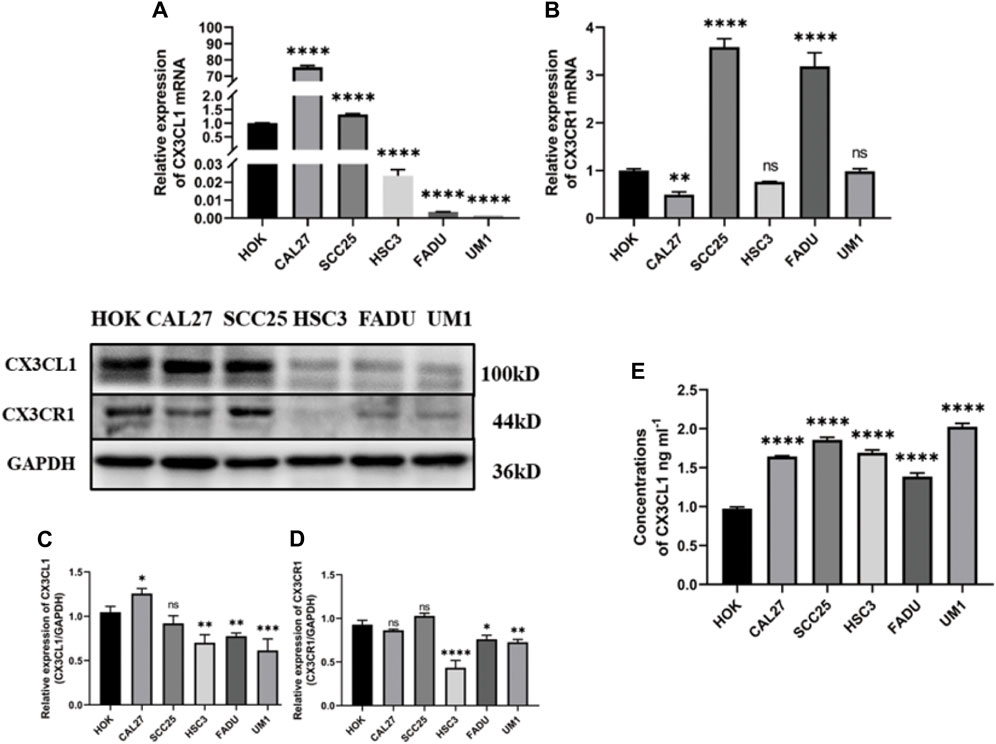
Figure 2. mRNA and protein expression of CX3CL1 and CX3CR1 in OSCC cell lines. Notes: (A) and (B) show the mRNA expression levels of CX3CL1 and CX3CR1 in HOK and various OSCC cell lines using PCR; (C) and (D) show the protein expression levels of membrane-bound CX3CL1 and CX3CR1 in HOK and various OSCC cell lines using WB, along with their corresponding gray value analysis; (E) shows the OD value analysis of soluble CX3CL1 protein expression in HOK and various OSCC cell lines using ELISA. The results indicate that CX3CL1 mRNA and protein expression levels are significantly decreased in most OSCC cell lines compared to HOK, while soluble CX3CL1 that has the function of chemoattracting cells expressing CX3CR1. Expression is increased and CX3CR1 protein content is significantly decrease. Data were shown as mean with SD (n ≥ 3). *p < 0.05, **p < 0.01, ***p < 0.001, ****p < 0.0001, ns p > 0.05. The inconsistent results between PCR and WB may be due to differences in transcription and translation control. The low expression levels of CX3CL1 and CX3CR1 genes in OSCC, as validated by mRNA and protein content analysis in OSCC tissues and cell lines, suggest that they may play a suppressive role in the development and progression of OSCC.
Furthermore, WB analysis revealed decreased protein expression of membrane-bound CX3CL1 and CX3CR1 genes in OSCC cell lines (Figures 2C,D), while ELISA showed an upregulation of soluble CX3CL1 protein expression in OSCC cell lines with significant differences (Figure 2E). The inconsistent results between PCR and WB may be attributed to the control of transcription and translation processes. As proteins are the ultimate executors of functions, the validated mRNA and protein expression levels of CX3CL1 and CX3CR1 genes in OSCC tissue and cell lines suggest their suppressive role in OSCC development and progression.
3.2 Impact of lipopolysaccharide (LPS) on the expression of CX3CL1 and CX3CR1 genes in OSCC cell lines
The present study investigated the effect of LPS on the mRNA and protein expression of CX3CL1 and CX3CR1 genes in OSCC cell lines CAL27 and UM1. The cells were treated with 1 μg/mL and 10 μg/mL LPS for 6 h, 12 h, 24 h, 36 h, and 48 h, and the mRNA and protein expression changes of CX3CL1 and CX3CR1 genes were analyzed using PCR, ELISA, and western blotting.
PCR analysis showed that compared with the control group treated with the same volume of sterile PBS, the mRNA expression of CX3CL1 was significantly increased in both CAL27 and UM1 cells stimulated with 1 μg/mL and 10 μg/mL LPS (Figures 3A,C), while CX3CR1 expression remained largely unchanged (Figures 3B,D).
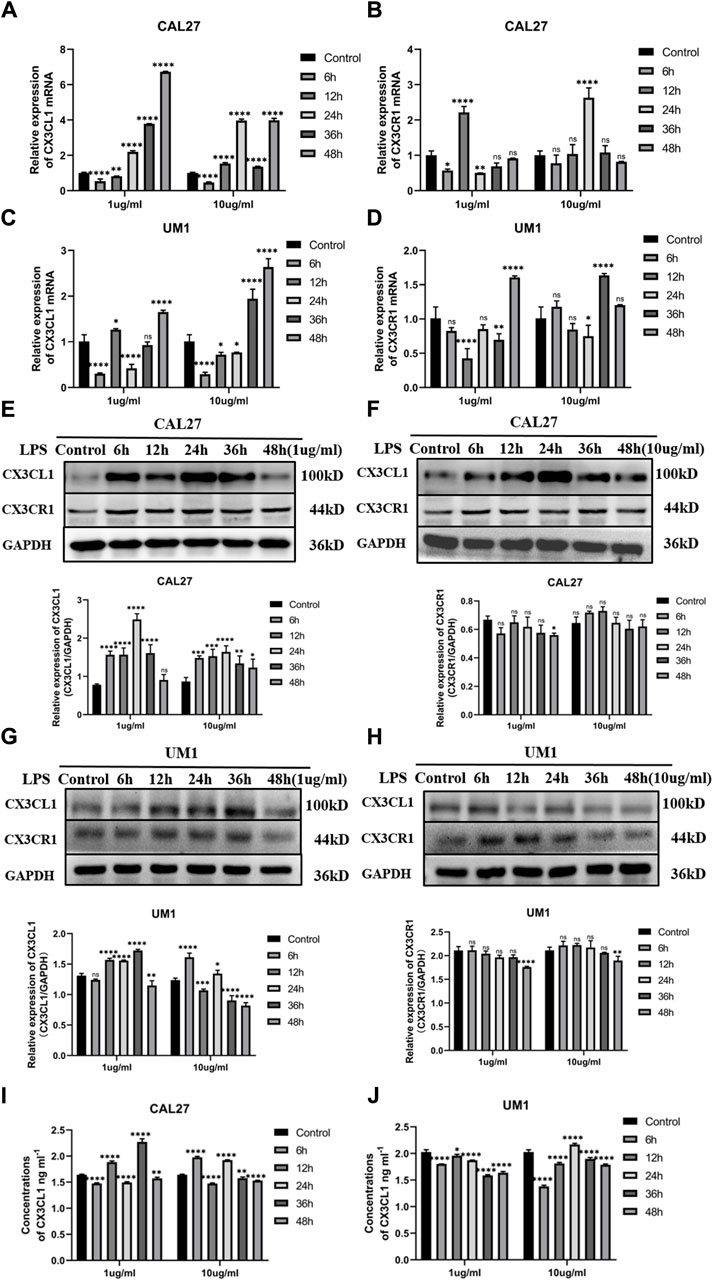
Figure 3. Changes in mRNA and protein expression of CX3CL1 and CX3CR1 in CAL27 and UM1 cells before and after LPS stimulation and shows the changes in soluble CX3CL1 protein concentration in CAL-27 and UM1 cell lines stimulated with 1 μg/mL and 10 μg/mL LPS compared to the control group. Notes: (A) and (B) show changes in mRNA expression levels of CX3CL1 and CX3CR1, respectively, in CAL27 cells after stimulation with 1 μg/mL and 10 μg/mL LPS compared to the control group treated with an equal volume of sterile PBS. (C) and (D) show changes in mRNA expression levels of CX3CL1 and CX3CR1, respectively, in UM1 cells after stimulation with 1 μg/mL and 10 μg/mL LPS compared to the control group treated with an equal volume of sterile PBS. (E) and (F) show the protein band images and grayscale analysis of CX3CL1 in CAL27 cells after stimulation with 1 μg/mL and 10 μg/mL LPS compared to the control group treated with an equal volume of sterile PBS. (G) and (H) show the protein band images and grayscale analysis of CX3CL1 in CAL27 cells after stimulation with 1 μg/mL and 10 μg/mL LPS compared to the control group treated with an equal volume of sterile PBS. (I) and (J) ELISA shows changes in soluble CX3CL1 protein concentration in CAL27 and UM1 cell lines after stimulation with 1 μg/m L and 10 μg/mL LPS compared to the control group treated with an equal volume of sterile PBS. Data were shown as mean with SD (n ≥ 3). ns p > 0.05, *p < 0.05, **p < 0.01, ***p < 0.001, ****p < 0.0001.
Western blotting analysis showed that compared with the control group treated with the same volume of sterile PBS, the protein expression levels of CX3CL1 were significantly increased in both CAL27 and UM1 cells stimulated with 1 μg/mL and 10 μg/mL LPS (Figures 3E,G), while CX3CR1 expression remained largely unchanged (Figures 3F,H). Notably, the protein expression of CX3CL1 in CAL27 cells stimulated with 1 μg/mL LPS reached its peak at 24 h, while in UM1 cells stimulated with 1 μg/mL LPS, it reached its peak at 36 h, compared with the control group treated with the same volume of sterile PBS.
The results show that after 1 μg/mL and 10 μg/mL LPS stimulation, the mRNA and protein expression of CX3CL1 in CAL27 cells significantly increased compared to the control group, with the peak protein expression at 24 h after 1 μg/mL LPS stimulation, while the protein content of CX3CR1 did not change significantly.
ELISA analysis showed that soluble CX3CL1 was increased in CAL27 cells and decreased in UM1 cells after LPS stimulation compared with the control group treated with the same volume of sterile PBS (Figures 3I,J).
The results show that after stimulation with 1 μg/mL and 10 μg/mL LPS, the mRNA and protein levels of CX3CL1 in UM1 cells were significantly increased compared to the control group, especially at 36 h after 1 μg/mL LPS stimulation, where the protein expression reached its peak, and the differential expression is statistically significant. However, the protein level of CX3CR1 did not show significant changes.
3.3 Effect of LPS stimulation and overexpression of CX3CL1 protein on the biological characteristics of OSCC cell lines
Construction of lentiviral overexpression vectors for CX3CL1 gene was performed using CAL27 and UM1 cell lines. Lentiviral transduction and puromycin selection were used to obtain a transduction efficiency of 80%, as confirmed by fluorescence microscopy. Successful overexpression of CX3CL1 gene in CAL27 and UM1 cell lines was confirmed by PCR, ELISA and WB. CAL27, UM1 overexpression CX3CL1 gene were set up in the wild, null, and experimental groups, respectively, abbreviated CAL27−WT, CAL27−GFP, CAL27−CX3CL1 UM1−WT, UM1−GFP, UM1−CX3CL1. Then LPS was used to stimulate and perform cell proliferation experiment (CCK-8), flow cytometry analysis, Transwell invasion experiment, scratch experiment and colony formation experiment. These experiments were used to determine the effects of CX3CL1 overexpression on OSCC cell proliferation, cell cycle, invasion, migration, and colony formation ability, as well as the potential reversal effect of LPS stimulation.
3.3.1 Establishment of CX3CL1 overexpressing cell lines
After slow virus transduction and puromycin screening, CAL27 and UM1 cell lines exhibited green fluorescent protein (GFP) expression efficiency of 80% as determined by fluorescence microscopy, indicating a transduction efficiency of 80% (Figure 4A). Subsequently, we verified the expression of CX3CL1 mRNA and protein using PCR, ELISA, and WB. The control and empty vector groups of CAL27 and UM1 showed no significant changes in CX3CL1 mRNA and protein expression. In contrast, CX3CL1 mRNA and protein expression was significantly increased in the CAL27−CX3CL1 and UM1−CX3CL1 experimental groups, and the expression of its receptor, CX3CR1, showed no significant change, with statistically significant differences (Figures 4B–I). These results indicate that the construction of CAL27 and UM1 cell lines overexpressing CX3CL1 was successful and can be used for subsequent experiments.
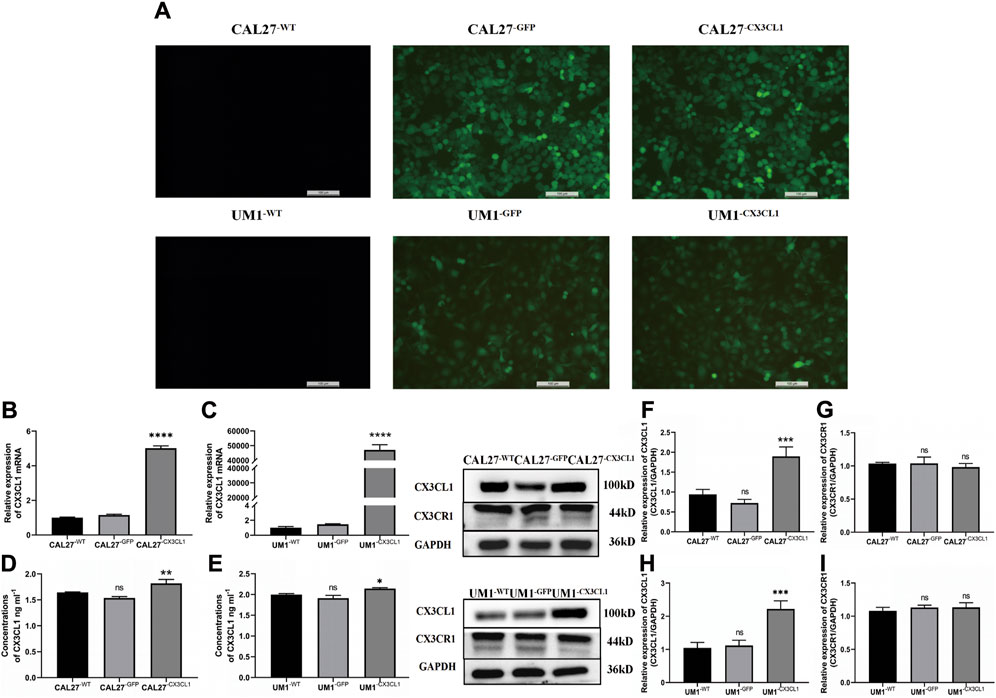
Figure 4. GFP expression in CAL27 and UM1 cell lines detected by fluorescence microscopy and mRNA and protein expression levels of CX3CL1 and CX3CR1 in CAL27 and UM1 cell lines in each group. Note: (A) show that CAL27−WT and UM1−WT showed negative GFP expression, while CAL27−GFP, CAL27−CX3CL1, UM1−WT, and UM1−GFP showed positive GFP expression, with an efficiency of over 80%. (B) and (C) show the mRNA expression levels of CX3CL1 in CAL27 and UM1 cells in the experimental group compared with the control and empty vector groups. (D) and (E) show the changes in soluble CX3CL1 protein concentration in CAL27 and UM1 cells after overexpression of CX3CL1. (F–I) show the protein band and gray value analysis of CX3CL1 and CX3CR1 in CAL27 and UM1 cells after overexpression of CX3CL1 compared with the control and empty vector groups. Results showed that the CX3CL1 mRNA and protein levels were significantly increased in the experimental group compared with the control and empty vector groups, while CX3CR1 protein content remained unchanged. Data were shown as mean with SD (n ≥ 3).ns, p > 0.05; *, p < 0.05; **, p < 0.01; ***, p < 0.001; ****, <0.0001.
3.3.2 The effect of LPS stimulation and overexpression of CX3CL1 gene on the biological characteristics of OSCC cell lines
In this study, various groups of CAL27 and UM1 cell lines previously constructed were used to conduct cell proliferation experiments (CCK-8 assay), flow cytometry cell cycle experiments, Transwell invasion experiments, cell scratch experiments, and cell cloning. LPS was used at a concentration and time point corresponding to the peak relative expression of CX3CL1 protein. Each group of CAL27 cells was stimulated with 1 μg/mL LPS for 24 h, while each group of UM1 cells was stimulated with 1 μg/mL LPS for 36 h before being collected for experiments.
(1) The CCK-8 assay showed that overexpression of CX3CL1 can inhibit cell proliferation, leading to cell division arrest in the S phase. LPS stimulation promotes OSCC proliferation and overexpression of CX3CL1 before and after stimulation still promotes cell proliferation without affecting the cell cycle. However, overexpression of CX3CL1 can partially reverse the promoting effect of LPS on tumor proliferation (Figure 5).
(2) The over expression of CX3CL1 was verified to inhibit cell invasion and migration using Transwell and scratch assays, while the addition of LPS stimulation can promote the migration and invasion of OSCC cells. (Figures 6A–H).
(3) The cloning experiment verified that the expression of CX3CL1 can inhibit cell cloning ability, and LPS stimulation has no significant effect on the cloning ability of OSCC (Figures 6I–L).
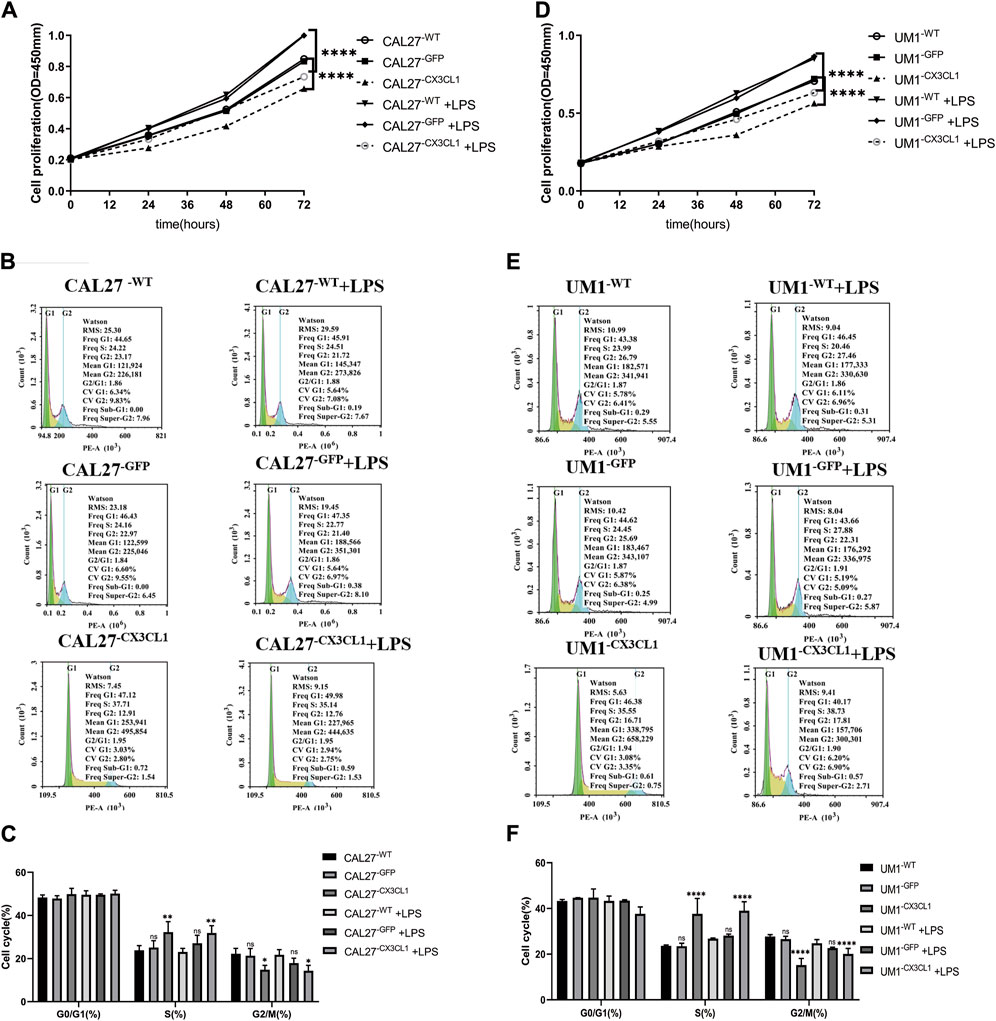
Figure 5. Cell proliferation and cell cycle effects of LPS stimulation and overexpression of CX3CL1 gene in CAL27 and UM1 cell lines. Note: (A) and (D) show the changes in OD values of cell proliferation assay in CAL27 and UM1 control group, empty vector group, and experimental group stimulated with 1 μg/mL LPS compared to the addition of the same volume of sterile PBS. (B) and (E) show the proportion of cell cycle phases during proliferation determined by flow cytometry analysis of CAL27 and UM1 cell lines stimulated with 1 μg/mL LPS. (C) and (F) show the statistical analysis based on the proportion of cell cycle phases during proliferation of CAL27 and UM1 cell lines in different groups. Results indicate that the experimental group of CAL27 and UM1 cell lines exhibited reduced OD values and cell cycle arrest at S phase compared to the control and empty vector groups, while stimulation with 1 μg/mL LPS increased cell proliferation in CAL27 and UM1 cell lines, but had no significant effect on the cell cycle. Data were shown as mean with SD (n ≥ 3).ns p > 0.05, *p < 0.05, **p < 0.01, ***p < 0.001, ****p < 0.0001.
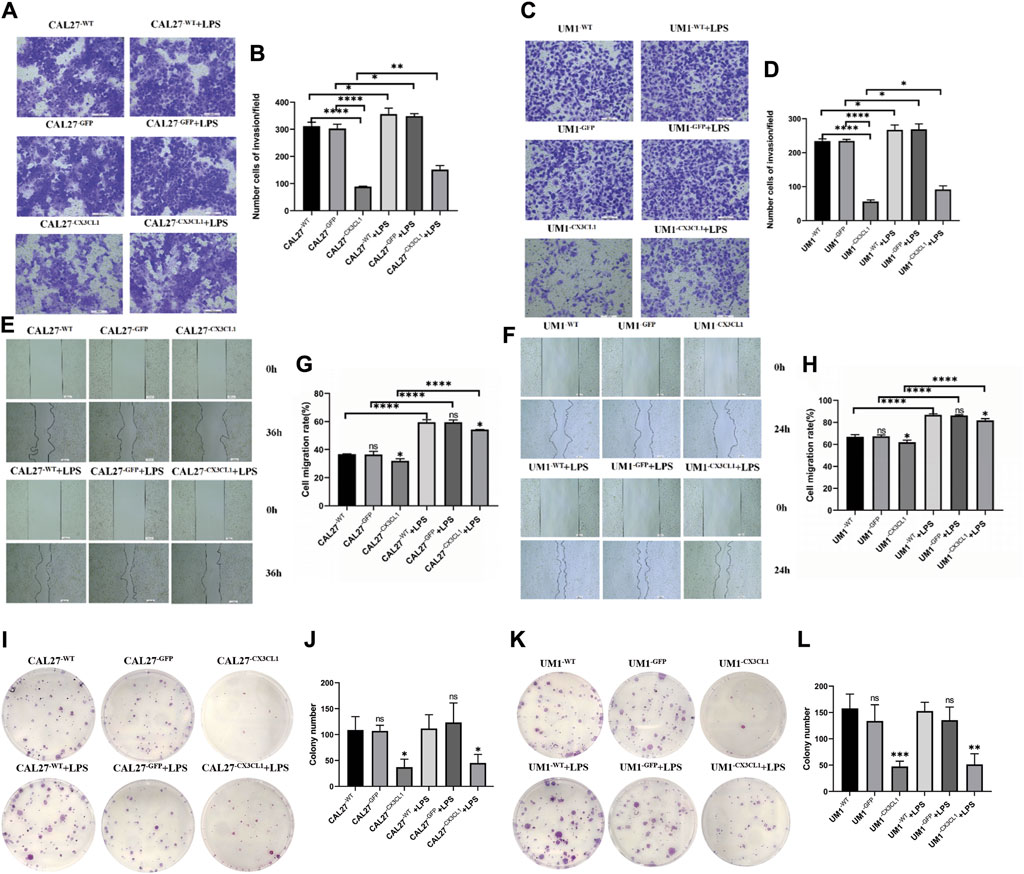
Figure 6. The changes in invasion and migration of CAL27 and UM1 cell lines before and after LPS stimulation and the effect of LPS stimulation on the cloning ability of CAL27 and UM1 cell lines. Note: (A) and (C) depict the cell invasion of the control group, empty vector group, and experimental group of CAL27 and UM1 cell lines stimulated with 1 μg/mL LPS compared to the same volume of sterile PBS. (B) and (D) show the statistical analysis of the number of cells passing through the upper chamber of each group of CAL27 and UM1 cell lines. (E) and (G) depict the cell migration of the control group, empty vector group, and experimental group of CAL27 and UM1 cell lines stimulated with 1 μg/mL LPS compared to the same volume of sterile PBS. (F) and (H) show the statistical analysis of the change in scratch area of each group of CAL27 and UM1 cell lines. (I) and (K) show the cloning of the control group, empty vector group, and experimental group of CAL27 and UM1 cell lines stimulated with 1 μg/mL LPS compared to the same volume of sterile PBS. (J) and (L) show the statistical analysis of the number of clone cell clusters formed by each group of CAL27 and UM1 cell lines. The results show that the number of invaded cells and the change in scratch area of the experimental group of CAL27 and UM1 cell lines decreased compared to the control group and empty vector group. Moreover, the number of invaded cells and the change in scratch area of CAL27 and UM1 cell lines after LPS stimulation increased compared to the same volume of sterile PBS. The results show that the number of clone cell clusters of the experimental group of CAL27 and UM1 cell lines increased compared to the control group and empty vector group. Moreover, there was no significant difference in the number of clone cell clusters of CAL27 and UM1 cell lines after LPS stimulation compared to the same volume of sterile PBS. Data were shown as mean with SD (n ≥ 3).ns p > 0.05, *p < 0.05, **p < 0.01, ***p < 0.001, ****p < 0.0001.
3.4 The effects of LPS stimulation and overexpression of CX3CL1 protein on AKT activation and expression of epithelial-mesenchymal transition (EMT)-related proteins
Based on the results of previous experiments, both LPS stimulation and overexpression of CX3CL1 gene had significant effects on the invasion and migration of OSCC cell lines. To explore the underlying mechanisms of these effects, Western blotting was performed to detect the levels of AKT, p-AKT, the epithelial cell marker E-cadherin, the mesenchymal cell markers N-cadherin and Vimentin, and the EMT-related transcription factor Snail protein in various groups of CAL27 and UM1 cells before and after LPS stimulation.
The results showed that overexpression of CX3CL1 gene inhibited AKT activation and EMT-related protein expression, thereby suppressing the biological characteristics of OSCC (Figures 7A, B). On the other hand, LPS stimulation promoted AKT activation and EMT-related protein expression in OSCC cell lines (Figures 7C, D).
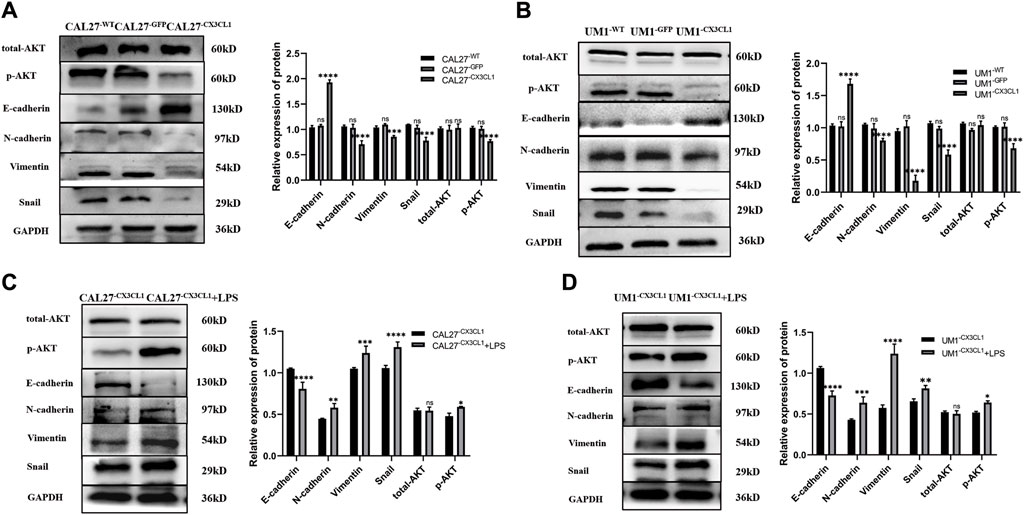
Figure 7. Expression levels of EMT-related and AKT proteins in CAL27 and UM1 cell lines from each group and expression levels of EMT-related proteins and AKT before and after LPS stimulation in CX3CL1-overexpressing OSCC cell lines. Note: (A) and (B) show the protein band display and relative grayscale value analysis of E-cadherin, N-cadherin, Vimentin, Snail, AKT, and p-AKT in CAL27 and UM1 cell lines from each group. Panels (C) and (D) show the protein band images and relative gray values of E-cadherin, N-cadherin, Vimentin, Snail, AKT, and p-AKT in CAL27 and UM1 experimental groups stimulated with 1 μg/mL LPS compared to those with the same volume of sterile PBS. The results show that the expression of epithelial-related protein E-cadherin increased, while the expression of mesenchymal-related proteins N-cadherin, Vimentin, and Snail decreased. Total AKT did not change significantly, while phosphorylated p-AKT expression decreased significantly, and the expression differences were statistically significant. The results also indicate that E-cadherin expression decreased, while N-cadherin, Vimentin, and Snail expression increased in the stimulated groups. Total AKT expression did not change significantly, while phosphorylated p-AKT expression increased significantly. The expression differences were statistically significant.Data were shown as mean with SD (n ≥ 3). ns p > 0.05, *p < 0.05, **p < 0.01, ***p < 0.001,****p < 0.0001.
4 Discussion
Oral squamous cell carcinoma (OSCC) is one of the most common malignant tumors in the head and neck region (Conroy and Lysaght, 2020; Rivas-Fuentes et al., 2021). Due to its high incidence and strong tendency to recur, the 5-year survival rate of OSCC patients is only below 50% (Bugshan and Farooq, 2020; Ling et al., 2021). Surgery is the main treatment with chemotherapy and radiation therapy as adjuvant therapies, which seriously harm the physical and mental health of OSCC patients and greatly reduce their quality of life. Therefore, early detection, diagnosis, and treatment are crucial to reduce the incidence and mortality of OSCC. Thus, the search for new targets for OSCC has important significance (Ohta et al., 2005).
Yang et al. (Cheng-Ning et al., 2015) found that microRNA-29b promotes OSCC migration by downregulating CX3CL1 expression, and that CX3CL1 expression levels are negatively correlated with lymph node metastasis and early tumor stage in OSCC patients, suggesting that CX3CL1 has anti-cancer effects in OSCC. However, more recently, Son et al., 2021 found that TGF-β reduces soluble CX3CL1, which in turn affects OSCC bone invasion and improves patient survival, indirectly suggesting that CX3CL1 also has pro-cancer effects in OSCC. Therefore, in order to investigate the role of CX3CL1 in OSCC and the effect of lipopolysaccharide (LPS)-induced inflammation on CX3CL1, we conducted this study.
This study revealed that CX3CL1 has an anti-cancer effect in OSCC and that the pro-cancer effect of LPS on CX3CL1 overexpression has a partial reversal effect. Firstly, bioinformatics analysis, immunohistochemistry, PCR, ELISA, and WB were used to confirm that CX3CL1 and its receptor CX3CR1 are lowly expressed in OSCC, while soluble CX3CL1 is highly expressed, indicating that CX3CL1 and CX3CR1 may play an important role in the occurrence and development of OSCC. CX3CL1 exists in two forms in the human body, membrane-bound and soluble. Membrane-bound CX3CL1 is located on the cell membrane and mainly acts as an adhesion molecule to enhance cell adhesion, while soluble CX3CL1 is mainly released into the stroma, and attracts CX3CR1-expressing cytotoxic T cells, monocytes, and NK cells to migrate towards the tumor, achieving an anti-tumor effect. Chemokines belong to a category of factors related to inflammation, and inflammation stimulated by LPS has a significant impact on cancer progression, the mechanism of which is not yet clear (Do et al., 2020). Therefore, this study continues to explore the relationship between LPS, CX3CL1, and OSCC.
However, compared with the control group treated with equal volume of sterile PBS, LPS stimulation resulted in an increase in CX3CL1 mRNA and protein expression in CAL27 and UM1 cell lines, with no significant change in CX3CR1 expression. It has been extensively reported that LPS stimulation significantly enhances the biological characteristics of cancer growth and metastasis, including in OSCC, and is considered a promoting factor for cancer. The relationship between inflammation and cancer development is complex and closely related, with inflammation having both anti-cancer and pro-cancer effects on cancer development, depending on the duration of the inflammation. Therefore, our study found that the anti-cancer effect of CX3CL1 on OSCC does not conflict with the increased production of CX3CL1 in LPS-stimulated OSCC.
Next, successful construction of slow virus-mediated overexpression of CX3CL1 gene in CAL27 and UM1 cell lines was achieved. Biological characteristics were then assessed through some experiments. Results demonstrated that overexpression of CX3CL1 inhibited the proliferation of OSCC cells, especially in the S phase, and suppressed invasion, migration, and stemness. Moreover, overexpression of CX3CL1 partially reversed the pro-cancer effect of LPS on OSCC.
Finally, in this study, we explored the mechanism by which overexpression of CX3CL1 promotes OSCC invasion and migration. We found that the activation of AKT and Epithelial-mesenchymal Transition (EMT) were partially inhibited by overexpression of CX3CL1, and that the addition of LPS stimulation led to the promotion of EMT and AKT activation in OSCC cell lines. Studies have shown that AKT activation is closely related to elevated EMT in many cancers, such as colorectal cancer (Ma et al., 2020), cervical cancer (Xu et al., 2021), and bladder cancer (Chi et al., 2022). Our results demonstrate that the increase in CX3CL1 expression can reduce AKT activation, indicating that CX3CL1 may regulate EMT by activating AKT to reduce its expression.
Based on the above experimental results, CX3CL1 exhibits an anti-tumor effect in OSCC. Although the expression of CX3CL1 mRNA and protein in OSCC is upregulated under the pro-carcinogen LPS stimulus, overexpression of CX3CL1 can inhibit the biological characteristics and EMT progression of OSCC, and partially reverse the pro-carcinogenic effect of LPS on OSCC (Figure 8).
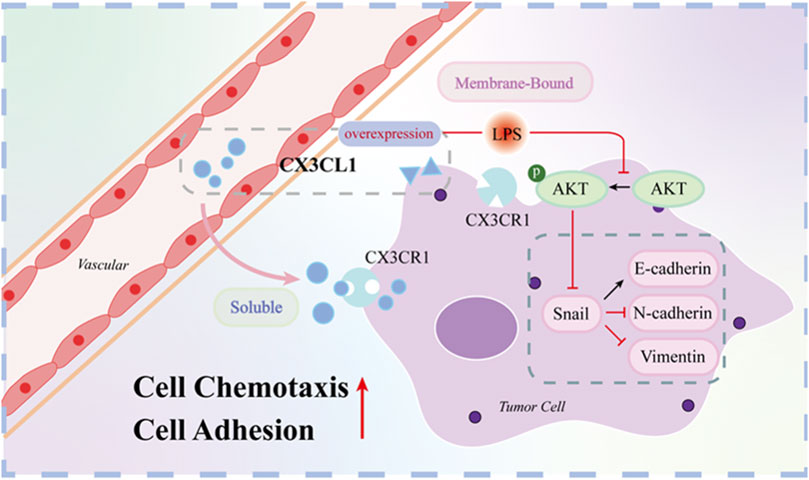
Figure 8. Mechanistic map of CX3CL1 inhibition of AKT activation and EMT-related protein expression. Note: Figure 8 shows that CX3CL1 is available in membrane-bound and soluble forms. Overexpression of CX3CL1 inhibits AKT activation and EMT-related protein expression. Membrane-bound CX3CL1 is located on the cell membrane and mainly acts as an adhesion molecule to enhance cell adhesion, while soluble CX3CL1 is mainly released into the stroma, and attracts CX3CR1-expressing cytotoxic T cells, monocytes, and NK cells to migrate towards the tumor, achieving an anti-tumor effect. After LPS stimulation, p-AKT and EMT related proteins were changed correspondingly.
Therefore, the CX3CL1 gene is expected to become a new therapeutic target for OSCC. As the specific mechanism by which the CX3CL1 gene affects OSCC is not yet clear, future studies will continue to explore this gene in more detail. Soluble CX3CL1 will be studied in the future.
In this study, we investigated the role and mechanism of CX3CL1 in OSCC. We successfully constructed CAL27 and UM1 cell lines overexpressing CX3CL1 using lentivirus transduction and performed biological characterization, cell cycle analysis, Transwell migration assay, and scratch assay. We found that CX3CL1 inhibited proliferation, particularly in the S phase, invasion and migration, and stemness of OSCC cells. Furthermore, we discovered that CX3CL1 affected the biological characteristics of OSCC by influencing the EMT process and AKT activation, and partially reversed the pro-cancer effect of LPS-induced inflammation on OSCC.
Based on these findings, we believe that CX3CL1 and CX3CR1 genes play an important role in the progression of OSCC. Therefore, CX3CL1 may become a promising new target for the treatment of OSCC. Future research can explore the regulatory mechanism of CX3CL1 and CX3CR1 genes, as well as their potential roles in OSCC treatment. Moreover, CX3CL1 can be considered as a potential drug target for treating OSCC, and related drugs can be further developed and clinically applied.
Data availability statement
The datasets presented in this article are not readily available because Not applicable. Requests to access the datasets should be directed to Not applicable.
Ethics statement
The studies involving humans were approved by the Medical Ethics Committee of Affiliated Hospital of North Sichuan Medical College. The studies were conducted in accordance with the local legislation and institutional requirements. The participants provided their written informed consent to participate in this study. Ethical approval was not required for the studies on animals in accordance with the local legislation and institutional requirements because only commercially available established cell lines were used.
Author contributions
CH: Writing–original draft. YW: Writing–original draft. XN: Writing–review and editing. YuL: Writing–review and editing. HW: Writing–review and editing. ML: Writing–review and editing. CL: Writing–review and editing. JL: Writing–review and editing. XM: Writing–review and editing. YiL: Writing–review and editing.
Funding
The author(s) declare that financial support was received for the research, authorship, and/or publication of this article. Key Cultivation Program of North Sichuan Medical College (CBY23-ZDA10 to YL), Nanchong Municipal University Cooperation Program (22SXQT0356 to YL).
Acknowledgments
We would like to express our gratitude to the Institute of Hepatobiliary, Pancreatic and Intestinal Diseases of North Sichuan Medical College for generously providing the experimental platform. Additionally, we extend our thanks to the Affiliated Hospital of North Sichuan Medical College for their contribution of clinical samples. Furthermore, we would like to acknowledge and appreciate the valuable efforts made by our colleagues in the development of this article.
Conflict of interest
The authors declare that the research was conducted in the absence of any commercial or financial relationships that could be construed as a potential conflict of interest.
Publisher’s note
All claims expressed in this article are solely those of the authors and do not necessarily represent those of their affiliated organizations, or those of the publisher, the editors and the reviewers. Any product that may be evaluated in this article, or claim that may be made by its manufacturer, is not guaranteed or endorsed by the publisher.
References
Bhatia, A., and Burtness, B. (2023). Treating head and neck cancer in the age of immunotherapy: a 2023 update. Drugs 83 (3), 217–248. doi:10.1007/s40265-023-01835-2
Bray, F., Ferlay, J., Soerjomataram, I., Siegel, R. L., Torre, L. A., and Jemal, A. (2018). Global cancer statistics 2018: GLOBOCAN estimates of incidence and mortality worldwide for 36 cancers in 185 countries. CA a cancer J. Clin. 68 (6), 394–424. doi:10.3322/caac.21492
Brennan, M., DeBruin, D., Nwokolo, C., Hunt, K. S., Piening, A., Donlin, M. J., et al. (2024). T-cell expression of CXCL13 is associated with immunotherapy response in a sex-dependent manner in patients with lung cancer. Cancer Immunol. Res. doi:10.1158/2326-6066.CIR-23-0826
Bugshan, A., and Farooq, I. (2020). Oral squamous cell carcinoma: metastasis, potentially associated malignant disorders, etiology and recent advancements in diagnosis. F1000Research 9, 229. doi:10.12688/f1000research.22941.1
Cheng-Ning, Y., Deng, Y. T., Tang, J. Y., Cheng, S. J., Chen, S. T., Li, Y. J., et al. (2015). MicroRNA-29b regulates migration in oral squamous cell carcinoma and its clinical significance. J. Oral Oncol. 51 (2), 170–177. doi:10.1016/j.oraloncology.2014.10.017
Chi, M., Liu, J., Mei, C., Shi, Y., Liu, N., Jiang, X., et al. (2022). TEAD4 functions as a prognostic biomarker and triggers EMT via PI3K/AKT pathway in bladder cancer. J. Exp. Clin. cancer Res. CR 41 (1), 175. doi:10.1186/s13046-022-02377-3
Conroy, M. J., and Lysaght, J. (2020). CX3CL1 signaling in the tumor microenvironment. Adv. Exp. Med. Biol. 1231, 1–12. doi:10.1007/978-3-030-36667-4_1
Do, H. T. T., Lee, C. H., and Cho, J. (2020). Chemokines and their receptors: multifaceted roles in cancer progression and potential value as cancer prognostic markers. Cancers 12 (2), 287. doi:10.3390/cancers12020287
Dreyer, T. F., Kuhn, S., Stange, C., Heithorst, N., Schilling, D., Jelsma, J., et al. (2021). The chemokine CX3CL1 improves trastuzumab efficacy in HER2 low-expressing cancer in vitro and in vivo. Cancer Immunol. Res. 9 (7), 779–789. doi:10.1158/2326-6066.CIR-20-0327
Garrido, F., Wild, C. M., Mittelberger, J., Dobler, F., Schneider, M., Ansorge, N., et al. (2021). The role of chemokines in cervical cancers. Med. Kaunas. Lith. 57 (11), 1141. doi:10.3390/medicina57111141
He, C., Zhang, Q., Zhang, W., Xiao, Q., and Liu, Y. (2023). Lipopolysaccharide(LPS) stimulates NLRP3/Caspase-1 inflammatory signaling pathway and promotes proliferation and migration of oral squamous cell carcinoma cells. J. Mod. Oncol. 31 (09), 1577–1583.
He, Z., Deng, R., Huang, X., Ni, Y., Yang, X., Wang, Z., et al. (2015). Lipopolysaccharide enhances OSCC migration by promoting epithelial-mesenchymal transition. J. oral pathology Med. 44 (9), 685–692. doi:10.1111/jop.12285
Huang, X., Zeng, Y., Jiang, Y., Qin, Y., Luo, W., Xiang, S., et al. (2017). Lipopolysaccharide-binding protein downregulates fractalkine through activation of p38 MAPK and NF-κB. Mediat. Inflamm. 2017, 9734837. doi:10.1155/2017/9734837
Hughes, C. E., and Nibbs, R. J. B. (2018). A guide to chemokines and their receptors. FEBS J. 285 (16), 2944–2971. doi:10.1111/febs.14466
Kadomoto, S., Izumi, K., and Mizokami, A. (2020). The CCL20-CCR6 Axis in cancer progression. Int. J. Mol. Sci. 21 (15), 5186. doi:10.3390/ijms21155186
Kakabadze, M. Z., Paresishvili, T., Karalashvili, L., Chakhunashvili, D., and Kakabadze, Z. (2020). Oral microbiota and oral cancer: review. Oncol. Rev. 14 (2), 476. doi:10.4081/oncol.2020.476
Kavarthapu, A., and Gurumoorthy, K. (2021). Linking chronic periodontitis and oral cancer: a review. Oral Oncol. 121, 105375. doi:10.1016/j.oraloncology.2021.105375
Khare, T., Bissonnette, M., and Khare, S. (2021). CXCL12-CXCR4/CXCR7 Axis in colorectal cancer: therapeutic target in preclinical and clinical studies. Int. J. Mol. Sci. 22 (14), 7371. doi:10.3390/ijms22147371
Kong, Q., Liang, Y., He, Q., You, Y., Wu, L., Liang, L., et al. (2020). Autophagy inhibits TLR4-mediated invasiveness of oral cancer cells via the NF-κB pathway. Oral Dis. 26, 1165–1174. doi:10.1111/odi.13355
Li, Y., Tan, X., Zhao, X., Xu, Z., Dai, W., Duan, W., et al. (2020). Composition and function of oral microbiota between gingival squamous cell carcinoma and periodontitis. Oral Oncol. 107, 104710. doi:10.1016/j.oraloncology.2020.104710
Ling, Z., Cheng, B., and Tao, X. (2021). Epithelial-to-mesenchymal transition in oral squamous cell carcinoma: challenges and opportunities. Int. J. cancer 148 (7), 1548–1561. doi:10.1002/ijc.33352
Ma, Z., Lou, S., and Jiang, Z. (2020). PHLDA2 regulates EMT and autophagy in colorectal cancer via the PI3K/AKT signaling pathway. Aging 12 (9), 7985–8000. doi:10.18632/aging.103117
Madhura, M. G., Rao, R. S., Patil, S., Fageeh, H. N., Alhazmi, A., and Awan, K. H. (2020). Advanced diagnostic aids for oral cancer. Disease-a-month DM 66 (12), 101034. doi:10.1016/j.disamonth.2020.101034
Ohta, M., Tanaka, F., Yamaguchi, H., Sadanaga, N., Inoue, H., and Mori, M. (2005). The high expression of Fractalkine results in a better prognosis for colorectal cancer patients. Int. J. Oncol. 26 (1), 41–47. doi:10.3892/ijo.26.1.41
Oliveira, S. D. S., Castellon, M., Chen, J., Bonini, M. G., Gu, X., Elliott, M. H., et al. (2017). Inflammation-induced caveolin-1 and BMPRII depletion promotes endothelial dysfunction and TGF-β-driven pulmonary vascular remodeling. Am. J. physiology Lung Cell. Mol. physiology 312 (5), L760–L771. doi:10.1152/ajplung.00484.2016
Omori, Y., Noguchi, K., Kitamura, M., Makihara, Y., Omae, T., Hanawa, S., et al. (2024). Bacterial lipopolysaccharide induces PD-L1 expression and an invasive phenotype of oral squamous cell carcinoma cells. Cancers 16, 343. doi:10.3390/cancers16020343
Rivas-Fuentes, S., Salgado-Aguayo, A., Arratia-Quijada, J., and Gorocica-Rosete, P. (2021). Regulation and biological functions of the CX3CL1-CX3CR1 axis and its relevance in solid cancer: a mini-review. J. Cancer 12 (2), 571–583. doi:10.7150/jca.47022
Son, S. H., Park, J., Jung, M. J., Lee, S. K., Kim, H., Kim, K. R., et al. (2021). Transforming growth factor-β-regulated fractalkine as a marker of erosive bone invasion in oral squamous cell carcinoma. Eur. J. oral Sci. 129 (1), e12750. doi:10.1111/eos.12750
Xu, Y., Pan, S., Chen, H., Qian, H., Wang, Z., and Zhu, X. (2021). MEX3A suppresses proliferation and EMT via inhibiting Akt signaling pathway in cervical cancer. Am. J. cancer Res. 11 (4), 1446–1462.
Ye, Q. Y., Li, Z. H., Wang, Y. Z., Liu, S. Y., Zhou, J., Liu, S. Y., et al. (2021). Mesenchymal stem cells derived apoptotic extracellular vesicles attenuate pro-inflammatory macrophages induced by Porphyromonas gingivalis lipopolysaccharide. Zhonghua kou qiang yi xue za zhi 56 (8), 791–798. doi:10.3760/cma.j.cn112144-20201027-00541
Keywords: oral squamous cell carcinoma(OSCC), CX3CL1, CX3CR1, lipopolysaccharide(LPS), epithelial-mesenchymal transition (EMT)
Citation: He C, Wu Y, Nan X, Zhang W, Luo Y, Wang H, Li M, Liu C, Liu J, Mou X and Liu Y (2024) Induction of CX3CL1 expression by LPS and its impact on invasion and migration in oral squamous cell carcinoma. Front. Cell Dev. Biol. 12:1371323. doi: 10.3389/fcell.2024.1371323
Received: 22 February 2024; Accepted: 15 May 2024;
Published: 10 June 2024.
Edited by:
Ari Hashimoto, Hokkaido University, JapanReviewed by:
Concetta Saponaro, National Cancer Institute Foundation (IRCCS), ItalyXu Wang, Peking University Hospital of Stomatology, China
Copyright © 2024 He, Wu, Nan, Zhang, Luo, Wang, Li, Liu, Liu, Mou and Liu. This is an open-access article distributed under the terms of the Creative Commons Attribution License (CC BY). The use, distribution or reproduction in other forums is permitted, provided the original author(s) and the copyright owner(s) are credited and that the original publication in this journal is cited, in accordance with accepted academic practice. No use, distribution or reproduction is permitted which does not comply with these terms.
*Correspondence: Ying Liu, bGl1eWluZzA4X25zbXpAMTYzLmNvbQ==
†These authors have contributed equally to this work