 Seiji Saito
 Utsugi Kanazawa2
 Atsuo Iida
 Tatsuya Takemoto
 Takayuki Suzuki
94% of researchers rate our articles as excellent or good
Learn more about the work of our research integrity team to safeguard the quality of each article we publish.
Find out more
ORIGINAL RESEARCH article
Front. Cell Dev. Biol., 15 March 2024
Sec. Morphogenesis and Patterning
Volume 12 - 2024 | https://doi.org/10.3389/fcell.2024.1302141
This article is part of the Research TopicEditors’ Showcase 2024: Insights in Morphogenesis and PatterningView all 4 articles
During the early development of tetrapods, including humans, the embryonic body elongates caudally once the anterior-posterior axis is established. During this process, region-specific vertebral morphogenesis occurs, with the determination of limb positioning along the anterior-posterior axis. We previously reported that Gdf11 functions as an anatomical integration system that determines the positioning of hindlimbs and sacral vertebrae where Gdf11 is expressed. However, the molecular mechanisms underlying induction of Gdf11 expression remain unclear. In this study, we searched for non-coding regions near the Gdf11 locus that were conserved across species to elucidate the regulatory mechanisms of Gdf11 expression. We identified an enhancer of the Gdf11 gene in intron 1 and named it highly conserved region (HCR). In HCR knockout mice, the expression level of endogenous Gdf11 was decreased, and the position of the sacral-hindlimb unit was shifted posteriorly. We also searched for factors upstream of Gdf11 based on the predicted transcription factor binding sites within the HCR. We found that inhibition of FGF signaling increased endogenous Gdf11 expression, suggesting that FGF signaling negatively regulates Gdf11 expression. However, FGF signaling does not regulate HCR activity. Our results suggest that there are species-specific Gdf11 enhancers other than HCR and that FGF signaling regulates Gdf11 expression independent of HCR.
Tetrapods, including humans, possess vertebrae that extend from the cranial to the caudal position. These bones are categorized as cervical, thoracic, lumbar, sacral, and caudal. The number of vertebrae is characterized by a vertebral formula: for example, C7, T12, L5, S7, and Co4 in humans, and C7, T13, L5, and S4 in mice. Of the free limbs, the forelimb is located at the first thoracolumbar vertebra, and the hindlimb is directly articulated or fused to the sacral vertebrae via the pelvis. Thus, the vertebral formula, together with the positions of the limbs, is diverse in tetrapods.
During early development, the body elongates along the anterior-posterior axis, with cells proliferating on the caudal side. During this process, prospective vertebrae derived from the presomitic mesoderm (PSM) develop as somites. Following this, each somite acquires positional information by receiving various signaling inputs following the region-specific expression of Hox genes, which regulate region-specific vertebral morphogenesis along the anterior-posterior axis (Benazeraf and Pourquie, 2013; Neijts et al., 2014; Kimelman, 2016).
For continuous extension of the PSM posteriorly, axial stem cells located at the posterior end of the embryo must maintain an undifferentiated state to contribute to the PSM cell population. The FGF and WNT signaling pathways maintain the undifferentiated state of axial stem cells (Wilson et al., 2009; Gouti et al., 2014; Henrique et al., 2015). Fgf4 and Fgf8 are FGF signaling ligands expressed in the posterior region of the embryo (Naiche et al., 2011; Boulet and Capecchi, 2012). Mice deficient in both Fgf4 and Fgf8 or their receptor Fgfr1 show not only defects in the posterior region of the body but also homeotic alterations in the vertebrae (Partanen et al., 1998; Boulet and Capecchi, 2012). These results indicate that FGF signaling is essential for posterior elongation of the body and is involved in determining vertebral identity along the anterior-posterior axis. WNT signaling is also essential for the formation of the posterior regions of the embryo and vertebral patterning. Wnt3a, as well as Fgf8, is expressed at the posterior end of the embryo and Wnt3a-deficient mice do not form structures behind their forelimbs, including the second cervical vertebra (Takada et al., 1994; Ikeya and Takada, 2001). Mice with mutated Lrp6, a co-receptor of Wnt3a, and mice with mutations in both Tcf1/Lef1, a transcription factor downstream of WNT signaling, also show phenotypes similar to those of Wnt3a mutant mice (Galceran et al., 1999; Pinson et al., 2000). These results suggest that the FGF and WNT signaling pathways are essential for the formation of the posterior regions of the embryo and normal morphogenesis of the vertebrae Saito and Suzuki, 2020.
We previously reported that expression onset of Gdf11, a secreted factor belonging to the TGF-β superfamily, during the early developmental stage determines the positions of the hindlimbs and sacral vertebrae (Matsubara et al., 2017). Gdf11 expression was first observed in the posterior axial mesoderm (pAM), which is located posterior to the PSM. The GDF11 protein is secreted into the adjacent lateral plate mesoderm (LPM), which gives rise to the hindlimb bud. Gdf11 induces Hox gene expression in both the PSM and LPM and regulates the anatomical integration system, which is responsible for the positioning of the hindlimb at the sacral vertebra, following coordinated formation of the sacral-hindlimb unit. The onset of Gdf11 expression is unique to each species; for example, six pairs of somites form at somite stage (ss)6 in soft-shelled turtles, ss7 in mice, and ss10 in chickens. In Gdf11-knockout mice, the position of the sacral-hindlimb unit is posteriorly shifted by six to eight vertebrae due to the presence of additional thoracic and lumbar vertebrae (McPherron et al., 1999). We reported a positive correlation in tetrapod species between the number of somites formed when Gdf11 expression first occurred and the number of somites from the head to the hindlimb buds. In other words, the more somites present from the head to the hind limb buds, the latter is the onset of Gdf11 expression. Therefore, identification of the molecular mechanism underlying the induction of Gdf11 expression is essential for understanding the precise position of the sacral hindlimb unit along the anterior–posterior axis during development.
Here, we report a Gdf11 enhancer region conserved among tetrapods and show that it is essential for endogenous Gdf11 expression and the determination of the position of the sacral-hindlimb unit. Furthermore, we found that FGF signaling regulated Gdf11 expression.
Animal handling and all experimental procedures were conducted in accordance with the guidelines of the Osaka Metropolitan University Animal Care and Use Committee. Animal experiments were approved by the Animal Experiment Committee of the Graduate School of Sciences, Osaka Metropolitan University. The protocols for embryo research were approved by the Osaka Metropolitan University Animal Experiment Committee (approval number: S0086).
Mouse (Mus musculus) embryos were collected from mice crossed with the enhancer knockout mice and/or Gdf11+/−mice. Chicken (Gallus gallus) fertilized chicken eggs were purchased from Yamagishi (Ogaki, Japan) and Takeuchi Chicken Farms (Nara, Japan). Embryos were staged as described by Hamburger and Hamilton (1951).
Electroporation was performed according to previously published protocols (Sato et al., 2002; Nakaya et al., 2004), with some modifications. After incubating the eggs until HH 8, 5 mL albumin was removed through a hole created at the broader end of the egg. Subsequently, the eggshells were removed using curved scissors. The vitelline membrane was removed using a tungsten needle to expose the surface of the embryo. Then, 100–200 μL black ink/phosphate buffered saline (PBS) solution (1:40 ink in PBS; rOtring, Germany; S0194660) was injected beneath the embryo using a 1 mL syringe. The tk-EGFP vector containing candidate enhancer regions and/or the pCAGGS-mCherry vector was diluted with distilled water to a final concentration of 1 μg/μL and mixed with Brilliant Blue G (diluted in water to a final concentration of 0.1%; Tokyo Chemical Industry, Japan; B1146). pCAGGS-constitutively active (CA) Mek1 or CA-β catenin was diluted with distilled water to a final concentration of 1 μg/μL.
An L-shaped platinum anode (BEX, Japan; LF613P3) was inserted into the hole to inject the black ink/PBS solution. The tip of the platinum anode was fixed slightly behind the Hensen’s node and at a depth of 2 mm from the embryo. The DNA solution was applied over the caudal lateral epiblast (CLE) posterior to the Hensen’s node at ss4 (HH 8) of the chick embryo (Sato et al., 2002) using a glass pipette. A sharpened tungsten needle (The Nilaco Corporation, Japan; W-461267) of the cathode was placed over the CLE within the prospective PSM region. Electric pulses (25 ms pulse-on and 50 ms pulse-off at 7 V, three times) were applied using a GEB14 electroporator (BEX). After electroporation, the cathode was gently withdrawn from the amnion, and 30 μL of a penicillin-streptomycin solution (1:100 penicillin–streptomycin in PBS; Invitrogen, Thermo Fisher Scientific, MA, USA; 15,140-122) was added near the embryo. The eggshell window was firmly sealed with plastic tape. The following regions were amplified by PCR using specific primer pairs and inserted upstream of tk-EGFP: HCR (F-5′- TGTACGTCTCAGCAACTCAGCTGAC -3′, R-5′- CAGGGGCAGGAGGTTGGG -3′), a region (F-5′- GACAGGAGCGGCTTTGAAATTTTATGGCCTGGAAAATCCAGGCC -3′, R-5′- GGCCTGGATTTTCCAGGCCATAAAATTTCAAAGCCGCTCCTGTC -3′), b region (F-5′- GGTTTTATGGCTCTGAACAGAAGGGGGGGCTGGTTTATTGGCAGATGGGTCATAAAAAGC -3′, R-5′- GCTTTTTATGACCCATCTGCCAATAAACCAGCCCCCCCTTCTGTTCAGAGCCATAAAACC -3′), c region (F-5′- CCCGCTTTAATAAGAGACTTGTGCTCTGCTAATCGGGGGAGG -3′, R-5′- CCTCCCCCGATTAGCAGAGCACAAGTCTCTTATTAAAGCGGG -3′), and HCR lacking the b region (F-5′- TGGCAAGCCCCCCCTCCTTTTGGGGGTTGCGGGAAATCCT -3′, R-5′- AGGATTTCCCGCAACCCCCAAAAGGAGGGGGGGCTTGCCA -3′).
Enhancer activity was assessed as previously described (Saito et al., 2019). Embryos were harvested and placed in PBS. Fluorescence was observed using a Leica M205FA fluorescence stereomicroscope (Leica, Germany) with the following bandpass filters: GFP3 (excitation at 450–490 nm, emission at 500–550 nm) and TXR (excitation at 540–580 nm, emission at 610 LP). Images were captured using a Leica DFC450C camera in RGB color mode (1,280 × 960 pixels, 2 × 2 Color Binning). For the quantification of fluorescence intensity, images were processed using ImageJ software (NIH, https://imagej.nih.gov/ij/index.html). The electroporated area was selected manually and cropped from the image captured using the GFP3 filter. The same areas were cropped from images captured using TXR filters. Subsequently, the images were split into red, green, and blue channels. Green and red channel images were used to quantify fluorescence intensity using GFP3 or TXR filters. Based on the fluorescence intensity measured using the GFP3 filter, the background intensity was subtracted and the area for measuring the fluorescence intensity was selected. The average fluorescence intensity within a selected area of each image was quantified.
EC culture was performed according to a previously described protocol (Chapman et al., 2001), with some modifications. An HH 9 chick embryo was placed on the culture gel (0.15% glucose, 0.3% agarose, 62.5 mM NaCl, ovalbumin) with the dorsal side down. Then, 100 μL of the chemical such as activators and inhibitors diluted in Tyrode’s solution (8 g NaCl, 0.2 g KCl, 0.2 g CaCl2, 0.1 g MgCl2, 0.05 g NaH2PO4, 1 g glucose, 1 g NaHCO3, up to 1 L H2O) was added dropwise. The lid of the dish was closed and left at room temperature for approximately 1 h, and the dish was incubated at 38.6°C. The following chemical solutions were used: 1% DMSO (control), 1 μM PD173074 (Santa Cruz Biotechnology, TX, USA; sc-202610), 10 μM XAV939 (Cayman Chemical, MI, USA; 13,596), 20 μM CHIR-99021 (Focus Biomolecules, PA, USA; 10–1,279), 300 μM iCRT3 (Selleck, TX, USA; S8647), and 500 μM LF3 (Selleck, TX, USA; S8474), 10 μM U73122 (Cayman Chemical, MI, USA; 70,740), 100 μM LY294002 (FUJIFILM Wako, Japan; 129–04861), 50 μM Ruxolitinib (Selleck, TX, USA; S1378), 100 μM U0126 (Chemscene, NJ, USA; CS-0173).
Heparin-coated acrylic beads (Sigma Aldrich, MO, USA; H5263) were added to 0.1% BSA/PBS (FUJIFILM Wako, Japan; 013–15104) solution or 100 ng/μL or 500 ng/μL FGF8b (R&D systems, MN, USA; 423-F8-025)/0.1% BSA solution and allowed to adsorb proteins for 1 h at room temperature. The beads were then implanted ventrally into the chick embryos and cultured on the culture gel described above.
We cracked the fertilized eggs at HH 4 into a glass dish and removed the albumin surrounding the embryos. We attached the embryo to the perforated paper and cut it around the paper and vitellin membrane. We transferred the embryo to warm Hank’s solution and removed the excess yolk. Embryos were placed dorsally on the anode in a dish (BEX, CUY701P2E) containing warm Hank’s solution. A DNA solution was injected between the embryo and the vitelline membrane. Embryos were sandwiched between platinum electrodes (BEX, CUY701P2L), and electric pulses (50 ms pulse on and 100 ms pulse off at 7 V, five times) were applied using a GEB14 electroporator (BEX). Embryos were washed with warm Hank’s solution and placed with ventral side up on the culture gel. Then, 50 μL yolk solution was added to the embryos, followed by incubation at 38.6°C. The yolk solution comprised fresh egg yolk and Hank’s solution, which were mixed in a 1:1 ratio and centrifuged, after which 0.5 mL of the supernatant was collected and mixed with 4.5 mL Hank’s solution.
Whole-mount in situ hybridization was conducted as previously described (Dietrich et al., 1997; Matsubara et al., 2017). Unless otherwise stated, shaking was performed in all steps. Collected embryos were fixed in 4% paraformaldehyde (PFA) in PBS overnight at 4 °C, without shaking. The embryos were then placed in 25% methanol in PBST (0.1% Tween 20 in PBS) and dehydrated for 10 min. Dehydration was performed by a stepwise increase in the concentration of methanol (50%, 75%, and 100% methanol, 10 min each step). Embryos were washed with 50% methanol in PBST for 10 min and twice with PBST for 5 min. The embryos were bleached in 6% H2O2 in PBST for 15 min. After washing twice with PBST for 5 min, the embryos were treated twice with detergent (1% NP-40, 1% SDS, 0.5% deoxycholate, 50 mM Tris pH 8.0, 1 mM EDTA, and 150 mM NaCl) for 20 min. Embryos were fixed in 0.2% glutaraldehyde in 4% PFA/PBS for 20 min. After washing twice with PBST for 5 min, the embryos were prehybridized in hybridization mix (50% formamide, 5× SSC pH 5.0, 250 μg/mL tRNA, 100 μg/mL heparin, 2% SDS) at 70 °C for 1 h. Then, a 1 μg/mL DIG-labeled probe was added to the hybridization mix, and embryos were incubated overnight at 70 °C. The next day, the embryos were washed four times for 30 min at 70 °C with wash solution (50% formamide, 2× SSC pH 5.0, 1% SDS) and then with 50% wash solution in TBST (0.1% Tween 20) at 70 °C for 10 min, followed by cooling to room temperature. After washing with TBST three times for 30 min, the embryos were blocked in 20% bovine serum in TBST for 1 h at 4 °C. Embryos were placed in 20% bovine serum in TBST containing 1:2000 Anti Digoxigenin-Ap Fab fragments (Roche, Switzerland; 11093274910), and the antibody reaction was performed overnight at 4 °C. The next day, after washing with TBST three times for 5 min and then seven times for 1 h, the embryos were washed overnight with TBST at 4 °C. The following day, the embryos were treated four times for 10 min with NTMT (100 mM NaCl, 100 mM Tris-HCl pH 9.5, 50 mM MgCl2, and 1% Tween 20), with levamisole added to a final concentration of 2 mM. Embryos were placed in NTMT containing 10% PVA, 3.5 μL/mL BCIP (Roche, 11383221001), and 3.5 μL/mL NBT (Roche, 11383213001), and color development was performed without shaking. After confirming sufficient coloring, the embryos were washed twice with TBST for 5 min to stop color development. Embryos were fixed in 4% PFA/PBS and stored at 4 °C. The DNA used as a template for synthesizing DIG-labeled RNA was amplified by PCR using the following primers: mGdf11 (F-5′- GTATTAAGCCTCCAGGGTTGGGAAT 3′, R-5′- CAGGTGTATATTCATAAGACAACCCCTTCC -3′), mHoxd11 (Robert et al., 1995), and cGdf11 (F-5′- AGCAAAGAGCTGCGGCTGGAGAG -3′, R-5′- AAAGGGCAGAAGAGGAGAAGGAATCCGTC -3′).
Tissues were isolated from the pAM of chick embryos and posterior tissues containing the PSM of mouse embryos (E9.5). Whole embryonic bodies were harvested at E8.5. RNA was extracted from these tissues using the NucleoSpin RNA XS kit (TaKaRa, Japan; U0902B), and RNA was extracted from other tissues using TRIZOL Reagent (Invitrogen, 15596026). The Qubit RNA HS Assay Kit (Life Technologies, Carlsbad, CA, USA; Q32855) was used to measure the RNA concentration. RT-qPCR was performed using the One Step TB Green PrimeScript PLUS RT-PCR Kit (TaKaRa, RR096A) and StepOnePlus real-time PCR system (Life Technologies). The PCR cycle was 42 °C for 5 min; 95 °C for 10 s; 40 cycles of 95 °C for 5 s and 60 °C for 35 s; 95 °C for 15 s; 60 °C for 1 min; and 95 °C for 15 s. The following primers were used: cGapdh (F-5′- TCCTCTCTGGCAAAGTCCA -3′, R-5′- TCCGTGTGTAGAATCATATTTGAAC -3′), cGdf11 (F-5′- CATCGAGATCAACGCCTTC -3′, R-5′- AGTCCAAGCCCAGGTTCC -3′), mGapdh (F-5′- TCACCACCATGGAGAAGGC -3′, R-5′- GCTAAGCAGTTGGTGGTGCA -3′), and mGdf11 (F-5′- CACAGACCTGGCTGTCACC -3′, R-5′- TCGAAGCTCCATGAAAGGAT -3′).
The collected embryos were fixed in 4% PFA in PBS on ice for 30 min. After trimming the embryos, the tissues were dehydrated in 10% sucrose in PBS at 4 °C for 1 h. They were then dehydrated stepwise with 20% sucrose in PBS and 30% sucrose in PBS at 4 °C for 1 h. Tissues were embedded using Frozen Section Compound (Leica, 3801481) and stored at −80°C. Tissues were sectioned at 20 μm thickness using a cryostat (Leica, CM3050). The sections were placed on a MAS-coated glass slide (MATSUNAMI, Japan; S9115) and dried using a slide warmer at 40 °C for 1 h. The glass slides were washed three times with PBS for 1 min. After treatment with 0.1% TritonX-100 in PBS and 1 μg/mL DAPI at room temperature for 10 min, the glass slide was washed with PBS three times for 1 min. The slides were mounted in Fluorescence Mounting Medium (Dako, Agilent, CA, USA; S3023). Fluorescence was observed under the Leica DM2500 fluorescence microscope.
Cas9 protein, two crRNAs flanking the coding sequence or enhancers of Gdf11, and tracrRNA were introduced into in vitro-fertilized zygotes by electroporation (GEEP method), as reported (Hashimoto and Takemoto, 2015). The target sequences were as follows: Gdf11 crRNA1:5-GGAGCCGTAAACAAGCCAAG-3, Gdf11 crRNA2:5-TTCTACCAGACCATAACTGC-3, HCR crRNA1:5-ACTCAGGCTGGATGGCCCAG-3, HCR crRNA2:5-GAGTTGCTGAGACGTACACC -3. Electroporated embryos were transferred into the oviducts of female pseudopregnant B6D2F1 (BDF1) mice. Chimeric mice were crossed with B6D2F1 (BDF1) mice purchased from Japan SLC, and the strain was established. Deletion of the Gdf11 coding sequence or HCR was confirmed by PCR amplification of the target genomic region and sequencing. Cas9 protein, crRNA, and tracrRNA were purchased from IDT (IA, USA).
Tissue obtained by ear punching was placed in lysis buffer (10 mM Tris-HCl pH 8.3, 50 mM KCl, 2.5 mM MgCl2, 0.45% NP40, 0.45% Tween 20, 200 μg/μL Proteinase K) and lysed overnight at 56 °C. After extracting genomic DNA, genotyping was performed under the following conditions. To evaluate the genotype of HCR-deficient mice, the following primers were used: wild-type allele (F-5′- ATAGTGAAGGCAATGGGAAGCCTG -3′, R-5′- TTGATTGACTAAGGGCAGGGATAGG -3′), ∆HCR allele (F-5′- GGGCCACATCTGTGTTGGATTG -3′, R-5′- ACCAGGCAGGTTGTGAGCTATTG -3′). To evaluate the genotype of Gdf11-deficient mice, the following primers were used: wild-type allele (F-5′- AGATTATCTACGGCAAGATCCCTGG -3′, R-5′- TGTTGTATTGCACACTGCTTGGTC -3′) and Gdf11-deficient allele (F-5′- CCAGGAGCTCTAGACCGTTACC -3′, R-5′- GCTTTTCTGTTCCTCTCCTACACC -3′).
The PCR cycle was 98 °C for 2 min; 35 cycles of 98 °C for 10 s, 60 °C for 30 s, and 68 °C for 30 s; and 68 °C for 1 min.
P0 mice were harvested and stored at −30°C. The frozen mice were placed in hot water at approximately 37 °C and completely thawed. The mice were placed in hot water (60 °C) for approximately 1 min until the surface became white and then transferred to distilled water at room temperature. The raised epidermis of the mice was peeled off in distilled water, and the abdomen was opened. Mice were dehydrated and fixed in 90% ethanol for 15 min. The skin, fat, and internal organs of the mice were removed, placed in 90% ethanol, and stored overnight in 99.5% ethanol at 4 °C. Unless otherwise stated, the following steps were performed under shaking. Mice were placed in acetone overnight and then in 0.015% Alcian blue (Sigma-Aldrich, A5268) in 20% acetic acid/80% ethanol solution for two nights. After shaking twice for 1 h in 95% ethanol, the mice were placed in 0.0125% alizarin red (FUJIFILM Wako, 011–01192) in 70% ethanol for 2 h. Mice were placed in 1% KOH and incubated overnight at 4 °C. Subsequently, KOH was added without shaking. Mice were placed in 0.8% KOH in 20% glycerol until the tissues became transparent and then in 0.6% KOH in 40% glycerol overnight. Mice were shaken overnight in 0.4% KOH in 60% glycerol and then placed in 0.2% KOH in 80% glycerol overnight. The mice were placed in 100% glycerol and stored. The skeletal patterns were observed and photographed using a stereomicroscope (Leica M205FA) and camera (Leica DFC450C).
To clarify the molecular mechanisms that induce Gdf11 expression, we tried to identify candidate enhancer sequences that regulate the expression of Gdf11 in silico. We searched for conserved sequences in noncoding regions within 30 kb of the human Gdf11 locus (hg38, chr12:55728000–55758000) across the species human, mouse, chicken, budgerigar, green anole, and American alligator, using the ECR genome browser. Conservation of the noncoding region surrounding the Gdf11 locus was very low; therefore, we did not detect any putative conserved regions either upstream or downstream of the Gdf11 gene. We found only three highly conserved regions in intron 1 of the Gdf11 gene. We named this region the Highly Conserved Region (HCR) (1727 bp; mm9, chr10:128326106-128327832), and three regions, including the HCR, a, b, and c regions (Figure 1).
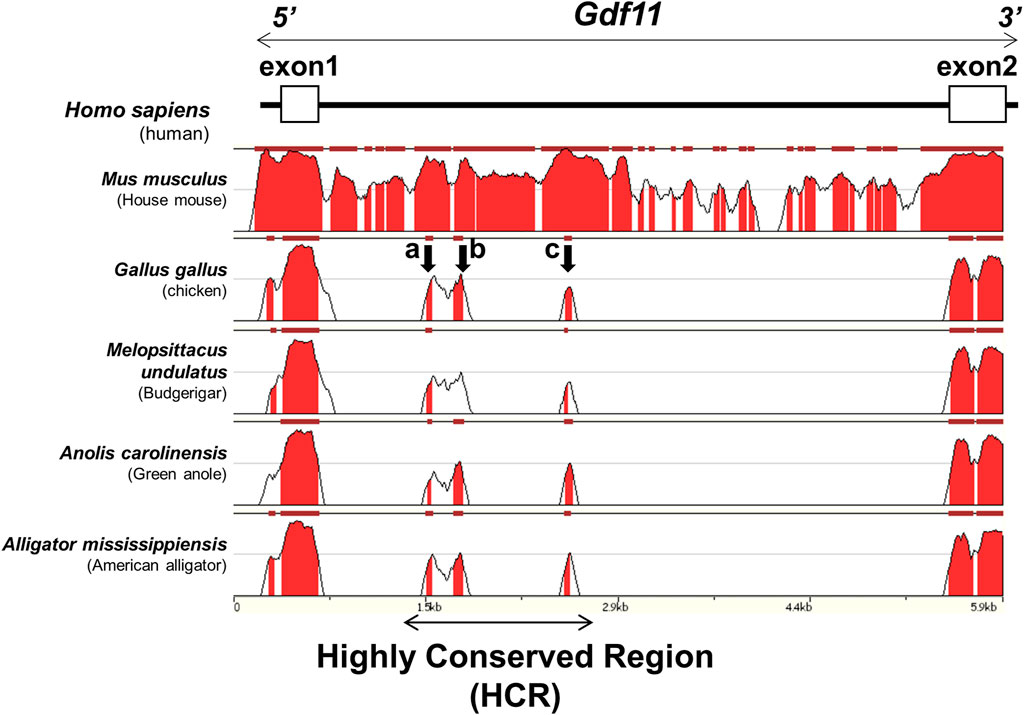
FIGURE 1. Three conserved regions surrounding the Gdf11 loci Conserved regions involving intron 1 of human Gdf11 (hg38, chr12:55743200–55749100) among tetrapod species. The regions with the peaks were conserved. Three regions of approximately 50 bp (a, b, and c), indicated by arrows, were highly conserved. A region of approximately 1700 bp including all three regions, was named HCR.
To investigate whether HCR displayed enhancer activity in PSM, we performed a reporter assay using in ovo electroporation. The EGFP reporter fused to the mouse HCR was electroporated together with pCAGGS-mCherry (for visualization of the electroporated region) in the posterior region of Hensen’s node in HH 8 chick embryos (Figure 2A). We observed a strong EGFP signal in the pAM, caudal neural tube (NT), and PSM (9/9) (Figures 2Ba-f), where Gdf11 was expressed (Figures 2Bg). This result suggests that the HCR contains Gdf11 enhancers during this developmental stage.
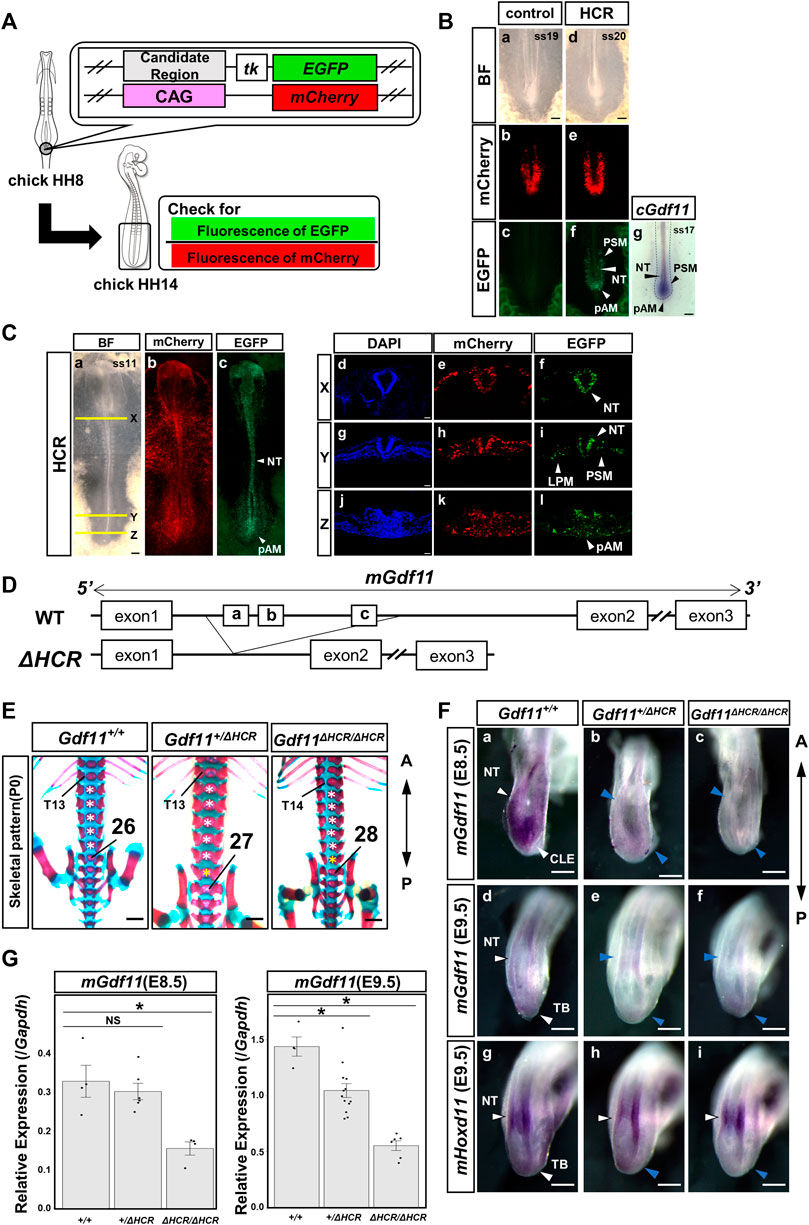
FIGURE 2. The HCR functions as a Gdf11 enhancer and is essential for positioning of the sacral-hindlimb unit. (A) Schematic diagram of a reporter assay using chick embryos. (B) Reporter assay results for controls (a–c) and HCR (d–f). HCR exhibited enhanced activity in the pAM, PSM, and NT. Number of EGFP-positive samples/number of all examined samples: 0/8 control; 9/9 HCR. (g) Endogenous cGdf11 expression by in situ hybridization. ss: somite stage. Scale bar: 200 μm. (C) Gene transfer into whole embryos via electroporation. HCR exhibits enhanced activity simultaneously with Gdf11 expression. Whole embryo (a–c) and tissue section images (X: d-f, Y: g-I, Z: j-l). Number of EGFP-positive samples/total number of examined samples: 12/12; HCR. Scale bar: 200 μm (a–c), 50 μm (d–l). (D) Method of generating HCR-deficient mice. Wild-type (top) and HCR-deficient mice (bottom). (E) Phenotypic analysis of P0 wild-type mice and mice deficient in the HCR (Gdf11+/ΔHCR, Gdf11ΔHCR/ΔHCR). T, thoracic; white asterisks, normal number of lumbar vertebrae; yellow asterisks, extra lumbar vertebrae. Scale bar: 1 mm. (F) Expression analysis of Gdf11 and its downstream target Hoxd11 in wild-type mice and Gdf11+/ΔHCR, Gdf11ΔHCR/ΔHCR mice at E8.5 (a–c) and E9.5 (d–i). Arrowheads indicate gene expression regions. Blue arrowheads indicate decreased expression levels. NT, neural tube; CLE, caudal lateral epiblast; TB, tail bud Scale bar: 200 μm. (G) Expression level of Gdf11 at E8.5 and E9.5 in wild-type mice and Gdf11+/ΔHCR, Gdf11ΔHCR/ΔHCR mice by RT-qPCR. *p < 0.05 (Steel test). Dots indicate the relative expression levels of Gdf11 in each sample. Error bars indicate standard error of the mean.
To further confirm that the enhancer activity of HCR was activated in the embryo, we electroporated the reporter constructs into whole embryos and observed EGFP fluorescence (Figure 2C). We observed EGFP fluorescence in the neural tissue from the brain to the posterior NT, whereas in the mesodermal tissue, EGFP fluorescence was confined to the PSM and LPM in the posterior region, with weak expression (12/12) (Figures 2Ca–c). We further analyzed the embryonic tissue sections (Figures 2Cd–l). EGFP fluorescence was observed in the pAM, posterior PSM, NT, and LPM. These results indicate that HCR possesses enhancer activity that extends beyond the endogenous Gdf11-expressing region.
Since the HCR showed enhancer activity, we generated HCR-knockout (Gdf11ΔHCR/ΔHCR) mice and analyzed the skeletal pattern and endogenous Gdf11 expression (Figure 2D). Compared with wild-type mice (Gdf11+/+), Gdf11+/ΔHCR mice had one extra thoracic (C7T14L5S4) or lumbar (C7T13L6S4) vertebra, and the position of the sacral-hindlimb unit was shifted posteriorly (Figure 2E; Table 1, Supplementary Figure S1). The number of thoracic and lumbar vertebrae was increased by one (C7T14L6S4) in Gdf11ΔHCR/ΔHCR mice, which shifted the position of the sacral-hindlimb unit posteriorly by up to two vertebrae (Figure 2E; Table 1, Supplementary Figure S1). Therefore, the HCR is essential for positioning the sacral-hindlimb unit.
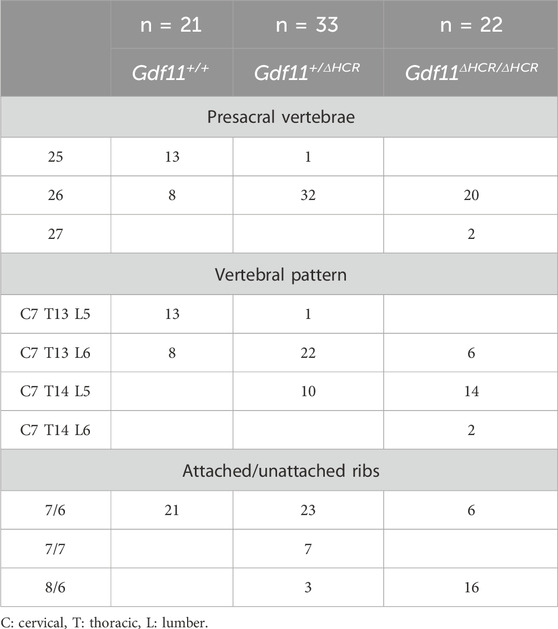
TABLE 1. Skeletal analysis of wild-type, Gdf11+/ΔHCR, and Gdf11ΔHCR/ΔHCR mice.
Next, to investigate changes in endogenous mouse Gdf11 (mGdf11) expression, we analyzed embryos at E8.5 (mGdf11 expression onset) and E9.5, by whole-mount in situ hybridization and RT-qPCR. In E8.5 embryos, endogenous mGdf11 expression level at the onset of expression in Gdf11ΔHCR/ΔHCR mice was though remarkably reduced in the posterior NT and CLE (Figures 2Fa–c), it was still expressed. Next, we analyzed the expression level of mGdf11 in E8.5 embryos quantitatively by RT-qPCR. The expression level of endogenous mGdf11 in Gdf11ΔHCR/ΔHCR mice was significantly reduced, to approximately 40% of that in the wild-type mice (Figure 2G). At E9.5, we analyzed the expression of mGdf11 and mHoxd11, a gene downstream of Gdf11. In Gdf11ΔHCR/ΔHCR embryos, the expression level of mGdf11 was decreased in the NT and especially in the tailbud, and anterior domain of mHoxd11 expression in NT and LPM was shifted posteriorly and its expression of the tailbud was reduced (Figures 2Fd-i). The expression level of endogenous mGdf11 in Gdf11+/ΔHCR and Gdf11ΔHCR/ΔHCR mice in E9.5 embryos was significantly reduced, to approximately 70% and 30% of those in the wild-type mice, respectively (Figure 2G). These results indicate that the HCR is essential for determining the position of the sacral-hindlimb unit, and that the Gdf11 enhancer exists within this region.
Next, we investigated which conserved sequences within the HCR contribute to enhancer activity. We constructed an EGFP reporter in which single a, b, and c regions were inserted upstream of tk-EGFP (1xa, 1xb, 1xc); each a, b, and c region was tandemly repeated three times (3xa, 3xb, 3xc). The separate a, b, and c regions were tandemly connected (abcT) and the a and c regions were tandemly connected (acT) (Figure 3A). We then performed a reporter assay in chick embryos. EGFP fluorescence was not detected in the embryos electroporated with 1xa, 1xb, 1xc. Next, we electroporated with 3xa, 3xb, 3xc constructs with the anticipation that each enhancer activity would be more readily observable. In embryos electroporated with 3xb; strong EGFP fluorescence was observed in the pAM, PSM, and NT, whereas no significant EGFP fluorescence was observed in embryos electroporated with 3xa and 3xc. These results suggest that b region may be important for HCR enhancer activity. Therefore, we prepared a sequence in which only the b region was deleted from the HCR (HCR w/o b). We observed EGFP fluorescence in the pAM, PSM, and NT in embryos electroporated with HCR w/o b (Figure 3B). These findings imply that the HCR contains sequences other than the b region that are necessary for its enhancer function. Next, we prepared a sequence in which only the a- and c-regions were connected (acT). EGFP fluorescence was not observed in embryos electroporated with the acT construct (Figure 3B). When we electroporated the abcT construct, we observed EGFP fluorescence in the PSM and pAM; however, this fluorescence was weaker than that observed in embryos electroporated with HCR (Figure 3B). These results suggest that the b region is important for enhancer activity among the conserved individual regions (a, b, and c); however, HCR contains non-conserved sequences that can compensate for the enhancer activity of the b region.
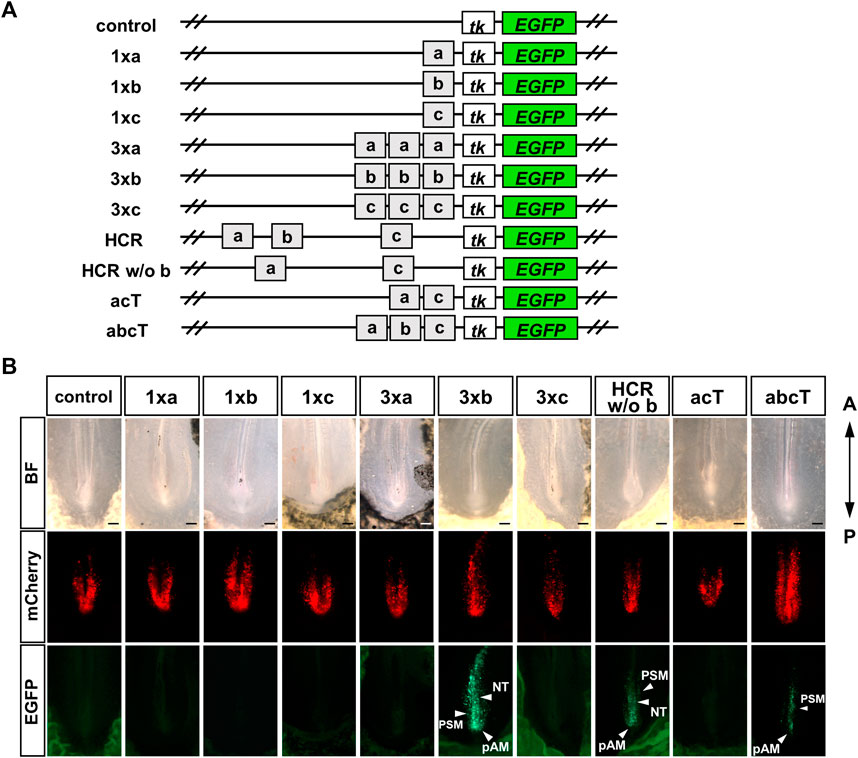
FIGURE 3. Only b region shows enhancer activity among the conserved individual regions, (a, b, c) (A) Schematic representation of the analysis of conserved regions in Gdf11 intron 1. We constructed an EGFP reporter in which single a, b, and c regions were inserted upstream of tk-EGFP (1xa, 1xb, 1xc). Each a, b, and c region was repeated in tandem three times (3xa, 3xb, 3xc), only the b region was deleted from the HCR (HCR w/o b). The a and c regions were tandemly connected (acT), and the separate a, b, and c regions were tandemly connected (abcT). Number of EGFP-positive samples/total number of examined samples: 0/8, control; 0/5, 1xa; 0/11, 1xb; 0/3, 1xc; 0/6, 3xa; 7/7, 3xb; 0/5, 3xc; 8/8, HCR w/o b; 0/10, acT; 12/18, abcT. Scale bar: 200 μm. Arrowheads: regions with enhancer activity. BF, bright field; NT, neural tube; PSM, presomitic mesoderm; pAM, posterior axial mesoderm.
Based on our results, we predicted that the position of the sacral-hindlimb unit is determined by the expression level of Gdf11. Therefore, we generated transheterozygous Gdf11 mice by crossing Gdf11+/− and Gdf11+/ΔHCR mice (Figure 4A; Table 2, Supplementary Figure S2). As a result, the position of the sacral-hindlimb unit was shifted posteriorly by up to three vertebrae in Gdf11ΔHCR/− mice due to the addition of two thoracic vertebrae and one extra lumbar vertebra (C7T15L6S4). Next, we analyzed the expression level of mGdf11 in E8.5, using RT-qPCR. The expression level of endogenous mGdf11 in Gdf11ΔHCR/- was significantly reduced, to approximately 20% of that in the wild-type mice (Figure 4B). These results indicate that Gdf11ΔHCR/- mice show more severe phenotype than that of Gdf11+/− and Gdf11ΔHCR/ΔHCR mice, depending on expression level of Gdf11.

FIGURE 4. The position of the sacral hindlimb unit was shifted more posteriorly in Gdf11ΔHCR/- mice. (A) Phenotypic analysis of Gdf11+/+, Gdf11+/ΔHCR, Gdf11+/−, and Gdf11ΔHCR/− mice at P0. Gdf11ΔHCR/− mice showed posterior displacement of the first sacral vertebrae by two to three vertebrae. T: thoracic; L: lumbar. White asterisks: normal number of lumbar vertebrae; yellow asterisks: extra lumbar vertebrae. Scale bar: 1 mm. (B) Expression level of Gdf11 at E8.5 in Gdf11+/+, Gdf11+/ΔHCR, Gdf11+/−, and Gdf11ΔHCR/− mice by RT-qPCR. *p < 0.05, **p < 0.01 (Steel test). Dots indicate the relative expression levels of Gdf11 in each sample. Error bars indicate standard error of the mean.
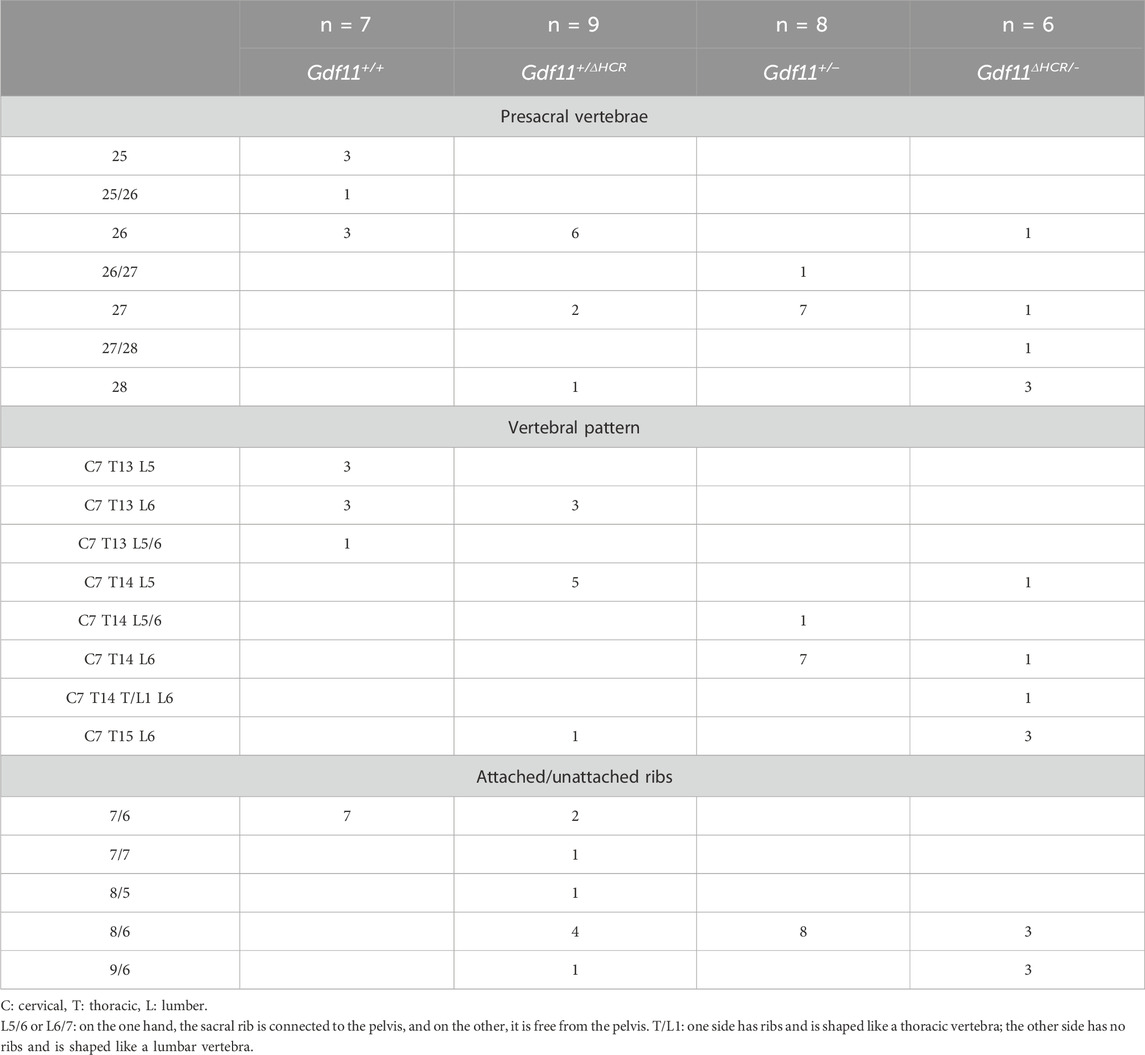
TABLE 2. Skeletal analysis of wild-type, Gdf11+/ΔHCR, Gdf11+/−, and Gdf11ΔHCR/- mice.
We used the rVista (https://rvista.dcode.org/) and JASPAR programs (https://jaspar.elixir.no/) to search for candidate upstream factors regulating Gdf11 in the HCR. We found predicted ETS transcription factor binding sites (TFBSs) downstream of FGF signaling and TCF4 and LEF1 TFBSs downstream of WNT signaling (Figure 5A). Therefore, we focused on FGF and WNT signaling because they are essential for posterior elongation of the embryo. We analyzed the changes in endogenous Gdf11 expression and enhancer activity in HCR after altering FGF and WNT signaling levels in chick embryos.
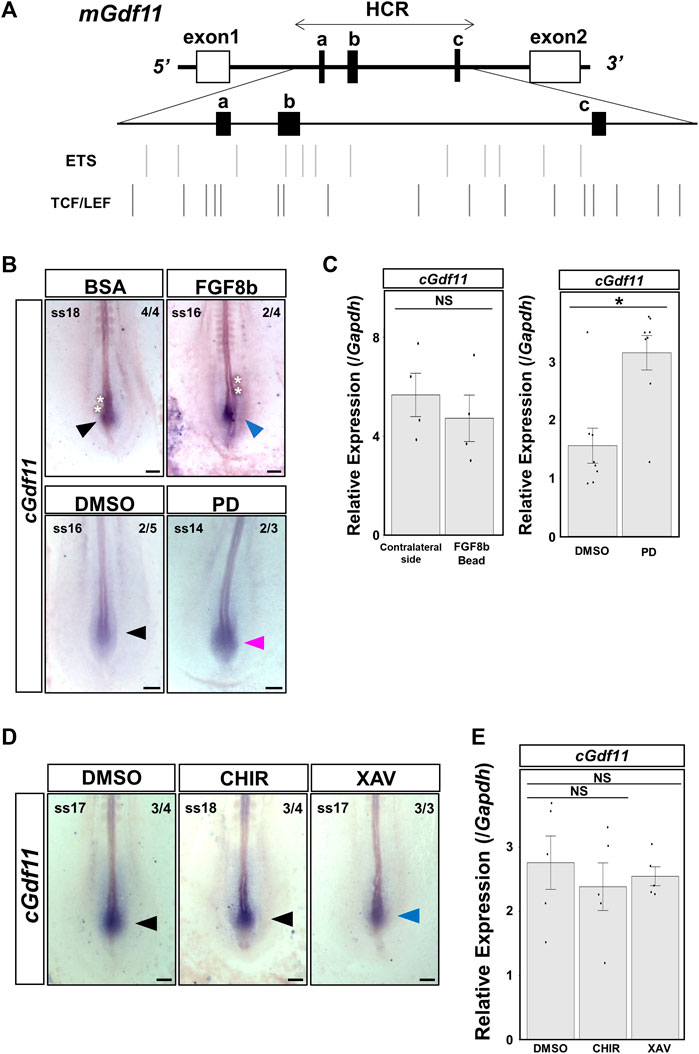
FIGURE 5. Inhibition of FGF signaling upregulated endogenous Gdf11 expression. Endogenous cGdf11 expression after FGF and WNT signaling was altered in chick embryos. (A) ETS transcription factor binding sites (TFBSs) and TCF4 and LEF1 TFBSs within the HCR of mGdf11. Bars indicate the TFBS positions. (B, C) cGdf11 expression after altering FGF signaling levels. (B) In situ hybridization after treatment with 100 ng/μL FGF8b (top) or 1 μM PD173074 (bottom panel). The image with the strongest signal intensity obtained under the same conditions is shown. Representative signal intensities as pictured/all samples: 4/4, BSA; 2/4, FGF8b; 2/5, DMSO; 2/3, PD. FGF8b: 100 ng/μL FGF8b; PD: 1 μM PD173074 (C) RT-qPCR analysis after altering the FGF signaling levels. Implantation of 500 ng/μL FGF8b soaked beads and treatment of 1 μM PD173074 (right). *p < 0.05 (Mann-Whitney U test). Dots indicate the relative expression levels of cGdf11 in each sample. Error bars indicate standard error of the mean. Bead: transplanted side; Opposite: non-transplanted side. (D, E) cGdf11 expression after altering the WNT signaling levels. (D) In situ hybridization after treatment with DMSO (left), 20 μM CHIR-99021 (middle), or 10 μM XAV939 (right). Representative signal intensity as pictured/all samples: 3/4 DMSO; 3/4 CHIR; and 3/3 XAV. CHIR: 20 μM CHIR-99021; XAV: 10 μM XAV939 (E) RT-qPCR analysis after altering the WNT signaling levels. Dots indicate the relative expression levels of cGdf11 in each sample. Error bars indicate standard error of the mean (Steel test). Scale bar: 200 μm. Arrowheads indicate the gene expression regions. The blue and red arrowheads indicate decreased and increased expression levels, respectively.
First, we transplanted 100 ng/μL FGF8b-soaked beads near the Gdf11-expressing region. Some individuals showed reduced expression of chicken Gdf11 (cGdf11) on the side implanted with FGF8b beads (Figure 5B). Next, when we administered 1 μM PD173074 to inhibit FGF signaling, cGdf11 expression was upregulated without affecting its expression region (Figure 5B). Furthermore, we quantitatively analyzed the expression levels of endogenous cGdf11 (Figure 5C). When we implanted FGF8b beads on the right side of the pAM (FGF8b bead in Figure 5C), the expression level of cGdf11 appeared to be downregulated compared to that on the left side of the pAM (contralateral side in Figure 5C); however, there was no statistically significant difference. In contrast, cGdf11 expression significantly increased after treatment with 1 μM PD173074. These results suggest that FGF signaling negatively regulates endogenous Gdf11 expression.
Next, we analyzed the changes in the expression of cGdf11 after enhancement or inhibition of WNT signaling (Figures 5D,E). We did not observe a remarkable change in cGdf11 expression after treatment with 20 μM CHIR-99021, an activator of WNT signaling (Figures 5D,E). On the other hand, treatment with 10 μM XAV939, a WNT signaling inhibitor, induced a slight decrease in cGdf11 expression (Figure 5D), which was not statistically different as per RT-qPCR (Figure 5E). These results indicate that WNT signaling is not a major factor controlling endogenous Gdf11 expression.
To investigate whether FGF or WNT signaling regulates the enhancer activity of HCR, we performed a reporter assay and quantitatively analyzed the enhancer activity of HCR, based on our previous method (Saito et al., 2019). We used EGFP reporter fused to HCR and pCAGGS-mCherry, and calculated the relative intensity of EGFP to mCherry as an index of enhancer activity (Section 2.3) (Saito et al., 2019).
When we co-electroporated constitutively active Mek1 (CA-Mek1), the enhancer activity of HCR did not change. On the other hand, the enhancer activity of the HCR was significantly reduced by constitutively active β-catenin (CA-β-catenin) co-electroporation (Figures 6A,B). Next, when we inhibited FGF signaling by 1 μM PD173074 treatment or WNT signaling by 10 μM XAV939, 300 μM iCRT3, 500 μM LF3 treatment, enhancer activity of HCR appeared to be slightly increased, however, they were not statistically different (Figures 6C,D). These results suggest that the upregulation of WNT signaling inhibits the enhancer activity of HCR; however, inhibition of endogenous FGF or WNT signaling does not significantly affect this enhancer activity.
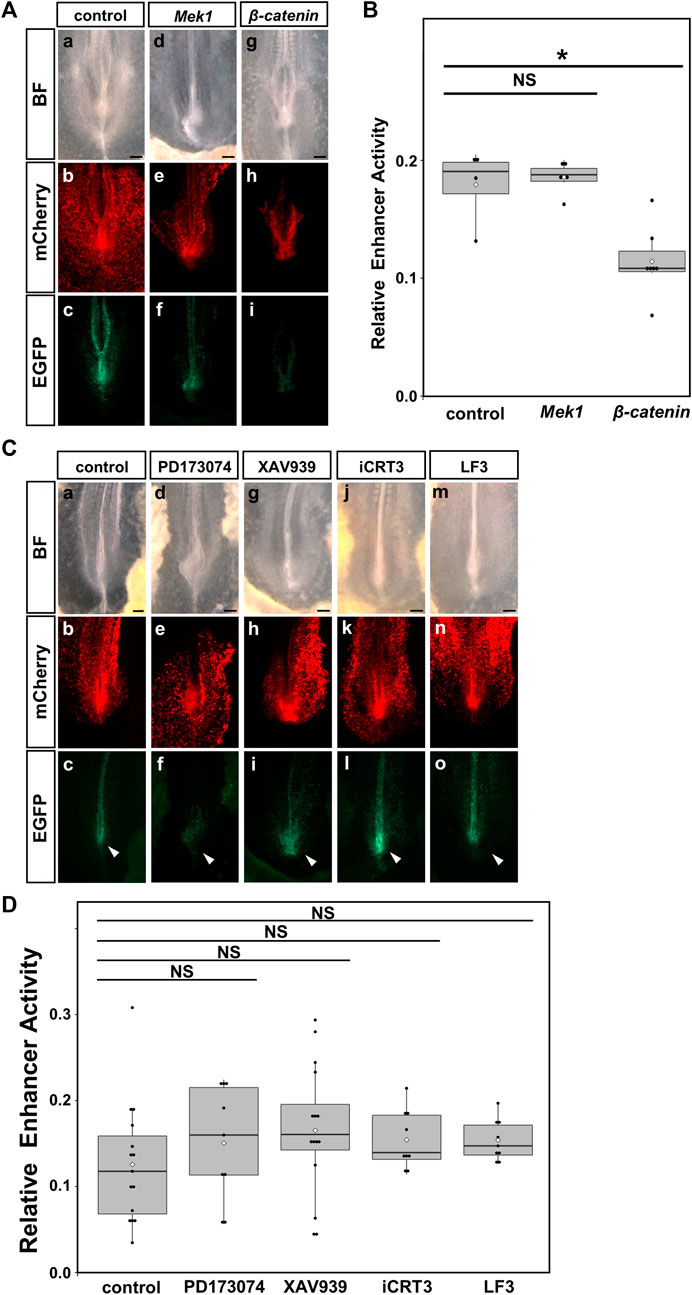
FIGURE 6. Upregulation of WNT signaling suppressed the enhancer activity of the HCR in the PSM. The enhanced activity of HCR after FGF and WNT signaling was altered in chick embryos. (A) Reporter assay for the control (left, (a–c)), overexpression of CA-Mek1 (middle, (d–f)), overexpression of CA-β-catenin (right, (g–i)). (B) Quantification of enhancer activity in the HCR after overexpression of CA-Mek1 and CA-β-catenin. Dots indicate the enhancer activity of each sample. Error bars indicate standard error of the mean. *p < 0.05 (Steel test). (C) Reporter assay for DMSO as control (a–c), 1 μM PD173074 (d–f), 10 μM XAV939 (g–i), 300 μM iCRT3 (j–l), 500 μM LF3 (m–o). (D) Quantification of enhancer activity in the HCR after treatment with 1 μM PD173074, 10 μM XAV939, 300 μM iCRT3 or 500 μM LF3. Dots indicate the enhancer activity of each sample. Error bars indicate standard error of the mean. BF: bright field, Mek1: CA-Mek1, β-catenin: CA-β-catenin, PD: 1 μM PD173074, XAV: 10 μM XAV939, iCRT3:300 μM iCRT3, LF3:500 μM LF3.
In the present study, we found that only three regions (a, b, and c) among tetrapods, surrounding the Gdf11 loci, were highly conserved. HCR showed enhancer activity in the pAM, in which endogenous Gdf11 is expressed, and is essential for determining the position of the sacral-hindlimb unit as an enhancer of Gdf11. Among the three conserved regions, only region b exhibited enhancer activity. However, HCR, excluding region b, still showed enhancer activity. These results suggest that the b region is important for enhancer activity among the three conserved regions; however, HCR contains non-conserved sequences that can compensate for the enhancer activity of the b region. Determining whether the sacral-hindlimb unit and endogenous Gdf11 expression undergo changes in mice lacking only the b region is an important question to address in the future. Furthermore, we found that inhibition of FGF signaling induced the upregulation of endogenous Gdf11 expression. FGF signaling primarily activates the expression of target genes. Therefore, we predicted that the upregulation of endogenous Gdf11 expression by the inhibition of FGF signaling is an indirect effect that does not mediate Gdf11 enhancers, including HCR (Figure 7). To further identify the signaling cascade downstream of the FGF receptor that regulates Gdf11 expression, we analyzed Gdf11 expression by inhibiting individual pathways downstream of FGF signaling using specific inhibitors (U73122: PLC inhibitor, LY294002: PI3K inhibitor, Ruxolitinib: JAK1/2 inhibitor, and U0126: MEK1/2 inhibitor). Despite treatment with each inhibitor, no remarkable alteration was observed in Gdf11 expression (Supplementary Figure S3). Therefore, it is likely that the cooperative function of all downstream signaling pathways of the FGF regulates endogenous Gdf11 expression. Because FGF signaling is activated in Hensen’s nodes and primitive streaks earlier than Gdf11 expression onset (Chapman et al., 2002), changes in FGF signaling might be important for the regulation of endogenous Gdf11 expression. However, Fgf8 expression has only been quantitatively analyzed after Gdf11 expression onset in chick embryos (Denans et al., 2015), while how FGF signaling fluctuates prior to Gdf11 expression has not been reported. Therefore, it is necessary to quantitatively analyze FGF signaling levels before and after Gdf11 expression onset.
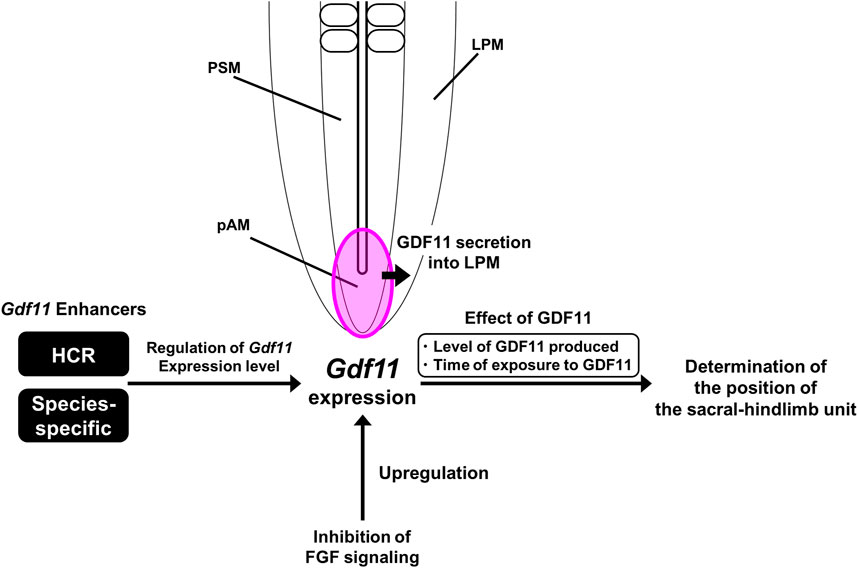
FIGURE 7. A model of Gdf11 expression regulation. HCR regulates the level of Gdf11 expression rather than the initiation timing of Gdf11 expression. The phenotype of Gdf11ΔHCR/ΔHCR mice fails to mimic the phenotype of Gdf11−/− mice, suggesting the existence of more Gdf11 enhancers other than the HCR. Because there are only three conserved regions around the Gdf11 locus, the presence of species-specific Gdf11 enhancers other than the three conserved regions (a-c) was predicted. The position of the sacral hindlimb unit is thought to be determined by both the quantity of GDF11 produced and the duration of exposure to GDF11. Inhibition of FGF signaling upregulates the expression of endogenous Gdf11 without mediating HCR.
The expression level of Gdf11 was significantly decreased at E8.5 at which endogenous Gdf11 expression initiates in Gdf11ΔHCR/ΔHCR mice without affecting its initiation timing. Furthermore, its expression level was further decreased at E8.5 in Gdf11ΔHCR/- mice, suggesting that HCR regulates the level of Gdf11 expression rather than the initiation timing of Gdf11 expression. In our study, the expression level of Gdf11 correlated with the position of the sacral-hindlimb unit. Embryos with lower levels of Gdf11 expression showed a more posterior shift in the sacral-hindlimb unit. In Gdf11ΔHCR/ΔHCR mice, reduction of Gdf11 expression level was continued from E8.5 to E9.5, implying that position of the sacral-hindlimb unit is determined by both level of GDF11 produced and time of exposure to GDF11 after Gdf11 expression initiated (Figure 7).
The phenotype of Gdf11ΔHCR/ΔHCR mice fails to mimic that of Gdf11−/− mice (McPherron et al., 1999) (our Gdf11−/− mice line) (Supplementary Figure S4). This suggests the presence of Gdf11 enhancers other than HCR. Other Gdf11 enhancers, either individually or in conjunction with HCR, would regulate the initiation time and the level of Gdf11 expression. Our results suggest the existence of species-specific Gdf11 enhancers, because there is no conserved region within 30 kb of the Gdf11 locus. Because the timing of Gdf11 expression initiation differs according to the position of the sacral-hindlimb unit in tetrapods (Matsubara et al., 2017), interspecies differences in enhancer activity are thought to produce differences in the initiation of Gdf11 expression and the levels of GDF11 produced, leading to diversity in the position of the sacral-hindlimb unit. Several reports have suggested that morphological differences among species are caused by changes in gene expression patterns due to differences in enhancer sequences and activity (Shashikant et al., 1998; Cretekos et al., 2008). For example, bat-accelerated regions (BARs), which evolved rapidly in the bat genome, are conserved in other vertebrate species. In BARs, the number of TFBSs required for limb bud development varies. Reporter assays have revealed that some BARs show reporter gene expression patterns different from those of mouse orthologous sequences (Booker et al., 2016). To elucidate the mechanism responsible for the diversity in the position of the sacral-hindlimb unit, it is necessary to identify predicted species-specific Gdf11 enhancers and analyze their functions.
We also focused on WNT signaling as a candidate upstream factor that regulates Gdf11 expression in the HCR sequence. The enhancer activity of the HCR was significantly decreased after CA-β-catenin overexpression, suggesting that upregulation of WNT signaling negatively regulated the enhancer activity of the HCR. However, even when WNT signaling was manipulated, there was no significant effect on the expression of endogenous Gdf11, suggesting that WNT signaling does not regulate endogenous Gdf11 expression. Furthermore, CA-β-catenin overexpression did not induce downregulation of endogenous Gdf11 expression (Supplementary Figure S5). These results suggest that WNT signaling negatively regulates HCR enhancer activity; however, it does not affect endogenous Gdf11 expression. We also investigated whether the onset of Gdf11 expression and the level of endogenous Gdf11 expression after its induction are altered by the treatment combination of FGF and WNT signaling agonists/inhibitors. However, these treatments did not affect Gdf11 expression (Supplementary Figure S6).
There were many predicted TFBSs downstream of FGF and WNT signaling in the HCR (Figure 5A); however, these signaling pathways did not primarily control the enhancer activity of HCR. This suggests the existence of other transcription factors that control the HCR enhancer activity. The discovery of other transcription factors that positively regulate HCR enhancer activity and other enhancers in addition to HCR will help clarify the mechanism underlying the positioning of the sacral hindlimb unit along the anterior-posterior axis through Gdf11 expression.
The datasets presented in this study can be found in Mendeley Data online repository. https://data.mendeley.com/datasets/ddnkcgm7h4/1, doi: 10.17632/ddnkcgm7h4.1 Key resources used in this study is listed in Table 3.
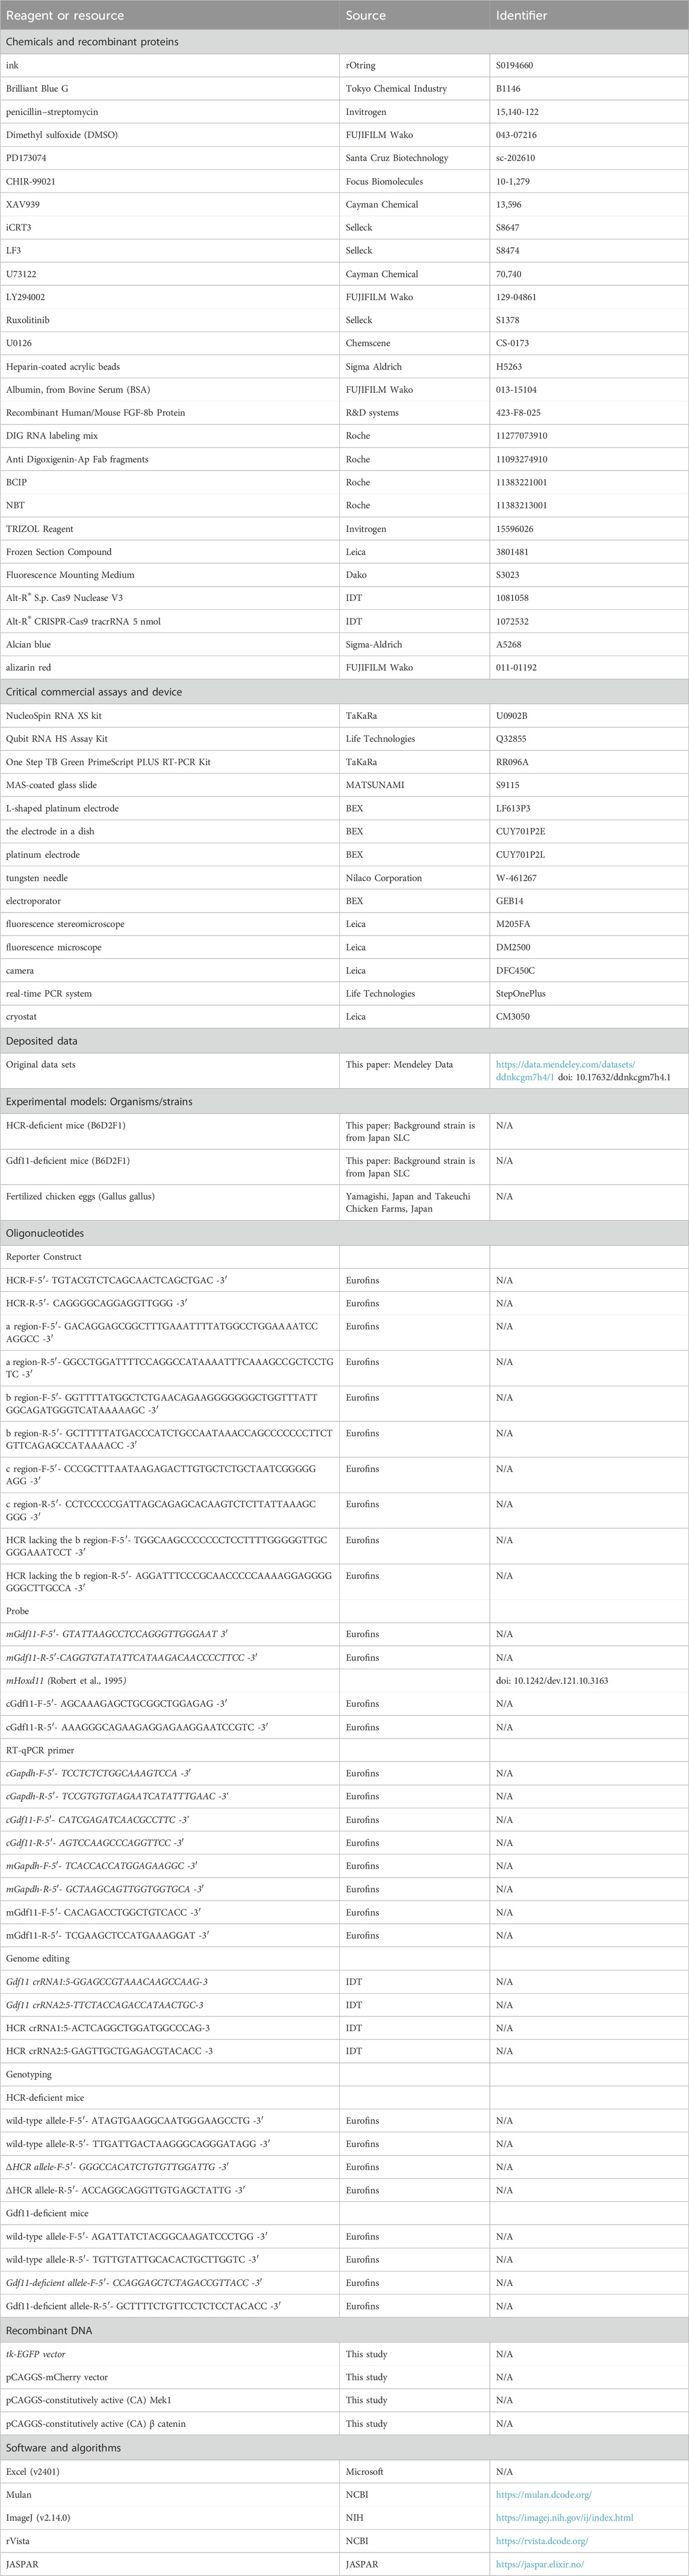
TABLE 3. Key resources used in this study.
The animal study was approved by Osaka Metropolitan University Animal Care and Use Committee. The study was conducted in accordance with the local legislation and institutional requirements.
SS: Conceptualization, Formal Analysis, Funding acquisition, Writing–original draft. UK: Formal Analysis, Writing–review and editing. AT: Formal Analysis, Writing–review and editing. AI: Conceptualization, Methodology, Writing–review and editing. TT: Conceptualization, Methodology, Resources, Writing–review and editing. TS: Conceptualization, Funding acquisition, Investigation, Supervision, Validation, Writing–original draft.
The author(s) declare that financial support was received for the research, authorship, and/or publication of this article. This work was supported by KAKENHI grant no. 21J22861, 22KJ1531 for SS, 20H04867, 22H02673 for TS. Foundation of Kinoshita Memorial Enterprise, The NOVARTIS Foundation (Japan) for the Promotion of Science for TS.
We thank Dr. Shinya Oki for finding enhancer regions by in silico and Dr. Kenichi Nishijima for discussions and researchers in the Laboratory of Avian Biosciences for kind assistance. We also thank to Yumi Ozaki for construction of reporter plasmids. This study was supported by the Joint Usage and Joint Research Programs, the Institute of Advanced Medical Sciences, Tokushima University.
The authors declare that the research was conducted in the absence of any commercial or financial relationships that could be construed as a potential conflict of interest.
All claims expressed in this article are solely those of the authors and do not necessarily represent those of their affiliated organizations, or those of the publisher, the editors and the reviewers. Any product that may be evaluated in this article, or claim that may be made by its manufacturer, is not guaranteed or endorsed by the publisher.
The Supplementary Material for this article can be found online at: https://www.frontiersin.org/articles/10.3389/fcell.2024.1302141/full#supplementary-material
Bénazéraf, B., and Pourquié, O. (2013). Formation and segmentation of the vertebrate body axis. Annu. Rev. Cell Dev. Biol. 29, 1–26. doi:10.1146/annurev-cellbio-101011-155703
Booker, B. M., Friedrich, T., Mason, M. K., VanderMeer, J. E., Zhao, J., Eckalbar, W. L., et al. (2016). Bat accelerated regions identify a bat forelimb specific enhancer in the HoxD locus. PLoS Genet. 12, e1005738. doi:10.1371/journal.pgen.1005738
Boulet, A. M., and Capecchi, M. R. (2012). Signaling by FGF4 and FGF8 is required for axial elongation of the mouse embryo. Dev. Biol. 371, 235–245. doi:10.1016/j.ydbio.2012.08.017
Chapman, S. C., Collignon, J., Schoenwolf, G. C., and Lumsden, A. (2001). Improved method for chick whole-embryo culture using a filter paper carrier. Dev. Dyn. 220, 284–289. doi:10.1002/1097-0177(20010301)220:3<284::AID-DVDY1102>3.0.CO;2-5
Chapman, S. C., Schubert, F. R., Schoenwolf, G. C., and Lumsden, A. (2002). Analysis of spatial and temporal gene expression patterns in blastula and gastrula stage chick embryos. Dev. Biol. 245, 187–199. doi:10.1006/dbio.2002.0641
Cretekos, C. J., Wang, Y., Green, E. D., Martin, J. F., Rasweiler, J. J., and Behringer, R. R. (2008). Regulatory divergence modifies limb length between mammals. Genes Dev. 22, 141–151. doi:10.1101/gad.1620408
Denans, N., Iimura, T., and Pourquié, O. (2015). Hox genes control vertebrate body elongation by collinear Wnt repression. Elife 4, e04379. doi:10.7554/eLife.04379
Dietrich, S., Schubert, F. R., and Lumsden, A. (1997). Control of dorsoventral pattern in the chick paraxial mesoderm. Development 124, 3895–3908. doi:10.1242/dev.124.19.3895
Galceran, J., Fariñas, I., Depew, M. J., Clevers, H., and Grosschedl, R. (1999). Wnt3a-/--like phenotype and limb deficiency in Lef1(-/-)Tcf1(-/-) mice. Genes Dev. 13, 709–717. doi:10.1101/gad.13.6.709
Gouti, M., Tsakiridis, A., Wymeersch, F. J., Huang, Y., Kleinjung, J., Wilson, V., et al. (2014). In vitro generation of neuromesodermal progenitors reveals distinct roles for wnt signalling in the specification of spinal cord and paraxial mesoderm identity. PLoS Biol. 12, e1001937. doi:10.1371/journal.pbio.1001937
Hamburger, V., and Hamilton, H. L. (1951). A series of normal stages in the development of the chick embryo. J. Morphol. 88, 49–92. doi:10.1002/jmor.1050880104
Hashimoto, M., and Takemoto, T. (2015). Electroporation enables the efficient mRNA delivery into the mouse zygotes and facilitates CRISPR/Cas9-based genome editing. Sci. Rep. 5, 11315. doi:10.1038/srep11315
Henrique, D., Abranches, E., Verrier, L., and Storey, K. G. (2015). Neuromesodermal progenitors and the making of the spinal cord. Development 142, 2864–2875. doi:10.1242/dev.119768
Ikeya, M., and Takada, S. (2001). Wnt-3a is required for somite specification along the anteroposterior axis of the mouse embryo and for regulation of cdx-1 expression. Mech. Dev. 103, 27–33. doi:10.1016/s0925-4773(01)00338-0
Kimelman, D. (2016). Tales of tails (and trunks): forming the posterior body in vertebrate embryos. Curr. Top. Dev. Biol. 116, 517–536. doi:10.1016/bs.ctdb.2015.12.008
Matsubara, Y., Hirasawa, T., Egawa, S., Hattori, A., Suganuma, T., Kohara, Y., et al. (2017). Anatomical integration of the sacral-hindlimb unit coordinated by GDF11 underlies variation in hindlimb positioning in tetrapods. Nat. Ecol. Evol. 1, 1392–1399. doi:10.1038/s41559-017-0247-y
McPherron, A. C., Lawler, A. M., and Lee, S. J. (1999). Regulation of anterior/posterior patterning of the axial skeleton by growth/differentiation factor 11. Nat. Genet. 22, 260–264. doi:10.1038/10320
Naiche, L. A., Holder, N., and Lewandoski, M. (2011). FGF4 and FGF8 comprise the wavefront activity that controls somitogenesis. Proc. Natl. Acad. Sci. U.S.A. 108, 4018–4023. doi:10.1073/pnas.1007417108
Nakaya, Y., Kuroda, S., Katagiri, Y. T., Kaibuchi, K., and Takahashi, Y. (2004). Mesenchymal-epithelial transition during somitic segmentation is regulated by differential roles of Cdc42 and Rac1. Dev. Cell 7, 425–438. doi:10.1016/j.devcel.2004.08.003
Neijts, R., Simmini, S., Giuliani, F., van Rooijen, C., and Deschamps, J. (2014). Region-specific regulation of posterior axial elongation during vertebrate embryogenesis. Dev. Dyn. 243, 88–98. doi:10.1002/dvdy.24027
Partanen, J., Schwartz, L., and Rossant, J. (1998). Opposite phenotypes of hypomorphic and Y766 phosphorylation site mutations reveal a function for Fgfr1 in anteroposterior patterning of mouse embryos. Genes Dev. 12, 2332–2344. doi:10.1101/gad.12.15.2332
Pinson, K. I., Brennan, J., Monkley, S., Avery, B. J., and Skarnes, W. C. (2000). An LDL-receptor-related protein mediates Wnt signalling in mice. Nature 407, 535–538. doi:10.1038/35035124
Roberts, D. J., Johnson, R. L., Burke, A. C., Nelson, C. E., Morgan, B. A., and Tabin, C. (1995). Sonic hedgehog is an endodermal signal inducing Bmp-4 and Hox genes during induction and regionalization of the chick hindgut. Development 121, 3163–3174. doi:10.1242/dev.121.10.3163
Saito, S., Kawamura, K., Matsuda, Y., and Suzuki, T. (2019). Brilliant Blue as an alternative dye to Fast Green for in ovo electroporation. Dev. Growth Differ. 61, 402–409. doi:10.1111/dgd.12629
Saito, S., and Suzuki, T. (2020). How do signaling and transcription factors regulate both axis elongation and Hox gene expression along the anteroposterior axis? Dev. Growth Differ. 62, 363–375. doi:10.1111/dgd.12682
Sato, Y., Yasuda, K., and Takahashi, Y. (2002). Morphological boundary forms by a novel inductive event mediated by Lunatic fringe and Notch during somitic segmentation. Development 129, 3633–3644. doi:10.1242/dev.129.15.3633
Shashikant, C. S., Kim, C. B., Borbély, M. A., Wang, W. C., and Ruddle, F. H. (1998). Comparative studies on mammalian Hoxc8 early enhancer sequence reveal a baleen whale-specific deletion of a cis-acting element. Proc. Natl. Acad. Sci. U. S. A. 95, 15446–15451. doi:10.1073/pnas.95.26.15446
Takada, S., Stark, K. L., Shea, M. J., Vassileva, G., McMahon, J. A., and McMahon, A. P. (1994). Wnt-3a regulates somite and tailbud formation in the mouse embryo. Genes Dev. 8, 174–189. doi:10.1101/gad.8.2.174
Keywords: Gdf11, enhancer, hindlimb, sacral vertebrae, morphogenesis
Citation: Saito S, Kanazawa U, Tatsumi A, Iida A, Takemoto T and Suzuki T (2024) Functional analysis of a first hindlimb positioning enhancer via Gdf11 expression. Front. Cell Dev. Biol. 12:1302141. doi: 10.3389/fcell.2024.1302141
Received: 26 September 2023; Accepted: 22 February 2024;
Published: 15 March 2024.
Edited by:
Yuki Sato, Kyushu University, JapanReviewed by:
Makoto Ikeya, Kyoto University, JapanCopyright © 2024 Saito, Kanazawa, Tatsumi, Iida, Takemoto and Suzuki. This is an open-access article distributed under the terms of the Creative Commons Attribution License (CC BY). The use, distribution or reproduction in other forums is permitted, provided the original author(s) and the copyright owner(s) are credited and that the original publication in this journal is cited, in accordance with accepted academic practice. No use, distribution or reproduction is permitted which does not comply with these terms.
*Correspondence: Takayuki Suzuki, c3V6dWtpLnRha2F5dWtpQG9tdS5hYy5qcA==
Disclaimer: All claims expressed in this article are solely those of the authors and do not necessarily represent those of their affiliated organizations, or those of the publisher, the editors and the reviewers. Any product that may be evaluated in this article or claim that may be made by its manufacturer is not guaranteed or endorsed by the publisher.
Research integrity at Frontiers
Learn more about the work of our research integrity team to safeguard the quality of each article we publish.