 B. Petrelli
- 1Department of Biochemistry and Medical Genetics, Regenerative Medicine Program, Faculty of Medicine, University of Manitoba, Winnipeg, MB, Canada
- 2Department of Developmental Biology and Cancer Research, Institute for Medical Research Israel–Canada, Faculty of Medicine, Hebrew University of Jerusalem, Jerusalem, Israel
Fetal Alcohol Spectrum Disorder (FASD) arises from maternal consumption of alcohol during pregnancy affecting 2%–5% of the Western population. In Xenopus laevis studies, we showed that alcohol exposure during early gastrulation reduces retinoic acid (RA) levels at this critical embryonic stage inducing craniofacial malformations associated with Fetal Alcohol Syndrome. A genetic mouse model that induces a transient RA deficiency in the node during gastrulation is described. These mice recapitulate the phenotypes characteristic of prenatal alcohol exposure (PAE) suggesting a molecular etiology for the craniofacial malformations seen in children with FASD. Gsc+/Cyp26A1 mouse embryos have a reduced RA domain and expression in the developing frontonasal prominence region and delayed HoxA1 and HoxB1 expression at E8.5. These embryos also show aberrant neurofilament expression during cranial nerve formation at E10.5 and have significant FASD sentinel-like craniofacial phenotypes at E18.5. Gsc+/Cyp26A1 mice develop severe maxillary malocclusions in adulthood. Phenocopying the PAE-induced developmental malformations with a genetic model inducing RA deficiency during early gastrulation strongly supports the alcohol/vitamin A competition model as a major molecular etiology for the neurodevelopmental defects and craniofacial malformations seen in children with FASD.
1 Introduction
Fetal Alcohol Spectrum Disorder (FASD) is the complex neurodevelopmental disorder caused by maternal consumption of alcohol during pregnancy. FASD is very common, affecting approximately 2%–5% of the population in Western societies (Popova et al., 2016; May et al., 2018). FASD with Sentinel Facial Features (Fetal Alcohol Syndrome, FAS), is the most severe form of FASD with an incidence of 7.7 individuals in 1,000 people worldwide (Lange et al., 2017). There is currently no early and simple diagnosis, treatment or cure for FASD. Alcohol dosage, duration of the exposure, whether acute or chronic, and gestational timing are important determinants in the induction and severity of FASD (Godin et al., 2010a; Anthony et al., 2010). Maternal and offspring genetics and epigenetics (Kaminen-Ahola et al., 2010), maternal nutrition (Keen et al., 2010) and metabolism (Burd et al., 2012), and maternal and offspring stress (Weinberg, 1989; Alberry and Singh, 2016) can contribute to the severity of FASD. Presently, FASD diagnosis includes neurobehavioral examination and maternal alcohol intake history (Cook et al., 2016; Hoyme et al., 2016). The clinical categorization of FASD involves its subdivision based on the presence or absence of Sentinel Facial Features that are unique craniofacial malformations present in cases with more severe brain and neurobehavioral anomalies (Chudley et al., 2005; Cook et al., 2016).
In order to study a complex disorder like FASD, animal models that can replicate many phenotypes of the disorder, preferably with minimal variability, high penetrance and reproducibility are of great importance. Ideally, the experimental model should be amenable to testing a developmental hypothesis explaining the FASD etiology. We have previously shown in a Xenopus laevis FAS model, that a single “binge” exposure to alcohol during early gastrulation is sufficient to induce developmental defects, including Sentinel Facial Features, characteristic of FASD (Yelin et al., 2005; Yelin et al., 2007). Acetaldehyde from ethanol clearance overwhelms the retinaldehyde dehydrogenases (Aldh1a) present in the embryo that would normally oxidize retinaldehyde to retinoic acid (RA) (Kot-Leibovich and Fainsod, 2009; Shabtai et al., 2018). We have shown that ethanol exposure reduces RA levels during the critical developmental stage of early gastrulation (Shabtai et al., 2018), and we propose that this aberration induces the craniofacial malformations associated with FAS. Ethanol clearance and RA biosynthesis can share the same alcohol and aldehyde dehydrogenases (Shabtai et al., 2018). Alcohol exposure promotes a shift to the removal of impending teratogens, ethanol and acetaldehyde, at the expense of RA biosynthesis. Unfortunately, RA is required during early embryogenesis to regulate numerous developmental processes including the gastrulation process itself, head formation, and neural crest cell patterning (Gur and Bendelac-Kapon, 2022; Gur and Edri, 2022).
Retinoic acid—an active metabolite of Vitamin A—is a diffusible lipophilic molecule that regulates over 3% of genes in the mammalian genome through RA Response Elements (RAREs) and many indirect downstream RA targets (Balmer and Blomhoff, 2002; Paschaki et al., 2013). Analysis of Vitamin A-deficient animal models demonstrated that all-trans RA (ATRA) regulates anteroposterior (AP) patterning of the neural plate (Maves and Kimmel, 2005; Sirbu and Duester, 2006). Furthermore, RA is required for migration of neural crest cells from the hindbrain to the frontonasal prominence and pharyngeal arches (Vermot et al., 2003; Rhinn and Dolle, 2012). RA levels are tightly controlled by synthesizing and regulating enzymes like Aldh1a2 (Raldh2), Rdh10 and Dhrs3, and catabolizing cytochrome P450 enzymes like Cyp26A1, Cyp26B1, and Cyp26C1, that modify RA into polar metabolites (4-hydroxy- and 4-oxo-RA), rendering them biologically inactive (Ross and Zolfaghari, 2011; Parihar et al., 2021). Cyp26A1, in particular, metabolizes ATRA, 9-cis-RA, and 13-cis-RA isomers to prevent inappropriate signaling in certain cell populations or embryonic regions like the developing forebrain (Pennimpede et al., 2010).
The “Alcohol/RA competition model” predicts that RA signaling perturbation at critical developmental stages and regions should induce FASD-like phenotypes (Fainsod et al., 2020). Aldh1a2 (Raldh2) deficient mouse embryos show the extreme effects of Vitamin A (RA) deficiency resulting in embryonic lethality (Niederreither et al., 1999; 2000; 2003). These Aldh1a2 deficient embryos exhibit cell death and abnormal craniofacial neural crest contribution to the frontonasal prominence and maxillary processes (Ribes et al., 2006; Halilagic et al., 2007). These processes driven by Aldh1a2 activity during early gastrulation are required for proper neural crest cell differentiation (Niederreither et al., 1999; Mic et al., 2010). RA regulates multiple developmental signaling pathways including; Hox genes, fibroblast growth factor (Fgf8), sonic hedgehog (Shh) and paired box (Pax) genes (Kam et al., 2012; Rhinn and Dolle, 2012; Cunningham et al., 2015). Prenatal alcohol exposure (PAE) mouse models exhibit cranium/skeletal defects and craniofacial malformations similar to RA deficiency mouse model cranial neural crest cell lineages, specifically (Sulik and Johnston, 1983; Niederreither et al., 2000; Dunty et al., 2002; Niederreither et al., 2003; Ribes et al., 2006; Anthony et al., 2010; Lipinski et al., 2012).
Despite all the strong evidence supporting PAE-induced RA-deficiency as a major etiology of the craniofacial malformations and neurodevelopmental deficits seen with FAS, this has never been directly tested in a mammalian model. To precisely induce a transient RA-deficiency in the mammalian node during early gastrulation, we generated a knock-in mouse expressing Cyp26A1 from the Goosecoid (Gsc) gene. We rationalized that if our hypothesis is true, biochemically mimicking the PAE-induced reduction of RA in the organizer (node) domain at this early developmental stage through genetic manipulation should result in many of the well-described PAE phenotypes observed in mice. The Cyp26A1 enzyme is considered the main enzyme involved in degradation of all RA isoforms (all-trans, 9-cis, 13 cis, and 18-cis). We targeted the Cyp26A1 cassette into the Gsc gene locus at the same exon 2 insertion point as the well characterized Gsc knockout mouse (Rivera-pérez et al., 1995) by targeted homologous recombination. Expression of the exogenous Cyp26A1 will now be under the regulation of the endogenous Gsc promoter and regulatory elements and be developmentally expressed in the Node and primitive streak—E6.4-E6.9 in mouse (Blum et al., 1992)—to mimic ethanol-induced RA deficiency at the start of gastrulation. This mouse model is based on the research of co-author Dr. Abraham Fainsod, who shows that RA deficiency at the time of early gastrulation affects downstream RA signaling and phenocopies ethanol (alcohol) exposure in Xenopus (Yelin et al., 2005; 2007; Shabtai et al., 2018; Gur and Bendelac-Kapon, 2022). By placing the Cyp26A1 cDNA under the expression of the Gsc promoter we induce RA degradation in node and primitive streak and expect to see impaired downstream RA signaling and subsequent craniofacial malformations. Here we report Gsc+/Cyp26A1 mice exhibit developmental defects, recapitulating many of the craniofacial malformations characteristic of PAE in mice and FASD in humans. We demonstrate that Gsc+/Cyp26A1 mice—a regulated transient RA deficiency model—is a useful experimental model of early developmental origins of FASD and identifies novel therapeutic strategies for prevention.
2 Materials and methods
2.1 Generation of Gsc+/Cyp26A1 and Gsc+/Cyp26A1(KO) mouse
We targeted a Cyp26A1 cassette into the Gsc gene locus at the same exon 2 insertion point as the well characterized Gsc knockout mouse (Rivera-pérez et al., 1995) by targeted homologous recombination, as previously described (Consortium, 2007). Briefly, the Gsc genomic clone was isolated from a mouse C57BL/6N genomic library and used to create two targeting constructs containing 18 kb of genomic DNA with either a T2A-Cyp26A1-T2A-eGFP-LOX-hBacP-∆TK/NEO-LOX (G12) or an IRES-Cyp26A1-T2A-eGFP-LOX-hBacP-∆TK/NEO-LOX (H4) cassette, inserted by recombineering in a sense orientation using G5-U5 (3.3 kb) and D3-G3 (6.7 kb) Gsc gene homology arms (Figure 1). After electroporation in ES cells and positive/negative selection, eight targeted cell clones for each targeting vector was fully sequence validated for correct recombination, error free junctions and full insertion cassette. PCR genotyping of mice and embryos was performed from ear punch, embryonic yolk sac, or embryonic tail DNA using a forward primer located in exon 1 and two reverse primers, one located in Cyp26A1 and one located downstream in exon 2. This multiplex strategy results in two possible PCR products, one for the mutant allele (∼460bp) and one for the WT allele (∼750 bp): Gsc forward primer, 5′-GGGCTACAACAGCTACTTCTAC-3’; Cyp26a1 reverse primer, 5′-CGTATTTCCTGCGCTTCATC-3’; Gsc reverse primer, 5′-TCTCCTGGAAGAGGTTCTCC-3’. Crispr-Cas9 was used to knock-out a 19bp portion of exon 1–2 junction of the Cyp26A1 cDNA, functionally removing Cyp26A1 mRNA expression under Gsc promoter activation, to produce the Gsc+/Cyp26A1(KO) strain which is functionally a Gsc+/− heterozygous mouse strain.

FIGURE 1. Gsc:Cyp26A1-eGFP gene targeting design and mouse derivation. (A) The Gsc:Cyp26A1-eGFP cassette was targeted to exon 2 of the endogenous Gsc gene by homologous recombination. (B) Cyp26A1 was used to catabolize RA and all RA isoforms in cells expressing Gsc. eGFP is a co-expressed fluorescent marker used to identify these cells in in vitro and in vivo studies. The cassette was constructed with two cyclin T2A peptide-bond-skipping translation elements to translate both the Cyp26A1 and eGFP gene products as individual proteins when the Gsc promoter was activated. Neomycin is a mammalian selection marker for gene targeting, which was later removed in vivo by crossing with a Cre mouse. The G12 strain uses a T2A translational element for Cyp26A1. The H4 strain uses an IRES translational element for Cyp26A1. (C) All targeting steps in ES cells and C57BL/6N mice were sequence validated to ensure correct recombination events and intact functional elements. Gateway recombineering sites (green box) and primers (dark blue arrows), and loxP sites (red triangle) are indicated.
2.2 Embryoid body assay
Gsc+/Cyp26A1 embryonic stem (ES) cell lines G12 and H4 were used for embryoid body (EB) experiments. When cells achieved a confluency of 80% in a 10 cm culture dish, the cells were trypsinized, washed, and underwent a 1 h incubation period without a MEF adherent layer to obtain only ES cells and remove any remaining MEFs from the cell suspension. ES cell suspensions were then collected, and 50,000 cells were placed in each well of an ultra-low density attachment 6 well plate and supplemented with 100 ng/ml of Activin A and 100 ng/ml of Basic Fibroblast Growth Factor (FGF-2), as per EB protocol (Soto-Gutierrez et al., 2007).
2.3 Embryo dissection and fixation
Under isofluorane anesthetic, embryos were harvested from pregnant female dams (either WT female mated with a Gsc+/Cyp26A1 male or a Gsc+/Cyp26A female mated with WT male) at day E8.5, 9.5, 10.5, 11.5 or 18.5 by removal from embryonic sack. Embryonic yolk DNA was used for genotyping of early embryos. For E18.5 embryos, ∼0.5 cm of the embryo’s tail was used for genotyping. E8.5-11.5 embryos were fixed overnight (12–16 h) in 2.5 ml of freshly prepared 4% paraformaldehyde at 4°C (Anthony et al., 2010). E18.5 embryos were each placed in a 15 ml conical tube in 5 ml of 2% paraformaldehyde-2% glutaraldehyde mixture solution for fixation (required for SEM imaging and established in the Hicks lab). Embryos were kept in the fixation mixture solution until SEM imaging, within 1–2 weeks.
2.4 RARE-LacZ embryo expression assay
E8.5, 9.5, 10.5 or 11.5 embryos were harvested from a pregnant female Gsc+/Cyp26A1 dam mated with a male RARE-LacZ mouse (as described above). After dissection, E8.5-11.5 embryos were processed using a β-galactosidase staining protocol (obtained from the Rivera lab; University of New Mexico) (Rossant et al., 1991). Embryos were then stained overnight at 37°C with X-gal, washed 3 consecutive times in sterile PBS and photographed. Embryos were assessed qualitatively for LacZ expression in the frontonasal prominence and for the associated shape of the frontonasal lobe. Gsc+/Cyp26A1 embryos were assessed “normal” if LacZ expression and shape of the headfold region on the frontonasal lobe was indistinguishable from that of WT embryos; “mild pattern/expression change” if small reductions of LacZ expression, small changes in the bi-lobal expression pattern in the frontonasal prominence or a small squaring in the shape of the frontonasal lobe was observed; or “severe pattern/expression change” if major changes or complete loss of LacZ expression or the frontonasal lobe was observed.
2.5 Whole-mount in situ hybridization
Embryos at E8.5 were dissected from the dams, as described, and processed using a whole mount in situ hybridization protocol optimized for mouse embryos (Piette et al., 2008). Digoxigenin labelled RNA probes (sense and anti-sense) were prepared for HoxA1, HoxB1 and Snai1 using a mouse embryo cDNA library and primers containing a T7-promoter sequence to generate PCR products for downstream RNA synthesis using T7-RNA polymerase and a Digoxigenin RNA labelling kit (Piette et al., 2008). RNA probes were column purified and stored at −80°C until used. These were the primers sequences used:
HoxA1-T7-F1 5′-TACGTGTAATACGACTCACTATAGGACCAAGAAGCCTGTCGTTC-3'.
HoxA1-R1 5′-CAGACATCTTAAGACCCGTAAAC-3'.
HoxA1-F2 5′-ACCAAGAAGCCTGTCGTTC-3'.
HoxA1-T7-R2 5′-TACGTGTAATACGACTCACTATAGGCAGACATCTTAAGACCCGTAAAC-3'.
HoxB1-T7-F1 5′-TACGTGTAATACGACTCACTATAGGTGTGACATACTGCCGAAAGG-3'.
HoxB1-R1 5′-GTTGGAAGCCCAGTTACTTAG-3'.
HoxB1-F2 5′-TGTGACATACTGCCGAAAGG-3'.
HoxB1-T7-R2 5′-TACGTGTAATACGACTCACTATAGGTTGGAAGCCCAGTTACTTAG-3'.
Snai1-T7-F1 5′-TACGTGTAATACGACTCACTATAGGAGTTGACTACCGACCTTG-3'.
Snai1-R1 5′-GCCAGACTCTTGGTGCTTG-3'.
Snai1-F2 5′-GGAGTTGACTACCGACCTTG-3'.
Snai1-T7-R2 5′-TACGTGTAATACGACTCACTATAGGCCAGACTCTTGGTGCTTG-3'.
2.6 Whole-mount immunohistochemistry
Embryos at E10.5 were dissected from the dams, as described, and processed using a whole mount immunohistochemistry (IHC) staining protocol (obtained from the H. Marzban lab; University of Manitoba) (Joyner and Wall 2008). IHC was performed using the mouse anti-chicken IgG monoclonal neurofilament antibody (Ab-3A10; Developmental Studies Hybridoma Bank, 1:200) followed by goat anti-mouse IgG with HRP conjugate (AP308P; EMD Millipore, 1:200).
2.7 Scanning Electron Microscopy and µCT
Scanning Electron microscopy (SEM) was performed on a FEI Quanta 650 FEG—a variable pressure field emission scanning electron microscope for high-resolution imaging (SE, BSE) with low-vacuum capabilities. E18.5 embryos were dissected from the dams, as described, fixed in 4% glutaraldehyde and placed horizontally into the environmental scanning electron microscope using a cradle constructed from a 15 ml falcon tube and attached to a stainless-steel stub with double sided carbon tape. E18.5 embryo (SEM) craniofacial measurements were adapted from previous publications (Anthony et al., 2010; Lipinski et al., 2012). SEM parameters: Detection Unit: LFD, Magnification: ×25, HV: 15.00kV, Chamber Pressure: 60Pa, Spot: 5.0, SEM images collected for each embryo were loaded into AMIRA (Thermo Fisher Scientific program), a quantitative measurement program, to select the area of the snout. Linear measurements and snout tracing was performed blinded to genotype, following specific anatomical craniofacial points (including the whisker pad, bigonial line, and mental region (chin). Micro Computed Tomography (µCT) was performed on the SkyScan 1,176 x-ray microtomography system equipped with a large format 11-megapixel x-ray camera. P60-75 mice were used for µCT to gather craniofacial measurements and assess malocclusions. P60-75 mouse craniofacial measurements were adapted from previous publication (Kawakami and Yamamura, 2008). µCT Parameters: Resolution: 9 um and HV: 50 kV.
3 Results
3.1 Generation of Gsc+/Cyp26A1 knock-in and Gsc+/Cyp26A(KO) mice
To reduce the level of RA signaling at the onset of gastrulation, we inserted a Cyp26A1-eGFP expression cassette into exon 2 of the endogenous Gsc gene coding sequence after aa355 (Figure 1A) to drive its expression in the node of mouse embryos at early gastrulation (Rivera-pérez et al., 1995). Although, Gsc-null (homozygous) mice exhibit neonatal lethality due to breathing and suckling defects, Gsc-heterozygotes are phenotypically normal and indistinguishable from their wildtype (WT) littermates (Rivera-pérez et al., 1995; Yamada et al., 1995). Two strains were constructed differing by the translation element used for Cyp26A1 cDNA expression. The Gsc+/Cyp26A1(G12) strain contains a T2A-Cyp26A1-T2A-eGFP cassette and the Gsc+/Cyp26A1(H4) strain contains an IRES-Cyp26A1-T2A-EGFP cassette (Figure 1B). The IRES-Cyp26A1-T2A-eGFP construct is expected to be less efficiently translated (Kim et al., 2011), thereby producing less Cyp26A1 protein and was intended as a phenotype-severity mitigation strategy. Targeted ES clones were sequence validated across all junctions and functional elements and correct targeting of Gsc was confirmed by Southern blot analysis (Figure 1C and data not shown).
Gsc+/Cyp26A1 mice are born fully viable, but at a reduced frequency compared to WT littermates, 0.66:1 and 0.88:1 for the Gsc+/Cyp26A1(G12) and Gsc+/Cyp26A1(H4) strains, respectively, from the expected 1:1 frequency (Figure 1D). We observed increased reabsorption rates at E8.5 in Gsc+/Cyp26A1 pregnancies suggesting that some Gsc+/Cyp26A1 embryos die during early-mid gastrulation; unfortunately, the conceptuses were too degraded to assess their genotype at dissection. Furthermore, the lower frequency of Gsc+/Cyp26A1 (G12) mice at weaning supports the increased resorption rate among Gsc+/Cyp26A1 embryos and the strategy that the T2A-Cyp26A1-T2A-eGFP cassette might produce a more severe phenotype, such as increased embryonic lethality, compared to the H4 strain (Figure 1D). With the range of embryonic lethality for either construct at an acceptable range, we chose to move forward with the Gsc+/Cyp26A1 (G12) allele as it offered a fuller range of phenotypes and in future experiments that might test for enhancement or rescue of phenotypes. Henceforward in the paper Gsc+/Cyp26A1 (G12) will be named Gsc+/Cyp26A1.
In order to confirm that Gsc+/− heterozygocity was not causing the observed Gsc+/Cyp26A1 phenotype, the Cyp26A1-T2A-eGFP cassette had a premature stop signal in Cyp26A1 introduced by CRISPR/Cas9 editing to effectively create Gsc+/− mice. Gsc+/Cyp26A1(KO) mice were generated using the CRISPR/Cas9 system, as described previously (Ran et al., 2013). In brief, Cas9 mRNA and sgRNAs were microinjected into fertilized embryos of Gsc+/Cyp26A1 mice. Deletions in the Cyp26A1-T2A-eGFP cassette allele were confirmed by Sanger sequencing analyses. Gsc+/Cyp26A1(KO) mice were born from a Gsc+/Cyp26A1(KO) x WT cross and used as a control group for phenotypic analyses with Gsc+/Cyp26A1 mice. Gsc+/Cyp26A1(KO) mice are born fully viable, but at the expected Mendelian frequency compared to WT littermates (n = 82) (Table 1). This was expected as Gsc+/Cyp26A1(KO) mice are essentially Gsc+/− heterozygous KO mice which have been shown in literature to have a normal 1:1 Mendelian ratio compared to Gsc+/+ mice (Yamada et al., 1995). Moreover, Gsc+/Cyp26A1(KO) mice do not show craniofacial malformations as seen in the Gsc+/Cyp26A1 model, validating that the observed phenotypes are due to the Cyp26A1-induced RA-deficiency.
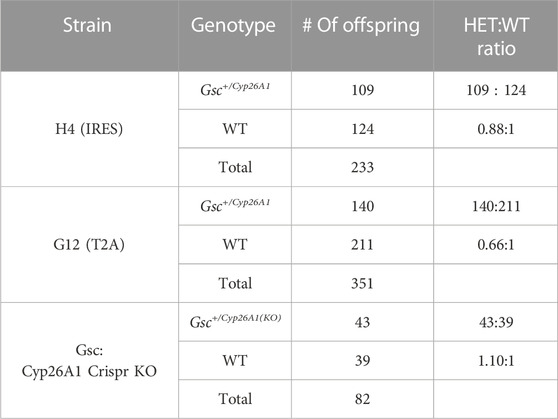
TABLE 1. Gsc+/Cyp26A1 are born at a reduced frequency compared to WT littermates.
3.2 Activin A induces eGFP expression in Gsc+/Cyp26A1 embryoid bodies
To validate that Cyp26A1-eGFP expression is under control of the Gsc promoter we induced the differentiation of Gsc+/Cyp26A1 ES cells by adding Activin A and FGF-2 in an in-vitro embryoid body (EB) assay, and looked for GFP expression as a marker of the Gsc gene transcription. EBs treated with Activin A initiate definitive endoderm induction, as it is in definitive endoderm where Gsc is expressed at the start of gastrulation (Blum et al., 1992; Soto-Gutiérrez et al., 2007). Gsc+/Cyp26A1 EBs treated with Activin A and FGF-2 clearly express eGFP, compared to control EBs (Figure 2A). To verify the induction of the definitive endoderm was taking place in these Activin A treated Gsc+/Cyp26A1 EBs, we confirmed the expression of Sox17 in the EBs as a marker for definitive endoderm (Figure 2B; Iwamuro et al., 2010). These results demonstrate that Cyp26A1-eGFP is expressed in EBs under conditions known to induce the Gsc promoter.
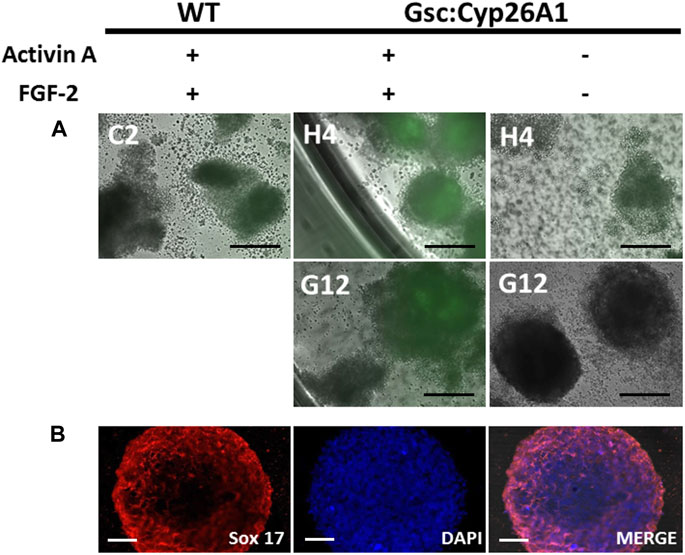
FIGURE 2. Gsc:Cyp26A1-eGFP is expressed in embryoid bodies induced with activin A and fibroblast growth factor (FGF). (A) Embryoid body (EB) formation was used to generate definitive endoderm germ cells in vitro. Activin A and FGF-2 were used to induce Gsc gene expression, including Cyp26A1-eGFP expression from the targeted Gsc allele. Results clearly demonstrate Gsc:Cyp26A1-eGFP is inducible under these conditions by eGFP expression in Activin A treated cells (middle panels), but not in untreated or EBs generated from wild-type ES cells (left and right panels, respectively). ES cell clones used to generate EBs are identified (C2, H4, G12). (B) Sox17 immunocytochemistry was performed on embryoid bodies to confirm definitive endoderm cell induction (Sox 17). Nuclear staining (DAPI) and overlay (MERGE) are shown. Scale bars: 200 um (A); 40 um (B).
3.3 Gsc+/Cyp26A1embryos exhibit headfold and other developmental malformations
To functionally validate our Gsc:Cyp26A1-eGFP cassette in vivo, Gsc+/Cyp26A1 mice were crossed with the RA reporter mice (RARE-hsp68-lacZ) (Rossant et al., 1991). At E8.5, Gsc+/Cyp26A1/RARE-LacZ embryos exhibit a marked reduction in RARE-LacZ expression in the frontonasal prominence, compared to wildtype embryos (Figures 3A–I). E8.5 Gsc+/Cyp26A1 embryos exhibit malformations in the developing frontonasal prominence and show bilateral lobe separation compared to WT embryos (Figures 3A–I). Variation in the RARE-LacZ reporter expression in the frontonasal prominence was observed in Gsc+/Cyp26A1 embryos and associated shape of the frontonasal lobe (Figure 3G’-I′-B, black arrowheads). Approximately 30% of Gsc+/Cyp26A1 embryos showed a mild expression or change in RARE-LacZ expression in the headfold region and squaring in the shape of the frontonasal prominence lobes was observed, while, 16% of Gsc+/Cyp26A1 embryos showed a severe expression or change—and in some cases a near complete loss - of RARE-LacZ expression in the headfold region and loss of the frontonasal prominence (Figures 3C, F, I; Table 2). The embryos with severely perturbed RARE-LacZ expression may represent the embryos that are eventually reabsorbed and explain the reduced Mendelian ratios of ∼35% and 12% loss observed at weaning in the G12 and H4 Gsc+/Cyp26A1 lines, respectively (Figure 1D). In addition, E8.5 Gsc+/Cyp26A1 embryos have varying degrees of severity of the head fold region and appear developmentally delayed by up to 0.5 days (E8.0–8.5), as evidenced by a smaller size, failure to turn, and a reduced number of somites compared to intralitter controls (Figures 3A–I, respectively).
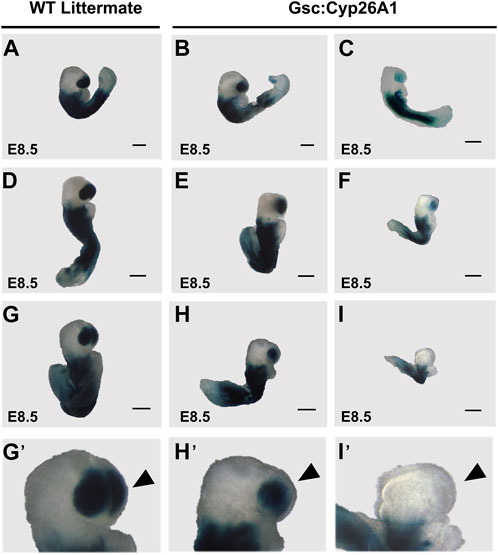
FIGURE 3. Gsc+/Cyp26A1 E8.5 embryos have a reduction in RA activity/RARE-LacZ expression. (A–I) Gsc+/Cyp26A1 mice were crossed with RARE-LacZ+/+mice containing a transgene reporter for intracellular RA levels. Each row shows representative embryos from the same litter with WT, and Gsc+/Cyp26A1 embryos with mild expression change or severe pattern and expression changes. Gsc+/Cyp26A1/RARE-Lac-Z+/− embryos demonstrate a reduction in retinoic acid (RA) activity/RARE-LacZ expression (B, C, E, F, H, I lighter blue X-gal staining) in the frontonasal prominence region. WT embryos (Gsc+/+/RARE-Lac-Z+/−) develop proper frontonasal prominence formation and show normal RA levels (A, D, G). These data show Gsc+/Cyp26A1 embryos have reduced retinoic acid activity, specifically a change in RARE-LacZ expression in the frontonasal prominence. Gsc+/Cyp26A1/RARE-Lac-Z+/− embryos also show aberrations in RA dependent embryonic patterning, including changes in morphology of the frontonasal prominence region (H′, I′), compared to WT siblings (G′, neural crest cell derived lineage; black arrowhead). Severe malformations and changes in RARE-LacZ expression in the frontonasal prominence region occur in approximately 16% of Gsc+/Cyp26A1/RARE-Lac-Z+/− (C, F, I; Table 2). n = 10 litters, n = 30 Gsc+/Cyp26A1/RARE-Lac-Z+/− embryos and n = 48 WT/RARE-Lac-Z+/− embryos. Scale bars: 200 um (A–I).
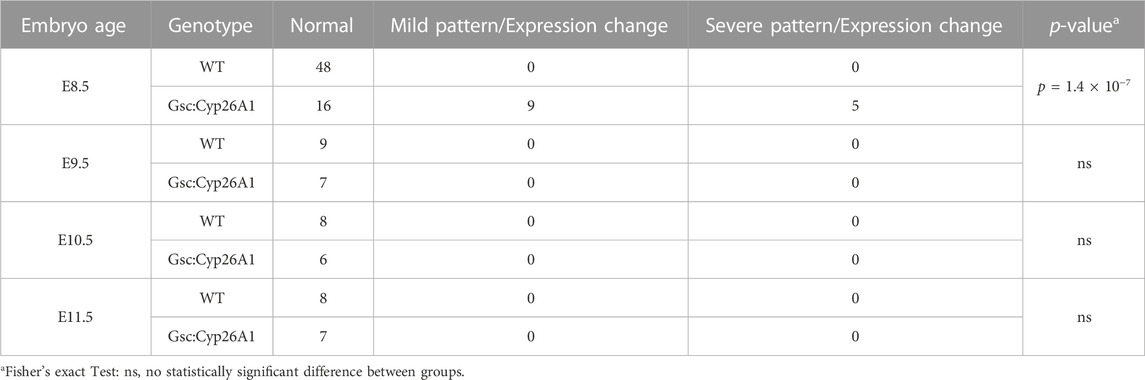
TABLE 2. Gsc+/Cyp26A1 E8.5 embryos show changes in RARE-LacZ expression, specifically in the developing frontonasal prominence.
The surviving Gsc+/Cyp26A1 embryos at E9.5-11.5 do not show overt signs of developmental malformations (Figures 4A–F). E9.5 Gsc+/Cyp26A1 embryos have a smaller head morphology compared to WT embryos (Figures 4A, B). E9.5 Gsc+/Cyp26A1 embryos have no distinct changes in RARE-LacZ patterning, compared to WT (Figures 4A, B). E10.5 and E11.5 Gsc+/Cyp26A1 embryos do not show distinct changes in embryonic patterning, gross morphology and intensity of RARE-LacZ expression in the frontonasal prominence, anterior somites, or developing trunk when compared to WT (Figures 4C–F). The RARE-lacZ pattern is normal, and comparable between Gsc+/Cyp26A1 and WT embryos at this level of resolution, suggesting that RA signaling has recovered and is normal by E9.5 (Table 2), but it does not rule out downstream or later effects and outcomes resulting from the earlier RA deficiency.
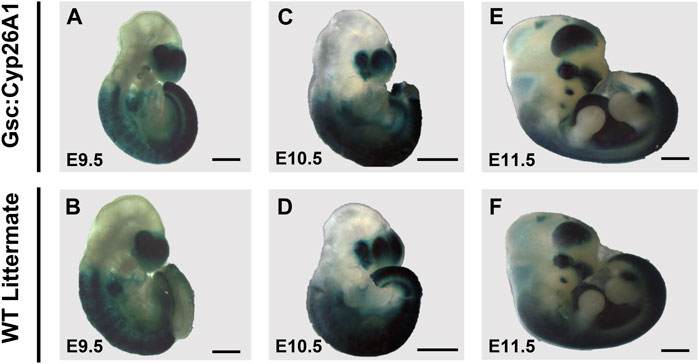
FIGURE 4. RARE-LacZ expression returns to normal in E9.5 Gsc+/Cyp26A1 embryos. (A, B) E9.5 Gsc+/Cyp26A1 embryos have a smaller head morphology compared to WT embryos, but have no distinct changes in RARE-LacZ patterning compared to WT. E10.5 and E11.5 (E) Gsc+/Cyp26A1 embryos do not show distinct changes in embryonic patterning, gross morphology or intensity of RARE-LacZ expression in the frontonasal prominence, anterior somites, or developing trunk, as WT embryos (D, F, respectively). E9.5 n = 16 embryos, E10.5 n = 14 embryos, E11.5 n = 15 embryos, n = 2 (litters) per timepoint. Scale Bars: 500um (A–D), 1 mm (E, F).
E8.5 Gsc+/Cyp26A1 embryos were further investigated for aberrant RA signaling, focusing on changes in the expression of well characterized downstream RA targets, Hox genes (Figures 5A–D). It has been previously established that HoxA1 and HoxB1 are regulated by RA through 5′ and 3’ RA response elements found in the vicinity of these genes (Ogura and Evans, 1995a; Ogura and Evans, 1995b; Dupé et al., 1997). E8.5 WT embryos exhibited normal HoxA1 expression caudally from rhombomere 2 (r2) to the somitic mesoderm in the tail bud region (Figure 5A). Gsc+/Cyp26A1 embryos exhibited increased HoxA1 expression in the more posterior expression domain (Figure 5B). E8.5 Gsc+/Cyp26A1 embryos exhibited increased HoxB1 expression in r4 and expanded uniform HoxB1 expression in the somitic mesoderm caudal to r4 and into the tail bud region (Figure 5D). In WT littermates, we observe HoxB1 expression restricted to r4, without expression extending caudally from r4 (Figure 5C). The second normal expression domain in the tail bud region was also detected (Figure 5C). These observations suggest that Hox mediated hindbrain and somite development in Gsc+/Cyp26A1 embryos is aberrant and consistent with a delay induced by RA deficiency at early gastrulation due to the Gsc induction of Cyp26A1. In E9.5 Gsc+/Cyp26A1 and WT littermate embryos the Snai1 expression pattern is similar (E, F), but there remains regions in the maxillary process and branchial arch 1 & 2 regions with increased Snai1 expression in Gsc+/Cyp26A1 embryos (Panel G, H, white arrows).
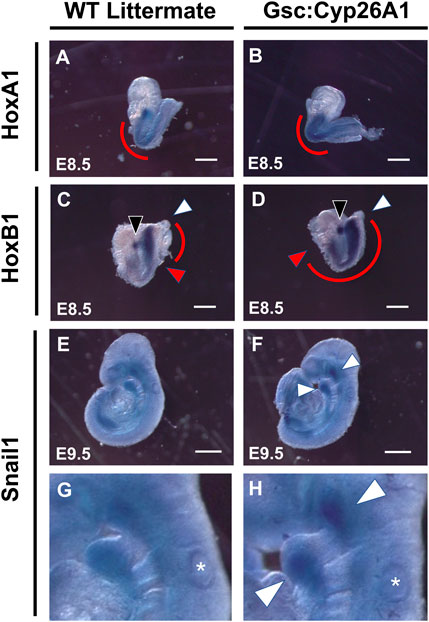
FIGURE 5. Gsc+/Cyp26A1 embryos have delayed HoxA1 and HoxB1 transcriptional expression. In-situ hybridization studies show that E8.5 Gsc+/Cyp26A1 embryos have increased HoxA1 expression in the somatic (caudal to the hindbrain) and the trunk regions (B), (red curve), compared to WT littermates (A), (red curve). (D) E8.5 Gsc+/Cyp26A1 embryos have increased HoxB1 expression in rhombomere 4 (open white arrowhead) and increased expression and expansion in the somatic and trunk regions of the embryo (red curve, red arrowhead indicates rostral end of expression profile, white arrowhead indicates caudal end of expression profile), compared to WT littermates (C). Snai1 (neural crest cell lineage marker) expression pattern is similar between E9.5 Gsc+/Cyp26A1 and WT littermate embryos (E, F); but there remains regions (maxillary and branchial arch 1 & 2 regions, white arrows) with increased Snai1 expression in Gsc+/Cyp26A1 embryos (enlarged in G, H; respectively). * = otic vesicle. HoxA1 n = 15 embryos, HoxB1 n = 14 embryos, Snail1 n = 9 embryos, n = 2 (litters) per timepoint. Scale Bars: 200 um (A–D), 500 um (E–F).
Cranial neural crest cells (CNCC) delaminate from rhombomeres during early neurulation (E 8.5) and migrate to colonize the branchial arches. Perturbation of RA levels during gastrulation can cause malformations in the developing cranial nerves (Niederreither et al., 2003), and similar malformations are also observed in alcohol exposure during gastrulation in experimental models (Dunty et al., 2002). For these reasons, we analyzed the formation of the cranial nerves in E9.5 Gsc+/Cyp26A1 embryos using the Neurofilament-200 (NF-200) protein as a marker. We observed aberrations in the Trigeminal nerve (cranial nerve V)—affecting 37.5% of Gsc+/Cyp26A1 embryos—whereby the ophthalmic, maxillary, and mandibular branches do not innervate the developing optic vesicle, frontonasal prominence, and 1st branchial arch, respectively (Figures 6A–D; black arrowheads and asterisks; Table 3). Additional malformations involved the development of cranial nerves VII (Facial) and VIII (Vestibulocochlear)—affecting 12.5% of Gsc+/Cyp26A1 embryos—which fail to innervate the 2nd branchial arch and the otic vesicle, respectively (Figures 6C, D; Table 3). Gsc+/Cyp26A1 embryos also exhibit a defect in cranial nerve IX (Glossopharyngeal)—affecting 87.5% of Gsc+/Cyp26A1 embryos—specifically the loss of the neural crest-derived dorsal root of this nerve, resulting in a fusion of the placode derived Glossopharyngeal cranial nerve to the Vagus (X) cranial nerve (Figures 6B, D; red arrows; Table 3). This is not the case in WT embryos which show the normal neural crest and placode derived neurofilaments of cranial nerve IX (Figures 6A, C; red arrowheads; Table 3). Beyond the connectivity defects described, E10.5 Gsc+/Cyp26A1 embryos show an overall decrease in neurofilament expression level in the cranial nerves resulting in thinner dorsal root fibers innervating the frontonasal prominence and branchial arch regions in cranial nerves V-X when compared to controls (Figures 6B, D). We also observed asymmetric abnormalities in cranial nerve patterning in Gsc+/Cyp26A1 E10.5 embryos when comparing the right and left sides of the same embryo (data not shown). Furthermore Snail (Snai1), a marker of migrating NCCs, was found to be expressed in the 1st, 2nd, and 3rd branchial arches as expected of both WT and Gsc+/Cyp26A1 E9.5 embryos. However, Snai1 expression was visibly increased in Gsc+/Cyp26A1 embryo branchial arches 1 and 2 compared to WT embryos (Figures 5G, H, white arrowheads). Taken together, these data indicate that the cranial NCC lineages and subsequently the developing forebrain are abnormal in Gsc+/Cyp26A1 embryos, and reminiscent of RA responsive element gene knockout mouse models (Lohnes et al., 1994; Ghyselinck et al., 1997).
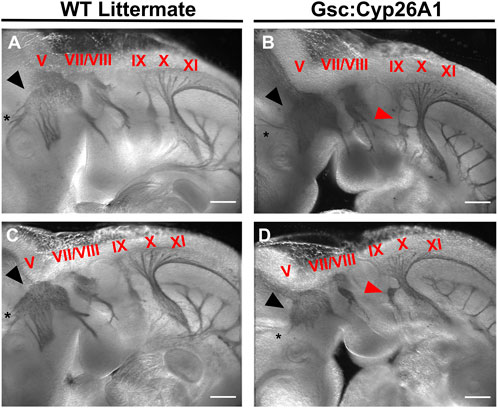
FIGURE 6. Gsc+/Cyp26A1 E10.5 embryos have aberrant neural crest cell migration in the developing cranial nerves. Gsc+/Cyp26A1 E10.5 embryos show a dysregulated cranial nerve patterning in the developing face and branchial arches derived from the neural crest cell lineage (B, D). Gsc+/Cyp26A1 E10.5 embryos have decreased neural crest cell migration in cranial nerves V (black arrows), VII, VIII, X, XI, and specifically IX (red arrows). WT Littermates demonstrate proper cranial nerve patterning in the developing face and branchial arches; and the cranial nerves are migrating as expected (A, C); cranial nerves are identified by red Roman numerals). Notice that cranial nerve V does not innervate the optic vesicle in either of the Gsc+/Cyp26A1 embryos, but correctly innervates the optic vesicle (black asterisk) in WT littermate embryos. These results demonstrate that the Gsc+/Cyp26A1 model results in aberrant neural crest cell proliferation and migration. * = optic vesicle. Immunohistochemistry marker: Neurofilament-200 (NF-200) protein. Scale Bars: 500 um (A–D).
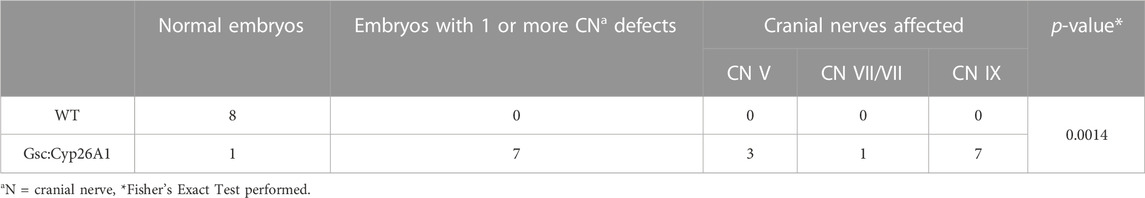
TABLE 3. Gsc+/Cyp26A1 E10.5 Embryos show Increased Incidence of Cranial Nerve Defects.
3.4 Gsc+/Cyp26A1 E18.5 embryos have FASD sentinel-like craniofacial phenotypes
A specific set of craniofacial malformations, termed Sentinel Facial Features, are unique to severe forms of FASD, FAS, and they are used diagnostically (Cook et al., 2016). Individuals with FAS, those with noticeable craniofacial malformations, are found in 0.7% of the population, while individuals in the FASD spectrum make up 2%–5% of the population (May et al., 2009). We were curious if we would observe similar craniofacial malformations in our Gsc+/Cyp26A1 model. We chose to use a series of landmark facial features to measure Philtrum-Lip Ratio, Bigonial Line, Whisker Pad, Frontal Snout Area, Midfacial, Lower Facial, Neck to Edge of Mandible, and Side Snout Area to determine whether our Gsc+/Cyp26A1 embryos recapitulate reported PAE or other related craniofacial developmental phenotypes (Figure 7, panel A and B). We assessed 7 litters (32 Gsc+/Cyp26A1 + 37 WT embryos) and found a variable penetrance in craniofacial outcomes (Table 4). To quantify the craniofacial phenotype, E18.5 Gsc+/Cyp26A1 embryos were imaged using Scanning Electron Microscopy (SEM) analysis to measure the length of the bigonial line, the length of the philtrum-lip ratio, the length of the whisker pad, and the overall area of the front snout (Figures 8C–F; Table 4). The bigonial line is the horizontal line dividing the maxillary and mandibular components of the snout, while the whisker pad encompasses the maxillary portion of the snout, the nose and the philtrum (Figures 7A, D). E18.5 Gsc+/Cyp26A1 embryos have a narrower bigonial line and whisker pad length (Figures 7D, F; Table 4; Panel D red and blue dashed lines, respectively). These craniofacial changes are similar to the malformations described in PAE models (Godin et al., 2010a; Anthony et al., 2010; Lipinski et al., 2012). Gsc+/Cyp26A1 embryos had a significantly larger philtrum-lip ratio compared to control embryos (Figures 7C, E). Tracing of the snouts was performed following specific anatomical craniofacial points (including the whisker pad, bigonial line, and mental region (chin) to accurately trace the snout as seen in the orange overlay in Figure 7D. Gsc+/Cyp26A1 embryos had a smaller frontal snout area compared to control embryos (Figures 7D, F). Both the philtrum-lip ratio and frontal snout area are new measurements, developed during this study to better assess the philtrum, maxillary and mandibular processes, as this is where the FASD sentinel facial features develop in humans. The mean for each of the 4 craniofacial measurements for both Gsc+/Cyp26A1 and WT embryos in each individual litter are shown along with p-values for each of the intra-litter measurements (Table 4). Four craniofacial measurements: philtrum-lip ratio, bigonial line, whisker pad length and frontal snout area were found to exhibit significant (p < 0.05) or trending (p < 0.10) differences in litters analyzed. To be analyzed, a litter needed to have at least three embryos of each genotype. Larger litter sizes of 9–10 embryos were significant or trending in up to all four measurements using the t-test (e.g., litters 38 and 41, Table 4; Figure 7). Litters sizes of 7-8 embryos typically had one measurement significant or trending. It is not clear whether this drop reflects the limits of statistical analysis or the loss of more seriously impacted Gsc+/Cyp26A1 embryos. Regardless, the variation in sentinel craniofacial features seen in Gsc+/Cyp26A1 embryos does appear to model the spectrum observed in children with FAS, those with sentinel facial features (craniofacial malformations). Four other measurements: midfacial depth, lower-facial depth, neck to edge of mandible, and side snout area were trending in certain litters, but none of the litters were statistically significant. We assessed other craniofacial measurements that may be associated with RA deficiency or PAE but found no additional significant or trending differences in the craniofacial region between Gsc+/Cyp26A1 and WT embryos. Taken together, we believe these 4 features demonstrate the effects of our transient RA deficiency model and phenocopy PAE craniofacial malformations in mice.
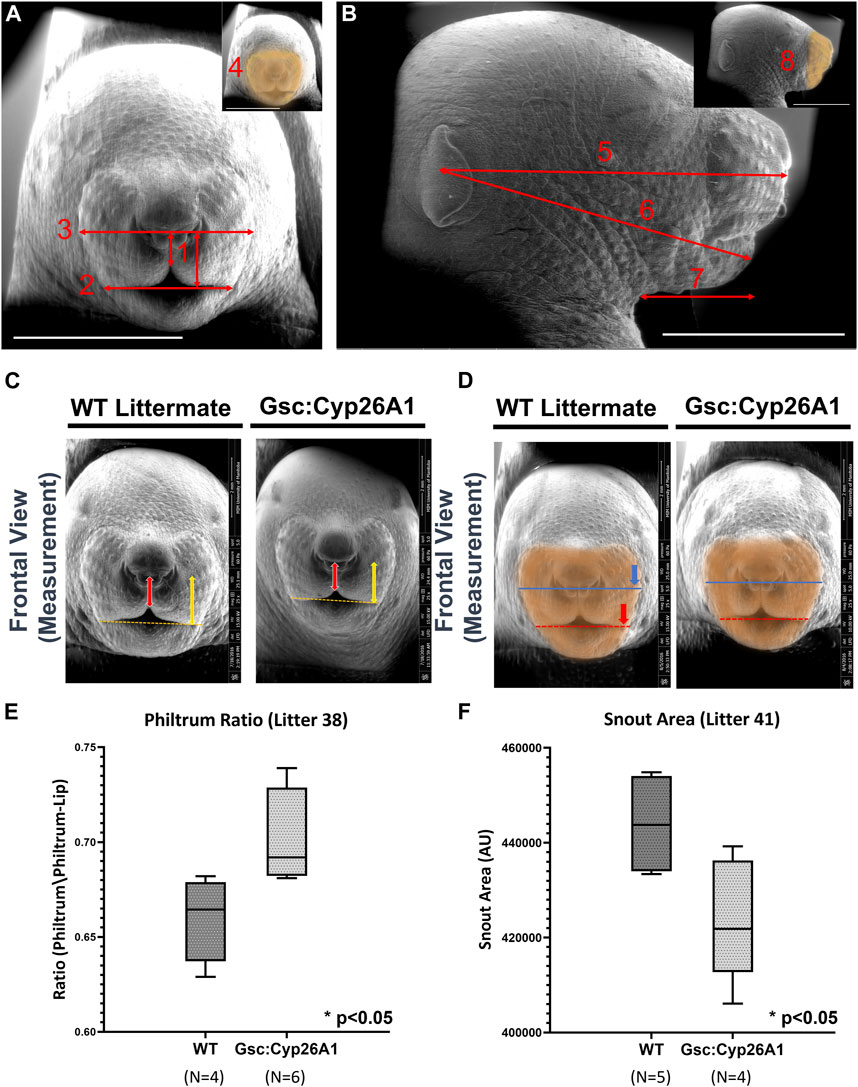
FIGURE 7. Gsc+/Cyp26A1 E18.5 embryos have Fetal Alcohol Syndrome (FAS)-like craniofacial malformations. (A) Landmark craniofacial measurements used for E18.5 embryo facial analysis. (Adapted from Anthony et al., 2010; Lipinski et al., 2012). E18.5 embryo SEM frontal pictures were used for Philtrum-Lip Ratio (1), Bigonial Line (2), Whisker Pad (3), and Snout Area (4) quantitative measurements. (B) E18.5 embryo SEM side-view pictures were used for Midfacial (5), Lower facial (6), Neck to Edge of Mandible (7), and Side Snout Area (8) quantitative measurements. Inset indicates the snout area (orange highlight). (C, E) Gsc+/Cyp26A1 E18.5 embryos have a less defined maxillary process resulting in a larger philtrum/philtrum-lip ratio compared to WT littermates (red arrow length/yellow arrow length). For comparison, WT littermates E18.5 embryos have a more defined, normal protruding maxillary formation resulting in a smaller philtrum/philtrum lip ratio. (D, F) Gsc+/Cyp26A1 E18.5 embryos have a narrower bigonial line width (red dashed line, asterisk marks the comparative length of Gsc+/Cyp26A1 bigonial line width on a WT sibling). (D) Whisker pad length measurement can be seen by the dark blue line, asterisk marks the comparative length of Gsc+/Cyp26A1 whisker pad length on a WT sibling (Table 4). (B, F) The orange overlay defines a smaller snout area in Gsc+/Cyp26A1 E18.5 embryos compared to WT sibling that has a larger snout area (Panel D, Table 4). Representative analysis of the most significant measurements are shown and box plots show data from litter 38 and 41, see Table 4 for litter measurement details. Scale bar = 4 mm. A t-test was used to determine statistical significance. * = p < 0.05.
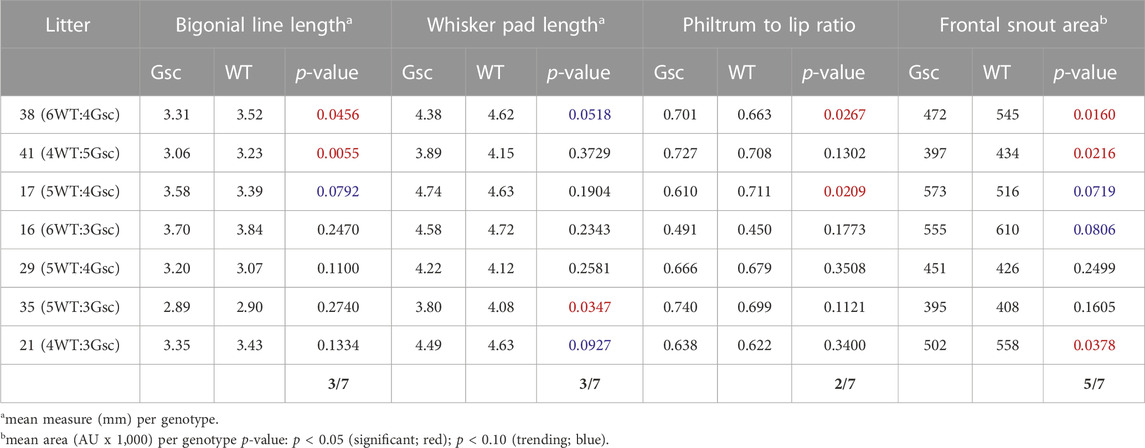
TABLE 4. Craniofacial measurements in Gsc+/Cyp26A1E18.5 Embryo Litters Compared to WT Littermate Embryos.
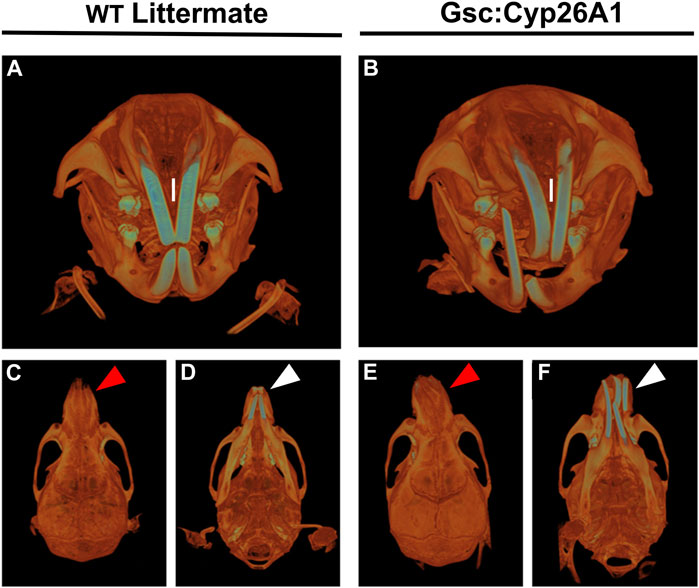
FIGURE 8. Gsc+/Cyp26A1 mice have severe craniofacial malocclusions. Gsc+/Cyp26A1 mice (B) demonstrate a curvature in the pre-maxillary process when compared to WT littermates (A). Gsc+/Cyp26A1 mice (E), red arrow; (F), white arrow do not have a curvature of the mandibular component, the mandible is straight when compared to the skull as seen in WT littermates (C), red arrow; (D), white arrow. The curvature to the maxillary component can be seen to impact the natural grinding of the incisors, ultimately causing a severe malocclusion in Gsc+/Cyp26A1 mice (B, I = maxillary incisors); the incisors grind normally in WT littermate mice (A, I = maxillary incisors).
3.5 Gsc+/Cyp26A1 mice develop craniofacial maxillary malocclusions
Gsc+/Cyp26A1 mice develop overtly normal through adulthood, with one notable exception: between days 60 and 75 postnatally (PN60-75) they developed an irregular alignment of the teeth known as severe craniofacial maxillary malocclusions, caused by uneven teeth wear or a misalignment of the jaw (Figures 8B, E, F) (Diagnosis | Severe prognathic malocclusion, 2007). We observed craniofacial malocclusions in 11 of 88 Gsc+/Cyp26A1 mice, a significant result when compared to WT littermates (12.5% frequency; p < 0.001; Figures 9B, e, F; Table 5). Malocclusions in WT C57BL/6N mice are rare with a spontaneous incidence of 0.04% in the Jax Laboratory colony and slightly higher in our own C57Bl/6N breeding colony at 0.32% (p < 0.001; C57BL/6N In-House colony, University of Manitoba; Table 5). To further characterize the jaw, denture, and craniofacial phenotype of the Gsc+/Cyp26A1 mice and WT littermates were performed by µCT-based analysis and measurements. Gsc+/Cyp26A1 mice have pre-maxillary twisting resulting in misaligning of the maxillary and mandibular incisors, specifically an anterior transverse crossbite (Tsukamoto et al., 2010) (Figure 8). Pre-maxillary malocclusions occurred at equal rates to the left or right of cranium center and the malocclusions were never mandibular in origin. In contrast, no WT littermate had craniofacial malocclusions or pre-maxillary twisting (Figures 8A, C, D; Table 5). We were able to assess wild-type C57BL/6N In-House colony mice that developed spontaneous malocclusions at 4–10 weeks (Table 5). Interestingly, all were found to have malocclusions resulting from mandibular twisting, not pre-maxillary twisting as found in Gsc+/Cyp26A1 mice.
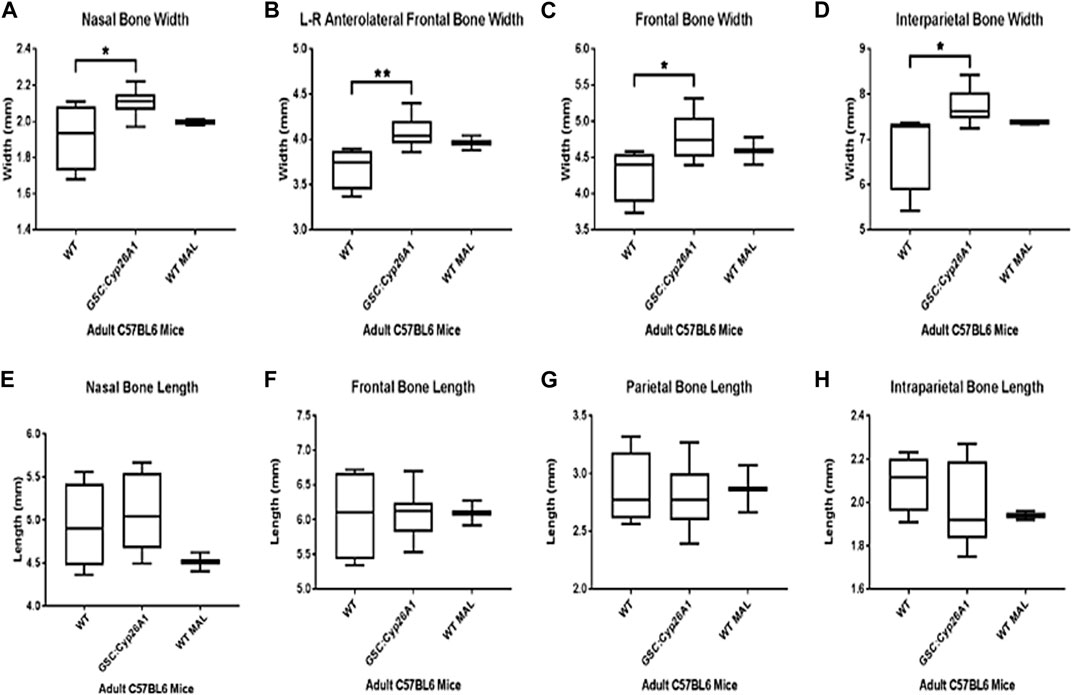
FIGURE 9. Gsc+/Cyp26A1 mice have a wider cranium compared to WT littermates. P60 Gsc+/Cyp26A1 mice show a statistically significant wider cranium in all 4 major skull region width measurements: Nasal Bone (A), L-R Anterolateral Frontal Bone (B), Frontal Bone (C), and Intraparietal Bone Widths (D). Gsc+/Cyp26A1 mice do not demonstrate a statistically significant difference in the 4 major skull region length measurements: Nasal Bone (E), Frontal Bone (F), Parietal Bone (G) and Intraparietal Bone lengths (H). Gsc+/Cyp26A1 mice, n = 10; C57BL/6N mice, n = 5; WT with spontaneous malocclusions, n = 3. A t-test was used to determine statistical significance. *p < 0.05, **p < 0.01.
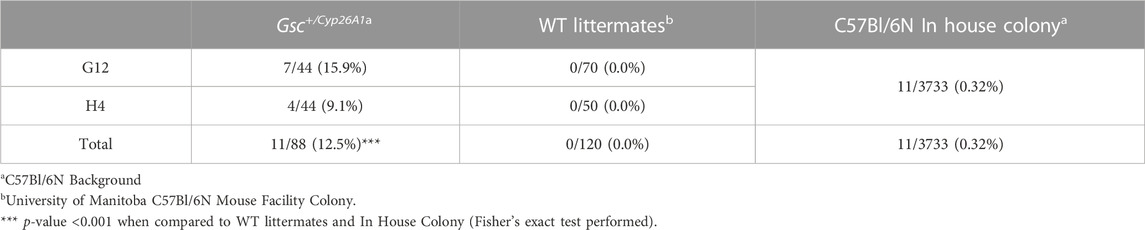
TABLE 5. Frequency of severe craniofacial malocclusions in Gsc+/Cyp26A1 mice.
µCT imaging allowed us to further characterize the craniofacial malformations in Gsc+/Cyp26A1 mice. The Gsc+/Cyp26A1 mice exhibited a significantly wider L-R anterolateral bone, overall width of the cranium, the nasal bone, the frontal bone, and the interparietal bone compared to WT littermates (p < 0.05) and were similar in overall width measurements to C57BL/6N In-House colony malocclusion mice (Figures 9A–D, respectively). Interestingly, Gsc+/Cyp26A1 mice did not have a significant increase in the overall length of the cranium, length of the nasal bone, frontal bone, parietal bone, and interparietal bone and were similar to WT littermate mice or C57BL/6N In-House colony malocclusion mice (Figures 9E–H, respectively). We extended the initial cranium µCT width and length measurements with 11 maxillary and mandible length measurements, using the same three cohorts of mice (Supplementary Figure S1). Of those 11 length measurements, Gsc+/Cyp26A1 mice have a significantly larger upper incisor height (p < 0.001), as expected compared to WT littermate mice, due to the pre-maxillary twisting causing malocclusion (Supplementary Figure S1). The maxillary and mandible length measurements suggests that the Gsc+/Cyp26A1 mice are indeed in Class I malocclusion, causing an anterior transverse crossbite, as the maxillary and mandibular lengths were similar between all three cohorts of mice. Compared to a Class II malocclusion scenario “overbite”, where the maxilla is longer in length than the mandible, or Class III malocclusion scenario “underbite”, where the mandible is longer in length than the mandible, in either of those situations the incisors would over grow and not be gradually worn down and can impinge the soft tissues of the oral cavity and snout. In some cases of class III malocclusion, a cross-bite can occur, but the mandible would have to be longer in length than the maxilla which is not the case in Gsc+/Cyp26A1 mice (Supplementary Figure S1).
4 Discussion
In the present study we took advantage of our biochemical and developmental understanding of FASD to establish a genetic mouse model that recapitulates many of the developmental malformations characteristic of prenatal ethanol exposure during embryogenesis. Using our Xenopus laevis FAS model, we demonstrated that biochemically, ethanol competes for the retinaldehyde dehydrogenase (Aldh1a2) enzymatic activity, causing a reduction in RA biosynthesis (Kot-Leibovich and Fainsod, 2009; Shabtai et al., 2018). This reduction in RA signaling affects the expression of retinoic acid downstream targets during gastrulation, and results in a high incidence of developmental malformations such as microcephaly, reduced axial length, and craniofacial defects in embryos exposed to ethanol (Yelin et al., 2005; 2007; Shabtai et al., 2018; Shukrun et al., 2019; Gur and Bendelac-Kapon, 2022). These malformations are characteristic of other experimental model embryos exposed to ethanol and of individuals affected by FASD (Petrelli et al., 2017; Shabtai and Fainsod, 2018; Petrelli et al., 2019). RA deficiency in mammalian embryos causes developmental malformations impacting all germ layer lineages including: craniofacial and brain malformations, limb deformities, organ defects, and neural crest cell migration and proliferation anomalies, among others (Sulik et al., 1988; Niederreither et al., 2003; Cunningham et al., 2011; Lee et al., 2012). In this study, we describe a genetic mouse model that induces a transient RA deficiency in the node during gastrulation which recapitulates the PAE-induced phenotypes in mice and suggests a molecular etiology for the craniofacial malformations seen in children with FASD.
4.1 Gsc+/Cyp26A1 induces an early developmental RA deficiency
Gsc+/Cyp26A1 mice were designed to create a genetic model that would induce a transient, spatially and temporally regulated RA deficiency during early gastrulation in the node, mimicking the biochemical effect of acute PAE at E6.5—E7. We observed frontonasal prominence and head fold malformations as early as E7.5. The frontonasal prominence region is important for proper craniofacial morphogenesis (Ribes et al., 2006) and shares some of the same signaling pathways needed for proper forebrain development, all of which require tightly regulated RA signaling (Dupé and Pellerin, 2009; Kam et al., 2012; Rhinn and Dolle, 2012). RA is produced in the frontonasal prominence region by Aldh1a2 and Aldh1a3, and loss of either enzyme results in craniofacial malformations (Ribes et al., 2006) or loss of RA signaling in the frontonasal prominence like we report here in the Gsc+/Cyp26A1 mice and others in Aldh1a2−/− mutant mice (Niederreither et al., 2003; Ribes et al., 2006). Changes in RARE-LacZ expression have not been visualized in the frontonasal prominence of PAE embryos, likely a complication of the low penetrance of FASD-like phenotypes in murine models of alcohol exposure. Nevertheless, malformations of the frontonasal prominence have been extensively characterized (Sulik et al., 1981; Sulik and Johnston, 1983), as recapitulated in our Gsc+/Cyp26A1 mouse model.
Gsc+/Cyp26A1 mice have an increased incidence of early embryonic lethality, a phenotype shared in both RA deficiency and PAE mouse models. A severe loss of early RA biosynthesis in the form of Aldh1a2 knockout results in early embryonic lethality (Niederreither et al., 1999; Niederreither et al., 2003). Similarly, embryonic lethality has been observed in Rdh10, double RXR or RAR α/β, α/γ, and β/γ mutants (Lohnes et al., 1994; Mark et al., 2006), stillbirths in RXRα (Mascrez et al., 2009), and neonatal lethality in Aldh1a3 mutant mice (Dupé et al., 2003; Molotkova et al., 2007; Sandell et al., 2007). PAE in mice can result in embryonic lethality (Sulik et al., 1981; Sulik and Johnston, 1983), while PAE in humans is also associated with an increased risk of miscarriages, stillbirths, and sudden infant death syndrome (Bailey and Sokol, 2011; Andersen et al., 2012). Incidence of embryonic lethality (miscarriage) and stillbirths in FASD and in RA deficiency animal models further support a common signaling etiology between these disorders.
The Gsc+/Cyp26A1 embryos are developmentally delayed when compared to WT embryos within the same litter as determined by the RARE-lacZ expression profile in the frontonasal prominence. This delayed RA signaling pattern phenotype has been described in Aldh1a2−/− and Aldh1a3−/− mutant mice (Ribes et al., 2006; Halilagic et al., 2007; Molotkova et al., 2007). The RA signaling developmental delay in Gsc+/Cyp26A1 embryos was further supported by analyzing the HoxA1 and HoxB1 expression patterns. HoxA1 is more intense and more rostral, while by E8.5, caudal to the rhombencephalon it should be gradually declining from r6 (Makki and Capecchi, 2011). In support, Gsc+/Cyp26A1 embryos exhibited increased HoxB1 expression in r4, indicative of a later onset of HoxA1 expression due to earlier perturbation of RA. By this stage, HoxB1 expression should have regressed to the body region, suggesting an RA deficiency mediated delay in HoxA1 and B1 expression (Deschamps and van Nes, 2005). RA has been shown to be a required signal for proper Hox gene regulation and aberrant RA signaling impairs hindbrain and mesodermal patterning, (Lohnes et al., 1994; Niederreither et al., 1999; Niederreither et al., 2000; Halilagic et al., 2007; Rhinn and Dolle, 2012). Interestingly, HoxA1 is required to activate Aldh1a2 and subsequently HoxB1 expression (Vitobello et al., 2011). Therefore, we could hypothesize that regulated ectopic expression of Cyp26A1—leading to early gastrula RA deficiency in Gsc+/Cyp26A1 mice—causes a delayed or weaker activation of HoxA1 and HoxB1 which in turn, hampers the expression of Aldh1a2 further reducing the production of RA The regulated nature of our RA knockdown model makes the effect of the Cyp26A1 activity transient allowing for recovery.
Defective cranial nerve growth and connectivity is commonly seen in Gsc+/Cyp26A1 embryos due to reduced RA signaling during early gastrulation. These embryos exhibited an overall reduction in ventral neurofilament-positive fibers compared to their WT littermates. The Trigeminal nerve (cranial nerve V) was affected along its three branches; ophthalmic, maxillary, and mandibular. This aberrant Trigeminal cranial nerve Gsc+/Cyp26A1 phenotype is reminiscent of HoxA1 and HoxB1 knock-out mice as well as the LgDel mouse model of 22q11.2 Deletion Syndrome (Gavalas et al., 1998; Karpinski et al., 2014). Interestingly, when retinoic acid expression was altered in the LgDel model—through delivery of exogenous RA (increase in RA expression) or by creating a Raldh2+/− x LgDel model (decrease in RA expression)—even more severe craniofacial developmental malformations than found in the LgDel model (Maynard et al., 2013). These observations suggest that a change in RA levels—whether an increase or decrease—can substantially alter downstream retinoic acid signaling and produce a wide array of phenotypic variation as seen in Vitamin A Deficiency Syndrome and 22q11.2 Deletion (DiGeorge/VeloCardioFacial) Syndrome (Vermot et al., 2003). Gsc+/Cyp26A1 embryos also show aberrant patterning of cranial nerves VII and VIII based on neurofilament staining, a phenotype reminiscent of HoxA2 knockout mice (Gavalas et al., 1997). In addition, by E10.5, Gsc+/Cyp26A1 embryos had fused IX-X cranial nerves with no dorsal cranial nerve IX fibers, a developmental malformation also found in Nav2 mutant mice (Mic et al., 2010). Importantly, Nav2 is a known RA-responsive gene (Muley et al., 2008). Null Hoxa3 embryos exhibit both the a reduction or loss of dorsal root fibers in cranial nerves V, VII, and VIII and a cranial nerve IX/X fusion (Watari et al., 2001; Chojnowski et al., 2016). Aberrant cranial nerve V, VII, and IX phenotypes, and reduction or loss of dorsal root fibers and cranial nerve IX/X fusion have been also described in PAE mouse embryos exposed to alcohol during gastrulation (Van Maele-Fabry et al., 1995; Dunty et al., 2002; Mooney and Miller, 2008). These observations suggest transient ectopic expression of Cyp26A1 in Gsc+/Cyp26A1 mice is sufficient to dysregulate cranial nerve development.
4.2 RA deficiency phenocopies the craniofacial malformations induced by alcohol
Individuals with FAS, the most severe form of FASD, have sentinel facial features and represent 10%–15% of children in the spectrum (May et al., 2009). Here we report Gsc+/Cyp26A1 embryos develop similar craniofacial malformations with a comparable variable penetrance. E18.5 Gsc+/Cyp26A1 embryos have a larger philtrum to lip ratio, a smaller frontal snout area, smaller whisker pad length, and a smaller bigonial width compared to WT littermates. More importantly, we demonstrated that RA deficiency at gastrulation in the Gsc+/Cyp26A1 model produced craniofacial malformations resembling the effects of PAE at gastrulation (Sulik and Johnston, 1983; Godin et al., 2010a; Anthony et al., 2010; Lipinski et al., 2012). A smaller bigonial width has been shown to be a significant characteristic measurement in models where ethanol was administered acutely at gastrulation (E7.0-E8.5) (Anthony et al., 2010; Lipinski et al., 2012) demonstrating that RA deficiency at gastrulation phenocopies this PAE phenotype. Additionally, our study found two new statistically significant diagnostic measurements, philtrum to lip ratio and the frontal snout area, to further demonstrate changes in maxillary process formation in E18.5 Gsc+/Cyp26A1 embryos. The philtrum to lip ratio measurement takes into consideration the length of the philtrum over the length of the maxillary component of the snout (bottom of the nose to the top of the mandible; lip - ratio) and is generally larger in Gsc+/Cyp26A1 than WT littermates. The maxillary region in E18.5 Gsc+/Cyp26A1 embryos is clearly affected; it is narrower and shorter in Gsc+/Cyp26A1 embryos, as seen in PAE models (Sulik and Johnston, 1983; Parnell et al., 2009). The frontal snout area measurement further demonstrates that the entire snout of E18.5 Gsc+/Cyp26A1 embryos—which includes the maxillary process region—is smaller in the genetically manipulated embryos reaching statistical significance in 5 out 7 litters. While the frontal snout area measurement is novel, this phenotype has been seen qualitatively in early gastrulation PAE mouse models (Sulik and Johnston, 1983; Godin et al., 2010). Taken together, our Gsc+/Cyp26A1 model demonstrates that craniofacial malformations affecting the maxillary region are the result of RA deficiency and they phenocopy the PAE craniofacial malformations.
Gsc+/Cyp26A1 mice exhibit a relatively high incidence of maxillary malocclusions which resemble those found in an early gestational PAE mouse model (Kaminen-Ahola et al., 2010). It has also been well documented that Vitamin A deficiency—on its own, RA signaling reduction, RAR loss-of-function, biosynthesis reduction, or downstream transcriptional target mutation—causes maxillary malocclusions in murine models and also in humans with VAD (Lohnes et al., 1994; Dupe et al., 2003; Niederreither et al., 2003; Kurosaka et al., 2017). Maxillary malocclusions, specifically Class I anterior transverse malocclusions, are not commonly reported and are usually overlooked as a co-morbidity caused by maternal PAE. But a few studies have shown that children with FASD do indeed have Class I, II, and III malocclusions with underdeveloped maxillary, anterior crowding, and increases of open bite (Church et al., 1997; Astley and Clarren, 2001; Naidoo et al., 2006). Recently, (Blanck-lubarsch et al., 2019), have shown that children with FASD present with anterior maxillary and transverse plane malocclusions, specifically crossbites or edge-to-edge bites which were found in Gsc+/− mice. Gsc+/− mice have not been documented to develop craniofacial maxillary malocclusions (Rivera-pérez et al., 1995). Interestingly, E0.5 to E8.5 first-trimester PAE-treated mice were shown to have wider (but not longer) cranium measurements and pre-maxillary malocclusions compared to non-PAE mice (Kaminen-Ahola et al., 2010). Our Gsc+/Cyp26A1 model produced pre-maxillary malocclusions analogous to the Kaminen-Ahola et al. (2010) early gestation PAE model, which affected the cranial neural crest cells during gastrulation (E6.5–8.5). It is important to emphasize the Gsc+/Cyp26A1 cassette is active at early gastrulation (∼E6.5-E7.0), a very short window of developmental time, but yet produced the maxillary malocclusions as seen in a chronic PAE mouse model. Therefore, early gastrulation (∼E7.0) PAE mouse models should produce maxillary malocclusions, unfortunately, many PAE studies do not study adult mice for craniofacial malformations, let alone maxillary malocclusions. Furthermore, cleft-lip and palate, maxillary hypoplasia, and tooth malformations are found—within the pre-maxillary region—in over 30% of individuals with FASD (Popova et al., 2016), a staggering figure. While such malformations are not commonly viewed as a co-morbidity of FASD, they can be used as another facial feature for assistance in FASD diagnosis.
4.3 PAE-induced retinoic acid deficiency can explain neurodevelopmental and craniofacial malformations seen in FASD
FASD is a spectrum of conditions arising as a result of prenatal alcohol exposure in humans. Developmental phenotypic similarities between the human and animal models of prenatal alcohol exposure are extensively observed. The Gsc+/Cyp26A1 mouse model demonstrates many of the craniofacial malformations shared between RA deficiency and PAE mouse models and in human children with FASD. It is important to emphasize that our model can recapitulate neurodevelopmental and FAS-like sentinel craniofacial features following a restricted, binge like, spatial-temporal restricted activation of the Gsc+/Cyp26A1 cassette during gastrulation and the resulting transient reduction in RA signaling. It is likely that taking a genetic approach to biochemically mimic the PAE-induced RA deficiency resulted in a higher penetrance of the PAE phenotype we observed, mitigating the common issues associated with PAE models due to a broad variation in dosage, duration, and timing of alcohol exposure on individual developing embryos (Petrelli et al., 2017).
Taken together, our data provide in vivo evidence in a mammalian model that strongly supports RA deficiency as a major molecular etiology of the craniofacial and neurodevelopmental malformations associated with FASD outcomes, as we previously supported in our Xenopus FAS model (Fainsod et al., 2020). Our Gsc+/Cyp26A1 mouse model recapitulates nearly all PAE phenotypes, yet there is one common finding in Xenopus and mouse PAE models, microcephaly, which we have not seen in our genetic model. To address the missing phenotype we must remind ourselves that the Gsc+/Cyp26A1 model is an acute RA deficiency at early gastrulation, not a chronic or repeated acute PAE exposure as seen in studies which show microcephaly as a PAE phenotype (Parnell et al., 2009; Godin et al., 2010a; Lipinski et al., 2012). Instead, our acute RA deficiency model resembles a chronic PAE exposure as seen in studies which show craniofacial widening as a PAE phenotype (Kaminen-Ahola et al., 2010). These findings suggest that Vitamin A supplementation may significantly reduce or prevent FASD outcomes in cases of high risk for PAE. Further studies exploring the protective effects of Vitamin A in PAE mouse models will need to be completed before a therapeutic clinical application of Vitamin A can be implemented. Our Gsc+/Cyp26A1 mouse model should lead to more effective diagnostic and prevention strategies for FASD, hopefully reducing the burden of this disorder on children, their families, and society.
Data availability statement
The original contributions presented in the study are included in the article/supplementary material, further inquiries can be directed to the corresponding author.
Ethics statement
The animal study was reviewed and approved by the Research Ethics Board of University of Manitoba.
Author contributions
The authors confirm contribution to the paper as follows: study conception GH and AF, design: GH, AF, AO, and MP data collection: BP, HA, and MP; analysis and interpretation of results: BP and GH; draft manuscript preparation: BP, GH, and AF. All authors contributed to the article and approved the submitted version.
Funding
This research was supported by grants from Manitoba Liquor and Lotteries to GH and AF, Children’s Hospital Foundation of Manitoba to GH, Canadian Institutes of Health Research to GH and AF, the Wolfson Family Chair in Genetics to AF, and Research Manitoba/Children’s Hospital Research Institute of Manitoba PhD Studentship to BP. All animal studies were performed under approved animal research protocol AC11509 from the University of Manitoba.
Acknowledgments
We thank Dr. Hassan Marzban (University of Manitoba) for his help with the IHC Whole Embryo Protocol; Dr. Derek Oliver, Dr. Ravinder Sidhu and the Manitoba Institute for Materials for their help with the E18.5 embryo SEM; Dr. Mike Jackson and Dr. Barbara Triggs-Raine from the Central Animal Core Imaging & Transgenic Facilities; Members of the Central Animal Care Facility at the University of Manitoba for animal husbandry and maintenance of our mouse colony.
Conflict of interest
The authors declare that the research was conducted in the absence of any commercial or financial relationships that could be construed as a potential conflict of interest.
Publisher’s note
All claims expressed in this article are solely those of the authors and do not necessarily represent those of their affiliated organizations, or those of the publisher, the editors and the reviewers. Any product that may be evaluated in this article, or claim that may be made by its manufacturer, is not guaranteed or endorsed by the publisher.
Supplementary material
The Supplementary Material for this article can be found online at: https://www.frontiersin.org/articles/10.3389/fcell.2023.1208279/full#supplementary-material
Supplemental Figure S1 | Gsc+/Cyp26A1 P60 mice have large upper incisors, but do not have any length or height variations in the cranium or mandible regions. Box plots for all height and length craniofacial landmark features are shown, as indicated. Gsc+/Cyp26A1 P60 mice were statistically different for only one measurement: the upper incisor height (upper right panel, P < 0.001). Trending results in the inferior incisor axis, posterior cranial height and mandible axis were observed in Gsc+/Cyp26A1 mice. Gsc+/Cyp26A1 mice, n = 10; C57BL/6N mice, n = 4; WT with spontaneous malocclusions, n = 3. ***P < 0.001.
References
Alberry, B., and Singh, S. M. (2016). Developmental and behavioral consequences of early life maternal separation stress in a mouse model of fetal alcohol spectrum disorder. Behav. Brain Res. 308, 94–103. doi:10.1016/j.bbr.2016.04.031
Andersen, A. M. N., Andersen, P. K., Olsen, J., Grønbæk, M., and Strandberg-Larsen, K. (2012). Moderate alcohol intake during pregnancy and risk of fetal death. Int. J. Epidemiol. 41 (2), 405–413. doi:10.1093/ije/dyr189
Anthony, B., Vinci-Booher, S., Wetherill, L., Ward, R., Goodlett, C., and Zhou, F. C. (2010). Alcohol-induced facial dysmorphology in C57BL/6 mouse models of fetal alcohol spectrum disorder. Alcohol 44, 659–671. doi:10.1016/j.alcohol.2010.04.002
Astley, S. J., and Clarren, S. K. (2001). Measuring the facial phenotype of individuals with prenatal alcohol exposure: Correlations with brain dysfunction. Alcohol & Alcohol. 36 (2), 147–159. doi:10.1093/alcalc/36.2.147
Bailey, B. a., and Sokol, R. J. (2011). Prenatal alcohol exposure and miscarriage, stillbirth, preterm delivery, and sudden infant death syndrome. Alcohol Res. health 34 (1), 86–91.
Balmer, J. E., and Blomhoff, R. (2002). Gene expression regulation by retinoic acid. J. Lipid Res. 43, 1773–1808. doi:10.1194/jlr.R100015-JLR200
Blanck-lubarsch, M., Flieger, S., Feldmann, R., Kirschneck, C., Sauerland, C., and Hohoff, A. (2019). Malocclusion can give additional hints for diagnosis of fetal alcohol spectrum disorder. Alcohol & Alcohol. 54, 56–61. doi:10.1093/alcalc/agy071
Blum, M., Gaunt, S. J., Cho, K. W., Steinbeisser, H., Blumberg, B., Bittner, D., et al. (1992). Gastrulation in the mouse: The role of the homeobox gene goosecoid’, Cell. Elsevier 69 (7), 1097–1106. doi:10.1016/0092-8674(92)90632-M
Burd, L., Blair, J., and Dropps, K. (2012). Prenatal alcohol exposure, blood alcohol concentrations and alcohol elimination rates for the mother, fetus and newborn. J. Perinatology 32 (9), 652–659. doi:10.1038/jp.2012.57
Chojnowski, J. L., Trau, H. A., Masuda, K., and Manley, N. R. (2016). Temporal and spatial requirements for Hoxa3 in mouse embryonic development. Dev. Biol. 415 (1), 33–45. doi:10.1016/j.ydbio.2016.05.010
Chudley, A. E., Conry, J., Cook, J. L., Loock, C., Rosales, T., LeBlanc, N., et al. (2005). Fetal alcohol spectrum disorder: Canadian guidelines for diagnosis. CMAJ Can. Med. Assoc. J. 172 (5), S1–S21. doi:10.1503/cmaj.1040302
Church, M. W., Eldis, F., Blakley, B. W., and Bawle, E. V. (1997). Hearing, language, speech, vestibular, and dentofacial disorders in fetal alcohol syndrome. Alcohol. Clin. Exp. Res. 21 (2), 227–237. doi:10.1111/j.1530-0277.1997.tb03754.x
Consortium, I. K. M., Collins, F. S., Rossant, J., and Wurst, W. (2007). A mouse for all reasons. Cell 128 (1), 9–13. doi:10.1016/j.cell.2006.12.018
Cook, J. L., Green, C. R., Lilley, C. M., Anderson, S. M., Baldwin, M. E., Chudley, A. E., et al. (2016). Fetal alcohol spectrum disorder: A guideline for diagnosis across the lifespan. CMAJ Can. Med. Assoc. J. = J. de l’Association medicale Can. 188, 191–197. doi:10.1503/cmaj.141593
Cunningham, T. J., Brade, T., Sandell, L. L., Lewandoski, M., Trainor, P. A., Colas, A., et al. (2015). Retinoic acid activity in undifferentiated neural progenitors is sufficient to fulfill its role in restricting Fgf8 expression for somitogenesis. PLoS ONE 10, e0137894. doi:10.1371/journal.pone.0137894
Cunningham, T. J., Zhao, X., and Duester, G. (2011). Uncoupling of retinoic acid signaling from tailbud development before termination of body axis extension. Genesis 49 (10), 776–783. doi:10.1002/dvg.20763
Deschamps, J., and van Nes, J. (2005). Developmental regulation of the Hox genes during axial morphogenesis in the mouse. Development 132 (13), 2931–2942. doi:10.1242/dev.01897
Dunty, W. C., Zucker, R. M., and Sulik, K. K. (2002). Hindbrain and cranial nerve dysmorphogenesis result from acute maternal ethanol administration. Dev. Neurosci. 24 (4), 328–342. doi:10.1159/000066748
Dupé, V., Davenne, M., Brocard, J., Dollé, P., Mark, M., Dierich, A., et al. (1997). In vivo functional analysis of the Hoxa-1 3' retinoic acid response element (3'RARE). Development 124, 399–410. doi:10.1242/dev.124.2.399
Dupe, V., Matt, N., Garnier, J. M., Chambon, P., Mark, M., and Ghyselinck, N. B. (2003). A newborn lethal defect due to inactivation of retinaldehyde dehydrogenase type 3 is prevented by maternal retinoic acid treatment. Proc. Natl. Acad. Sci. 100 (24), 14036–14041. doi:10.1073/pnas.2336223100
Dupé, V., and Pellerin, I. (2009). Retinoic acid receptors exhibit cell-autonomous functions in cranial neural crest cells. Dev. Dyn. official Publ. Am. Assoc. Anatomists 238 (10), 2701–2711. doi:10.1002/dvdy.22087
Fainsod, A., Bendelac-Kapon, L., and Shabtai, Y. (2020). Fetal alcohol spectrum disorder: Embryogenesis under reduced retinoic acid signaling conditions. Sub-cellular Biochem. 95, 197–225. doi:10.1007/978-3-030-42282-0_8
Gavalas, A., Davenne, M., Lumsden, A., Chambon, P., and Rijli, F. M. (1997). Role of Hoxa-2 in axon pathfinding and rostral hindbrain patterning Role of Hoxa-2 in axon pathfinding and rostral hindbrain patterning. Development 124, 3693. doi:10.1242/dev.124.19.3693
Gavalas, A., Studer, M., Lumsden, A., Rijli, F. M., Krumlauf, R., and Chambon, P. (1998). Hoxa1 and Hoxb1 synergize in patterning the hindbrain, cranial nerves and second pharyngeal arch. Dev. Camb. Engl. 125 (6), 1123–1136. doi:10.1242/dev.125.6.1123
Ghyselinck, N., Dupé, V., Dierich, A., Messaddeq, N., Garnier, J. M., Rochette-Egly, C., et al. (1997). Role of the retinoic acid receptor beta (RARbeta) during mouse development. Int. J. Dev. Biol. 41, 425–447.
Godin, E. A., O'Leary-Moore, S. K., Khan, A. A., Parnell, S. E., Ament, J. J., Dehart, D. B., et al. (2010a). Magnetic resonance microscopy defines ethanol-induced brain abnormalities in prenatal mice: Effects of acute insult on gestational day 7. Alcohol. Clin. Exp. Res. 34, 98–111. doi:10.1111/j.1530-0277.2009.01071.x
Gur, M., Bendelac-Kapon, L., Shabtai, Y., Pillemer, G., and Fainsod, A. (2022). Reduced retinoic acid signaling during gastrulation induces developmental microcephaly. Front. Cell Dev. Biol. 10, 844619–844620. doi:10.3389/fcell.2022.844619
Gur, M., Edri, T., Moody, S. A., and Fainsod, A. (2022). Retinoic acid is required for normal morphogenetic movements during gastrulation. Front. Cell Dev. Biol. 10, 857230–857317. doi:10.3389/fcell.2022.857230
Halilagic, A., Ribes, V., Ghyselinck, N. B., Zile, M. H., Dollé, P., and Studer, M. (2007). Retinoids control anterior and dorsal properties in the developing forebrain. Dev. Biol. 303 (1), 362–375. doi:10.1016/j.ydbio.2006.11.021
Hoyme, H. E., Kalberg, W. O., Elliott, A. J., Blankenship, J., Buckley, D., Marais, A. S., et al. (2016). Updated clinical guidelines for diagnosing fetal alcohol spectrum disorders. Pediatrics 138 (2), e20154256. doi:10.1542/peds.2015-4256
Iwamuro, M., Komaki, T., Kubota, Y., Seita, M., Kawamoto, H., Yuasa, T., et al. (2010). Comparative analysis of endoderm formation efficiency between mouse ES cells and iPS cells. Cell Transplant. 19, 831–839. doi:10.3727/096368910X508951
Kam, R. K. T., Deng, Y., Chen, Y., and Zhao, H. (2012). Retinoic acid synthesis and functions in early embryonic development. Cell & Biosci. 2 (1), 11. doi:10.1186/2045-3701-2-11
Kaminen-Ahola, N., Ahola, A., Maga, M., Mallitt, K. A., Fahey, P., Cox, T. C., et al. (2010). Maternal ethanol consumption alters the epigenotype and the phenotype of offspring in a mouse model. PLoS Genet. 6 (1), e1000811. doi:10.1371/journal.pgen.1000811
Karpinski, B. A., Maynard, T. M., Fralish, M. S., Nuwayhid, S., Zohn, I. E., Moody, S. A., et al. (2014). Dysphagia and disrupted cranial nerve development in a mouse model of DiGeorge (22q11) deletion syndrome. Dis. Models Mech. 7 (2), 245–257. doi:10.1242/dmm.012484
Kawakami, M., and Yamamura, K. I. (2008). Cranial bone morphometric study among mouse strains. BMC Evol. Biol. 8 (1), 73–11. doi:10.1186/1471-2148-8-73
Keen, C. L., Uriu-Adams, J. Y., Skalny, A., Grabeklis, A., Grabeklis, S., Green, K., et al. (2010). The plausibility of maternal nutritional status being a contributing factor to the risk for fetal alcohol spectrum disorders: The potential influence of zinc status as an example. Biofactors 36 (2), 125–135. doi:10.1002/biof.89
Kim, J. H., Lee, S. R., Park, H. J., Park, J. H., and Lee, K. Y. (2011). High cleavage efficiency of a 2A peptide derived from porcine teschovirus-1 in human cell lines, zebrafish and mice. PLoS ONE 6 (4), e18556–e18558. doi:10.1371/journal.pone.0018556
Kot-Leibovich, H., and Fainsod, A. (2009). Ethanol induces embryonic malformations by competing for retinaldehyde dehydrogenase activity during vertebrate gastrulation. Dis. models Mech. 2 (5–6), 295–305. doi:10.1242/dmm.001420
Kurosaka, H., Wang, Q., Sandell, L., Yamashiro, T., and Trainor, P. A. (2017). Rdh10 loss-of-function and perturbed retinoid signaling underlies the etiology of choanal atresia. Hum. Mol. Genet. 26 (7), 1268–1279. doi:10.1093/hmg/ddx031
Lange, S., Probst, C., Gmel, G., Rehm, J., Burd, L., and Popova, S. (2017). Global prevalence of fetal alcohol spectrum disorder among children and youth: A systematic review and meta-analysis. JAMA Pediatr. 171 (10), 948–956. doi:10.1001/jamapediatrics.2017.1919
Lee, L. M. Y., Leung, C. Y., Tang, W. W. C., Choi, H. L., Leung, Y. C., McCaffery, P. J., et al. (2012). A paradoxical teratogenic mechanism for retinoic acid. Proc. Natl. Acad. Sci. 109 (34), 13668–13673. doi:10.1073/pnas.1200872109
Lipinski, R. J., Hammond, P., O'Leary-Moore, S. K., Ament, J. J., Pecevich, S. J., Jiang, Y., et al. (2012). Ethanol-induced face-brain dysmorphology patterns are correlative and exposure-stage dependent. PLoS ONE 7, e43067. doi:10.1371/journal.pone.0043067
Lohnes, D., Mark, M., Mendelsohn, C., Dollé, P., Dierich, A., Gorry, P., et al. (1994). Function of the retinoic acid receptors (RARs) during development (I). Craniofacial and skeletal abnormalities in RAR double mutants. Craniofacial skeletal Abnorm. RAR double mutants ’, Dev. Camb. Engl. 120 (10), 2723–2748. doi:10.1242/dev.120.10.2723
Makki, N., and Capecchi, M. R. (2011). Identification of novel Hoxa1 downstream targets regulating hindbrain, neural crest and inner ear development. Dev. Biol. 357 (2), 295–304. doi:10.1016/j.ydbio.2011.06.042
Mark, M., Ghyselinck, N. B., and Chambon, P. (2006). Function of retinoid nuclear receptors: lessons from genetic and pharmacological dissections of the retinoic acid signaling pathway during mouse embryogenesis. Annu. Rev. Pharmacol. Toxicol. 46, 451–480. doi:10.1146/annurev.pharmtox.46.120604.141156
Mascrez, B., Ghyselinck, N. B., Chambon, P., and Mark, M. (2009). A transcriptionally silent RXR supports early embryonic morphogenesis and heart development. Proc. Natl. Acad. Sci. 106 (11), 4272–4277. doi:10.1073/pnas.0813143106
Maves, L., and Kimmel, C. B. (2005). Dynamic and sequential patterning of the zebrafish posterior hindbrain by retinoic acid. Dev. Biol. 285 (2), 593–605. doi:10.1016/j.ydbio.2005.07.015
May, P. A., Gossage, J. P., Kalberg, W. O., Robinson, L. K., Buckley, D., Manning, M., et al. (2009). Prevalence and epidemiologic characteristics of FASD from various research methods with an emphasis on recent in-school studies. Dev. Disabil. Res. Rev. 15 (3), 176–192. doi:10.1002/ddrr.68
May, P., Chambers, C. D., Kalberg, W. O., Zellner, J., Feldman, H., Buckley, D., et al. (2018). Prevalence of fetal alcohol spectrum disorders in 4 US communities. JAMA 319 (5), 474–482. doi:10.1001/jama.2017.21896
Maynard, T. M., Gopalakrishna, D., Meechan, D. W., Paronett, E. M., Newbern, J. M., and LaMantia, A. S. (2013) 22q11 Gene dosage establishes an adaptive range for sonic hedgehog and retinoic acid signaling during early development. Hum. Mol. Genet. 22(2), 300–312. doi:10.1093/hmg/dds429
Mic, F. A., Haselbeck, R. J., Cuenca, A. E., and Duester, G. (2010). Novel retinoic acid generating activities in the neural tube and heart identified by conditional rescue of Raldh2 null mutant mice. Development 129 (9), 2271–2282. doi:10.1242/dev.129.9.2271
Molotkova, N., Molotkov, A., and Duester, G. (2007). Role of retinoic acid during forebrain development begins late when Raldh3 generates retinoic acid in the ventral subventricular zone. Dev. Biol. 303 (2), 601–610. doi:10.1016/j.ydbio.2006.11.035
Mooney, S. M., and Miller, M. W. (2008). Time-specific effects of ethanol exposure on cranial nerve nuclei: Gastrulation and neuronogenesis. Exp. Neurol. 205 (1), 56–63. doi:10.1016/j.expneurol.2007.01.016
Muley, P. D., McNeill, E. M., Marzinke, M. A., Knobel, K. M., Barr, M. M., and Clagett-Dame, M. (2008). The atRA-responsive gene neuron navigator 2 functions in neurite outgrowth and axonal elongation. Dev. Neurobiol. 68 (13), 1441–1453. doi:10.1002/dneu.20670
Naidoo, S., Harris, A., Swanevelder, S., and Lombard, C. (2006). Foetal alcohol syndrome: A cephalometric analysis of patients and controls. Eur. J. Orthod. 28 (3), 254–261. doi:10.1093/ejo/cji110
Niederreither, K., Subbarayan, V., Dollé, P., and Chambon, P. (1999). Embryonic retinoic acid synthesis is essential for early mouse post-implantation development. Nat. Genet. 21, 444–448. doi:10.1038/7788
Niederreither, K., Vermot, J., Le Roux, I., Schuhbaur, B., Chambon, P., and Dollé, P. (2003). The regional pattern of retinoic acid synthesis by RALDH2 is essential for the development of posterior pharyngeal arches and the enteric nervous system. Dev. Camb. Engl. 130 (11), 2525–2534. doi:10.1242/dev.00463
Niederreither, K., Vermot, J., Schuhbaur, B., Chambon, P., and Dollé, P. (2000). Retinoic acid synthesis and hindbrain patterning in the mouse embryo. Dev. Camb. Engl. 127 (1), 75–85. doi:10.1242/dev.127.1.75
Ogura, T., and Evans, R. M. (1995a). A retinoic acid-triggered cascade of HOXB1 gene activation. Proc. Natl. Acad. Sci. U. S. A. 92 (2), 387–391. doi:10.1073/pnas.92.2.387
Ogura, T., and Evans, R. M. (1995b). Evidence for two distinct retinoic acid response pathways for HOXB1 gene regulation. Proc. Natl. Acad. Sci. U. S. A. 92 (2), 392–396. doi:10.1073/pnas.92.2.392
Parihar, M., Bendelac-Kapon, L., Gur, M., Abbou, T., Belorkar, A., Achanta, S., et al. (2021). Retinoic acid fluctuation activates an uneven, direction-dependent network-wide robustness response in early embryogenesis. Front. Cell Dev. Biol. 9, 747969–748022. doi:10.3389/fcell.2021.747969
Parnell, S. E., Shonagh, K., O’Leary-Moore, E. A., Deborah, B., Dehart, B., Johnson, W., et al. (2009). Magnetic resonance microscopy defines ethanol-induced brain abnormalities in prenatal mice: Effects of acute insult on gestational day 8. Alcohol Clin. Exp. Res. 33 (6), 1001–1011. doi:10.1111/j.1530-0277.2009.00921.x
Paschaki, M., Schneider, C., Rhinn, M., Thibault-Carpentier, C., Dembélé, D., Niederreither, K., et al. (2013). Transcriptomic analysis of murine embryos lacking endogenous retinoic acid signaling. PLoS ONE 8 (4), e62274. doi:10.1371/journal.pone.0062274
Pennimpede, T., Cameron, D. A., MacLean, G. A., Li, H., Abu-Abed, S., and Petkovich, M. (2010). The role of CYP26 enzymes in defining appropriate retinoic acid exposure during embryogenesis. Birth Defects Res. Part A Clin. Mol. Teratol. 88 (10), 883–894. doi:10.1002/bdra.20709
Petrelli, B., Bendelac, L., Hicks, G. G., and Fainsod, A. (2019). Insights into retinoic acid deficiency and the induction of craniofacial malformations and microcephaly in Fetal Alcohol Spectrum Disorder. Genesis 57, 23278. doi:10.1002/dvg.23278
Petrelli, B., Weinberg, J., and Hicks, G. G. (2017). Effects of prenatal alcohol exposure (PAE): Insights into FASD using mouse models of PAE. Regen. Med. Program 0, 131–147. doi:10.1139/bcb-2017-0280
Piette, D., Hendrickx, M., Willems, E., Kemp, C. R., and Leyns, L. (2008). An optimized procedure for whole-mount in situ hybridization on mouse embryos and embryoid bodies. Nat. Protoc. 3, 1194. doi:10.1038/nprot.2008.103
Popova, S., Lange, S., Shield, K., Mihic, A., Chudley, A. E., Mukherjee, R. A. S., et al. (2016). Comorbidity of fetal alcohol spectrum disorder: A systematic review and meta-analysis. Lancet 387. 978, 987. doi:10.1016/S0140-6736(15)01345-8
Ran, F. A., Hsu, P. D., Wright, J., Agarwala, V., Scott, D. A., and Zhang, F. (2013). Genome engineering using the CRISPR-Cas9 system. Nat. Protoc. 8 (11), 2281–2308. doi:10.1038/nprot.2013.143
Rhinn, M., and Dolle, P. (2012). Retinoic acid signalling during development. Development 139 (5), 843–858. doi:10.1242/dev.065938
Ribes, V., Wang, Z., Dollé, P., and Niederreither, K. (2006). Retinaldehyde dehydrogenase 2 (RALDH2)-mediated retinoic acid synthesis regulates early mouse embryonic forebrain development by controlling FGF and sonic hedgehog signaling. Dev. Camb. Engl. 133 (2), 351–361. doi:10.1242/dev.02204
Rivera-pérez, J. A., Mallo, M., Gendron-Maguire, M., Gridley, T., and Behringer, R. R. (1995). Goosecoid is not an essential component of the mouse gastrula organizer but is required for craniofacial and rib development. Development 121, pp. 3005–3012. doi:10.1242/dev.121.9.3005
Ross, A., and Zolfaghari, R. (2011). Cytochrome P450s in the regulation of cellular retinoic acid metabolism. Annu. Rev. Nutr. 450 (1), 65–87. Cytochrome. doi:10.1146/annurev-nutr-072610-145127
Rossant, J., Zirngibl, R., Cado, D., Shago, M., and Giguère, V. (1991). Expression of a retinoic acid response element-hsplacZ transgene defines specific domains of transcriptional activity during mouse embryogenesis. Genes & Dev. 5, 1333–1344. doi:10.1101/gad.5.8.1333
Sandell, L. L., Sanderson, B. W., Moiseyev, G., Johnson, T., Mushegian, A., Young, K., et al. (2007). RDH10 is essential for synthesis of embryonic retinoic acid and is required for limb, craniofacial, and organ development. Genes Dev. 21 (9), 1113–1124. doi:10.1101/gad.1533407
Shabtai, Y., Bendelac, L., Jubran, H., Hirschberg, J., and Fainsod, A. (2018). Acetaldehyde inhibits retinoic acid biosynthesis to mediate alcohol teratogenicity. Sci. Rep. 8 (1), 347–414. doi:10.1038/s41598-017-18719-7
Shabtai, Y., and Fainsod, A. (2018). Competition between ethanol clearance and retinoic acid biosynthesis in the induction of fetal alcohol syndrome. Biochem. Cell Biol. = Biochimie Biol. Cell. 96 (2), 148–160. doi:10.1139/bcb-2017-0132
Shukrun, N., Shabtai, Y., Pillemer, G., and Fainsod, A. (2019). Retinoic acid signaling reduction recapitulates the effects of alcohol on embryo size. Genesis 57 (7), 232844–e23312. doi:10.1002/dvg.23284
Sirbu, I. O., and Duester, G. (2006). Retinoic-acid signalling in node ectoderm and posterior neural plate directs left–right patterning of somitic mesoderm. Nat. Cell Biol. 8 (3), 271–277. doi:10.1038/ncb1374
Soto-Gutiérrez, A., Navarro-Alvarez, N., Zhao, D., Rivas-Carrillo, J. D., Lebkowski, J., Tanaka, N., et al. (2007). Differentiation of mouse embryonic stem cells to hepatocyte-like cells by co-culture with human liver nonparenchymal cell lines. Nat. Protoc. 2 (2), 347–356. doi:10.1038/nprot.2007.18
Sulik, K., Cook, C., and Webster, W. (1988). Teratogens and craniofacial malformations: Relationships to cell death. Development 103, 213–231. doi:10.1242/dev.103.Supplement.213
Sulik, K., and Johnston, M. (1983). Sequence of developmental alterations following acute ethanol exposure in mice: Craniofacial features of the fetal alcohol syndrome. Am. J. Anat. 166, 257–269. doi:10.1002/aja.1001660303
Sulik, K., Johnston, M., and Webb, M. (1981). Fetal alcohol syndrome: Embryogenesis in a mouse model. Science 214 (4523), 936–938. doi:10.1126/science.6795717
Tsukamoto, Y., Kajii, T. S., Sugawara-Kato, Y., Hirabayashi, Y., Fujimori, O., and Iida, J. (2010). Relationship between degree of malocclusion and occlusal interference in mice that spontaneously develop anterior transverse crossbite’, American Journal of Orthodontics and Dentofacial Orthopedics. Am. Assoc. Orthod. 138 (6), 710.e1–e5. doi:10.1016/j.ajodo.2010.03.028
Van Maele-Fabry, G., Gofflot, F., Clotman, F., and Picard, J. J. (1995). Alterations of mouse embryonic branchial nerves and ganglia induced by ethanol. Neurotoxicology Teratol. 17 (4), 497–506. doi:10.1016/0892-0362(95)00009-g
Vermot, J., Niederreither, K., Garnier, J.-M., Chambon, P., and Dollé, P. (2003). Decreased embryonic retinoic acid synthesis results in a DiGeorge syndrome phenotype in newborn mice. PNAS 100 (4), 1763–1768. doi:10.1073/pnas.0437920100
Vermot, J., Niederreither, K., Garnier, J. M., Chambon, P., and Dollé, P. (2003). Decreased embryonic retinoic acid synthesis results in a DiGeorge syndrome phenotype in newborn mice. Proc. Natl. Acad. Sci. U. S. A. 100 (4), 1763–1768. doi:10.1073/pnas.0437920100
Vitobello, A., Ferretti, E., Lampe, X., Vilain, N., Ducret, S., Ori, M., et al. (2011). Hox and pbx factors control retinoic acid synthesis during hindbrain segmentation. Dev. Cell 20 (4), 469–482. doi:10.1016/j.devcel.2011.03.011
Watari, N., Kameda, Y., Takeichi, M., and Chisaka, O. (2001). Hoxa3 regulates integration of glossopharyngeal nerve precursor cells. Dev. Biol. 240 (1), 15–31. doi:10.1006/dbio.2001.0447
Weinberg, J. (1989). Prenatal ethanol exposure alters adrenocortical development of offspring. Alcohol. Clin. Exp. Res. 13 (1), 73–83. doi:10.1111/j.1530-0277.1989.tb00287.x
Yamada, G., Mansouri, A., Torres, M., Stuart, E. T., Blum, M., Schultz, M., et al. (1995). Targeted mutation of the murine goosecoid gene results in craniofacial defects and neonatal death. Dev. Camb. Engl. 121 (9), 2917–2922. doi:10.1242/dev.121.9.2917
Yelin, R., Kot, H., Yelin, D., and Fainsod, A. (2007). Early molecular effects of ethanol during vertebrate embryogenesis. Differentiation 75 (5), 393–403. doi:10.1111/j.1432-0436.2006.00147.x
Keywords: gastrulation, retinoic acid, vitamin A deficiency, fetal alcohol spectrum disorder (FASD), prenatal alcohol exposure (PAE), craniofacial malformations, malocclusion
Citation: Petrelli B, Oztürk A, Pind M, Ayele H, Fainsod A and Hicks GG (2023) Genetically programmed retinoic acid deficiency during gastrulation phenocopies most known developmental defects due to acute prenatal alcohol exposure in FASD. Front. Cell Dev. Biol. 11:1208279. doi: 10.3389/fcell.2023.1208279
Received: 18 April 2023; Accepted: 05 June 2023;
Published: 16 June 2023.
Edited by:
Dorota Szumska, University of Oxford, United KingdomReviewed by:
Sophie Payne, University of Oxford, United KingdomJacinta Kalisch-Smith, University of Oxford, United Kingdom
Copyright © 2023 Petrelli, Oztürk, Pind, Ayele, Fainsod and Hicks. This is an open-access article distributed under the terms of the Creative Commons Attribution License (CC BY). The use, distribution or reproduction in other forums is permitted, provided the original author(s) and the copyright owner(s) are credited and that the original publication in this journal is cited, in accordance with accepted academic practice. No use, distribution or reproduction is permitted which does not comply with these terms.
*Correspondence: G. G. Hicks, geoff.hicks@umanitoba.ca