
94% of researchers rate our articles as excellent or good
Learn more about the work of our research integrity team to safeguard the quality of each article we publish.
Find out more
ORIGINAL RESEARCH article
Front. Cell Dev. Biol., 23 May 2023
Sec. Molecular and Cellular Pathology
Volume 11 - 2023 | https://doi.org/10.3389/fcell.2023.1190386
 Amber L. Altrieth1,2
 Kevin J. O’Keefe1,2†Victoria A. Gellatly1,2
 Joey R. Tavarez1,2Sage M. Feminella1†
 Nicholas L. Moskwa1,2†Carmalena V. Cordi1†Judy C. Turrieta1Deirdre A. Nelson1
 Melinda Larsen1,2*
Fibrosis results from excess extracellular matrix accumulation, which alters normal tissue architecture and impedes function. In the salivary gland, fibrosis can be induced by irradiation treatment for cancer therapy, Sjögren’s Disease, and other causes; however, it is unclear which stromal cells and signals participate in injury responses and disease progression. As hedgehog signaling has been implicated in fibrosis of the salivary gland and other organs, we examined contributions of the hedgehog effector, Gli1, to fibrotic responses in salivary glands. To experimentally induce a fibrotic response in female murine submandibular salivary glands, we performed ductal ligation surgery. We detected a progressive fibrotic response where both extracellular matrix accumulation and actively remodeled collagen significantly increased at 14 days post-ligation. Macrophages, which participate in extracellular matrix remodeling, and Gli1+ and PDGFRα+ stromal cells, which may deposit extracellular matrix, both increased with injury. Using single-cell RNA-sequencing, Gli1+ cells were not found in discrete clusters at embryonic day 16 but were found in clusters expressing the stromal genes Pdgfra and/or Pdgfrb. In adult mice, Gli1+ cells were similarly heterogeneous but more cells co-expressed PDGFRα and PDGFRβ. Using Gli1-CreERT2; ROSA26tdTomato lineage-tracing mice, we found that Gli1-derived cells expand with ductal ligation injury. Although some of the Gli1 lineage-traced tdTomato+ cells expressed vimentin and PDGFRβ following injury, there was no increase in the classic myofibroblast marker, smooth muscle alpha-actin. Additionally, there was little change in extracellular matrix area, remodeled collagen area, PDGFRα, PDGFRβ, endothelial cells, neurons, or macrophages in Gli1 null salivary glands following injury when compared with controls, suggesting that Gli1 signaling and Gli1+ cells have only a minor contribution to mechanical injury-induced fibrotic changes in the salivary gland. We used scRNA-seq to examine cell populations that expand with ligation and/or showed increased expression of matrisome genes. Some Pdgfra+/Pdgfrb+ stromal cell subpopulations expanded in response to ligation, with two stromal cell subpopulations showing increased expression of Col1a1 and a greater diversity of matrisome genes, consistent with these cells being fibrogenic. However, only a few cells in these subpopulations expressed Gli1, consistent with a minor contribution of these cells to extracellular matrix production. Defining the signaling pathways driving fibrotic responses in stromal cell sub-types could reveal future therapeutic targets.
Although extracellular matrix (ECM) remodeling is required for organ development and wound repair (Gonzalez et al., 2016), if not resolved it leads to prolonged excess deposition of ECM, known as fibrosis (Gurtner et al., 2008). Following normal wound healing responses, ECM production transiently increases but is ultimately degraded as the wound heals. However, following a persistent injury, the presence of excess ECM causes an alteration of tissue architecture and impedes organ function, ultimately leading to a decline in systemic health. Fibrosis contributes to up to 45% of all deaths in the developed world due to its prevalence in many diseases (Wynn, 2008). Understanding the molecular mechanisms that drive fibrosis can provide insight into therapeutics that slow progression or reverse fibrotic responses, which interfere with normal organ function.
One prevalent organ that is subject to fibrosis is the salivary gland. Salivary gland fibrosis has many causes including ductal obstruction (Lau et al., 2017), radiation therapy (Straub et al., 2015), and the autoimmune disease Sjögren’s Syndrome (Bookman et al., 2011; Llamas-Gutierrez et al., 2014). Salivary gland obstruction typically occurs following formation of intraluminal calcifications in the striated and excretory ducts, leading to inflammation, fibrosis, and acinar cell atrophy (Lau et al., 2017). Radiation-induced fibrosis is one of the significant long-term side effects following radiation therapy and is thought to be caused by chronic inflammation (Straub et al., 2015). In patients with primary Sjögren’s Syndrome, there is a correlation between stimulated saliva flow and the degree of fibrosis, where 34% of patients with higher fibrotic indices tended to have a greater decrease in saliva flow (Bookman et al., 2011). In all cases, salivary gland fibrosis is associated with a decrease in gland function and an overall decrease in quality of life for patients. The underlying mechanisms of salivary gland fibrosis are complex and poorly understood.
The cells contributing to and the mechanisms propagating fibrosis need to be defined to facilitate therapeutic development. Many cells that reside in the connective tissue are known to produce ECM, including stromal fibroblast cells, pericytes, endothelial cells, and myofibroblasts (Weiskirchen et al., 2019). One stromal population expressing the transcription factor, glioma-associated oncogene 1 (Gli1), has been associated with fibrosis. Gli1 is an effector of canonical hedgehog signaling, and sonic hedgehog (Shh) is implicated not only in fibrosis, but also in development and regeneration in many contexts (Jaskoll et al., 2004; Zhou et al., 2016). Genetic ablation of Gli1+ cells attenuated fibrosis in the heart, kidney, and bone marrow (Kramann et al., 2015; Schneider et al., 2017) implicating these cells in fibrosis. In addition, signaling though Gli family transcription factors has been implicated in fibrosis in multiple organs. Specifically, the Gli1+ cell population expands following fibrotic injury and has been directly implicated in fibrosis by differentiating into myofibroblast cells in the heart, kidney, lung, and bone marrow (Kramann et al., 2015; Schneider et al., 2017; Cassandras et al., 2020). Gli1+ cells constitute a small subset of a larger platelet derived growth factor receptor beta (PDGFRβ)-expressing stromal cell population which, in some organs, also expresses platelet derived growth factor receptor alpha (PDGFRα) (Kramann et al., 2015). Whether signaling through the Gli family transcription factors contributes broadly to fibrotic responses and specifically to salivary gland ductal ligation induced fibrosis is unknown.
In this study, we used the salivary gland ductal ligation model to induce a fibrotic response in adult female wild-type (WT), Gli1 null mice, and Gli-1 lineage traced mice. This model mimics the reversible form of fibrosis that occurs in obstructive disease. Ligation of the primary ducts leading into the submandibular and sublingual salivary glands was previously reported to lead to downstream salivary gland atrophy, acinar cell loss, and fibrosis (Cotroneo et al., 2008; Woods et al., 2015). We examined the time-course of the fibrotic response and the stromal cell populations that expanded with injury using IHC. We specifically examined the contribution of Gli1 signaling to fibrosis and the changes in the Gli1+ cells following injury. Using a genetic null mouse for Gli1 (Gli1lz/lz), we examined levels of ECM deposition, ECM remodeling, PDGFRα+ cells and macrophages with IHC. Using a single-cell RNA-sequencing (scRNA-seq) approach, we examined the cell populations that expand with ligation injury, and more specifically examined stromal cell subtypes which increased expression of ECM genes.
All animal husbandry, surgical procedures, and tissue collection were performed in accordance with protocols approved by the University at Albany, SUNY Institutional Animal Care and Use Committee (IACUC). Mice were housed in 12-h light/dark cycle with access to water and dry food. C57BL/6J (JAX #000664) mice were purchased from The Jackson Laboratory. The colony starters for the Gli1tm2Alj/J (Gli1lz) (JAX #008211) mice and Gli1tm3(cre/ERT2)Alj/J (Gli1-CreERT2) (JAX #007913) mice were provided to us by Alexandera Joyner. The Gli1lz/wt littermates were crossed to generate Gli1lz/lz mice, null for Gli1 function (Bai et al., 2002). Gli1wt/wt littermates were used as controls for the Gli1lz/lz mice. To create double transgenic Gli1 reporter mice, Gli1-CreERT2 males were crossed with B6.Cg-Gt(ROSA)26Sortm9 (CAG-tdTomato)Hze/J (R26tdT) female mice to generate Gli1-CreERT2; R26tdT double transgenic mice. Although both strains are on a mixed background, male Gli1lz/wt and Gli-CreERT2 males were crossed with C57BL/6J (JAX #000664) females for line maintenance. Mice were assigned a unique identifier between postnatal day 7 and 10 and were genotyped via PCR to detect LacZ for Gli1lz or Cre and tdTomato for Gli1-CreERT2; R26tdT.
For lineage tracing experiments, Gli1-CreERT2; R26tdT female mice were induced at 11 weeks old with 10 mg/kg tamoxifen (Sigma cat #T5648) dissolved in corn oil for three consecutive days. As Gli1-CreERT2; R26tdT mice do not show leaky expression (Kramann et al., 2015), non-induced mice were not evaluated. Surgeries were performed on mice 1 week after the first induction.
Only female mice were used for surgical manipulations due to their similarities in tissue architecture with human salivary glands (Amano et al., 2012; Maruyama et al., 2019). Adult female mice between 10- and 18-weeks old were used for surgeries. A unique identifier was assigned to each mouse either 7–10 days after birth or at the time of surgery. The mice were anesthetized using 100 mg/kg ketamine and 10 mg/kg xylazine by intraperitoneal injection from a stock concentration of 10 mg/mL ketamine and 1 mg/mL xylazine solution in sterile water for injection and were given 100 µL of buprenorphine at a concentration of 0.015 mg/mL by subcutaneous injection as an analgesic for post-operative pain management. An incision was made to visualize the main ducts of the submandibular and sublingual glands, Wharton’s and Bartholin’s ducts, respectively. A vascular clamp (Vitalitec/Peter’s Surgical) was applied to these ducts, and the incision was closed using two to four interrupted sutures. Mice were continuously monitored under anesthesia and post-operatively for pain, distress, and changes in weight for a minimum of 48 h following surgery. The ducts were ligated for either 7 or 14 days. Successful 14-day ligation was determined if the gland weight was between 30% and 70% of the average historical control gland weight, and samples outside of the range were excluded from downstream analyses; no cutoff criteria was used for 7-day ligation surgeries. As controls for the C57BL/6J experiments, time point zero (T0) mice were euthanized at 12-weeks old and had no surgical manipulations. Mock surgery control mice received an incision, and the ducts were located, but not ligated, and mice were euthanized at 14-days post-surgery. As controls for the Gli1lz mouse strain experiments non-surgically manipulated, age-, gender-, and strain-matched mice were used. As controls for the Gli1-CreERT2; R26tdT experiments 3-week post-induction mice were used. All mice were euthanized at the desired time point under CO2 with secondary cervical dislocation. The submandibular and sublingual glands were immediately weighed upon removal. All subsequent sample processing was performed blind with reference only to the unique identifiers.
Submandibular and sublingual salivary glands were removed together, weighed, and fixed in 4% paraformaldehyde (PFA) in 1X phosphate buffered saline (1X PBS) for 2 h at 4°C. Glands were washed in three consecutive 1X PBS washes, and incubated in an increasing sucrose gradient progressing from 5%, to 10%, to 15% sucrose for 1 h each and then transferred to 30% sucrose overnight at 4°C. After overnight incubation, glands were transferred to 15% sucrose, 50% tissue freezing media (Tissue Freezing Medium, Electron Microscopy Sciences) overnight at 4°C. Glands were transferred to tissue freezing medium and then frozen over liquid nitrogen. Ten-micron (10 µm) sections were collected on Superfrost Plus glass slides (Electron Microscopy Sciences) using a Leica CM 1860 cryostat. Slides were collected by taking three consecutive 10 µm sections per slide until the entire tissue was sectioned. Sections were dried for 30 min at room temperature and stored at −80°C. Slides were returned to room temperature before staining.
Slides were post-fixed in 4% PFA in 1X PBS for 18 min at room temperature or in pre-chilled 100% methanol at −20°C for 20 min followed by two 3-min rinses in 1X PBS. Slides were permeabilized in 0.5% Triton-X-100 in 1X PBS for 18 min, followed by two 3-min rinses in 1X PBS. Sections on slides were encircled with a hydrophobic pen and blocked using 0.5% Triton-X-100 in 3% bovine serum albumin (BSA) in 1X PBS (3%BSA-0.5%TX-PBS) for 60 min at room temperature in a humidified chamber. Primary antibodies were diluted in 3% BSA in 1X PBS and incubated on sections for 60 min at room temperature or overnight at 4°C. Primary antibodies were used as documented (Supplementary Table S1). Four 5-min rinses were performed after each round of primary antibody. Secondary antibodies (Jackson ImmunoResearch) were applied at a concentration of 1:500 in 3% BSA-0.5%TX-PBS for 60 min at room temperature, followed by two 2-min 1X PBS rinses. DAPI staining (Life Technologies, 1 ug/mL) was performed for 10 minutes followed by two additional 3-min 1X PBS rinses. Coverslips were applied with a glycerol-based mounting media containing 4% n-propyl gallate and triethylenediamine (DABCO) as an antifade (Nelson et al., 2013). Serial multiplexed immunohistochemistry (MX-IHC) was performed for a subset of Gli1-CreERT2; R26tdT slides, as described previously (Gerdes et al., 2013; Nelson et al., 2013; Gervais et al., 2015), with red fluorescence protein (RFP) and beta-tubulin III (βIII) in round one, vimentin, RFP, and CD31 in round two, and smooth muscle actin alpha (SMA) in round three.
Room temperature cryosections were fixed in Bouin’s Fixative (Polysciences) for 20 min. Slides were rinsed in cold tap water for 5 min and then stained in Weigert’s Iron Hematoxylin working solution (Polysciences) for 5 s. Slides were rinsed in cold tap water for 2 min and then stained in Beibrich Scarlett-Acid Fuchsin Solution (Polysciences) for 15 s. Slides were rinsed in deionized water (DI) until the water running off the slide was clear. Phosphotungstic/Phosphomolybdic acid (Polysciences) was added directly to the tissue sections, incubated for 10 min, and then drained onto a Kimwipe. Slides were stained in Aniline Blue (Polysciences) for 30 s and rinsed in DI three times for 30 s. 1% acetic acid (Polysciences) was pipetted directly onto the sections for 1 min, and then rinsed in DI. Slides were dehydrated in 95% and 100% ethanol for 2 min each, cleared in xylene for 2 min, and then mounted with Permount mounting medium (Electron Microscopy Sciences).
Room temperature cryosections were rehydrated in 1X PBS for 5 min. Slides were rinsed under running tap water for 1 min prior to staining. Slides were then stained with Hematoxylin 7211 (Richard-Allan Scientific) for 10 min and rinsed under tap water for 1 min and 30 s. Slides were then stained with Eosin-Y alcoholic (Richard-Allan Scientific) for 3 min and rinsed under tap water for 1 min. The slides were then incubated in 100% ethanol for 3 min, allowed to air dry briefly, and mounted with Permount mounting medium (Electron Microscopy Sciences).
Collagen hybridizing peptide (CHP) conjugated to 5-carboxyfluorescein (5-FAM) (Advanced BioMatrix) was solubilized per manufacturer’s recommendations. For 5-FAM-CHP multiplexing with fluorescent antibodies, slides were fixed in 100% pre-chilled methanol and immunostained. While slides were in the last 1X PBS wash or after slides were stained, imaged, and had coverslips removed, 5-FAM-CHP was diluted to 20 µM in 1X PBS and heated to 80°C on a heat block. After 5 min, 5-FAM-CHP was cooled in an ice water bath for 1 min. One tissue section per slide was encircled with a hydrophobic pen. Each tissue section received 40 µL of the 5-FAM-CHP working solution for 2 h at room temperature or overnight at 4°C. Slides were rinsed with two 2-min 1X PBS washes. When needed, TrueBlack (Biotium) was applied to quench autofluorescence. When TrueBlack was applied, it was diluted to 1X in 70% ethanol and was incubated on sections for 1 min at room temperature. Slides were then rinsed with two 2-min 1X PBS washes.
For quantification of each marker by IHC or histological stain, sections obtained from similar tissue depths and similar regions of the submandibular glands were compared. For H&E and Masson’s-stained whole gland images, both submandibular and sublingual glands were imaged. For both Masson’s trichrome and IHC both submandibular and sublingual glands were imaged but only the submandibular gland was included in quantifications. For IHC staining, sections at the approximate midpoint of the gland were stained, imaged, and quantified. On average, three images were collected, one from the proximal, medial, and distal regions of the submandibular gland from each of three tissue sections on a slide, for a total of 9 images per mouse. IHC sections were imaged on an Olympus IX-81 microscope with a Peltier-cooled CCD camera (Q imaging, RET 4000DC-F-M-12) using a PLAN S-APO 20X, 0.75 NA objective or Zeiss Z1 Cell Observer widefield with an Axio712 mono camera (Carl Zeiss, LLC) using a Plan-Neofluar 20X/0.50 Ph2 M27 objective. All images for one imaging session were captured using one microscope with identical microscope settings and regions containing folds, tears, or unequal staining were avoided. Sections stained with Masson’s trichrome were imaged for quantification on a Hamamatsu Nanozoomer 2.0 with a LX2000 light source and TDI camera. Sections stained with H&E and Masson’s trichrome were imaged on a Leica DM 4000 B LED scope with a DFC 310 FX RGB color camera (Leica) for whole gland stitched images and 10X magnification images.
All image processing and quantification was performed using the freeware, FIJI, an imaging processing package of ImageJ (Schindelin et al., 2012). To estimate the area positive for the expression of a marker, the image was background subtracted using rolling ball background subtraction. Images from each day imaged on the same microscope were equally thresholded, and FIJI was used to quantify the tissue area that was positive for a given marker relative to total tissue area. For fluorescent images, the green channel was used to detect the total issue area by autofluorescence with no background subtraction. Colocalization analysis was performed with background subtracted images using the image calculator with the AND function to determine area present in both images. The resulting AND images were equally thresholded, and FIJI was used to quantify the area co-positive for both markers.
For trichrome quantification, the submandibular gland regions of control and ligated glands were traced using the freeform shape tool in FIJI to measure to total submandibular gland area and create a region of interest (ROI), which was defined as the total tissue area. Within the ROI a color threshold was selected to detect the blue-stained area within the ROI and was performed equally across staining groups. Positive trichrome area was normalized to the total submandibular gland area and graphed as a percent of total area. On average between 2 and 3 sections were used per mouse with a minimum of 1 section per mouse. Sections were excluded from analysis if the tissue had uneven staining that would affect the accurate measurement of blue-stained area or had folds or tears affecting greater than 50% of the section.
All tabulation of quantifications was performed in Microsoft Excel with graphs generated and statistics run using GraphPad Prism. For comparison of two conditions, an unpaired two-tailed t-test was performed using GraphPad Prism version 9.4.1 for Mac or Windows, GraphPad Software, San Diego, California United States, www.graphpad.com. For comparisons of more than two conditions, an Ordinary one-way analysis of variance (ANOVA) with Tukey’s multiple comparisons test was performed using GraphPad Prism. For Gli1lz studies comparing both genotype and condition, a Two-Way ANOVA with Tukey’s multiple comparisons test was performed using GraphPad Prism. Statistical significance is indicated with stars over the corresponding bars with p values indicated in the figure legends. Analyses with no statistical significance (p > 0.05) are unmarked.
scRNA-seq of E16 stromal enriched submandibular salivary gland cells and Seurat-based clustering was previously performed (Moskwa et al., 2022). Raw data can be found on the Gene Expression Omnibus (GEO) repository under GSE181425. Percent of Gli1+ cells expressing Gli1 only, Gli1 and Pdgfra, Gli1 and Pdgfrb, or Gli1 and both Pdgfra and Pdgfrb were calculated from the whole dataset using an in-house generated function within R that calculates the number of cells expressing a given gene or combination of genes. Scripts can be accessed through GitHub: https://github.com/MLarsenLab.
Two ligated or mock surgery submandibular and sublingual glands were harvested, and excess fat and interstitial tissue was removed. The glands were then transferred to a dish containing 1X PBS, liberase TL Research Grade low Thermolysin (Roche), DNase I, and dispase and microdissected for 7 min. The sample was then incubated in a 37°C incubator for 15 min and triturated. After trituration, the sample was incubated for an additional 5 min in a 37°C incubator and triturated once more. A 15 mL conical tube was placed on ice and the entire sample was transferred to the conical tube and incubated for 10 min. The supernatant was isolated and transferred to a fresh conical tube and was centrifuged for 5 min at 450xg. The supernatant was removed and discarded, and the cell pellet was resuspended in isolation buffer composed of sterile-filtered Ca2+- and Mg2+-free 1X PBS, 0.1% bovine serum albumin, and 2 mM ethylenediaminetetraacetic acid. 5 μg of EpCAM-A647 (catalog: 118,212, BioLegend) and Ter119 (catalog: 50-133-27, eBioscience/ThermoFisher) was added to the cell suspension and incubated at 4°C for 10 min for subsequent depletion of epithelial and red blood cells, respectively. The cell suspension was washed using isolation buffer and centrifuged at 450xg for 5 min. The supernatant was discarded, and the cell pellet was resuspended in 1 mL of isolation buffer and 25 µL of sheep anti-rat Dynabeads, which bind to the EpCAM and Ter119 labeled cells, (catalog: 11,035, Invitrogen) before incubating on ice for 20 min on a rocker. The sample was placed on a microcentrifuge magnet for 2 min, and the supernatant was transferred to a fresh microcentrifuge tube to remove labeled epithelial and red blood cells. One additional epithelial and red blood cell depletion was performed. The sample was then depleted of dead cells using a dead cell removal kit (catalog: 130-090-101, Miltenyi Biotec) following manufacturer’s instructions. Cells were counted and resuspended to a concentration of 1,000 cells/μL. Following the manufacturer’s protocol for the Chromium Next GEM Single Cell 3′ Reagent kits v3.1, scRNA-seq libraries were generated.
Mock and ligated samples were sequenced (the ligated sample was sequenced on the Nextseq500 and mock on Nextseq 2000), and initial processing of the datasets was performed at the Center for Functional Genomics at the University at Albany. Initial processing steps included generating FASTQ files, aligning to the genome and generating counts files, which were completed using CellRanger version 6.0.1. Data files were imported using Seurat v3.1.5 in R v3.6.3 (R Project for Statistical Computing, 2021; Stuart et al., 2019). Clusters were calculated following the default pipeline (Seurat-Guided Clustering Tutorial, 2023). Dead or apoptotic cells were removed if >5% of unique molecular identifiers (UMIs) mapped to mitochondrial genes. Any cells with <200 or >9,000 genes were excluded to select for single cells. The processed datasets were saved as RDS files and imported into another workspace using Seurat v4.1.1 in R v4.1.2 (Hao et al., 2021). After importing, the mock and ligated datasets were merged. We were unable to perform dataset integration as there were dropout reads for important transcripts such as Gli1 and Pdgfrb. The functions ‘ElbowPlot’, principal component ‘Heatmaps’, and ‘JackStrawPlot’ were used to determine the principal components for unsupervised cluster modeling. Cell clusters were determined using linear dimensional reduction and visualization was performed using uniform manifold projection (UMAP). 14 dimensions were used for the merged dataset. Further analysis was performed on the stromal subset of this dataset containing cells expressing Pdgfra > 0.5, or Pdgfrb > 0.5, or Gli1 >0. For the stromal subset, 14 dimensions were used, generating 5 clusters. After clustering, the Seurat V4.1.1 package was used to create plots based on single-cell gene expression.
We performed ductal ligation surgeries on submandibular (SMG) and sublingual (SLG) glands of 12-week-old female C57BL/6J mice. We harvested glands from mice at 7-days post-ligation (7-Day) or 14-days post-ligation (14-Day) (Figure 1A). We compared the ligated glands to negative controls, including both unmanipulated glands harvested at the time of surgery, or time-point zero (T0), and glands subjected to a mock surgery with no ligation and harvested at the 14-day timepoint (Mock). Upon harvest, we weighed each SMG and SLG together and normalized their weight to total mouse weight. We found a 36% decrease in gland weight for 14-Day glands when compared to T0 controls and a 44.8% decrease in normalized gland weight when compared to Mock controls (Figure 1C). The average percent decrease in gland weight with ligation was similar in 7-Day and 14-Day ligated glands with normalized and unnormalized gland weight (Figure 1C and Supplementary Figure S1B). Following ligation injury, we detected acinar cell atrophy, as indicated by hematoxylin and eosin (H&E)-staining in comparable tissue regions with mock controls (Figure 1B and Supplementary Figure S1A), similar to previous reports (Cotroneo et al., 2008).
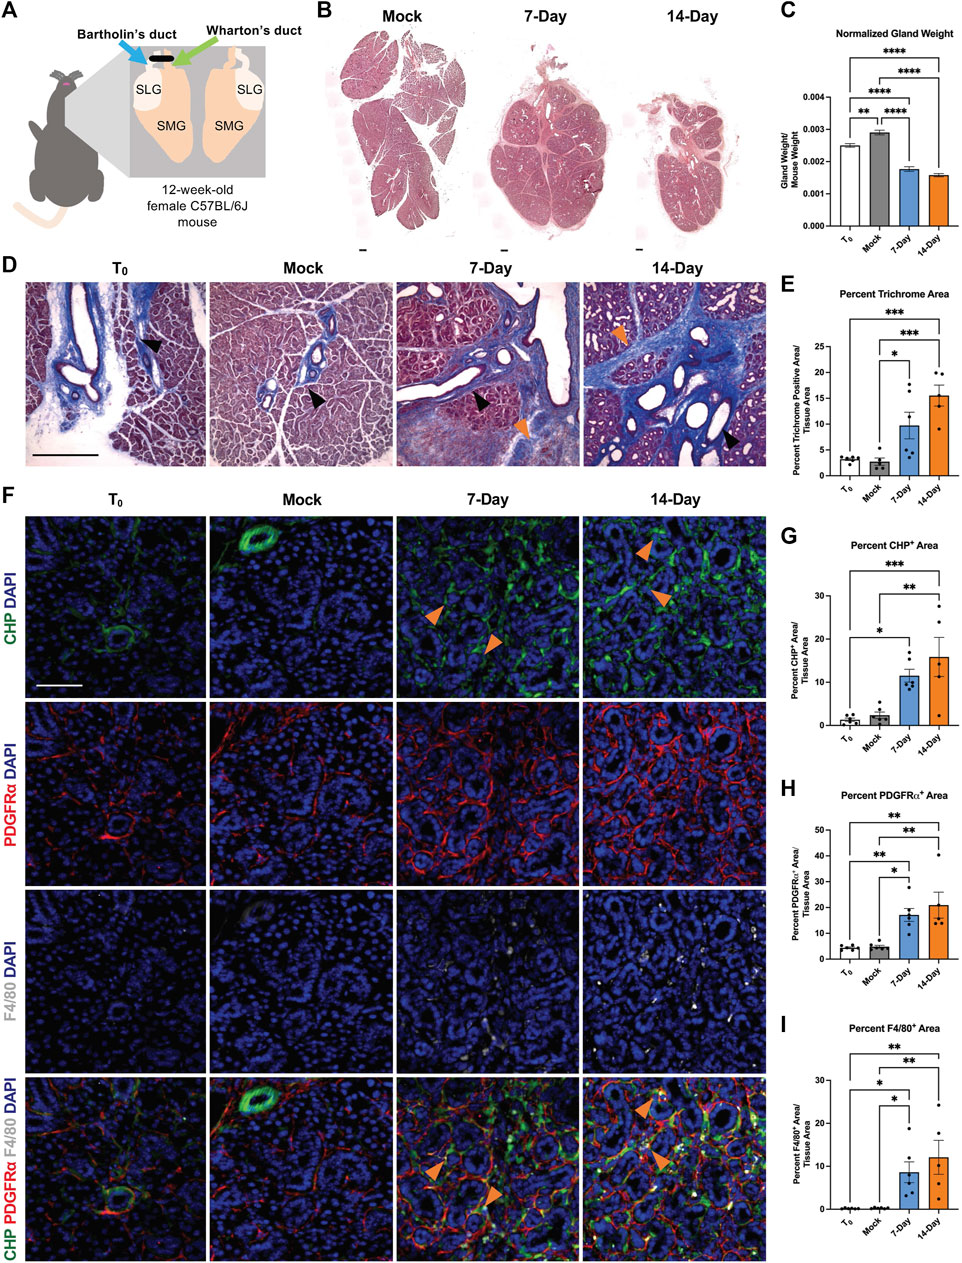
FIGURE 1. A progressive and dynamic fibrotic stromal response occurs in response to ductal ligation surgery. (A) Schematic of ductal ligation surgery showing clip application on the main ducts of the left submandibular and sublingual glands of a 12-week-old female C57BL/6J mouse. (B) H&E-stained whole gland images of 14-day mock (Mock), 7-Day ligated (7-Day), and 14-Day ligated (14-Day) mice. Scale bar 250 µm. (C) Gland weights normalized to mouse weight in time-point zero (T0), Mock, 7-Day, and 14-Day glands. N = 10, 25, 6, and 34, respectively. (D) Trichrome staining shows deposited ECM in blue with a trend of increasing ECM from 7- to 14-Day ligation. Black arrowheads denote regions of ECM present in both ligated and control conditions adjacent to large ducts and vasculature, while orange arrowheads denote expanded regions of ECM present only in the ligated glands, specifically in interlobular regions. (E) Quantification of percent trichrome area relative to tissue area in T0, Mock, 7-Day, and 14-Day glands. N = 6, 5, 6, 5 respectively. (F) Collagen hybridizing peptide (CHP), in green, labeling actively remodeled collagen, together with immunohistochemistry to detect platelet-derived growth factor receptor alpha (PDGFRα), in red, labeling a subset of the stromal cells, and F4/80, in grey, labeling macrophages with nuclear staining (DAPI) in blue. A subset of actively remodeled collagen is located near PDGFRα+ cells and/or F4/80+ macrophages (orange arrowheads). Quantification of percent stain area normalized to total tissue area for (G) CHP (H) PDGFRα and (I) F4/80 N = 6, 6, 6, 5 respectively. Error bars: S.E.M. One-way ANOVA followed by Tukey’s multiple comparisons test was performed using GraphPad Prism version 9.4.1. *p ≤ 0.05, **p ≤ 0.01, ***p ≤ 0.001, ****p ≤ 0.0001. Scale bars 100 µm.
Previous studies reported an increase in extracellular matrix (ECM) accumulation 7 days after ductal ligation (Woods et al., 2015); however, the extent of ECM deposition over time was not examined. To quantify the fibrotic progression following ligation we stained cryosections from T0, Mock, 7-Day, and 14-Day salivary glands using Masson’s trichrome and quantified the percent trichrome-positive area relative to total tissue area. We found a significant increase in ECM present in both 7-Day and 14-Day glands compared to Mock (Figure 1E and Supplementary Figure S1C). 7-Day glands had a three-fold increase in the percent trichrome-positive area, as compared with T0 and Mock glands, while 14-Day glands had an approximate five-fold increase in trichrome-positive area compared with T0 and Mock, and a 1.6-fold increase compared to 7-Day glands (Figure 1E). This suggests that the ECM accumulation trends upwards from 7-day ligation to 14-day ligation. Ductal ligation injury not only increased ECM accumulation around large ducts and vasculature, where it is normally present (Figure 1D, black arrowheads), but also expanded the ECM-positive area in regions between the epithelial lobes of the gland (Figure 1D, orange arrowheads).
Fibrosis is not only characterized by an increase in ECM deposition, it can also be associated with aberrant ECM remodeling, including active collagen remodeling (Li et al., 2018; Wu et al., 2021). To evaluate active collagen remodeling, we exposed tissue sections to a collagen hybridizing peptide (CHP) chemically conjugated to the fluorophore 5-carboxyfluorescein (5-FAM). The single chain collagen-like peptide hybridizes with denatured or partially denatured fibrillar collagen (Figure 1F top panel). In the SMG, we measured an approximately 10-fold increase in active collagen remodeling in 14-Day glands compared with T0 glands (Figure 1G). The increase in active collagen remodeling with 14-Day glands was present across distal, medial, and proximal regions of the gland and across medial and proximal regions in 7-Day glands (Supplementary Figure S2A–C). Together, this data indicates that there is an upward trend of increased ECM deposition and active collagen remodeling from 7-days to 14-days post-ligation.
The cells that contribute to the fibrotic response following salivary gland ductal ligation injury have not been defined. However, stromal cell populations are known to contribute to fibrosis directly or indirectly via changes in myofibroblast populations (Bonner, 2004; Li et al., 2018; Kishi et al., 2018; Buhl et al., 2020; Deng et al., 2021). We investigated the stromal cell population expressing platelet-derived growth factor receptor alpha (PDGFRα) because PDGFRα+ stromal cells produce ECM in the embryonic salivary gland (Moskwa et al., 2022) and drive fibrotic responses in other organs (Santini et al., 2020). To determine if PDGFRα+ cells expand following ductal ligation injury, we performed immunohistochemistry (IHC) and quantified the regions of the gland positive for PDGFRα signal. The percent area of the SMG positive for PDGFRα increased three-fold in 7-Day glands and four-fold in 14-Day glands compared to T0 and Mock controls (Figure 1F 2nd panel and Figure 1H). This increase was seen across the distal, medial, and proximal regions of the gland (Supplementary Figures S2D–F). These data suggest that the number of cells expressing PDGFRα increases in response to injury.
Macrophages are active contributors to injury and fibrosis by promoting inflammatory responses and stimulating ECM remodeling (Vasse et al., 2021). We quantified the percent gland area positive for the pan-macrophage membrane marker, F4/80, and found that the F4/80+ area increased 49-fold in 7-Day glands and 69-fold in 14-Day glands compared to T0 controls. However, the response was variable, with some glands retaining high levels of macrophages and some having lower levels (Figure 1F 3rd panel and Figure 1I). There was also regional variability in the F4/80+ area with higher levels of macrophages detected in the proximal region at 7-days and higher levels in the medial regions by 14-days with similar levels in the distal region at both time points (Supplementary Figures S2G–I). Although there was little colocalization of PDGFRα or F4/80 with CHP (Figure 1F 4th panel), PDGFRα+ cells and macrophages were in the proximity of the actively remodeled collagen (Figure 1F 4th panel, orange arrowheads), consistent with a contribution of both cell types to the fibrotic response and active ECM remodeling we detect in this model.
In many injury and disease conditions, it is the activation of specific stromal cell subpopulations that induces organ fibrosis (El Agha et al., 2017; Deng et al., 2021). A subset of the PDGFRβ+ stromal population that expresses the Shh effector protein, Gli1, has been implicated in organ fibrosis in the lung (Cassandras et al., 2020), bone marrow (Schneider et al., 2017; Manshouri et al., 2022), kidney, liver, and heart (Kramann et al., 2015). Gli1+ cells have previously been shown to comprise a small subset of the PDGFRβ+ cell population in the adult lung, heart, kidney, and bone chips and have been associated with PDGFRα+ expression in the heart and kidney (Kramann et al., 2015). Gli1+ cells have been identified as progenitor cells in the bone, the periodontal ligament, and the tendon enthesis (Schwartz et al., 2017; Hosoya et al., 2020). Although Shh was previously implicated in salivary gland development, Gli1 was not examined (Jaskoll et al., 2004). To determine if Gli1+ cells are present in the embryonic salivary gland, we utilized single-cell RNA-sequencing (scRNA-seq) data from a stromal-enriched fraction derived from embryonic day 16 salivary glands (E16) (Moskwa et al., 2022). We detected only 103 Gli1+ cells in the E16 SMG stroma (Figure 2A). They were not restricted to one cluster but were spread over several stromal subpopulations that are Pdgfra+ and/or Pdgfrb+, of which 48.54% co-express Pdgfra, 33.01% co-express both Pdgfra and Pdgfrb, and 8.74% co-express only Pdgfrb (Figures 2B–D). Gli1+ cells thus represent a small number of cells spread across multiple Pdgfra- and/or Pdgfrb-expressing stromal cell subpopulations in the developing salivary gland.
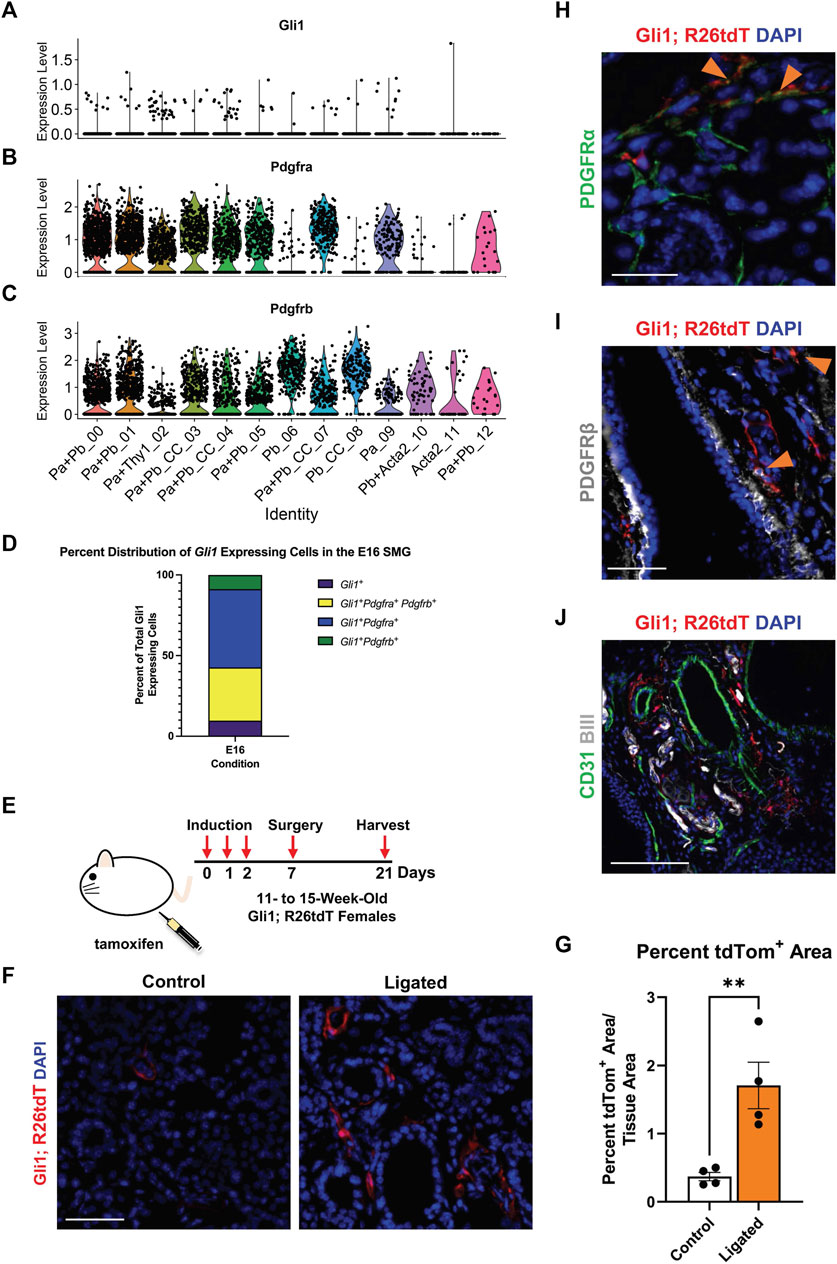
FIGURE 2. Gli1+ cells, which are a subset of PDGFRα+ and PDGFRβ+ cells, reside in the neurovascular region and expand with injury. Violin plots of stromal enriched scRNA-seq data subsetted for stromal cells from an embryonic day 16 (E16) SMG and SLG, highlighting cells expressing transcripts for (A) Gli1 (B) Pdgfra and (C) Pdgfrb. (D) Stacked bar graph depicting percentages of Gli1+ cells that express Gli1 only, Gli1 and Pdgfra, Gli1 and Pdgfrb, or Gli1, Pdgfra, and Pdgfrb from E16 stromal enriched scRNA-seq subsetted for stromal cells. (E) Schematic showing tamoxifen-induction scheme for 11- to 15-week-old adult female Gli1tm3(cre/ERT2)Alj/J; (CAG)ROSA26tdTomato (Gli1; R26tdT) lineage reporter mice harvested 3 weeks post-initial induction or with 14 day ductal ligation surgery performed 1 week after induction. (F) Immunohistochemistry (IHC) to detect Gli1; R26tdT lineage-traced cells (red) with nuclei (DAPI) in blue in control 3 week induced and 14 day ligated mouse SMG. (G) Quantification of percent Gli1; R26tdT+ area normalized to tissue area in control 3 week induced and 14 day ligated mouse SMG. (H) IHC to detect Gli1; R26tdT lineage-traced cells (red) in adult SMG together with PDGFRα (green) with nuclei (DAPI) in blue. Orange arrowheads represent colocalization of Gli1; R26tdT with PDGFRα. Scale bar 25 µm. (I) IHC to detect Gli1; R26tdT lineage-traced cells (red) in adult SMG together with PDGFRβ (grey) with nuclei (DAPI) in blue. Orange arrowheads represent colocalization of Gli1; R26tdT with PDGFRβ. (J) IHC to detect Gli1; R26tdT (red), CD31 (green), and βIII (grey), shows that Gli1; R26tdT-derived cells are enriched in areas near large ducts, large vessels, and nerve bundles in the proximal region of the adult SMG. Scale bar 100 µm. N = 4. Error bars: S.E.M. Statistical tests were performed using GraphPad Prism version 9.4.1. ** p ≤ 0.01.
To determine if Gli1+ cells are present and expand with injury in adult SMGs, we used a tamoxifen-inducible Gli1-CreERT2; R26tdT lineage tracing mouse (Figure 2E) to trace cells after ductal ligation injury. We used Gli1tm3(cre/ERT2)Alj/J (Gli1-CreERT2) mice, where tamoxifen-sensitive Cre recombinase is driven by the Gli1 promoter (Ahn and Joyner, 2004) crossed to a reporter strain B6.Cg-Gt(ROSA)26Sortm9 (CAG-tdTomato)Hze/J to label all Gli1-expressing cells prior to surgery. As three doses of tamoxifen were administered 1 week prior to surgery, cells that expressed Gli1 at the time of induction and all their subsequent progeny were labeled with tdTomato (tdTom). Glands were harvested 14 days after ductal ligation and compared to 3-week induced controls with no surgical manipulation. After ligation injury, there was a 4.6-fold increase in percent tdTom+ area compared to 3-week induced controls, suggesting that Gli1 cells respond to ductal ligation injury (Figures 2F,G). Next, to determine if the Gli1+ cells express PDGFRα and/or PDGFRβ in the adult, similar to the embryonic mice, we again used the tamoxifen-inducible Gli1-CreERT2; R26tdT lineage tracing mouse. In SMGs of mice 3 weeks after induction, we found that approximately 5% of the tdTomato-expressing cells also expressed PDGFRα (Figure 2H) and 8% of tdT-expressing cells also expressed PDGFRβ (Figure 2I) by IHC (Quantification not shown). Gli1+ cells have been shown to localize near nerves and vasculature in other organs (Zhao et al., 2014; Kramann et al., 2015). To determine where Gli1+ cells are located in the salivary glands of adult mice, we performed IHC in Gli1-CreERT2; R26tdT glands 3 weeks after tamoxifen induction. We identified Gli1 lineage-traced cells within regions close to βIII+ neurons and CD31+ endothelial cells in the vasculature (Figure 2J). These data indicate that Gli1+ cells are retained in adult salivary glands and can be detected near the neurovascular regions of homeostatic glands, similar to other organs (Kramann et al., 2015; Schneider et al., 2017).
As the Gli1 lineage-traced cells expanded with ductal ligation injury, they may have a function in the injury response. Previous studies of the mouse incisor demonstrated that Gli1+ cells contribute to injury repair (Zhao et al., 2014), suggesting that Gli1 cells may contribute to ligation injury. In addition, inhibition of Gli1 signaling can inhibit fibrosis (Schneider et al., 2017), and several components of hedgehog signaling including Smo, Ptch, Gli1, 2, and 3, were increased at the mRNA level, in the whole gland of male mice 6 days after ligation (Hai et al., 2010). We utilized a genetic null Gli1 line and examined the adult female SMG in a homeostatic state and after ligation injury. In the Gli1tm2Alj/J (Gli1lz) mouse strain, the zinc-finger domains and Gli1 N-terminal fragment in exons 2-7 are replaced with the LacZ gene (Bai et al., 2002), mice homozygous for LacZ (lz) are Gli1 null as they do not express a functional Gli1 protein (Figure 3A). We examined the weight of 10- to 19-week-old adult salivary glands from Gli1wt/wt, Gli1wt/lz, and Gli1lz/lz animals with no surgical manipulation (T0) and found no difference (Figure 3B). We next performed ductal ligation on 10- to 18-week-old Gli1wt/wt, Gli1wt/lz, and Gli1lz/lz salivary glands (Ligated). Although all ligated glands weighed significantly less than control glands (Figure 3B), there was no significant difference in gland weight as a function of genotype.
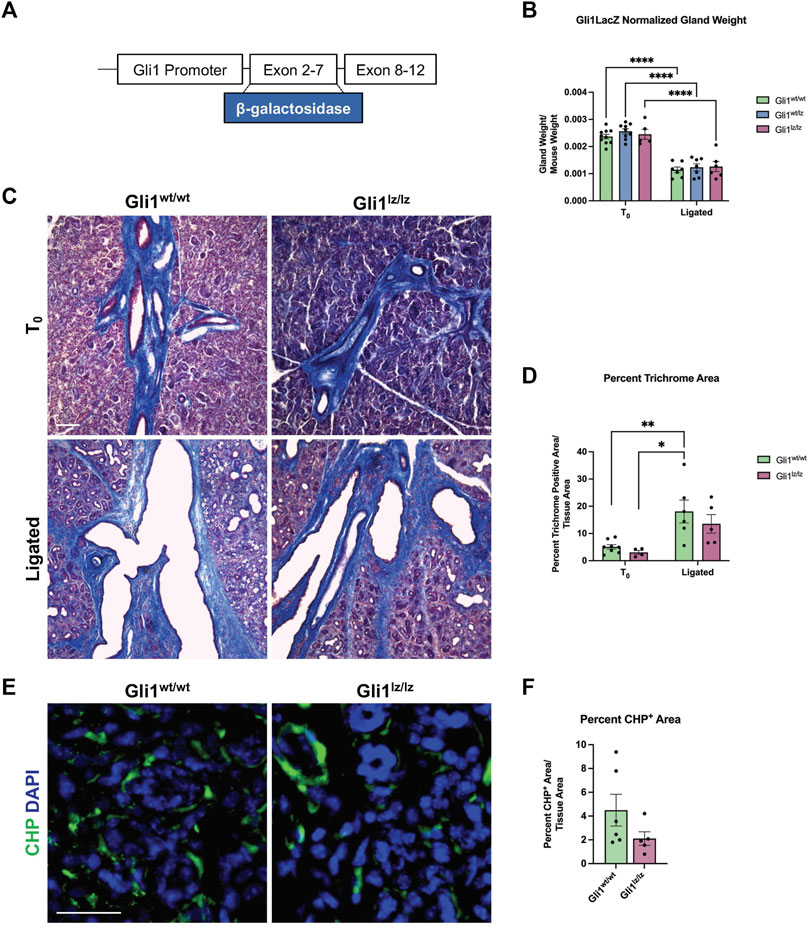
FIGURE 3. Genetic knockout of Gli1 reduces trend in ECM deposition and remodeling. (A) Schematic of the Gli1 gene, showing insertion of the beta-galactosidase gene (β-galactosidase) in exons 2-7 of the gene, resulting in a non-functional protein in Gli1lz/lz mice. (B) Left SMG and SLG weight normalized to mouse weight for control (T0) and 14-day ligated (Ligated) wild-type (Gli1wt/wt), heterozygous (Gli1lz/wt) and homozygous knockout (Gli1lz/lz) mice. N = 10, 9, and 5 for T0 and 7, 7, and 6 for Ligated, respectively. All T0 glands are statistically larger than ligated glands and for simplicity only comparisons from mice of the same genotype are displayed on the graph. Statistical Test: Two-way ANOVA followed by Tukey’s multiple comparisons test ****p ≤ 0.0001. (C) ×10 magnification of Masson’s trichrome-stained T0 and Ligated Gli1wt/wtand Gli1lz/lz mice. Scale bar 100 µm. (D) Quantification of percent trichrome area normalized to total tissue area. Statistical Test: Two-way ANOVA followed by Tukey’s multiple comparisons test *p ≤ 0.05 ** p ≤ 0.01. N = 8 and 4 for T0 and 6 and 5 for Ligated, respectively. (E) Immunohistochemistry on Ligated Gli1wt/wt and Gli1lz/lz knockout mice for collagen hybridizing peptide (CHP) in green with nuclear staining (DAPI) in blue. Scale bar 25 µm. (F) Quantification of percent stain area normalized to total tissue area for CHP. Statistical Test: Unpaired two-tailed t-test was performed. Ligated Gli1wt/wt N = 6 and Gli1lz/lz N = 5. Error bars: S.E.M. Statistical tests were performed using GraphPad Prism version 9.4.1.
To determine if ECM deposition after injury was affected by the lack of Gli1, we performed Masson’s trichrome and quantified the percent trichrome positive area to total tissue area for Gli1wt/wt and Gli1lz/lz T0 and Ligated mice. We found that Gli1wt/wt mice showed a 3.7-fold increase in trichrome positive area following ligation and Gli1lz/lz mice showed a 4.43-fold increase in trichrome positive area compared to the respective T0 controls (Figures 3C,D). There was no significant difference in ECM deposition across genotypes in T0 glands or ligated glands; however, Gli1lz/lz glands displayed a downward trend in ECM deposition compared to Gli1wt/wt (Figures 3C,D). Since active collagen remodeling occurs following ductal ligation, we examined active collagen remodeling in the absence of Gli1. We exposed ligated Gli1wt/wt and Gli1lz/lz gland sections to CHP, but we found no statistical difference in active collagen remodeling between the two genotypes within the whole gland or in regional analysis (Figures 3E,F and Supplementary Figures S3A–C). However, there was a trend downwards of active collagen remodeling in the proximal, medial, and distal regions of the gland, following a similar pattern to total ECM. This data suggests that Gli1 signaling has a minor role in inducing ECM production and collagen remodeling following ductal ligation injury.
Since the PDGFRα+ area of the gland expands with ligation, and some Gli1 cells express PDGFRα and β, we next determined if the absence of Gli1 affected the amount of PDGFRα+ or PDGFRβ+ cells in the SMG following ductal ligation. Relative to Gliwt/wt mice, Gli1lz/lz null mice showed no significant change in PDGFRα+ or PDGFRβ+ area within the total SMG, however in the medial region, PDGFRα+ area was significantly lower in Gli1lz/lz null mice compared to Gliwt/wt mice (Figure 4A panel 1, Figures 4B, C, E, and Supplementary Figures S4A–F). We also examined cells that may be affected by lack of Gli1 signaling in Gli1 cells, including F4/80+ macrophages (Figure 4A panel 2 and Figure 4D), βIII+ neurons (Figure 4F panel 1 and Figure 4G), and CD31+ endothelial cells (Figure 4F panel 2 and Figure 4H). We found no difference in percent area of the gland expressing these cell type markers in Gli1 null mice relative to WT mice following ligation. These data suggest that the lack of Gli1 signaling does not significantly alter specific subsets of stromal populations after ligation but does reduce the PDGFRa+ cells in the medial region of the gland.
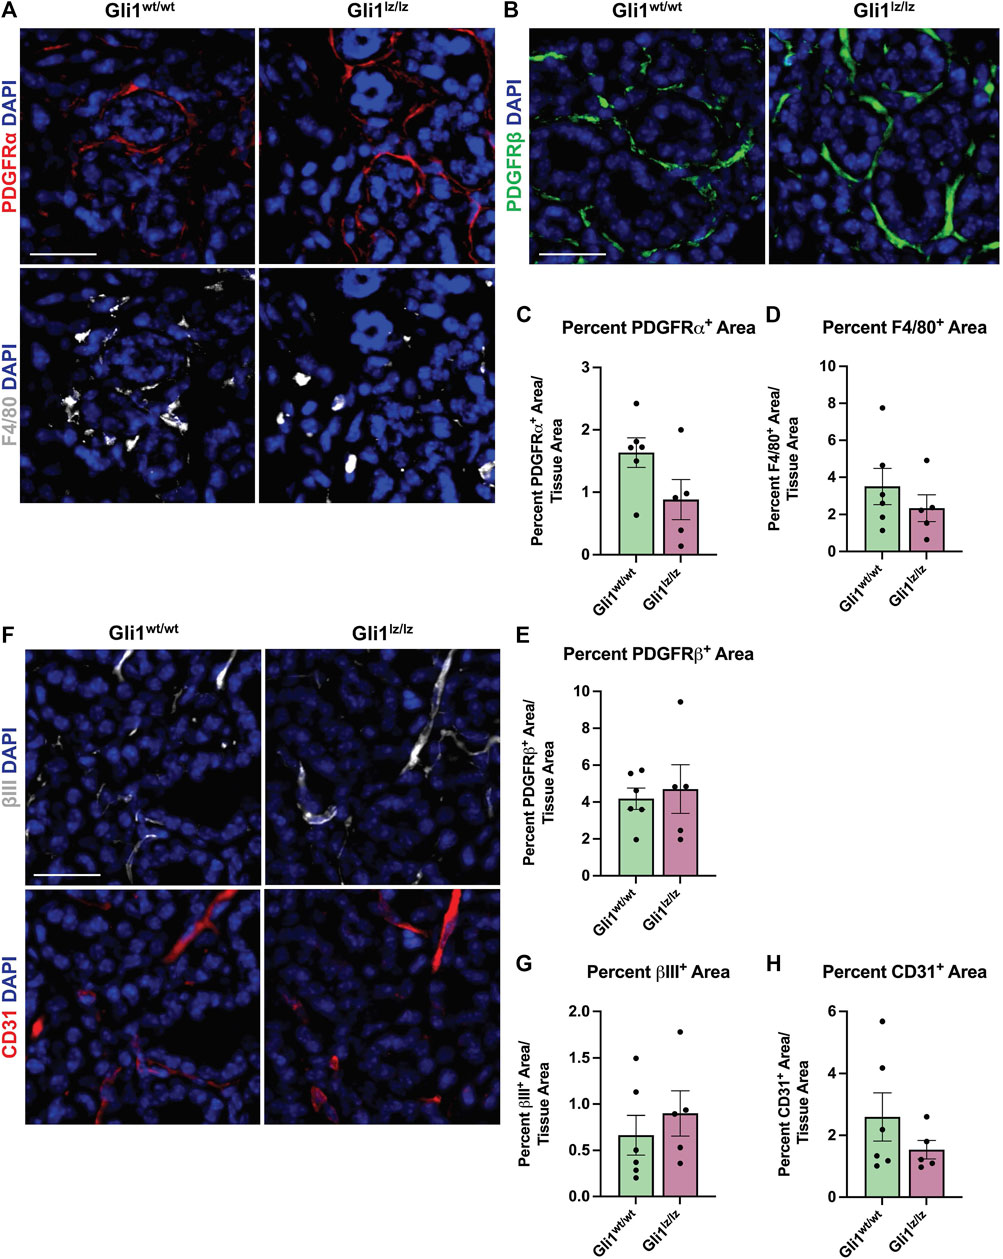
FIGURE 4. Genetic knockout of Gli1 does not significantly alter stromal cell populations. (A) Immunohistochemistry on 14-day ligated wild-type (Gli1wt/wt) and homozygous knockout (Gli1lz/lz) mice to detect platelet-derived growth factor receptor alpha (PDGFRα) in red and F4/80 in grey or (B) platelet-derived growth factor beta (PDGFRβ) in green or (F) beta-III tubulin (βIII) in grey and platelet endothelial cell adhesion molecule (CD31 or PECAM1) in red with nuclear staining (DAPI) in blue. Scale bar 25 µm. Quantification of percent stain area normalized to total tissue area for (C) PDGFRα (D) F4/80 (E) PDGFRβ (G) βIII and (H) CD31. Statistical Test: Unpaired two-tailed t-test was performed. Gli1wt/wt N = 6 and Gli1lz/lz N = 5. Error bars: S.E.M. Statistical tests were performed using GraphPad Prism version 9.4.1.
As previous studies in the kidney and heart found that Gli1+ cells expand following injury and can differentiate into myofibroblasts, thereby directly contributing to organ fibrosis (Kramann et al., 2015), we looked for evidence of expansion of Gli1-derived cells with expression of myofibroblast markers. To examine changes in cell fate, we used Gli1tm3(cre/ERT2)Alj/J (Gli1-CreERT2) mice. We induced 11- to 15-week-old female Gli1-CreERT2; R26tdT mice with tamoxifen 1 week prior to ductal ligation surgery (Figure 2E). Since Gli1 or Gli1-derived cells can undergo a myofibroblast conversion in response to injury, we looked for myofibroblast differentiation using the classic myofibroblast marker, smooth muscle alpha actin (SMA). We examined cells that expressed Gli1 at the time of ligation or were derived from such cells based on their tdTomato expression and performed IHC to detect SMA but found no significant change in colocalization between Gli1-derived cells and SMA in the whole gland or regionally (Figures 5A,B). Additionally, in the whole gland, we detected no significant change in SMA following ligation (Supplementary Figure S1D), suggesting that stromal cells in general and Gli1-expressing cells specifically, may not undergo a conventional myofibroblast conversion during ductal ligation injury. However, as a subset of myofibroblasts have been reported to express the mesenchymal marker vimentin (Bagalad et al., 2017), we performed IHC to detect vimentin and measured the colocalization with tdTomato. Overall, vimentin area did not significantly change with ligation injury (Supplementary Figure S1E). However, we measured a 1.4-fold significant increase in colocalization between vimentin and Gli1-lineage traced cells following ductal ligation with 16% of Gli1-derived cells expressing vimentin in the whole gland (Figures 5C,D) and regional differences in the distal and medial regions of the gland (Supplementary Figures S5A–C). These data reveal that a small subset of Gli1-derived cells increase vimentin in response to injury, which may be indicative of these Gli1+ cells undergoing a partial myofibroblast transition.
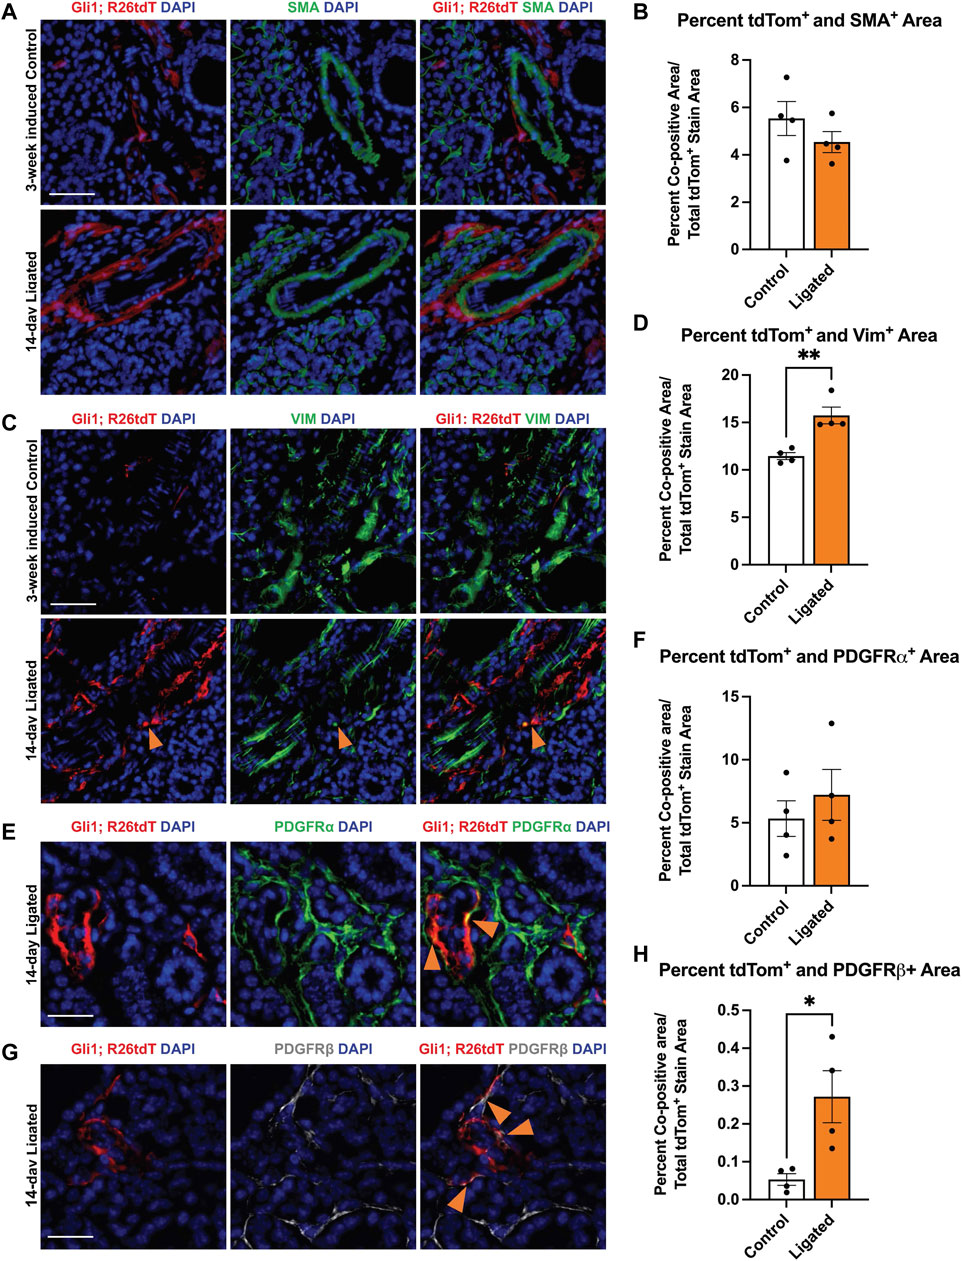
FIGURE 5. Gli1-linage traced cells show increased colocalization with vimentin and PDGFRβ after ligation injury. Immunohistochemistry (IHC) to detect Gli1; R26tdT-lineage traced cells (red) in SMG together with (A) SMA (green) or (C) vimentin (green) with nuclei (DAPI) in blue in 3-week induced control (Control) or 14-day ligated (Ligated) mice. Quantification of Gli1; R26tdT lineage traced cells with (B) SMA and (D) vimentin. IHC to detect Gli1; R26tdT-lineage traced cells (red) in SMG together with (E) PDGFRα (green) or (G) PDGFRβ (grey) with nuclei (DAPI) in blue in 14-day Ligated mice. Orange arrows represent colocalization between Gli1; R26tdT+ cells and PDGFRα or β. Quantification of Gli1; R26tdT lineage-traced cells with (F) PDGFRα and (H) PDGFRβ, showing a significant increase in colocalization between Gli1; R26tdT and PDGFRβ. N = 4. Scale bars 50 µm. Error bars: S.E.M. Statistical Test: Unpaired two-tailed t-test was performed using GraphPad Prism version 9.4.1. * p ≤ 0.05 and **p ≤ 0.01.
Since Gli1+ cells are a subset of the Pdgfra and Pdgfrb population in the embryonic gland and in other organs, we used IHC to determine if the Gli1-derived cells themselves show altered colocalization of PDGFRα or PDGFRβ following ductal ligation injury. We performed IHC to detect colocalization of PDGFRα and PDGFRβ in Gli1 lineage-traced cells. While the Gli1 and PDGFRα co-positive cells were maintained at similar levels in control and ligated mice in the whole gland (Figures 5E,F), the Gli1-derived cell population that co-expresses PDGFRβ expanded five-fold post-ligation surgery in the whole gland (Figures 5G,H), with a significant increase being present in the distal region of the gland and an increasing trend in the medial and proximal regions of the gland (Supplementary Figures S2D–F). These data indicate that a subset of Gli1-derived cells increase PDGFRβ expression in response to ductal ligation injury.
To identify transcriptome changes that may correlate with the partial change in phenotype following injury, we performed scRNA-seq on 14 day-ligated and mock glands. The two datasets were merged and analyzed to look at differentially expressed genes between similar cell populations in ligated or mock samples, and specifically the Gli1-expressing population. Using Seurat and limiting to 14 dimensions, we generated uniform manifold approximation and projections (UMAPs) to produce 12 clusters of cells and primarily used these known marker genes: Pdgfra (stromal cells), Pdgfrb (stromal cells), Pecam1 (endothelial cells), Adgre1 (macrophage cells), Col1a1 (fibroblast cells), Epcam (epithelial cells), Ptprcap (immune cells), Cd74 (macrophages), and Gli1 to identify the populations (Supplementary Figures S6A–C). Gli1 cells were mainly localized to cluster 3, which was composed of stromal cells (Supplementary Figure S6C). Overall, there were very few cells expressing Gli1 in both conditions, but we did detect an increase in the number of Gli1-expressing cells following ligation (mock n = 17 cells, ligated n = 57 cells), consistent with IHC analysis. Using only the Gli1 expressing cells, the relative abundance of cells expressing Gli1 only were similar between mock and ligated glands, while the percent of Gli1 cells expressing both Pdgfra and Pdgfrb increased with ligation to 56% (Figure 6A). As others have previously reported that Adgre1+ macrophages are hedgehog-responsive cells (Zhao et al., 2020; Zhao et al., 2023), we also looked for Gli1 cells co-expressing Gli1 and Adgre1, and found that there were 2 cells in the stromal enriched ligated glands, but none in the mock glands (Figure 6A). We performed differential gene expression analysis using the Gli1 cells and examined a subset of genes expressed in the matrisome. The matrisome is defined as known and bioinformatically predicted ECM components and associated proteins which includes collagens, proteoglycans, and glycoproteins (Hynes and Naba, 2012; Naba et al., 2012; Naba et al., 2016; Naba et al., 2017; Shao et al., 2020). Since specific components of the matrisome are increased in fibrotic responses, we decided to see if changes were present in Gli1 cells (Ghatak et al., 2015; Ricard-Blum et al., 2018). There was not a change in expression of ECM genes encoding fibrillar proteins or glycoproteins by Gli1-expressing cells following ductal ligation (Supplementary Table S2).
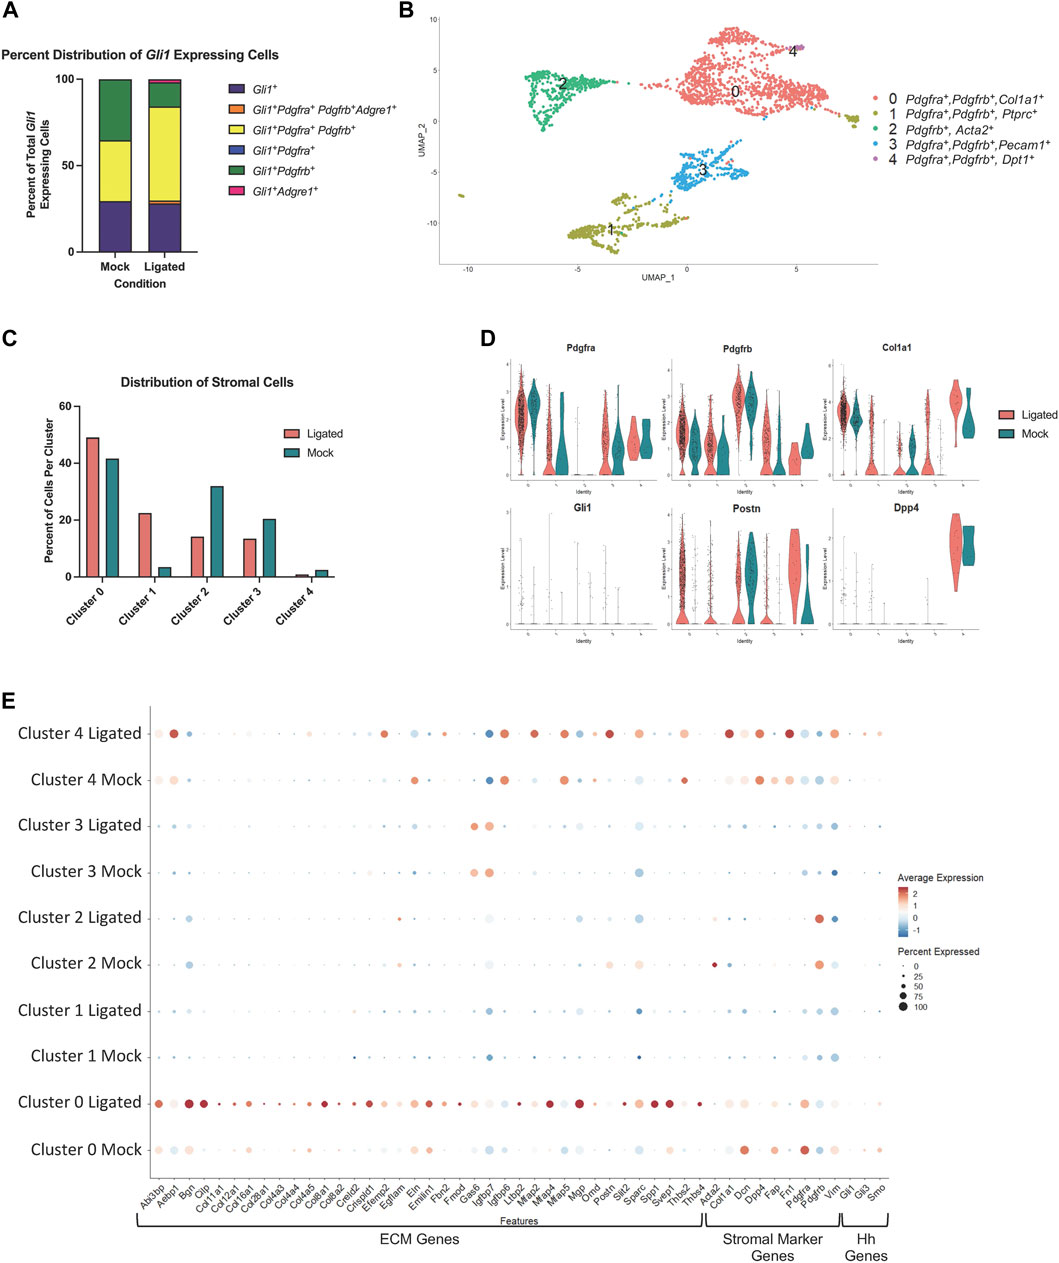
FIGURE 6. A Pdgfra expressing subset of stromal cells shows enrichment of ECM and ECM-associated genes after ductal ligation injury. (A) Stacked bar graph showing the proportion of Gli1+ cells that express Gli1 only, Gli1, Pdgfra, Pdgfrb, and Adgre1, Gli1, Pdgfra, and Pdgfrb, Gli1 and Pdgfra only, Gli1 and Pdgfrb only, and Gli1 and Adgre1 only in 14-day mock (Mock) and 14-day ligated (Ligated) glands. (B) UMAP from stromal cells subsetted based on expression of the stromal cell identity markers Pdgfra, Pdgfrb, and/or Gli1. (C) Bar graph showing the percent distribution of stromal cells, which was calculated by dividing the number of cells in each cluster by the total number of cells in their sample of origin and multiplying by 100. (D) Violin plots showing expression levels of Pdgfra, Pdgfrb, Col1a1, Gli1, Postn, and Dpp4 in Mock and Ligated glands. (E) Dot plot showing expression levels and percent of cells expressing ECM-associated genes that were differentially expressed in cluster 0 post-ligation.
Since Gli1-expressing cells appear to have only a minor contribution to ductal ligation-induced salivary gland fibrotic responses and do not display increased expression of fibrillar collagens or proteoglycans after ligation, we wanted to determine which cell population(s) may be responsible for the extracellular matrix deposition. Using a matrisome genelist (Naba et al., 2012), a heat map was generated to display significantly increased genes in clusters based on sample origin and we found that cells in cluster 3 highly express many genes in the matrisome categories of collagens, proteoglycans, and glycoproteins, suggesting they directly contribute to the fibrotic injury (Supplementary Figure S6D). Interestingly, cluster 3 is a Pdgfra+ and Pdgfrb+ stromal cell population (Supplementary Figure S6C), suggesting that the stromal fibroblasts may be responsible for ECM production.
As there is known heterogeneity among stromal fibroblast cells (Deng et al., 2021; Zou et al., 2021) we subsetted the stromal populations based on expression of Pdgfra, Pdgfrb, or Gli1 to create a new stromal only dataset, which consists of 5 subpopulations (Figure 6B). To examine any changes in abundance of cell clusters following ligation injury, we calculated the percent of cells per sample and cluster using the stromal subsetted data. Clusters 0 and 1 displayed increased percentages of cells in ligated glands compared to mock glands, while clusters 2, 3, and 4 had a higher percentage of cells in mock glands compared to ligated glands (Figure 6C). Known stromal genes and significantly differentially expressed marker genes were used to identify stromal subpopulations (Supplementary Table S3). While many of the clusters expressed Pdgfra and Pdgfrb, Cluster 0 expressed the highest levels of Pdgfra and cluster 2, the highest levels of Pdgfrb. Cluster 0 showed high levels of expression of Col1a1 and Postn, while cluster 4 showed increased expression of Postn and Dpp4, which are both known to contribute to fibrosis in other contexts (Figure 6D) (Chen et al., 2020; Deng et al., 2021). To identify which ECM genes were significantly altered (q score <0.05) following ligation injury we used the “FindAllMarkers” command in Seurat to compare differential gene expression tables with the matrisome gene list. We found the highest expression of ECM genes and the largest changes in gene expression in cluster 0 (Supplementary Tables S3, S4). We then used the “dotplot” command in Seurat to examine the differentially expressed matrisome genes from cluster 0 that were increased in 14 day-ligated cells relative to mock control along with stromal marker genes (Figure 6E). The difference in matrisome gene expression levels suggests that cluster 0 is the stromal cell subset that contributes most significantly to the ductal ligation-induced fibrotic response. Gli1-expressing cells were detected in cluster 0 but at very low levels. As Gli1 is activated by Gli3, downstream of Smoothened (Smo), cells in which Gli1 is active should show Gli3 and Smo expression. Gli1+, Gli3+, and Smo+ cells represent less than 50% of the total cells in cluster zero, and the number and average expression of Smo and Gli3 decrease with ligation. In cluster 4, the percentage of the population that expresses Gli3 and Smo increased with ligation, and the levels of Gli3 and Smo also increased, but this subpopulation contains few cells. These data support our conclusion that the Gli1-expressing cell population has a minor contribution to the fibrotic response following ductal ligation and that the Pdgfra+, Pdgfrb+, and Gli1- stromal cells are the primary fibrogenic cells.
Here we report that ligation of the salivary gland ducts produces a progressive salivary gland fibrotic response accompanied by dynamic ECM remodeling up to 14 days after injury. We investigated whether Gli1 signaling contributes to this ductal ligation-induced fibrotic response. Contrary to prior reports that implicated Gli1 signaling in other fibrosis models (Kramann et al., 2015; Schneider et al., 2017; Cassandras et al., 2020), knockout of Gli1 had little effect on the fibrotic response following ductal ligation, although there was a downward trend in ECM deposition and active collagen remodeling following Gli1 knockout, suggesting a minor contribution for Gli1 signaling. Lineage tracing of cells that expressed Gli1 at the time of injury showed a small increase in the number of Gli1-derived cells, consistent with scRNA-seq, and a fraction of these cells showed increased co-expression of vimentin and PDGFRβ; however, few of them showed increased matrisomal gene expression by scRNA-seq. Given the extensive fibrotic response, the very small numbers of Gli1+ cells, and the inconsistent transcriptional responses of these cells, it is unlikely that the Gli1+ cells are significant contributors to this fibrotic response. We also examined cells expressing PDGFRα and/or β, as these cells have previously been identified as fibrogenic (Kocabayoglu et al., 2015; Li et al., 2018; Buhl et al., 2020; Kikuchi et al., 2020; Santini et al., 2020; Ajay et al., 2022; Yao et al., 2022). In wild-type glands, there was an increase in PDGFRα+ stromal cells after injury. scRNA-seq of stromal cells obtained from glands following 14-day mock surgery or 14 days ligation surgery revealed a subset of Pdgfra/Pdgfrb cells, representing the largest stromal cell cohort, which show increased expression and an increased diversity of matrisomal-associated gene expression. This dynamic ECM remodeling was accompanied by a more than 10-fold increase in macrophages by tissue area. Together our results are consistent with the hypothesis that a PDGFRα/PDGFRβ stomal cell subset is the major fibrogenic cell type and suggest that macrophages contribute to the dynamic ECM remodeling that occurs in this reversible fibrotic injury model.
Our results imply that Gli1 signaling and Gli1 cells have only a minor contribution to salivary gland ductal ligation-induced fibrosis. In our model, while their expansion with injury is 4.6-fold, the number of Gli1+ cells is very small, and we found little evidence of a SMA-associated myofibroblast conversion in the Gli1-derived cells. While Acta2/SMA has historically been used as a myofibroblast marker, and SMG stromal cells can undergo a myofibroblast conversion in organoid culture and express SMA (Moskwa et al., 2022), other studies have found that in vivo, SMA is not always associated with collagen production in fibrotic models (Sun et al., 2016). In addition, ECM mRNA expression is being used to define myofibroblasts with increasing availability of scRNA-seq data (Kuppe et al., 2021). scRNA-seq showed no consistent increase in expression of matrisome genes by Gli1 expressing cells. Few Gli1+ cells expressed Acta2, the gene encoding SMA, and little to no Gli1-derived cells co-expressed SMA at the protein level, nor did SMA protein itself increase after ligation. The increased expression of vimentin, which can be expressed by myofibroblasts, and increased PDGFRβ in a subset of Gli1 lineage-traced cells, suggests that some Gli1-expressing cells may undergo a partial myofibroblast conversion. Although our data suggest that Gli1 signaling is not required for ductal ligation-induced fibrosis, there may be other contributions of Gli1-expressing cells to the fibrotic response in this model, which remains to be investigated.
Although we found little evidence that Gli1-expressing cells or Gli1 signaling is important in ductal ligation induced fibrosis, Gli1 signaling may contribute to regenerative responses, which can be investigated in this model following removal of the clip. Targeted expression of Shh in keratin 5+ (Krt5+) ductal epithelium protected male mice from hyposalivation (Hai et al., 2014). Gene delivery of Shh into mice after irradiation prevented damage to microvasculature and parasympathetic innervation (Hai et al., 2016), and its delivery to mice was shown to restore salivary function and preserve interactions with macrophages following irradiation damage (Zhao et al., 2023; 2020). Similar results were seen in irradiated minipigs (Hu et al., 2018). As Gli1+ cells in the mouse incisor are progenitor cells that populate the dental mesenchyme in homeostasis and after injury (Zhao et al., 2014), and Gli1+ cells regenerate the pancreas following ligation (Mathew et al., 2014), Gli1+ cells may contribute to salivary gland regeneration after SMG ductal ligation.
PDGFRs were previously shown to have an important function in salivary gland development in regulation of branching morphogenesis upstream of fibroblast growth factor (Yamamoto et al., 2008), and we previously showed that PDGFRα-expressing cells support salivary gland proacinar organoid differentiation (Moskwa et al., 2022). However, there is little understood regarding the contribution of PDGFRα-expressing cells in adult salivary gland. Our finding that Pdgfra/Pdgfrb-expressing cells express ECM genes in ligated salivary glands is consistent with scRNA-seq studies of kidney fibrosis that identified similar populations of cells producing ECM (Kuppe et al., 2021). The fact that these cells do not express Acta2 but do express Col1a1 and other matrisomal genes is also consistent with recent studies indicating that fibroblasts can transition through a pre-activated proto-myofibroblast state before reaching a functional myofibroblast state (Younesi et al., 2021). As the ductal ligation model is reversible, the fibroblasts may not fully differentiate into myofibroblasts. The Pdgfra/Pdgfrb subsets might also be referred to as fibrogenic cells on the basis of their expression of matrisomal genes at the mRNA level (Sun et al., 2016). Our data shows that subsets of stromal cells expressing Pdgfra and Pdgfrb expand and express an increased diversity of matrisome genes after ligation injury. Our data suggest that the Pdgfra/Pdgfrb-expressing cells are important fibrogenic cells in salivary gland ductal ligation-induced fibrosis. Their contribution to other injury and disease states involving fibrosis will be important to examine as well as their contribution to regenerative responses.
Examining the differentially expressed genes in Pdgfra and Pdgfrb-expressing cells by scRNA-seq in 14 day-ligated glands compared to mock glands revealed many genes with known associations with fibrosis or disease, including periostin (Postn), secreted phosphoprotein 1 (Spp1), and latent TGF-β binding protein-2 (Ltbp2). Postn is an ECM protein that has been shown to be upregulated in pulmonary fibrosis, fibroblasts in keloids, and patients with liver cirrhosis (Chen et al., 2020; Deng et al., 2021; Du et al., 2022). Upregulation of Spp1 has been shown to increase atrial fibrosis by activating the TGFβ signaling pathway (Du et al., 2022). Ltbp2 is involved in the TGFβ signaling pathway as it is required for the formation of the large latent complex (LLC) which binds latent TGFβ to the ECM (Munger et al., 1997) and is secreted by myofibroblasts in pulmonary fibrosis (Enomoto et al., 2018). TGFβ is a master regulator of fibrosis, and inhibition of TGFβ1 signaling in ductal ligation-induced fibrosis of the mouse SMG 7 days after injury significantly reduced the fibrotic response (Woods et al., 2015). Macrophages are known to produce TGFβ in response to injury (Meng et al., 2016), and the macrophages may be a source of TGFβ in this model. Consistent with this, we previously reported on a persistent fibrotic injury following partial gland resection, in which TGFβ1 levels and numbers of M2-like macrophages were significantly increased (O’Keefe et al., 2020). Elevated levels of TGFβ signaling are also detected in patients with Sjögren’s syndrome (Sisto et al., 2018), which is also associated with fibrosis in some patients (Bookman et al., 2011; Llamas-Gutierrez et al., 2014; Leehan et al., 2018). PDGFR+ cells are known to respond to TGFβ signaling and have been implicated in fibrosis in the kidney, bone marrow, liver, heart and the lung (Klinkhammer et al., 2018). Receptor tyrosine kinase inhibitors affecting PDGFRs have shown promise in reducing fibrosis in the bone marrow, liver and lung (Klinkhammer et al., 2018). Future studies focusing on PDGFR-expressing cells and PDGFR signaling could define contributions of these stromal subsets and PDGFR signaling in driving fibrosis and in regenerative responses.
The datasets presented in this study can be found in online repositories. The names of the repository/repositories and accession number(s) can be found below: https://www.ncbi.nlm.nih.gov/geo/, GEO SuperSeries GSE226640.
The animal study was reviewed and approved by University at Albany, SUNY, Institutional Animal Care and Use Committee (IACUC).
AA, KO, VG, JRT, SF, DN, and ML designed experiments, analyzed data, assembled figures, and wrote and revised the manuscript. AA, KO, VG, JRT, SF, and NM performed experiments, analyzed the data, and revised the manuscript. CC and JuT performed experiments and revised the manuscript. All authors contributed to the article and approved the submitted version.
Research reported in this publication was supported by the National Institute Of Dental and Craniofacial Research of the National Institutes of Health under Award Numbers F31DE029688 to AA, R01DE027953, R01DE030626, and R21DE027571 to ML and the RNA Institute for RNA Fellows funding for AA and JoT. The content is solely the responsibility of the authors and does not necessarily represent the official views of the National Institutes of Health.
The authors thank Stephen Higgins and Paul Higgins, Ph.D. from Albany Medical College for imaging and allowing use of the Nanozoomer. The authors would also like to thank Paolo Forni, Ph.D. for use of his Leica DM 4000 B LED microscope system. The authors are grateful to Catherine Ovitt, Ph.D., Antigone McKenna, DVM and Timothy Quinn for helpful suggestions, insight, and assistance in implementing this surgical model and Alexandra Joyner, Ph.D. for providing the Gli1-CreERT2 and Gli1lz founder mice.
The authors declare that the research was conducted in the absence of any commercial or financial relationships that could be construed as a potential conflict of interest.
All claims expressed in this article are solely those of the authors and do not necessarily represent those of their affiliated organizations, or those of the publisher, the editors and the reviewers. Any product that may be evaluated in this article, or claim that may be made by its manufacturer, is not guaranteed or endorsed by the publisher.
The Supplementary Material for this article can be found online at: https://www.frontiersin.org/articles/10.3389/fcell.2023.1190386/full#supplementary-material
Ahn, S., and Joyner, A. L. (2004). Dynamic changes in the response of cells to positive hedgehog signaling during mouse limb patterning. Cell. 118, 505–516. doi:10.1016/j.cell.2004.07.023
Ajay, A. K., Zhao, L., Vig, S., Fujiwara, M., Thakurela, S., Jadhav, S., et al. (2022). Deletion of STAT3 from Foxd1 cell population protects mice from kidney fibrosis by inhibiting pericytes trans-differentiation and migration. Cell. Rep. 38, 110473. doi:10.1016/j.celrep.2022.110473
Amano, O., Mizobe, K., Bando, Y., and Sakiyama, K. (2012). Anatomy and histology of rodent and human major salivary glands: -overview of the Japan salivary gland society-sponsored workshop-. ACTA Histochem. Cytochem. 45, 241–250. doi:10.1267/ahc.12013
Bagalad, B. S., Mohan Kumar, K. P., and Puneeth, H. K. (2017). Myofibroblasts: Master of disguise. J. Oral Maxillofac. Pathol. 21, 462–463. doi:10.4103/jomfp.JOMFP_146_15
Bai, C. B., Auerbach, W., Lee, J. S., Stephen, D., and Joyner, A. L. (2002). Gli2, but not Gli1, is required for initial Shh signaling and ectopic activation of the Shh pathway. Development 129, 4753–4761. doi:10.1242/dev.129.20.4753
Bonner, J. C. (2004). Regulation of PDGF and its receptors in fibrotic diseases. Cytokine and Growth Factor Rev. 15, 255–273. doi:10.1016/j.cytogfr.2004.03.006
Bookman, A. A. M., Shen, H., Cook, R. J., Bailey, D., McComb, R. J., Rutka, J. A., et al. (2011). Whole stimulated salivary flow: Correlation with the pathology of inflammation and damage in minor salivary gland biopsy specimens from patients with primary Sjögren’s syndrome but not patients with sicca. Arthritis and Rheumatism 63, 2014–2020. doi:10.1002/art.30295
Buhl, E. M., Djudjaj, S., Klinkhammer, B. M., Ermert, K., Puelles, V. G., Lindenmeyer, M. T., et al. (2020). Dysregulated mesenchymal PDGFR-β drives kidney fibrosis. EMBO Mol. Med. 12, e11021. doi:10.15252/emmm.201911021
Cassandras, M., Wang, C., Kathiriya, J., Tsukui, T., Matatia, P., Matthay, M., et al. (2020). Gli1+ mesenchymal stromal cells form a pathological niche to promote airway progenitor metaplasia in the fibrotic lung. Nat. Cell. Biol. 22, 1295–1306. doi:10.1038/s41556-020-00591-9
Chen, K., Li, Z., Zhang, M., Wang, B., Peng, T., Shen, Y., et al. (2020). miR-876 inhibits EMT and liver fibrosis via POSTN to suppress metastasis in hepatocellular carcinoma. BioMed Res. Int. 2020, e1964219. doi:10.1155/2020/1964219
Cotroneo, E., Proctor, G. B., Paterson, K. L., and Carpenter, G. H. (2008). Early markers of regeneration following ductal ligation in rat submandibular gland. Cell. Tissue Res. 332, 227–235. doi:10.1007/s00441-008-0588-6
Deng, C. C., Hu, Y. F., Zhu, D. H., Cheng, Q., Gu, J. J., Feng, Q. L., et al. (2021). Single-cell RNA-seq reveals fibroblast heterogeneity and increased mesenchymal fibroblasts in human fibrotic skin diseases. Nat. Commun. 12, 3709. doi:10.1038/s41467-021-24110-y
Du, X., Liu, T., Shen, C., He, B., Feng, M., Liu, J., et al. (2022). Anti-fibrotic mechanism of SPP1 knockdown in atrial fibrosis associates with inhibited mitochondrial DNA damage and TGF-β/SREBP2/PCSK9 signaling. Cell. Death Discov. 8, 246. doi:10.1038/s41420-022-00895-9
El Agha, E., Kramann, R., Schneider, R. K., Li, X., Seeger, W., Humphreys, B. D., et al. (2017). Mesenchymal stem cells in fibrotic disease. Cell. Stem Cell. 21, 166–177. doi:10.1016/j.stem.2017.07.011
Enomoto, Y., Matsushima, S., Shibata, K., Aoshima, Y., Yagi, H., Meguro, S., et al. (2018). LTBP2 is secreted from lung myofibroblasts and is a potential biomarker for idiopathic pulmonary fibrosis. Clin. Sci. (Lond) 132, 1565–1580. doi:10.1042/CS20180435
Gerdes, M. J., Sevinsky, C. J., Sood, A., Adak, S., Bello, M. O., Bordwell, A., et al. (2013). Highly multiplexed single-cell analysis of formalin-fixed, paraffin-embedded cancer tissue. Proc. Natl. Acad. Sci. U. S. A. 110, 11982–11987. doi:10.1073/pnas.1300136110
Gervais, E. M., Desantis, K. A., Pagendarm, N., Nelson, D. A., Enger, T., Skarstein, K., et al. (2015). Changes in the submandibular salivary gland epithelial cell subpopulations during progression of Sjögren’s syndrome-like disease in the NOD/ShiLtJ mouse model: Epithelial subpopulations in NOD/ShiLtJ mouse. Anatomical Rec. 298, 1622–1634. doi:10.1002/ar.23190
Ghatak, S., Maytin, E. V., Mack, J. A., Hascall, V. C., Atanelishvili, I., Moreno Rodriguez, R., et al. (2015). Roles of proteoglycans and glycosaminoglycans in wound healing and fibrosis. Int. J. Cell. Biol. 2015, 834893. doi:10.1155/2015/834893
Gonzalez, A. C. de O., Costa, T. F., Andrade, Z. de A., and Medrado, A. R. A. P. (2016). Wound healing - a literature review. Bras Dermatol 91, 614–620. doi:10.1590/abd1806-4841.20164741
Gurtner, G. C., Werner, S., Barrandon, Y., and Longaker, M. T. (2008). Wound repair and regeneration. Nature 453, 314–321. doi:10.1038/nature07039
Hai, B., Qin, L., Yang, Z., Zhao, Q., Shangguan, L., Ti, X., et al. (2014). Transient activation of hedgehog pathway rescued irradiation-induced hyposalivation by preserving salivary stem/progenitor cells and parasympathetic innervation. Clin. Cancer Res. 20, 140–150. doi:10.1158/1078-0432.CCR-13-1434
Hai, B., Yang, Z., Millar, S. E., Choi, Y. S., Taketo, M. M., Nagy, A., et al. (2010). Wnt/β-Catenin signaling regulates postnatal development and regeneration of the salivary gland. Stem Cells Dev. 19, 1793–1801. doi:10.1089/scd.2009.0499
Hai, B., Zhao, Q., Qin, L., Rangaraj, D., Gutti, V. R., and Liu, F. (2016). Rescue effects and underlying mechanisms of intragland Shh gene delivery on irradiation-induced hyposalivation. Hum. Gene Ther. 27, 390–399. doi:10.1089/hum.2016.005
Hao, Y., Hao, S., Andersen-Nissen, E., Mauck, W. M., Zheng, S., Butler, A., et al. (2021). Integrated analysis of multimodal single-cell data. Cell. 184, 3573–3587. doi:10.1016/j.cell.2021.04.048
Hosoya, A., Shalehin, N., Takebe, H., Fujii, S., Seki, Y., Mizoguchi, T., et al. (2020). Stem cell properties of Gli1-positive cells in the periodontal ligament. J. Oral Biosci. 62, 299–305. doi:10.1016/j.job.2020.08.002
Hu, L., Zhu, Z., Hai, B., Chang, S., Ma, L., Xu, Y., et al. (2018). Intragland Shh gene delivery mitigated irradiation-induced hyposalivation in a miniature pig model. Theranostics 8, 4321–4331. doi:10.7150/thno.26509
Hynes, R. O., and Naba, A. (2012). Overview of the matrisome—an inventory of extracellular matrix constituents and functions. Cold Spring Harb. Perspect. Biol. 4, a004903. doi:10.1101/cshperspect.a004903
Jaskoll, T., Leo, T., Witcher, D., Ormestad, M., Astorga, J., Bringas, P., et al. (2004). Sonic hedgehog signaling plays an essential role during embryonic salivary gland epithelial branching morphogenesis. Dev. Dyn. 229, 722–732. doi:10.1002/dvdy.10472
Kikuchi, A., Singh, S., Poddar, M., Nakao, T., Schmidt, H. M., Gayden, J. D., et al. (2020). Hepatic stellate cell-specific platelet-derived growth factor receptor-α loss reduces fibrosis and promotes repair after hepatocellular injury. Am. J. Pathology 190, 2080–2094. doi:10.1016/j.ajpath.2020.06.006
Kishi, M., Aono, Y., Sato, S., Koyama, K., Azuma, M., Abe, S., et al. (2018). Blockade of platelet-derived growth factor receptor-β, not receptor-α ameliorates bleomycin-induced pulmonary fibrosis in mice. PLOS ONE 13, e0209786. doi:10.1371/journal.pone.0209786
Klinkhammer, B. M., Floege, J., and Boor, P. (2018). PDGF in organ fibrosis. Mol. Aspects Med. 62, 44–62. doi:10.1016/j.mam.2017.11.008
Kocabayoglu, P., Lade, A., Lee, Y. A., Dragomir, A. C., Sun, X., Fiel, M. I., et al. (2015). β-PDGF receptor expressed by hepatic stellate cells regulates fibrosis in murine liver injury, but not carcinogenesis. J. Hepatology 63, 141–147. doi:10.1016/j.jhep.2015.01.036
Kramann, R., Schneider, R. K., DiRocco, D. P., Machado, F., Fleig, S., Bondzie, P. A., et al. (2015). Perivascular Gli1+ progenitors are key contributors to injury-induced organ fibrosis. Cell. Stem Cell. 16, 51–66. doi:10.1016/j.stem.2014.11.004
Kuppe, C., Ibrahim, M. M., Kranz, J., Zhang, X., Ziegler, S., Perales-Patón, J., et al. (2021). Decoding myofibroblast origins in human kidney fibrosis. Nature 589, 281–286. doi:10.1038/s41586-020-2941-1
Lau, I., Potluri, A., Ibeh, C. L., Redman, R. S., Paal, E., and Bandyopadhyay, B. C. (2017). Microcalcifications in stone-obstructed human submandibular gland are associated with apoptosis and cell proliferation. Arch. Oral Biol. 82, 99–108. doi:10.1016/j.archoralbio.2017.05.001
Leehan, K. M., Pezant, N. P., Rasmussen, A., Grundahl, K., Moore, J. S., Radfar, L., et al. (2018). Minor salivary gland fibrosis in Sjögren’s syndrome is elevated, associated with focus score and not solely a consequence of aging. Clin. Exp. Rheumatol. 36, 80–88.
Li, L., Zhao, Q., and Kong, W. (2018a). Extracellular matrix remodeling and cardiac fibrosis. Matrix Biol. SI Fibros. Mech. Transl. Aspects 68 (69), 490–506. doi:10.1016/j.matbio.2018.01.013
Li, R., Bernau, K., Sandbo, N., Gu, J., Preissl, S., and Sun, X. (2018b). Pdgfra marks a cellular lineage with distinct contributions to myofibroblasts in lung maturation and injury response. eLife 7, e36865. doi:10.7554/eLife.36865
Llamas-Gutierrez, F. J., Reyes, E., Martínez, B., and Hernández-Molina, G. (2014). Histopathological environment besides the focus score in Sjögren’s syndrome. Int. J. Rheumatic Dis. 17, 898–903. doi:10.1111/1756-185X.12502
Manshouri, T., Veletic, I., Li, P., Yin, C. C., Post, S. M., Verstovsek, S., et al. (2022). GLI1 activates pro-fibrotic pathways in myelofibrosis fibrocytes. Cell. Death Dis. 13, 481–514. doi:10.1038/s41419-022-04932-4
Maruyama, C., Monroe, M., Hunt, J., Buchmann, L., and Baker, O. (2019). Comparing human and mouse salivary glands: A practice guide for salivary researchers. Oral Dis. 25, 403–415. doi:10.1111/odi.12840
Mathew, E., Collins, M. A., Fernandez-Barrena, M. G., Holtz, A. M., Yan, W., Hogan, J. O., et al. (2014). The transcription factor GLI1 modulates the inflammatory response during pancreatic tissue remodeling. J. Biol. Chem. 289, 27727–27743. doi:10.1074/jbc.M114.556563
Meng, X., Nikolic-Paterson, D. J., and Lan, H. Y. (2016). TGF-Β: The master regulator of fibrosis. Nat. Rev. Nephrol. 12, 325–338. doi:10.1038/nrneph.2016.48
Moskwa, N., Mahmood, A., Nelson, D. A., Altrieth, A. L., Forni, P., and Larsen, M. (2022). Single-cell RNA sequencing reveals PDFGRα+ stromal cell subpopulations that promote proacinar cell differentiation in embryonic salivary gland organoids. Dev. Dev. 149, 200167. doi:10.1242/dev.200167
Munger, J. S., Harpel, J. G., Gleizes, P. E., Mazzieri, R., Nunes, I., and Rifkin, D. B. (1997). Latent transforming growth factor-beta: Structural features and mechanisms of activation. Kidney Int. 51, 1376–1382. doi:10.1038/ki.1997.188
Naba, A., Clauser, K. R., Ding, H., Whittaker, C. A., Carr, S. A., and Hynes, R. O. (2016). The extracellular matrix: Tools and insights for the “omics” era. Matrix Biol. 49, 10–24. doi:10.1016/j.matbio.2015.06.003
Naba, A., Clauser, K. R., Hoersch, S., Liu, H., Carr, S. A., and Hynes, R. O. (2012). The matrisome: In silico definition and in vivo characterization by proteomics of normal and tumor extracellular matrices. Mol. Cell. Proteomics 11, M111014647. doi:10.1074/mcp.M111.014647
Naba, A., Pearce, O. M. T., Del Rosario, A., Ma, D., Ding, H., Rajeeve, V., et al. (2017). Characterization of the extracellular matrix of normal and diseased tissues using proteomics. J. Proteome Res. 16, 3083–3091. doi:10.1021/acs.jproteome.7b00191
Nelson, D. A., Manhardt, C., Kamath, V., Sui, Y., Santamaria-Pang, A., Can, A., et al. (2013). Quantitative single cell analysis of cell population dynamics during submandibular salivary gland development and differentiation. Biol. Open 2, 439–447. doi:10.1242/bio.20134309
O’Keefe, K. J., DeSantis, K. A., Altrieth, A. L., Nelson, D. A., Taroc, E. Z. M., Stabell, A. R., et al. (2020). Regional differences following partial salivary gland resection. J. Dent. Res. 99, 79–88. doi:10.1177/0022034519889026
R Project for Statistical Computing (2021). R: The R Project for statistical computing. Avaliable At: https://www.r-project.org/(accessed 10 1, 23).
Ricard-Blum, S., Baffet, G., and Théret, N. (2018). Molecular and tissue alterations of collagens in fibrosis. Matrix Biol. SI Fibros. Mech. Transl. Aspects 68–69, 122–149. doi:10.1016/j.matbio.2018.02.004
Santini, M. P., Malide, D., Hoffman, G., Pandey, G., D’Escamard, V., Nomura-Kitabayashi, A., et al. (2020). Tissue-Resident PDGFRα+ progenitor cells contribute to fibrosis versus healing in a context- and spatiotemporally dependent manner. Cell. Rep. 30, 555–570. doi:10.1016/j.celrep.2019.12.045
Schindelin, J., Arganda-Carreras, I., Frise, E., Kaynig, V., Longair, M., Pietzsch, T., et al. (2012). Fiji: An open-source platform for biological-image analysis. Nat. Methods 9, 676–682. doi:10.1038/nmeth.2019
Schneider, R. K., Mullally, A., Dugourd, A., Peisker, F., Hoogenboezem, R., Van Strien, P. M. H., et al. (2017). Gli1+ mesenchymal stromal cells are a key driver of bone marrow fibrosis and an important cellular therapeutic target. Cell. Stem Cell. 20, 785–800. doi:10.1016/j.stem.2017.03.008
Schwartz, A. G., Galatz, L. M., and Thomopoulos, S. (2017). Enthesis regeneration: A role for Gli1+ progenitor cells. Development 144, 1159–1164. doi:10.1242/dev.139303
Seurat-Guided Clustering Tutorial (2023). Satijalab. Avaliable At: https://satijalab.org/seurat/articles/pbmc3k_tutorial.html (accessed 10 1, 23).
Shao, X., Taha, I. N., Clauser, K. R., Gao, Y., Tom), , and Naba, A. (2020). MatrisomeDB: The ECM-protein knowledge database. Nucleic Acids Res. 48, D1136–D1144. doi:10.1093/nar/gkz849
Sisto, M., Lorusso, L., Ingravallo, G., Tamma, R., Ribatti, D., and Lisi, S. (2018). The TGF- β 1 signaling pathway as an attractive target in the fibrosis pathogenesis of Sjögren’s syndrome. Mediat. Inflamm. 2018, 1965935–1966014. doi:10.1155/2018/1965935
Straub, J. M., New, J., Hamilton, C. D., Lominska, C., Shnayder, Y., and Thomas, S. M. (2015). Radiation-induced fibrosis: Mechanisms and implications for therapy. J. Cancer Res. Clin. Oncol. 141, 1985–1994. doi:10.1007/s00432-015-1974-6
Stuart, T., Butler, A., Hoffman, P., Hafemeister, C., Papalexi, E., Mauck, W. M., et al. (2019). Comprehensive integration of single-cell data. Cell. 177, 1888–1902. doi:10.1016/j.cell.2019.05.031
Sun, K. H., Chang, Y., Reed, N. I., and Sheppard, D. (2016). α-Smooth muscle actin is an inconsistent marker of fibroblasts responsible for force-dependent TGFβ activation or collagen production across multiple models of organ fibrosis. Am. J. Physiol. Lung Cell. Mol. Physiol. 310, L824–L836. doi:10.1152/ajplung.00350.2015
Vasse, G. F., Nizamoglu, M., Heijink, I. H., Schlepütz, M., van Rijn, P., Thomas, M. J., et al. (2021). Macrophage–stroma interactions in fibrosis: Biochemical, biophysical, and cellular perspectives. J. Pathology 254, 344–357. doi:10.1002/path.5632
Weiskirchen, R., Weiskirchen, S., and Tacke, F. (2019). Organ and tissue fibrosis: Molecular signals, cellular mechanisms and translational implications. Mol. Aspects Med. Pathophysiol. Organ Tissue Fibros. 65, 2–15. doi:10.1016/j.mam.2018.06.003
Woods, L. T., Camden, J. M., El-Sayed, F. G., Khalafalla, M. G., Petris, M. J., Erb, L., et al. (2015). Increased expression of TGF-β signaling components in a mouse model of fibrosis induced by submandibular gland duct ligation. PLOS ONE 10, e0123641. doi:10.1371/journal.pone.0123641
Wu, Y., Cao, Y., Xu, K., Zhu, Y., Qiao, Y., Wu, Y., et al. (2021). Dynamically remodeled hepatic extracellular matrix predicts prognosis of early-stage cirrhosis. Cell. Death Dis. 12, 163–215. doi:10.1038/s41419-021-03443-y
Wynn, T. (2008). Cellular and molecular mechanisms of fibrosis. J. Pathol. 214, 199–210. doi:10.1002/path.2277
Yamamoto, S., Fukumoto, E., Yoshizaki, K., Iwamoto, T., Yamada, A., Tanaka, K., et al. (2008). Platelet-derived growth factor receptor regulates salivary gland morphogenesis via fibroblast growth factor expression. J. Biol. Chem. 283, 23139–23149. doi:10.1074/jbc.M710308200
Yao, L., Rathnakar, B. H., Kwon, H. R., Sakashita, H., Kim, J. H., Rackley, A., et al. (2022). Temporal control of PDGFRα regulates the fibroblast-to-myofibroblast transition in wound healing. Cell. Rep. 40, 111192. doi:10.1016/j.celrep.2022.111192
Younesi, F. S., Son, D. O., Firmino, J., and Hinz, B. (2021). “Myofibroblast markers and microscopy detection methods in cell culture and histology,” in Myofibroblasts, methods in molecular Biology. Editors B. Hinz, and D. Lagares (New York, NY: Springer US), 17–47. doi:10.1007/978-1-0716-1382-5_3
Zhao, H., Feng, J., Seidel, K., Shi, S., Klein, O., Sharpe, P., et al. (2014). Secretion of Shh by a neurovascular bundle niche supports mesenchymal stem cell homeostasis in the adult mouse incisor. Cell. Stem Cell. 14, 160–173. doi:10.1016/j.stem.2013.12.013
Zhao, Q., Pan, S., Zhang, L., Zhang, Y., Shahsavari, A., Lotey, P., et al. (2023). A salivary gland resident macrophage subset regulating radiation responses. J. Dent. Res. 102, 536–545. doi:10.1177/00220345221150005
Zhao, Q., Zhang, L., Hai, B., Wang, J., Baetge, C. L., Deveau, M. A., et al. (2020). Transient activation of the Hedgehog-Gli pathway rescues radiotherapy-induced dry mouth via recovering salivary gland resident macrophages. Cancer Res. 80, 5531–5542. doi:10.1158/0008-5472.CAN-20-0503
Zhou, D., Tan, R. J., and Liu, Y. (2016). Sonic hedgehog signaling in kidney fibrosis: A master communicator. Sci. China Life Sci. 59, 920–929. doi:10.1007/s11427-016-0020-y
Keywords: extracellular matrix (ECM), salivary gland, Gli1, fibrosis, platelet derived growth factor receptor (PDGFR), collagen
Citation: Altrieth AL, O’Keefe KJ, Gellatly VA, Tavarez JR, Feminella SM, Moskwa NL, Cordi CV, Turrieta JC, Nelson DA and Larsen M (2023) Identifying fibrogenic cells following salivary gland obstructive injury. Front. Cell Dev. Biol. 11:1190386. doi: 10.3389/fcell.2023.1190386
Received: 20 March 2023; Accepted: 11 May 2023;
Published: 23 May 2023.
Edited by:
Joy Jiang, University of California, Davis, United StatesReviewed by:
David Dolivo, Northwestern University, United StatesCopyright © 2023 Altrieth, O’Keefe, Gellatly, Tavarez, Feminella, Moskwa, Cordi, Turrieta, Nelson and Larsen. This is an open-access article distributed under the terms of the Creative Commons Attribution License (CC BY). The use, distribution or reproduction in other forums is permitted, provided the original author(s) and the copyright owner(s) are credited and that the original publication in this journal is cited, in accordance with accepted academic practice. No use, distribution or reproduction is permitted which does not comply with these terms.
*Correspondence: Melinda Larsen, bWxhcnNlbkBhbGJhbnkuZWR1
†Present address: Kevin J. O’Keefe, Carl Zeiss Microscopy, LLC, White Plains, NY, United States; Sage M. Feminella, Albany Medical College, Albany, NY, United States; Nicholas L. Moskwa, The Jackson Laboratory, Farmington, Connecticut, United States; Carmalena V. Cordi, Department of Biological Sciences, Rensselaer Polytechnic Institute, Troy, NY, United States
Disclaimer: All claims expressed in this article are solely those of the authors and do not necessarily represent those of their affiliated organizations, or those of the publisher, the editors and the reviewers. Any product that may be evaluated in this article or claim that may be made by its manufacturer is not guaranteed or endorsed by the publisher.
Research integrity at Frontiers
Learn more about the work of our research integrity team to safeguard the quality of each article we publish.