
95% of researchers rate our articles as excellent or good
Learn more about the work of our research integrity team to safeguard the quality of each article we publish.
Find out more
ORIGINAL RESEARCH article
Front. Cell Dev. Biol. , 21 June 2023
Sec. Molecular and Cellular Pathology
Volume 11 - 2023 | https://doi.org/10.3389/fcell.2023.1174984
This article is part of the Research Topic Artificial Intelligence Applications in Chronic Ocular Diseases View all 31 articles
 Xu Han Shi1,2,3
 Li Dong1,2,3
 Rui Heng Zhang1,2,3
 Deng Ji Zhou4
 Sai Guang Ling4
 Lei Shao1,2,3Yan Ni Yan1,2,3
 Ya Xing Wang5
 Wen Bin Wei1,2,3*
Introduction: The purpose of this study is to assess the relationship between retinal vascular characteristics and cognitive function using artificial intelligence techniques to obtain fully automated quantitative measurements of retinal vascular morphological parameters.
Methods: A deep learning-based semantic segmentation network ResNet101-UNet was used to construct a vascular segmentation model for fully automated quantitative measurement of retinal vascular parameters on fundus photographs. Retinal photographs centered on the optic disc of 3107 participants (aged 50–93 years) from the Beijing Eye Study 2011, a population-based cross-sectional study, were analyzed. The main parameters included the retinal vascular branching angle, vascular fractal dimension, vascular diameter, vascular tortuosity, and vascular density. Cognitive function was assessed using the Mini-Mental State Examination (MMSE).
Results: The results showed that the mean MMSE score was 26.34 ± 3.64 (median: 27; range: 2–30). Among the participants, 414 (13.3%) were classified as having cognitive impairment (MMSE score < 24), 296 (9.5%) were classified as mild cognitive impairment (MMSE: 19–23), 98 (3.2%) were classified as moderate cognitive impairment (MMSE: 10–18), and 20 (0.6%) were classified as severe cognitive impairment (MMSE < 10). Compared with the normal cognitive function group, the retinal venular average diameter was significantly larger (p = 0.013), and the retinal vascular fractal dimension and vascular density were significantly smaller (both p < 0.001) in the mild cognitive impairment group. The retinal arteriole-to-venular ratio (p = 0.003) and vascular fractal dimension (p = 0.033) were significantly decreased in the severe cognitive impairment group compared to the mild cognitive impairment group. In the multivariate analysis, better cognition (i.e., higher MMSE score) was significantly associated with higher retinal vascular fractal dimension (b = 0.134, p = 0.043) and higher retinal vascular density (b = 0.152, p = 0.023) after adjustment for age, best corrected visual acuity (BCVA) (logMAR) and education level.
Discussion: In conclusion, our findings derived from an artificial intelligence-based fully automated retinal vascular parameter measurement method showed that several retinal vascular morphological parameters were correlated with cognitive impairment. The decrease in retinal vascular fractal dimension and decreased vascular density may serve as candidate biomarkers for early identification of cognitive impairment. The observed reduction in the retinal arteriole-to-venular ratio occurs in the late stages of cognitive impairment.
Cognitive impairment is the most common neurodegenerative disorder. Severe cognitive impairment that leads to Alzheimer’s disease and dementia ultimately manifests as an extensive loss of cognitive ability and imposes a tremendous burden on patients, economies, healthcare systems, and society (Prince et al., 2013; Alzheimer’s Association, 2022). The prevalence of cognitive impairment is high globally, its pathogenesis is complex, and there are no effective treatments currently available. However, evidence-based preventative methods to delay the development and progression of the disease have been proposed. Therefore, it is particularly important to diagnose and prevent cognitive impairments at an early stage (Yu et al., 2020). Currently, the diagnosis of cognitive impairment relies on the detection of serum and protein biomarkers, examination of cerebrospinal fluid (CSF), and positron emission tomography (PET) scans. As a result of their high cost, high level of risk to patients posed by invasive procedures, high level of technical difficulty, and considerable time costs, these diagnostic procedures are not appropriate for early large-scale screening of the disease (Jack et al., 2018; Polanco et al., 2018; Fish et al., 2019). Consequently, it is essential to discover effective, noninvasive, easy-to-implement, and cost-efficient biomarkers that can identify individuals with cognitive impairment in its early stages to allow timely interventions to prevent or delay the onset of dementia.
Vascular diseases are a risk factor for cognitive impairment (Reitz et al., 2011; Ngolab et al., 2019). Previous studies have demonstrated that vascular risk factors affecting the cerebral microcirculation may also play a significant role in cognitive impairment (Czakó et al., 2020; Sur et al., 2020). In the majority of cases characterized by cognitive impairment, variations in cerebral microvascular characteristics, such as increased tortuosity and arteriolar narrowing, and their association with degenerative changes have been reported (Liesz, 2019; O'Neill et al., 2021). There are many similarities between the retina and the brain, including their physiological characteristics, embryological origins, cellular resemblances, precise neuron cell layers, and microvasculature (Xie et al., 2023). As a window to the brain, the retina offers an excellent opportunity for researchers to investigate the pathogenesis of numerous ophthalmic and neurodegenerative diseases (Snyder et al., 2021; Zhang et al., 2021). Accumulating reports of retinal imaging utilizing various imaging techniques have revealed a correlation between retinal vascular alterations and the incidence of cognitive impairment (Patton et al., 2005; Ravi Teja et al., 2017; Ngolab et al., 2019; Wu et al., 2020). However, it has been determined that some of the findings of these reports are inconsistent, and so the relationship between retinal vascular parameters (e.g., retinal vascular diameter, retinal vascular tortuosity, etc.) and cognitive function remains controversial. We therefore conducted a study to further clarify the relationship between retinal vascular parameters and cognitive function.
Retinal fundus photography is a valuable technique for the quick assessment of retinal vascular characteristics. In the last two decades, computer programs developed for medical imaging have made it possible to perform a number of computer-based measurements on retinal fundus photography and ultimately demonstrate a relationship between retinal vascular changes and clinical characteristics (Cheung et al., 2011a; Dervenis et al., 2019). With the help of computer-assisted analysis programs, characteristics of the retinal vasculature, including fractal dimension, tortuosity, and vessel caliber, can be assessed quantitatively (Cheung et al., 2011b). Nevertheless, until recently, the majority of quantitative measurements have been carried out with the assistance of semiautomated retinal vessel measurements software, such as SIVA, IVAN, and VAMPIRE (Trucco et al., 2015; Chan et al., 2017; Czakó et al., 2020). These methods involve manual input and adjustment by qualified technicians, are time-consuming and prone to error, and are therefore inefficient (McGrory et al., 2018; Mautuit et al., 2022).
In recent years, deep learning algorithms have proven superior performance in assessing diabetic retinopathy and other retinal characteristics (Ting et al., 2017; Dong et al., 2022). In this study, we developed a deep learning model to perform fully automated segmentation of retinal vessels and quantitatively evaluate retinal vessel parameters, including retinal vessel diameter, retinal vessel curvature, retinal vessel fractal dimension, retinal vessel density, etc. We described retinal vascular characteristics that may serve as candidate biomarkers for the early identification of cognitive impairment as well as for the progression of the disease.
The Beijing Eye Study 2011 is a cross-sectional population-based study that was conducted in five communities in the urban district in northern central Beijing and in three communities in the village area in southern Beijing. A detailed description of the population and the design of the study has been provided previously (Liu et al., 2010; Yan et al., 2015). Among 4,403 eligible individuals, 3,468 individuals [response rate: 78.8%; females: 1,963 (56.6%); mean age: 64.6 ± 9.8 years; median age: 64 years; age range: 50–93 years] participated in the study. The Medical Ethics Committee of Beijing Tongren Hospital approved the study protocol, and all participants gave informed written consent in accordance with the Declaration of Helsinki. The ethics committee confirmed that all methods were performed in accordance with the relevant guidelines and regulations.
All examinations were conducted in the communities at either schoolhouses or community houses. Participants in the study were interviewed by trained research technicians and completed standardized questionnaires. The interview included standardized questions on demographics and socioeconomic factors, such as age, sex, education level, current smoking status, and systemic disease histories, such as arterial hypertension, diabetes mellitus, cardiovascular disease, and infarction (including both myocardial infarction and brain infarction). The education levels of participants were classified as “illiteracy,” “partial illiteracy with knowledge of some Chinese words,” “primary school education,” “middle school education,” and “college or higher education.”
The ophthalmic examination included measurement of best corrected visual acuity (BCVA) (logMAR), slit lamp-assisted biomicroscopy of the anterior segment of the eye, and fundus photographs centered on the optic disc (nonstereoscopic photograph of 45° of the central fundus; fundus camera type CR6-45NM; Canon Inc., Tokyo, Japan).
Cognitive function was assessed as a cognitive function score using the Mini-Mental State Examination (MMSE) (Folstein et al., 1975; Crum et al., 1993). The MMSE is a widely used and validated screening tool for detecting cognitive impairment. In clinical practice, it exhibits moderate to high sensitivity and specificity. It is particularly useful when comparing individuals across a wide age range (Folstein et al., 1975; Tombaugh and McIntyre, 1992). Cognitive impairment was defined as an MMSE score < 24, in line with previous studies that have demonstrated good sensitivity and specificity at this cut point. Further grading of cognitive impairment was performed. Mild cognitive impairment was defined as an MMSE score ranging between 19 and 23 points, moderate cognitive impairment was defined as an MMSE score ranging between 10 and 18 points, and severe cognitive impairment was defined as an MMSE score < 10 (Folstein et al., 1975; Tombaugh and McIntyre, 1992; Liew et al., 2009; Jonas et al., 2018).
A patient was included if he or she could be evaluated with questionnaires and MMSE scales. The exclusion criteria were as follows: unclear bilateral fundus photographs of the eyes (inability to clearly visualize the optic disc and retinal vasculature) that could not be analyzed; and inability to evaluate the patient with questionnaires and MMSE scales (Figure 1). The data of all the right eyes were included in the current study. If a clear fundus photograph of the right eye could not be obtained, the data from the left eye were included.
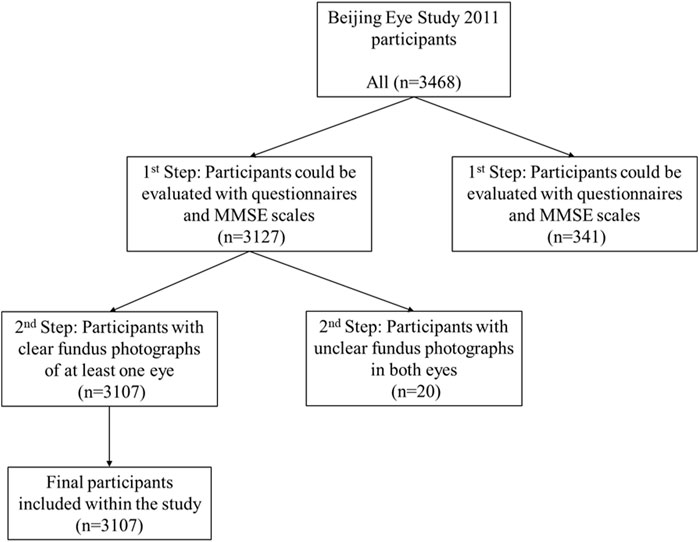
FIGURE 1. A flow chart of participant inclusion and exclusion criteria.
Participants’ color fundus photographs centered on the optic disc were analyzed. Included in the measurements were the retinal vascular branching angle, vascular fractal dimension, vascular average diameter, vascular average tortuosity, and retinal vascular density; the vascular average diameter and vascular average tortuosity were analyzed further in the annular regions 0.5–1.0 papillary diameter (PD) (C1), 1.0–1.5 PD (C2), 1.5–2.0 PD (C3), and 2.0–2.5 PD (C4) from the optic disc border. The vascular fractal dimension indicates the branching complexity of the retinal vascular network, reflecting the distribution of blood throughout the entire retinal circulation, with larger values indicating branching complexity (Liew et al., 2008). The retinal vascular average tortuosity indicates the degree of bend in retinal vessels. A smaller value indicates a flatter retinal vessel (Vilela et al., 2021). The annular area close to the optic disc provides a better measure of the diameter of the central retinal arterioles and venules. The annular region further from the optic disc, where there are more retinal vascular branches, can better demonstrate the branching complexity of the retinal vascular network and the degree of curvature of the retinal vessels.
In this study, we developed a computer image processing method using deep learning and computer vision technology to automatically segment retinal vessels and optic disc features on color fundus images based on the principle of human visual bionics and then extracted the centerline of blood vessels. Through the fusion of deep learning and computer vision technology, morphological parameters such as vascular diameter, vascular tortuosity, vascular fractal dimension, vascular branching angle, and vascular density can be calculated.
To enhance the fundus images, regions of interest (ROI) were extracted, denoised, normalized, and enhanced (Xu et al., 2019; Shao et al., 2021). After the channel separation of the image, the threshold segmentation method was used on the red (R) channel to obtain the preselected ROI. The threshold for the ROI preselection area was used as 1/3 of the average grey value of the R channel. Afterward, the preselected area was filtered based on its location, area, roundness, and other attributes. In order to filter the area, we selected the largest area in the ROI preselection area. Then, the boundary was determined using morphological operations (image opening operations) to obtain the final ROI. On the color fundus image, this area represented the effective fundus retinal imaging area, which reduced the interference of invalid areas such as the background on the subsequent feature recognition and segmentation process. In the following step, the noise was removed by applying a low-pass filter (median filtering) to reduce the noise resulting from the camera’s imaging procedures. Furthermore, the color, brightness, and size of the images were normalized by mean calibration and resampling to minimize the variability between images. Mean calibration means adjusting the mean value of brightness and color of each image to the mean of the statistical values of all images. Resampling is the linear difference method used to scale all images to a uniform size. Additionally, the images were enhanced using the contrast-limited adaptive histogram equalization (CLAHE) algorithm, which enhanced the retinal features on the images (Figure 2B).
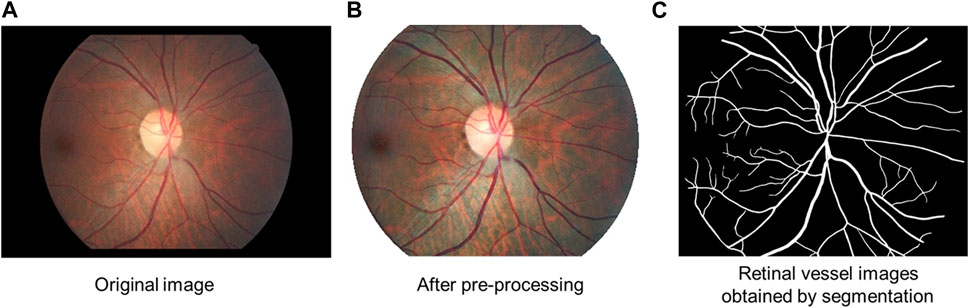
FIGURE 2. Diagram of retinal vessel segmentation. (A) Original image. (B) Image after pre-processing: regions of interest (ROI) were extracted, denoised, normalized, and enhanced. (C) Retinal vessel images obtained by segmentation.
In this study, we use a deep learning-based semantic segmentation network ResNet101-UNet to construct a retinal vessel segmentation model, which adopts a cross-layer connectivity architecture and is capable of extracting vessel features at different scales (Ronneberger et al., 2015). A semiautomatic machine-assisted annotation method is employed to annotate the sample. First, the color image is converted into grayscale according to the following formula.
And then the resulting grayscale image is segmented using the Otsu algorithm to obtain the dark region. As a next step, the segmented dark region is filtered based on the brightness and morphology of the blood vessels on the fundus image to obtain the preselected blood vessel region. For the extracted retinal vascular regions, we used a trained deep learning semantic segmentation model to distinguish between arteries and veins. Arterial vessels and venous vessels are distinguished and identified by the corresponding vessel color and brightness, as well as the connection and topological relationship between the vessels. Two senior attending ophthalmologists then manually corrected the segmentation, with one performing the initial correction and the other reviewing and performing any additional correction, to obtain the final image of the blood vessel sample (Figures 3, 4).

FIGURE 3. Identification of retinal arteries and veins.
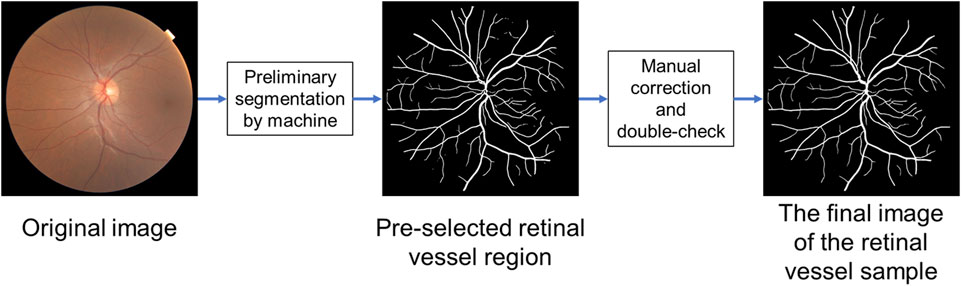
FIGURE 4. The process of labeling fundus photographs.
The labeled 755 case samples were divided into training and validation sets at a ratio of 655:100. The training set is input into the ResNet101-UNet network for model training, and the loss value of the network model is calculated with the validation set. The model parameters are adjusted and optimized according to the loss value. The training is stopped when the loss value no longer decreases to obtain the final vessel segmentation model. This model is then used to segment the blood vessels (Figure 2).
In this study, optic disc segmentation was divided into two steps. First, the optic disc is detected using the deep learning object detection method to determine its location. The object detection model consists of single shot detection (SSD), and the backbone of the network structure is ResNet50. The model is trained with 2,000 training samples from the publicly available online Kaggle competition dataset to obtain the optic disc detection model and to ultimately obtain the object detection frame of the optic disc. The center point of the object detection frame is used as the center point of the optic disc. Afterward, the boundary of the optic disc is determined based on the visual attention mechanism. The center point determined by optic disc localization is used as the origin for performing a polar coordinate transformation on the fundus image. On the polar coordinate image, the edge detection operator is employed to determine the edge of the optic disc in polar coordinates. Then, the image is inversely transformed to finally obtain the edge of the optic disc in the image coordinate system to achieve detailed segmentation of the optic disc. Finally, the minimum outer circle is fitted to the segmented optic disc area. The center of the outer circle is used to locate the center point of the final optic disc, and the diameter of the optic disc is defined by the diameter of the outer circle (Figure 5).
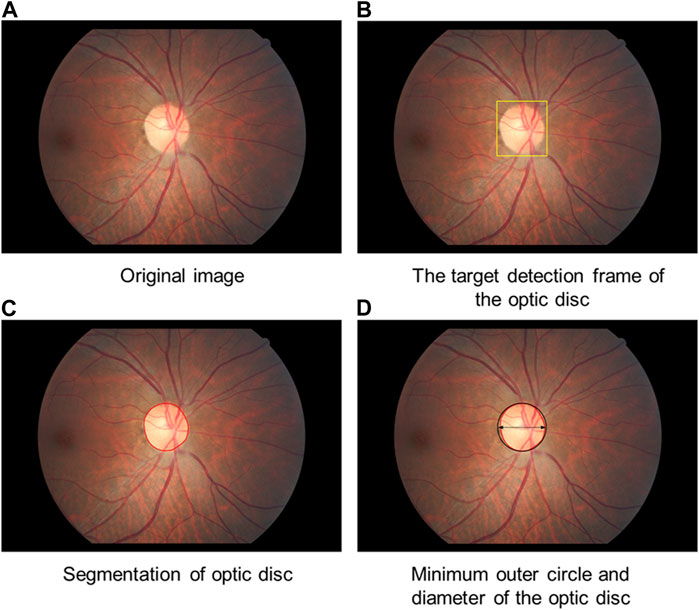
FIGURE 5. Diagram of optic disc segmentation. (A) Original image (B): The target detection frame of the optic disc is obtained. (C) The boundary of the optic disc is determined. (D) The minimum outer circle is fitted to the segmented optic disc area.
A sample of 100 manually annotated and reviewed color fundus images was used for the test, with each fundus image labeled separately for the retinal vessels and optic disc. Each manually annotated image was reviewed and corrected by two physicians, one for initial annotation or correction and the other for review and further correction. The automatic segmentation results of the model were compared with the manual annotation results. In units of pixels, accuracy (Acc), sensitivity, specificity, intersection over union (IoU), and DICE coefficients were calculated according to the following formulas. The results are shown in Table 1.
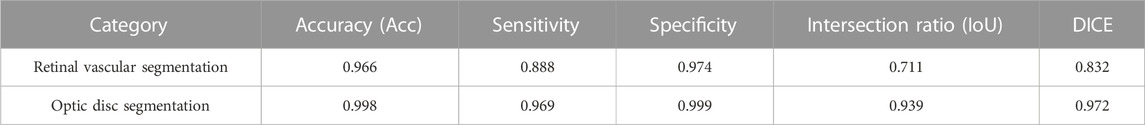
TABLE 1. Results of retinal vascular and optic disc segmentation accuracy evaluation.
Note:
TP (True Positives): The prediction indicates that the sample is positive, and the prediction is accurate.
TN (True Negatives): The prediction indicates that the sample is negative, and the prediction is accurate.
FP (False Positives): The prediction indicates that the sample is positive, but the prediction is incorrect.
FN (False Negatives): The prediction indicates that the sample is negative, but the prediction is incorrect.
This study focuses on calculating the vascular fractal dimension. The fractal dimension was calculated on the segmented images. The fundus images were divided into several grids with different edge lengths (ε). In the grid corresponding to each edge length, the number of grid boxes intersecting retinal vessels was calculated as (N). The number of grid boxes intersecting with retinal vessels in each case and the inverse of its side length was fitted to a straight line in logarithm form, and the resulting slope of the line was the fractal dimension, which is calculated as follows.
The retinal vascular density is a quantitative representation of the state and coverage of fundus blood flow and has important clinical significance for detecting the occurrence, progression, and diagnosis of fundus diseases. Retinal vascular density refers to the retinal vascular area per unit fundus area; that is, in a certain area, the ratio of the area of the retinal vasculature to the area of the fundus on the photograph can be expressed as:
where S′ is the extraction area of the retinal vasculature and S is the area of the fundus.
Using the retinal vessel image obtained by segmentation, a bidirectional morphological erosion operation was applied based on the vessel boundary to determine the vessel centerline. At a certain step interval along the vessel centerline, the straight line orthogonal to the tangent line to a point on the centerline could be found. The orthogonal straight line intersects the vessel boundary at two points. The Euclidean distance d between those two points was calculated, and d is the vascular diameter corresponding to the point. The vessel diameter is calculated at 5-pixel intervals in the vessel direction The average retinal vascular diameter refers to the average of the vascular diameters corresponding to the points on the centerline. With the center of the optic disc as the reference origin and the diameter of the optic disc as the reference distance, the average value of the vascular diameter corresponding to the points on the centerline of the vessels in different regions was calculated, which was taken as the average vascular diameter value of the region. Finally, the optic disc diameter of 1.5 mm was used as a reference for unit conversion of the vascular diameter values (Figure 6).
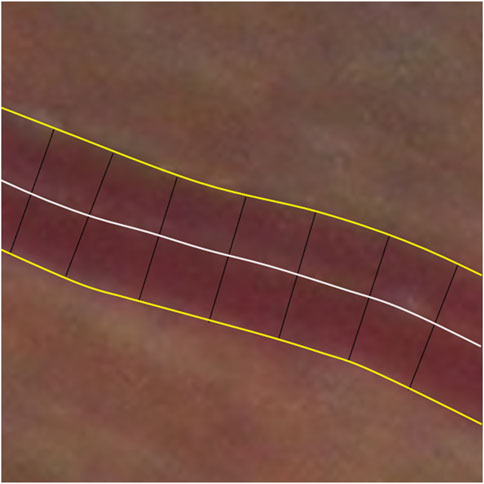
FIGURE 6. Schematic diagram of vascular diameter measurement.
The curvature corresponding to each point on the centerline of the vessel was calculated based on the following formula.
Points B and C are identified on either side of point A such that their distances on the line from point A are equal, i.e.,
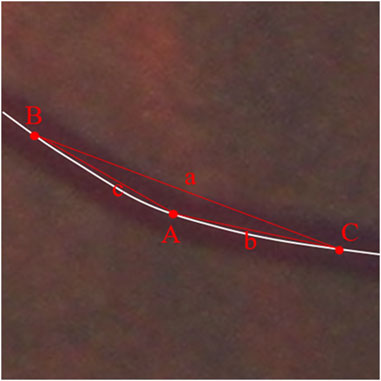
FIGURE 7. Schematic diagram of vascular tortuosity measurement. The curvature of each retinal vessel at a certain interval was measured and the average curvature to the points on the centerline of the vessel was calculated as the vascular average tortuosity.
The curvature is calculated for each point on the vessel except for 25 pixels at the ends of the vessel (as the conditions for calculation are not met). The average curvature to the points on the centerline of the vessel was calculated as the vascular average tortuosity. Retinal vascular tortuosity was calculated as the average of the curvatures of each retinal vessel at a certain interval for all the extracted retinal vessels. Using the center of the optic disc as the reference origin and the diameter of the optic disc as the reference distance, the average tortuosity in different regions (C1, C2, C3, and C4 as mentioned above) was calculated (Figure 7).
In this study, the branching angle of the vessel was calculated as the average angle between the main vessel and the branch vessels. Within a distance of 2 PD from the optic disc boundary, the retina was divided into upper and lower halves using the optic disc as a reference, and the vessel with the largest diameter was taken as the main vessel in each half. Based on the centerline of the vessel, the number of neighboring pixels corresponding to each pixel point on the centerline of the main vessel was calculated based on the 8-neighborhood algorithm, and the point with three neighboring pixels was selected as the branching point. Using the branching point as the starting point, a point 10 pixels away from the branching point was extracted from the centerline of the main vessel and the centerline of the corresponding branch vessel, and a straight line was fitted to each of them, after which the angle between the two lines was measured and calculated as the angle at the branching point. All the angles on the main vessel within 2 PD from the optic disc boundary were obtained, and the average value of all the angles were calculated and output as the retinal vascular branching angle (Figure 8).
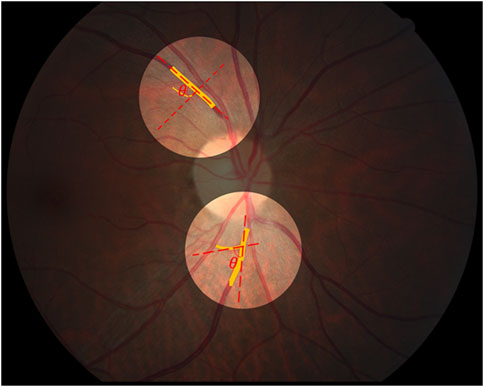
FIGURE 8. Schematic diagram of vascular branch angle measurement.
Statistical analyses were performed in Statistical Package for Social Science (SPSS, version 25.0, IBM Corp., Armonk, New York, United States) and GraphPad Prism 9.4.0 (GraphPad Software, San Diego, CA, United States). Population summary measures and retinal vascular parameters are described using the mean and SD for continuous variables or frequencies and percentages for categorical variables. Independent samples t-tests and chi-squared tests were used to compare the differences in participant characteristics between participants with and without cognitive impairment. The Kruskal‒Wallis test was used to determine the differences in retinal vascular parameters in the whole area and four annular zones among the four groups. Then, post hoc multiple comparisons (Bonferroni correction) were performed to determine pairwise differences. Furthermore, we included a multivariate linear regression analysis to test associations between the MMSE score and retinal vascular parameters. The MMSE score was defined as a dependent parameter, and the parameters that were significantly associated with MMSE were appropriately selected as independent parameters. All p values were two-sided, and p < 0.05 indicated statistical significance. Ninety-five percent confidence intervals are presented.
Among the 3,468 participants, 3,107 individuals (89.6%) [1,351 (43.5%) male] for whom fundus photographs centered on the optic disc and measurements of cognitive function were available were included in the current study. Participants had a mean age of 64.18 ± 9.75 years (median: 63 years; range: 50–93 years) and 74.1% had an education level classified as middle school education or college or higher education. The characteristics of the study population are summarized in detail in Table 2. Participants with cognitive impairment were more likely to be older, female, and a current smoker and to have lower BCVA (logMAR), less education, a higher BMI, and a higher prevalence of hypertension than participants without cognitive impairment.
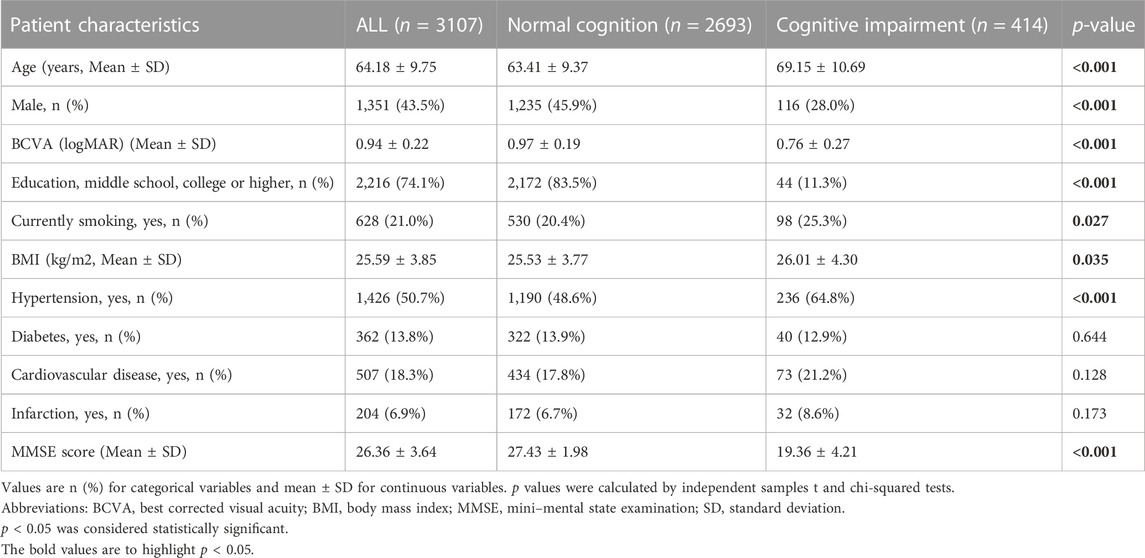
TABLE 2. Participant summary characteristics.
The mean MMSE score was 26.34 ± 3.64 (median: 27; range: 2–30). Out of the 3,107 study participants, 414 (13.3%) individuals were classified as having cognitive impairment with an MMSE score < 24. A total of 296 (9.5%) of these individuals were classified as having mild cognitive impairment (MMSE score range: 19–23), 98 (3.2%) individuals were classified as having moderate cognitive impairment (MMSE score range: 10–18), and 20 (0.6%) individuals were classified as having severe cognitive impairment (MMSE score < 10).
Retinal vascular characteristics of the participants with different cognitive functions are detailed in Table 3. Between the normal cognition group and the mild cognitive impairment group, significant differences existed in retinal vascular average diameter (p < 0.001), retinal venular average diameter (p = 0.013), retinal vascular fractal dimension (p < 0.001), retinal vascular tortuosity (p < 0.001), and retinal vascular density (p < 0.001). Comparison of the different stages of cognitive impairment showed there were significant differences in the arteriole-to-venular ratio (mild cognitive impairment vs. severe cognitive impairment, p = 0.003; moderate cognitive impairment vs. severe cognitive impairment, p = 0.036), retinal vascular fractal dimension (mild cognitive impairment vs. moderate cognitive impairment, p = 0.001; mild cognitive impairment vs. severe cognitive impairment, p = 0.033), and retinal vascular density (mild cognitive impairment vs. moderate cognitive impairment, p = 0.001).
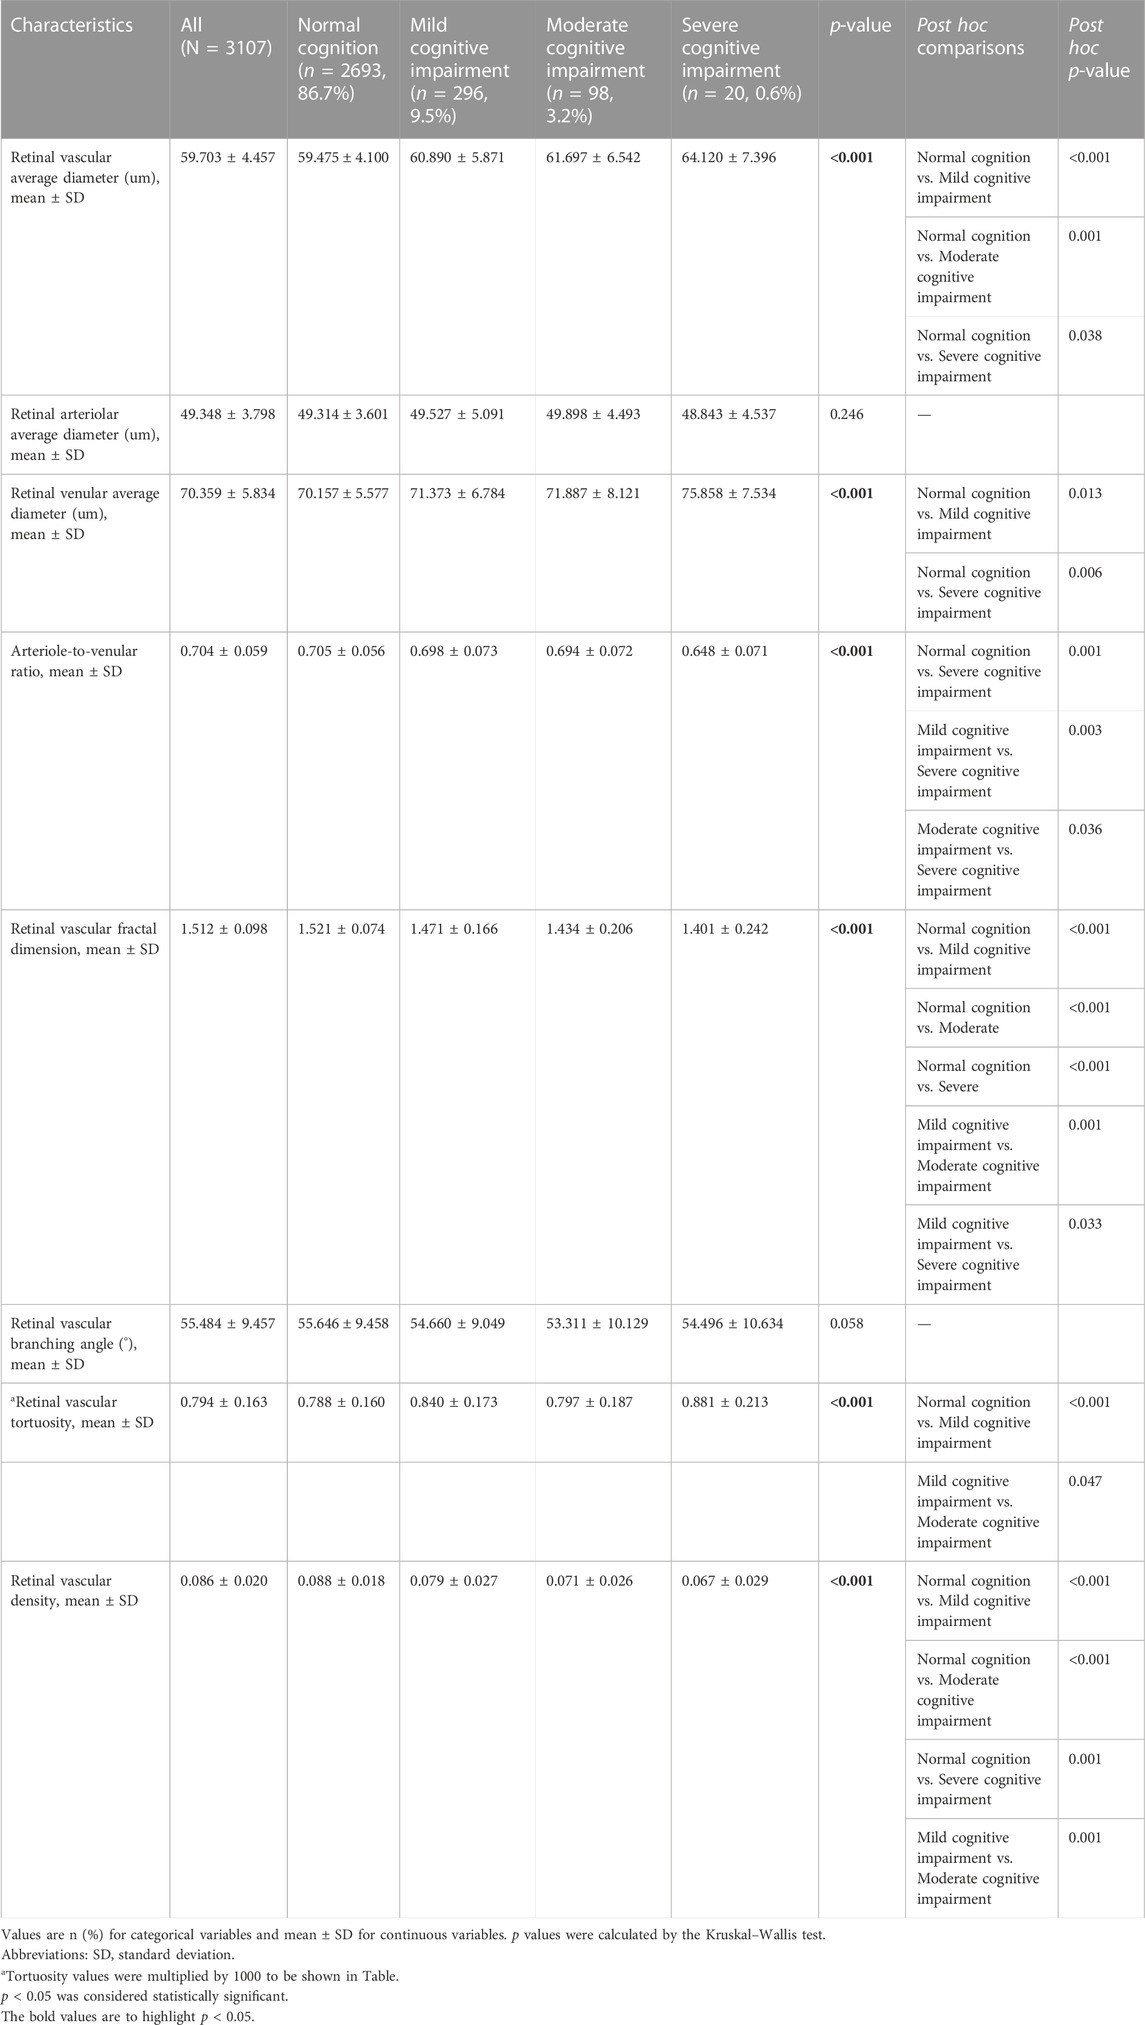
TABLE 3. Retinal vascular characteristics stratified by cognitive function.
To further analyses the relationship between retinal vascular parameters and cognitive function in individuals with different sexes, ages and hypertensive status, we conducted subgroup analyses to assess the relationship between retinal vascular parameters and cognitive impairment in individuals with and without hypertension, in individuals of different sexes, and in individuals of different age groups. The results are described in detail in Tables 4–6, respectively.
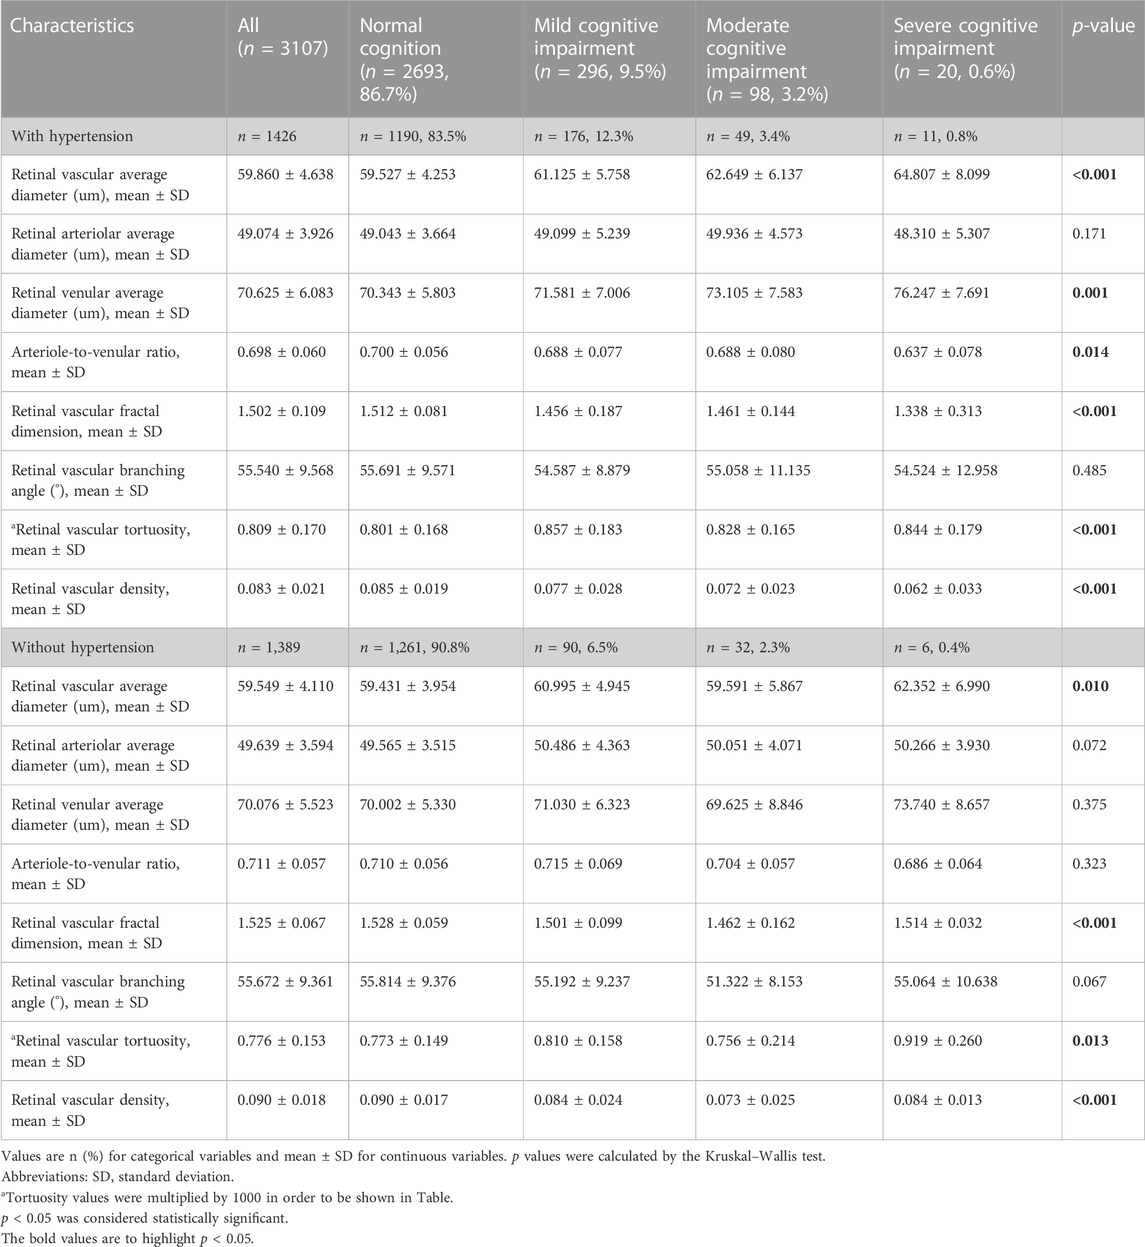
TABLE 4. Retinal vascular characteristics stratified by cognitive function in individuals with and without hypertension.
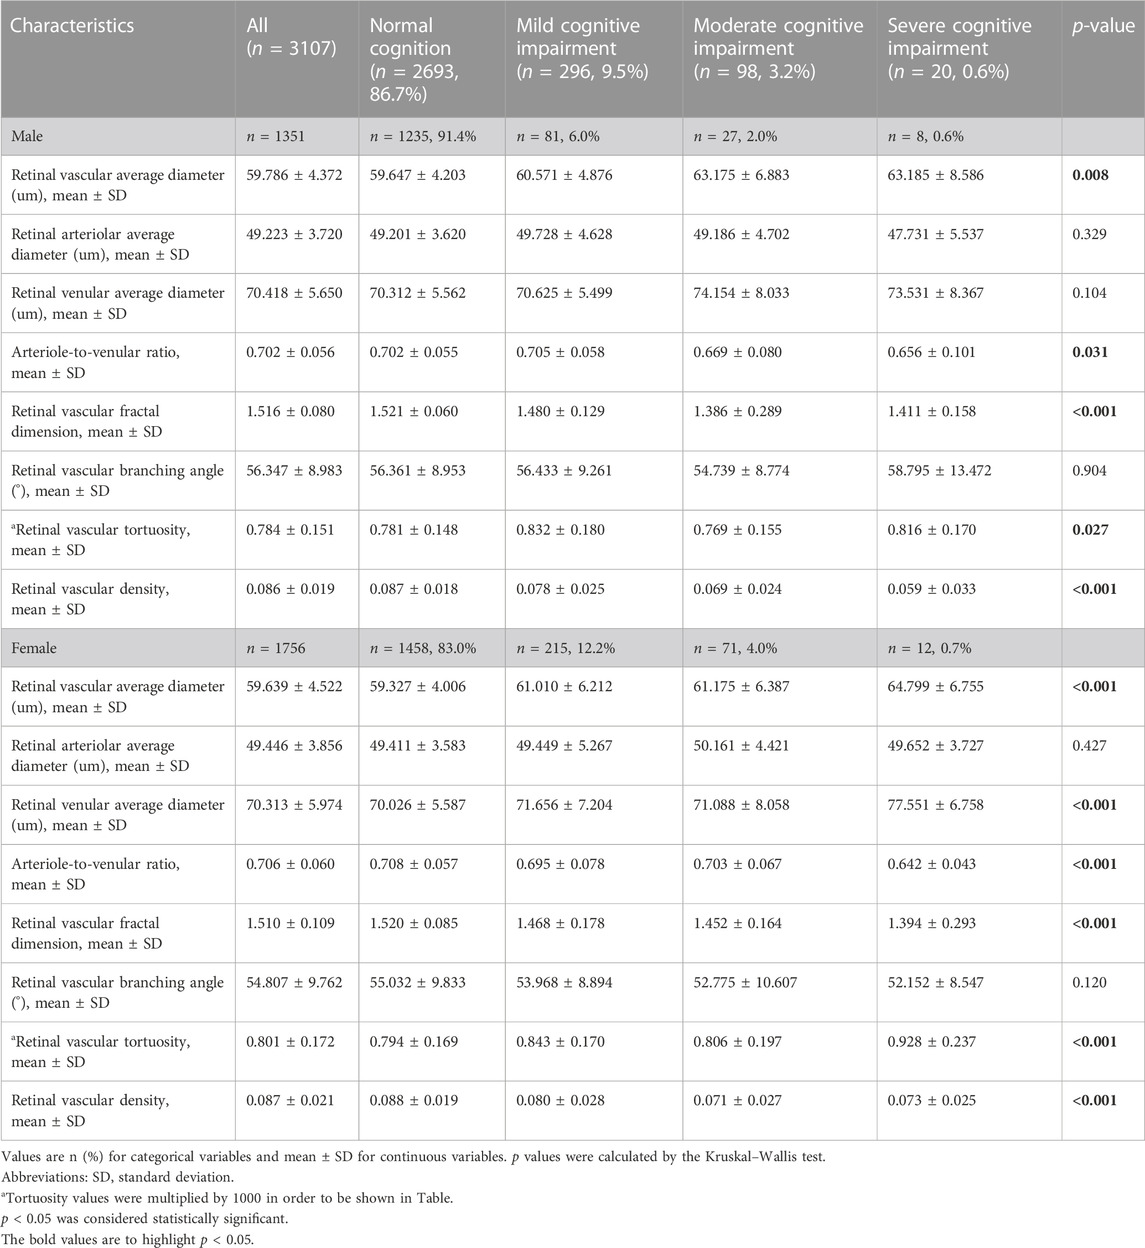
TABLE 5. Retinal vascular characteristics stratified by cognitive function in different sexes.
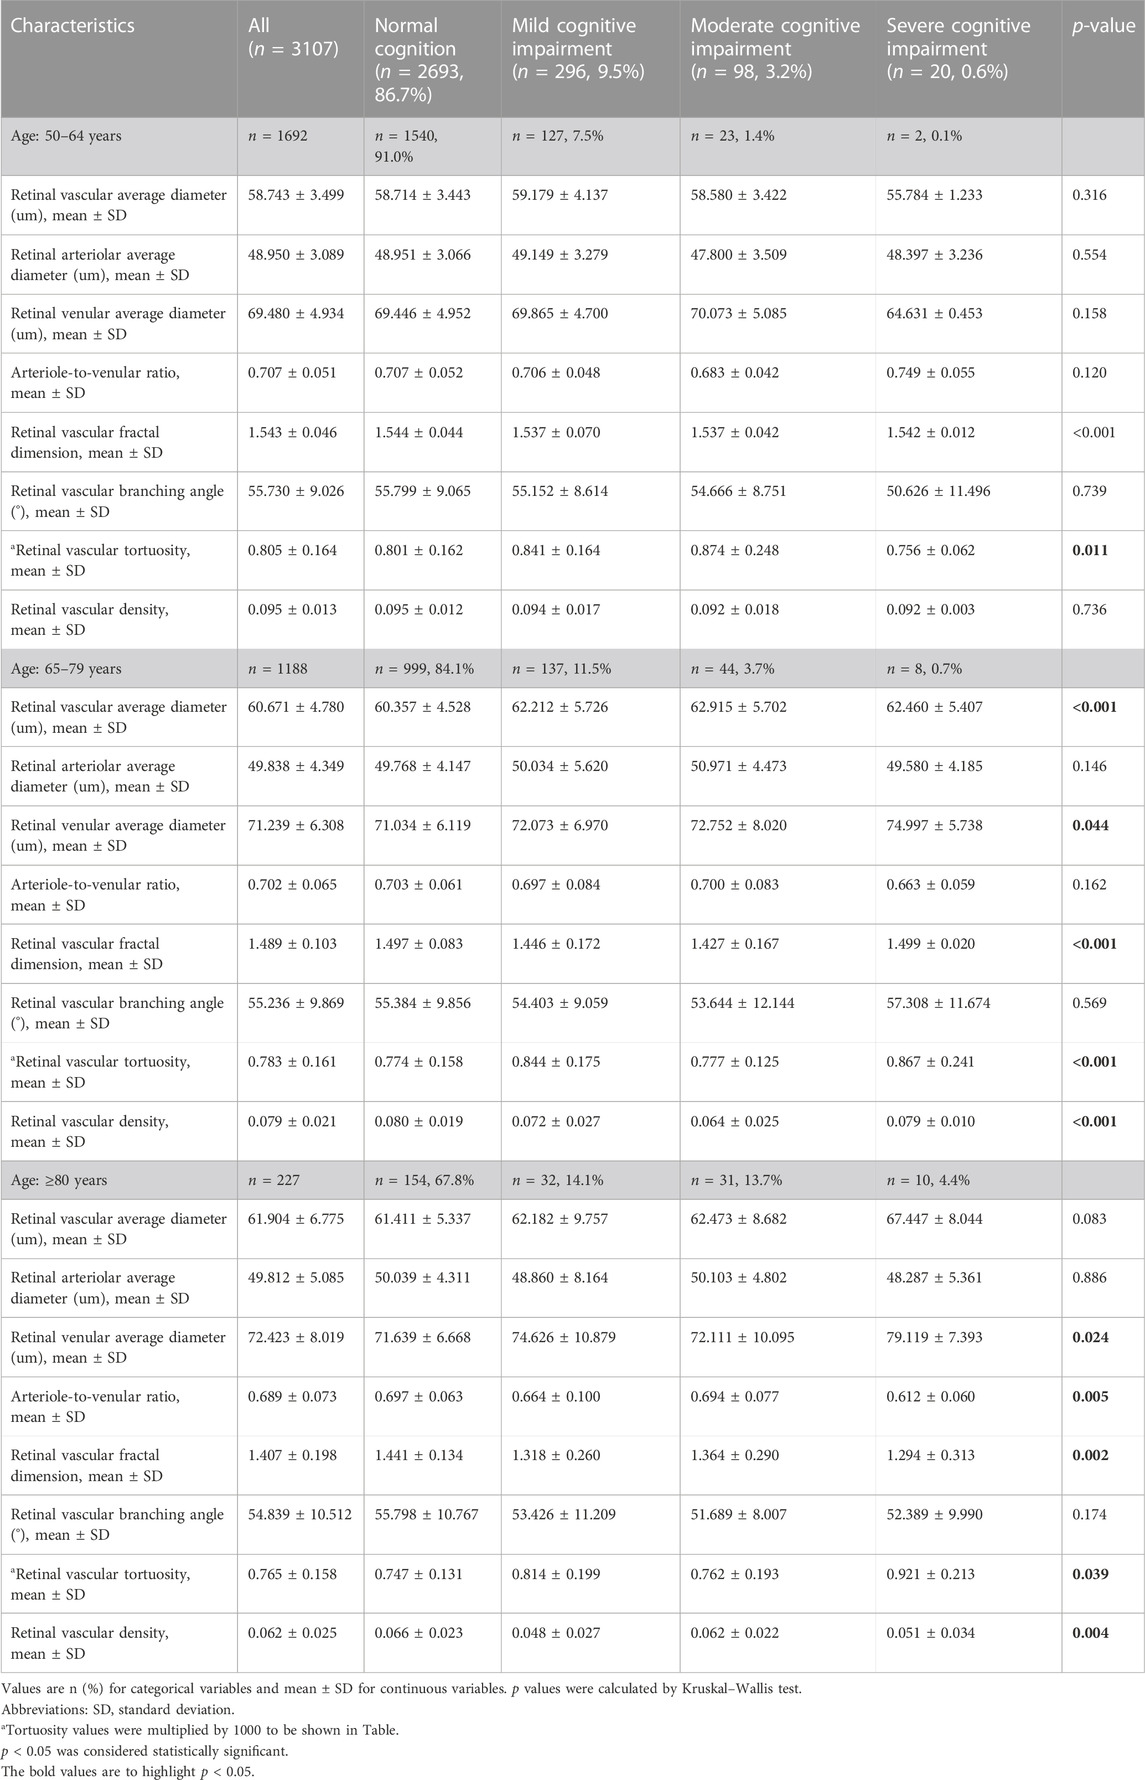
TABLE 6. Retinal vascular characteristics stratified by cognitive function in different age groups.
The retinal vascular average diameter and retinal vascular tortuosity in four annular zones were further analyzed. Among the four annuli, the retinal vascular average diameter and retinal vascular tortuosity were significantly larger in the mild cognitive impairment group than in the normal cognition group (Figures 9A, E). In the C1 annuli, the arteriole-to-venular ratio was significantly lower in the severe cognitive impairment group than in the other three groups (Figure 9D). No significant differences in retinal arteriolar average diameter and venular average diameter were found within the four annuli (Figures 9B, C).
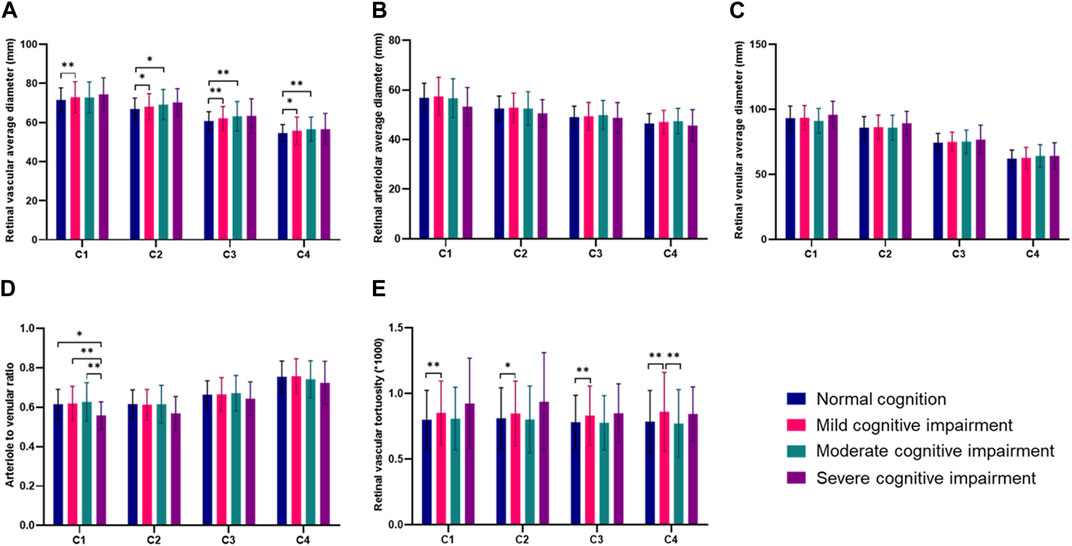
FIGURE 9. Comparisons of retinal vascular average diameter and retinal vascular tortuosity in four annular zones in different groups (*p < 0.05, **p < 0.01). (A) Retinal vascular average diameter in four annular zones in different groups. (B) Retinal arteriolar average diameter in four annular zones in different groups. (C) Retinal venular average diameter in four annular zones in different groups. (D) Arteriole to venular ratio in four annular zones in different groups. (E) Retinal vascular tortuosity in four annular zones in different groups.
In the multivariate analysis, we first used the MMSE score as a dependent variable and all significantly associated systemic parameters (p < 0.05) as independent variables. Since the MMSE was affected by demographic factors, mostly by age and educational level, both parameters were included in the multivariate analysis in the present study (Jonas et al., 2018).
Second, we removed those parameters indicating a high degree of collinearity and parameters that were no longer significantly associated with the MMSE score (p > 0.05), including sex (p = 0.258), hypertension (p = 0.635), infarction (p = 0.708), current smoking (p = 0.417) and BMI (p = 0.121). After adjustment for age, BCVA (logMAR), and education level, a better MMSE score was significantly associated with a higher retinal vascular fractal dimension and higher retinal vascular density. For every 1 SD increase in the retinal vascular fractal dimension, the MMSE score increased by 0.134 points. (B = 0.134, 95% CI: 0.004∼0.263, p = 0.043). For every 1 SD increase in the retinal vascular density, the MMSE score increased by 0.152 points. (B = 0.152, 95% CI: 0.021∼0.283, p = 0.023) (Table 7).
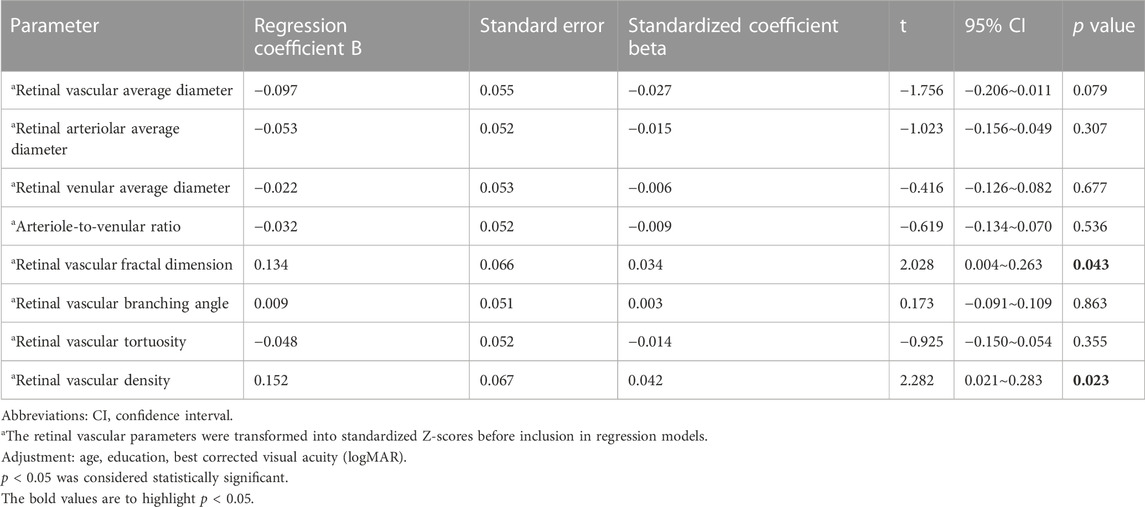
TABLE 7. Associations (multivariate analysis) between the cognitive function score and retinal vascular parameters.
In this study, we performed fully automated retinal vessel segmentation and quantitative measurement of retinal vascular parameters on color fundus photographs using artificial intelligence algorithms. With our fully automated quantitative results, this study demonstrated that alterations in retinal vascular parameters such as retinal vascular diameter, vascular fractal dimension, and vascular curvature are associated with cognitive impairment in a population-based cohort.
Previously, most of the quantitative measurements used for the analysis of retinal vascular parameters were semiautomated by computer-aided analysis programs, such as SIVA, IVAN, and VAMPIRE(Cheung et al., 2011b; Ong et al., 2013; McGrory et al., 2018; Mautuit et al., 2022). These methods require manual labeling and correction of the segmentation of the optic disc and retinal vessels. It takes a trained operator 20–30 min to correct the segmentation of each fundus image, and inevitably subjective bias will be introduced (Cheung et al., 2021b; Cheung et al., 2022). A variety of deep learning models for retinal vessel segmentation have emerged in recent years, and different deep learning models for vessel segmentation have sensitivities of approximately 0.72–0.95, specificities of 0.80–0.98, and accuracies of 0.91–0.98 (Chen et al., 2021). These studies, however, did not perform simultaneous quantitative measurements on the basis of vessel segmentation. Cheung et al. (2021b) developed a Singapore I Vessel Analyzer deep-learning system (SIVA-DLS) to automatically measure retinal vessel caliber. However, this system cannot detect other valuable retinal vascular parameters, such as vascular fractal dimension and retinal vascular tortuosity, at the same time. Shi et al. (2022) performed a meaningful study, in which they developed an artificial intelligence system for fully automated vessel segmentation and quantification of the retinal microvasculature. Sixteen basic parameters were included in the study. However, parameters such as vascular fractal dimension and vessel density, which are also of great importance, were not included. Wiseman et al. (2023) quantified retinal vessel density (VD) and branching complexity on optical coherence tomography angiography (OCTA). They found that retinal microvascular abnormalities exhibited on OCTA were associated with cerebral small vessel disease.
In this study, we constructed a vessel segmentation model based on the deep learning semantic segmentation network ResNet101-UNet, which can complete the process of optic disc segmentation and retinal vessel segmentation in a few seconds. This model is effective in reducing human error and has good sensitivity, specificity, and accuracy. In addition, based on retinal vessel segmentation, a fully automated detection method can then be used to quantitatively analyze the characteristics of the retinal microvascular system, deeply integrating deep learning and computer vision technologies to extract morphological information about all the vasculature in color fundus photographs, providing accurate measurements of retinal vascular branching angle, vascular fractal dimension, vascular average diameter, vascular average tortuosity, and other parameters.
Because age-related eye conditions (such as age-related macular degeneration and glaucoma) are common in older individuals, we intentionally included fundus photographs of patients with concomitant eye disease to increase applicability. Moreover, excluding eyes with these conditions may also introduce selection bias, as research indicates that cognitively impaired patients are more likely to have age-related macular degeneration and glaucoma (Lee et al., 2019; Cheung et al., 2021a).
In previous studies, research on the relationship between retinal vessel diameter and cognitive impairment has yielded mixed results. Liew et al. (2009) analyzed fundus photographs of the Blue Mountains Eye Study population and revealed that retinal venular dilation was associated with significant cognitive impairment, particularly in older persons with hypertension. In contrast, the Circulatory Risk in Communities Study reported that generalized arteriolar narrowing and a total number of retinal abnormalities may be useful markers for identifying persons at higher risk of disabling dementia (Jinnouchi et al., 2017). Recently, fully automated measurements of retinal arteriolar and venular calibers from retinal fundus images were estimated by Cheung et al. (2022) using a deep-learning system. They indicated that narrower retinal arteriolar caliber and wider retinal venular caliber are associated with an increased risk of cognitive decline. However, another study based on the Northern Ireland Cohort for the Longitudinal Study of Aging (NICOLA) showed that there were no associations between central retinal venular measures and mild cognitive impairment (O’Neill et al., 2021). The different findings may be due to inconsistent approaches to the definition of cognitive impairment or inconsistencies in the range of fundus photographs used to measure retinal vascular parameters.
Our study showed that the average retinal vascular diameter was increased in the cognitive impairment group compared to those with normal cognitive function. Separate analyses of retinal arteriolar average diameter and venular average diameter revealed that retinal arteriolar average diameter was not associated with cognitive impairment. In addition, the increase in retinal vascular average diameter mainly occurred in the venules. Evidence suggests that cognitive decline and related diseases may be associated with a wider retinal venular diameter (Yim-Lui Cheung et al., 2010; Simen et al., 2011), which is indicative of systemic inflammation, endothelial dysfunction, and abnormal blood-brain barriers (Nguyen and Wong, 2006; Wong et al., 2006).
In the present study, we found that retinal vascular fractal dimension and retinal vascular density may be more relevant candidate biomarkers for the early diagnosis of cognitive impairment than retinal vascular diameter. In individuals with cognitive impairment, the retinal vascular fractal dimension is decreased, and retinal vascular density is reduced. Similarly, Cheung et al. (2014) observed that Alzheimer’s disease (AD) patients had sparser retinal microvascular networks than controls, suggesting that retinal microvascular function is impaired in AD individuals. Ong et al. (2014) also indicated that reduced retinal arteriolar and venular fractal dimensions are associated with an increased risk of mild and moderate cognitive impairment. In a recent study, Xie et al. (2023) evaluated the association between changes in retinal microvasculature and Alzheimer’s disease and mild cognitive impairment using deep segmentation of OCTA images. They also revealed that the mild cognitive impairment group in their study had a reduced vascular fractal dimension compared with the control group. We performed a multiple linear regression analysis and found that retinal fractal dimension and retinal vascular density were positively correlated with the MMSE score. For every 1 SD increase in retinal fractal dimension, the MMSE increased by 0.134 points, and for every 1 SD increase in retinal vessel density, the MMSE increased by 0.152 points.
We analyzed the underlying reasons for the decrease in retinal vascular fractal dimension and retinal vascular density in a cognitively dysfunctional population. The fractal dimension of the retinal vasculature is an indicator of the complexity of the vascular branches, reflecting the distribution of blood throughout the retinal circulation, with larger values indicating a more complex distribution. When the fractal dimension of retinal vessels decreases, the sparse distribution of retinal vessels may represent the same alterations in the microvasculature of the brain (Nadal et al., 2020), indicating inadequate cerebral blood perfusion, which triggers activity in hypoxia-induced pathways that leads to pathological changes in tau, ultimately leading to the development and progression of cognitive impairment and even Alzheimer’s disease (Koike et al., 2011; Sabayan et al., 2012; Love and Miners, 2016).
We performed a post hoc test to compare pairs of the group with normal cognitive function and the groups with different stages of cognitive impairment. The results showed that there were significant differences in retinal venous diameter, vascular tortuosity, retinal vascular fractal dimension, and vascular density between the normal and mildly cognitively dysfunctional groups. On the other hand, between groups with different degrees of cognitive impairment, the severe cognitive impairment group had a reduced arteriole-to-venular ratio and a decreased retinal vascular fractal dimension compared to the mild and moderate cognitive impairment groups. These findings suggest that alterations in retinal venular average diameter, retinal vascular tortuosity, retinal vascular fractal dimension, and retinal vascular density may be early indicators of cognitive impairment, while reduced arteriole-to-venular ratio and decreased fractal dimension may be indicators of the progression of cognitive impairment.
We performed a zonation analysis on the retinal vascular parameters. Within the four annular regions C1-C4, the average vascular diameter, as well as the vascular tortuosity, were significantly different between the normal cognitive function group and the mild cognitive impairment group, suggesting that an increase in these two parameters within each region may occur in the early stages of cognitive impairment. Within the C1 zone, compared to that in the severe cognitive impairment group, the arteriole-to-venular ratio was significantly greater in the normal cognitive function group, the mild cognitive impairment group, and the moderate cognitive impairment group. The significant decrease in the arteriole-to-venular ratio in the severe cognitive impairment group suggested that the decrease in the arteriole-to-venular ratio of the central retinal vessels around the optic disc occurred late in the progression of cognitive impairment.
Our research has several advantages. First, computer intelligence-assisted measurement of vascular characteristics was used in this study to explore the relationship between retinal vascular characteristics and cognitive impairment based on the numerical indicators obtained. Compared with previous computer-aided detection of retinal vessels, the greatest breakthrough of this study is the automatic detection and segmentation of retinal vessels followed by the automatic calculation of vascular characteristic parameters, thus realizing a fully automated process of vascular parameter measurement. The fully automated process saves considerable time, reduces manpower costs, and avoids the subjective errors introduced by manual measurement or machine-assisted manual measurement. Second, we included data from population-based studies with large samples. In addition, we selected fundus images centered on the optic disc, which provide valuable information on the nasal vessels of the retina. Furthermore, we graded cognitive impairment and investigated the retinal vasculature in different regions to identify more accurate candidate biomarkers for early identification and late progression of cognitive impairment.
Potential limitations should be mentioned. First, it should be noted that 45° photographs of the central fundus were used for this study. The photographs included a limited area, which rendered it impossible to measure the peripheral vessels that are more susceptible to variations. Second, in the zonation analysis, we only performed the annular zones and did not divide them by quadrant, which may have yielded some meaningful results. We have only performed a zonal analysis of retinal vascular diameter and vascular tortuosity, without including retinal vascular fractal dimension and vascular density, which might have provided more meaningful information. Moreover, as this was a cross-sectional study, it was not possible to determine a potential causal relationship between the alterations in retinal vascular parameters and the decline in cognitive function.
In conclusion, we developed a vascular segmentation model based on deep learning algorithms to fully automate the quantitative measurement of retinal vascular parameters on fundus photographs. In this study, we demonstrated that an assessment of retinal vascular parameters with this model provided information on the risk of cognitive decline. The decrease in retinal vascular fractal dimension and decreased vascular density may serve as candidate biomarkers for early identification of cognitive impairment. The reduction in the retinal arteriole-to-venular ratio occurs in the late stages of cognitive impairment.
The raw data supporting the conclusion of this article will be made available by the authors, without undue reservation.
The studies involving human participants were reviewed and approved by The Medical Ethics Committee of Beijing Tongren Hospital. The patients/participants provided their written informed consent to participate in this study.
XS, LD, and WW: design of the study. DZ and SL: development of the algorithm. LS, YY, and YW: gathering the data. XS and RZ: performing the data analysis. XS, LD, and DZ: drafting the first version of the manuscript. All authors contributed to the article and approved the submitted version.
This study was supported by the National Natural Science Foundation of China (82220108017 and 82141128), the Capital Health Research and Development of Special (2020-1-2052), and the Science and Technology Project of Beijing Municipal Science and Technology Commission (Z201100005520045 and Z181100001818003).
Authors DZ and SL were employed by EVision Technology (Beijing) Co., Ltd.
The remaining authors declare that the research was conducted in the absence of any commercial or financial relationships that could be construed as a potential conflict of interest.
All claims expressed in this article are solely those of the authors and do not necessarily represent those of their affiliated organizations, or those of the publisher, the editors and the reviewers. Any product that may be evaluated in this article, or claim that may be made by its manufacturer, is not guaranteed or endorsed by the publisher.
Alzheimer’s Association, (2022). Alzheimer's disease facts and figures. Alzheimer's Dementia J. Alzheimer's Assoc. 18 (4), 700–789. doi:10.1002/alz.12638
Chan, V. T. T., Tso, T. H. K., Tang, F., Tham, C., Mok, V., Chen, C., et al. (2017). Using retinal imaging to study dementia. J. Vis. Exp. JoVE 129, 56137. doi:10.3791/56137
Chen, C., Chuah, J. H., Ali, R., and Wang, Y. (2021). Retinal vessel segmentation using deep learning: A review. IEEE Access 9, 111985–112004. doi:10.1109/access.2021.3102176
Cheung, C. Y., Mok, V., Foster, P. J., Trucco, E., Chen, C., and Wong, T. Y. (2021a). Retinal imaging in Alzheimer's disease. J. Neurology, Neurosurg. Psychiatry 92 (9), 983–994. doi:10.1136/jnnp-2020-325347
Cheung, C. Y., Tay, W. T., Mitchell, P., Wang, J. J., Hsu, W., Lee, M. L., et al. (2011b). Quantitative and qualitative retinal microvascular characteristics and blood pressure. J. Hypertens. 29 (7), 1380–1391. doi:10.1097/HJH.0b013e328347266c
Cheung, C. Y., Wong, W. L. E., Hilal, S., Kan, C. N., Gyanwali, B., Tham, Y. C., et al. (2022). Deep-learning retinal vessel calibre measurements and risk of cognitive decline and dementia. Brain Commun. 4 (4), fcac212. doi:10.1093/braincomms/fcac212
Cheung, C. Y., Xu, D., Cheng, C-Y., Sabanayagam, C., Tham, Y-C., Yu, M., et al. (2021b). A deep-learning system for the assessment of cardiovascular disease risk via the measurement of retinal-vessel calibre. Nat. Biomed. Eng. 5 (6), 498–508. doi:10.1038/s41551-020-00626-4
Cheung, C. Y-L., Ong, Y. T., Ikram, M. K., Ong, S. Y., Li, X., Hilal, S., et al. (2014). Microvascular network alterations in the retina of patients with Alzheimer's disease. Alzheimer's Dementia J. Alzheimer's Assoc. 10 (2), 135–142. doi:10.1016/j.jalz.2013.06.009
Cheung, C. Y-L., Zheng, Y., Hsu, W., Lee, M. L., Lau, Q. P., Mitchell, P., et al. (2011a). Retinal vascular tortuosity, blood pressure, and cardiovascular risk factors. Ophthalmology 118 (5), 812–818. doi:10.1016/j.ophtha.2010.08.045
Crum, R. M., Anthony, J. C., Bassett, S. S., and Folstein, M. F. (1993). Population-based norms for the Mini-Mental State Examination by age and educational level. JAMA 269 (18), 2386–2391. doi:10.1001/jama.269.18.2386
Czakó, C., Kovács, T., Ungvari, Z., Csiszar, A., Yabluchanskiy, A., Conley, S., et al. (2020). Retinal biomarkers for Alzheimer's disease and vascular cognitive impairment and dementia (VCID): Implication for early diagnosis and prognosis. GeroScience 42 (6), 1499–1525. doi:10.1007/s11357-020-00252-7
Dervenis, N., Coleman, A. L., Harris, A., Wilson, M. R., Yu, F., Anastasopoulos, E., et al. (2019). Factors associated with retinal vessel diameters in an Elderly population: The Thessaloniki eye study. Investigative Ophthalmol. Vis. Sci. 60 (6), 2208–2217. doi:10.1167/iovs.18-26276
Dong, L., He, W., Zhang, R., Ge, Z., Wang, Y. X., Zhou, J., et al. (2022). Artificial intelligence for screening of multiple retinal and optic Nerve diseases. JAMA Netw. Open 5 (5), e229960. doi:10.1001/jamanetworkopen.2022.9960
Fish, P. V., Steadman, D., Bayle, E. D., and Whiting, P. (2019). New approaches for the treatment of Alzheimer's disease. Bioorg. Med. Chem. Lett. 29 (2), 125–133. doi:10.1016/j.bmcl.2018.11.034
Folstein, M. F., Folstein, S. E., and Mchugh, P. R. (1975). Mini-mental state". A practical method for grading the cognitive state of patients for the clinician. J. Psychiatric Res. 12 (3), 189–198. doi:10.1016/0022-3956(75)90026-6
Jack, C. R., Bennett, D. A., Blennow, K., Carrillo, M. C., Dunn, B., Haeberlein, S. B., et al. (2018). NIA-AA Research Framework: Toward a biological definition of Alzheimer's disease. Alzheimer's Dementia J. Alzheimer's Assoc. 14 (4), 535–562. doi:10.1016/j.jalz.2018.02.018
Jinnouchi, H., Kitamura, A., Yamagishi, K., Kiyama, M., Imano, H., Okada, T., et al. (2017). Retinal vascular changes and prospective risk of disabling dementia: The circulatory risk in communities study (CIRCS). J. Atheroscler. Thrombosis 24 (7), 687–695. doi:10.5551/jat.37291
Jonas, J. B., Wei, W. B., Zhu, L. P., Xu, L., and Wang, Y. X. (2018). Cognitive function and Ophthalmological diseases: The Beijing eye study. Sci. Rep. 8 (1), 4816. doi:10.1038/s41598-018-23314-5
Koike, M. A., Garcia, F. G., Kitazawa, M., Green, K. N., and Laferla, F. M. (2011). Long term changes in phospho-APP and tau aggregation in the 3xTg-AD mice following cerebral ischemia. Neurosci. Lett. 495 (1), 55–59. doi:10.1016/j.neulet.2011.03.034
Lee, C. S., Larson, E. B., Gibbons, L. E., Lee, A. Y., Mccurry, S. M., Bowen, J. D., et al. (2019). Associations between recent and established ophthalmic conditions and risk of Alzheimer's disease. Alzheimer's Dementia J. Alzheimer's Assoc. 15 (1), 34–41. doi:10.1016/j.jalz.2018.06.2856
Liesz, A. (2019). The vascular side of Alzheimer's disease. Sci. (New York, N.Y.) 365 (6450), 223–224. doi:10.1126/science.aay2720
Liew, G., Mitchell, P., Wong, T. Y., Lindley, R. I., Cheung, N., Kaushik, S., et al. (2009). Retinal microvascular signs and cognitive impairment. J. Am. Geriatrics Soc. 57 (10), 1892–1896. doi:10.1111/j.1532-5415.2009.02459.x
Liew, G., Wang, J. J., Cheung, N., Zhang, Y. P., Hsu, W., Lee, M. L., et al. (2008). The retinal vasculature as a fractal: Methodology, reliability, and relationship to blood pressure. Ophthalmology 115 (11), 1951–1956. doi:10.1016/j.ophtha.2008.05.029
Liu, H. H., Xu, L., Wang, Y. X., Wang, S., You, Q. S., and Jonas, J. B. (2010). Prevalence and progression of myopic retinopathy in Chinese adults: The Beijing eye study. Ophthalmology 117 (9), 1763–1768. doi:10.1016/j.ophtha.2010.01.020
Love, S., and Miners, J. S. (2016). Cerebral Hypoperfusion and the Energy Deficit in Alzheimer's disease. Brain Pathol. (Zurich, Switz. 26 (5), 607–617. doi:10.1111/bpa.12401
Mautuit, T., Cunnac, P., Cheung, C. Y., Wong, T. Y., Hogg, S., Trucco, E., et al. (2022). Concordance between SIVA, IVAN, and VAMPIRE software tools for Semi-automated analysis of retinal vessel caliber. Diagn. (Basel, Switz. 12 (6), 1317. doi:10.3390/diagnostics12061317
Mcgrory, S., Taylor, A. M., Pellegrini, E., Ballerini, L., Kirin, M., Doubal, F. N., et al. (2018). Towards Standardization of quantitative retinal vascular parameters: Comparison of SIVA and VAMPIRE measurements in the Lothian Birth cohort 1936. Transl. Vis. Sci. Technol. 7 (2), 12. doi:10.1167/tvst.7.2.12
Nadal, J., Deverdun, J., De Champfleur, N. M., Carriere, I., Creuzot-Garcher, C., Delcourt, C., et al. (2020). Retinal vascular fractal dimension and cerebral blood flow, a pilot study. Acta Ophthalmol. 98 (1), e63–e71. doi:10.1111/aos.14232
Ngolab, J., Honma, P., and Rissman, R. A. (2019). Reflections on the utility of the retina as a biomarker for Alzheimer's disease: A Literature review. Neurology Ther. 8 (2), 57–72. doi:10.1007/s40120-019-00173-4
Nguyen, T. T., and Wong, T. Y. (2006). Retinal vascular manifestations of metabolic disorders. Trends Endocrinol. Metabolism TEM 17 (7), 262–268. doi:10.1016/j.tem.2006.07.006
O'neill, R. A., Maxwell, A. P., Paterson, E. N., Kee, F., Young, I., Hogg, R. E., et al. (2021). Retinal microvascular parameters are not significantly associated with mild cognitive impairment in the Northern Ireland Cohort for the Longitudinal Study of Ageing. BMC Neurol. 21 (1), 112. doi:10.1186/s12883-021-02137-4
Ong, Y-T., De Silva, D. A., Cheung, C. Y., Chang, H-M., Chen, C. P., Wong, M. C., et al. (2013). Microvascular structure and network in the retina of patients with ischemic stroke. Stroke 44 (8), 2121–2127. doi:10.1161/STROKEAHA.113.001741
Ong, Y-T., Hilal, S., Cheung, C. Y-L., Xu, X., Chen, C., Venketasubramanian, N., et al. (2014). Retinal vascular fractals and cognitive impairment. Dementia Geriatric Cognitive Disord. Extra 4 (2), 305–313. doi:10.1159/000363286
Patton, N., Aslam, T., Macgillivray, T., Pattie, A., Deary, I. J., and Dhillon, B. (2005). Retinal vascular image analysis as a potential screening tool for cerebrovascular disease: A rationale based on homology between cerebral and retinal microvasculatures. J. Anat. 206 (4), 319–348. doi:10.1111/j.1469-7580.2005.00395.x
Polanco, J. C., Li, C., Bodea, L-G., Martinez-Marmol, R., Meunier, F. A., and Götz, J. (2018). Amyloid-β and tau complexity - towards improved biomarkers and targeted therapies. Nat. Rev. Neurol. 14 (1), 22–39. doi:10.1038/nrneurol.2017.162
Prince, M., Bryce, R., Albanese, E., Wimo, A., Ribeiro, W., and Ferri, C. P. (2013). The global prevalence of dementia: A systematic review and metaanalysis. Alzheimer's Dementia J. Alzheimer's Assoc. 9 (1), 63–75. doi:10.1016/j.jalz.2012.11.007
Ravi Teja, K. V., Tos Berendschot, T., Steinbusch, H., Carroll Webers, A. B., Praveen Murthy, R., and Mathuranath, P. S. (2017). Cerebral and retinal Neurovascular changes: A biomarker for Alzheimer's disease. J. Gerontology Geriatric Res. 6 (4), 447. doi:10.4172/2167-7182.1000447
Reitz, C., Brayne, C., and Mayeux, R. (2011). Epidemiology of Alzheimer disease. Nat. Rev. Neurol. 7 (3), 137–152. doi:10.1038/nrneurol.2011.2
Ronneberger, O., Fischer, P., and Brox, T. (2015). U-net: Convolutional networks for biomedical image segmentation. Springer, 234–241.
Sabayan, B., Jansen, S., Oleksik, A. M., Van Osch, M. J. P., Van Buchem, M. A., Van Vliet, P., et al. (2012). Cerebrovascular hemodynamics in Alzheimer's disease and vascular dementia: A meta-analysis of transcranial Doppler studies. Ageing Res. Rev. 11 (2), 271–277. doi:10.1016/j.arr.2011.12.009
Shao, L., Zhang, Q. L., Long, T. F., Dong, L., Zhang, C., Da Zhou, W., et al. (2021). Quantitative assessment of fundus Tessellated density and associated factors in fundus images using artificial intelligence. Transl. Vis. Sci. Technol. 10 (9), 23. doi:10.1167/tvst.10.9.23
Shi, D., Lin, Z., Wang, W., Tan, Z., Shang, X., Zhang, X., et al. (2022). A deep learning system for fully automated retinal vessel measurement in high Throughput image analysis. Front. Cardiovasc. Med. 9, 823436. doi:10.3389/fcvm.2022.823436
Simen, A. A., Bordner, K. A., Martin, M. P., Moy, L. A., and Barry, L. C. (2011). Cognitive dysfunction with aging and the role of inflammation. Ther. Adv. Chronic Dis. 2 (3), 175–195. doi:10.1177/2040622311399145
Snyder, P. J., Alber, J., Alt, C., Bain, L. J., Bouma, B. E., Bouwman, F. H., et al. (2021). Retinal imaging in Alzheimer's and neurodegenerative diseases. Alzheimer's Dementia J. Alzheimer's Assoc. 17 (1), 103–111. doi:10.1002/alz.12179
Sur, S., Lin, Z., Li, Y., Yasar, S., Rosenberg, P., Moghekar, A., et al. (2020). Association of cerebrovascular reactivity and Alzheimer pathologic markers with cognitive performance. Neurology 95 (8), e962–e972. doi:10.1212/WNL.0000000000010133
Ting, D. S. W., Cheung, C. Y-L., Lim, G., Tan, G. S. W., Quang, N. D., Gan, A., et al. (2017). Development and validation of a deep learning system for diabetic retinopathy and related eye diseases using retinal images from multiethnic populations with diabetes. JAMA 318 (22), 2211–2223. doi:10.1001/jama.2017.18152
Tombaugh, T. N., and Mcintyre, N. J. (1992). The mini-mental state examination: A comprehensive review. J. Am. Geriatrics Soc. 40 (9), 922–935. doi:10.1111/j.1532-5415.1992.tb01992.x
Trucco, E., Giachetti, A., Ballerini, L., Relan, D., and Macgillivray, T. (2015). Morphometric measurements of the retinal vasculature in fundus images with Vampire. Biomedical image Understanding, methods and Applications.
Vilela, M. A., Amaral, C. E., and Ferreira, M. a. T. (2021). Retinal vascular tortuosity: Mechanisms and measurements. Eur. J. Ophthalmol. 31 (3), 1497–1506. doi:10.1177/1120672120979907
Wiseman, S. J., Zhang, J-F., Gray, C., Hamid, C., Valdés Hernández, M. D. C., Ballerini, L., et al. (2023). Retinal capillary microvessel morphology changes are associated with vascular damage and dysfunction in cerebral small vessel disease. J. Cereb. Blood Flow Metabolism Official J. Int. Soc. Cereb. Blood Flow Metabolism 43 (2), 231–240. doi:10.1177/0271678X221135658
Wong, T. Y., Islam, F. M. A., Klein, R., Klein, B. E. K., Cotch, M. F., Castro, C., et al. (2006). Retinal vascular caliber, cardiovascular risk factors, and inflammation: The multi-ethnic study of atherosclerosis (MESA). Investigative Ophthalmol. Vis. Sci. 47 (6), 2341–2350. doi:10.1167/iovs.05-1539
Wu, H., Wang, C., Chen, C., Xu, X., Zhu, Y., Sang, A., et al. (2020). Association between retinal vascular Geometric changes and cognitive impairment: A systematic review and meta-analysis. J. Clin. Neurology (Seoul, Korea) 16 (1), 19–28. doi:10.3988/jcn.2020.16.1.19
Xie, J., Yi, Q., Wu, Y., Zheng, Y., Liu, Y., Macerollo, A., et al. (2023). Deep segmentation of OCTA for evaluation and association of changes of retinal microvasculature with Alzheimer's disease and mild cognitive impairment. Br. J. Ophthalmol. 3. doi:10.1136/bjo-2022-321399
Xu, Y., Wang, Y., Liu, B., Tang, L., Lv, L., Ke, X., et al. (2019). The diagnostic accuracy of an intelligent and automated fundus disease image assessment system with lesion quantitative function (SmartEye) in diabetic patients. BMC Ophthalmol. 19(1), 184. doi:10.1186/s12886-019-1196-9
Yan, Y. N., Wang, Y. X., Xu, L., Xu, J., Wei, W. B., and Jonas, J. B. (2015). Fundus Tessellation: Prevalence and associated factors: The Beijing eye study 2011. Ophthalmology 122 (9), 1873–1880. doi:10.1016/j.ophtha.2015.05.031
Yim-Lui Cheung, C., Wong, T. Y., Lamoureux, E. L., Sabanayagam, C., Li, J., Lee, J., et al. (2010). C-reactive protein and retinal microvascular caliber in a multiethnic Asian population. Am. J. Epidemiol. 171 (2), 206–213. doi:10.1093/aje/kwp357
Yu, J-T., Xu, W., Tan, C-C., Andrieu, S., Suckling, J., Evangelou, E., et al. (2020). Evidence-based prevention of Alzheimer's disease: Systematic review and meta-analysis of 243 observational prospective studies and 153 randomised controlled trials. J. Neurology, Neurosurg. Psychiatry 91 (11), 1201–1209. doi:10.1136/jnnp-2019-321913
Keywords: artificial intelligence, deep learning, retinal vascular, cognitive function, cognitive impairment
Citation: Shi XH, Dong L, Zhang RH, Zhou DJ, Ling SG, Shao L, Yan YN, Wang YX and Wei WB (2023) Relationships between quantitative retinal microvascular characteristics and cognitive function based on automated artificial intelligence measurements. Front. Cell Dev. Biol. 11:1174984. doi: 10.3389/fcell.2023.1174984
Received: 27 February 2023; Accepted: 09 June 2023;
Published: 21 June 2023.
Edited by:
Weihua Yang, Jinan University, ChinaReviewed by:
Wangting Li, Shenzhen Eye Hospital, ChinaCopyright © 2023 Shi, Dong, Zhang, Zhou, Ling, Shao, Yan, Wang and Wei. This is an open-access article distributed under the terms of the Creative Commons Attribution License (CC BY). The use, distribution or reproduction in other forums is permitted, provided the original author(s) and the copyright owner(s) are credited and that the original publication in this journal is cited, in accordance with accepted academic practice. No use, distribution or reproduction is permitted which does not comply with these terms.
*Correspondence: Wen Bin Wei, d2Vpd2VuYmludHJAMTYzLmNvbQ==
Disclaimer: All claims expressed in this article are solely those of the authors and do not necessarily represent those of their affiliated organizations, or those of the publisher, the editors and the reviewers. Any product that may be evaluated in this article or claim that may be made by its manufacturer is not guaranteed or endorsed by the publisher.
Research integrity at Frontiers
Learn more about the work of our research integrity team to safeguard the quality of each article we publish.