 Miki Shinohara
 Akira Shinohara
- 1Department of Advanced Bioscience, Graduate School of Agriculture, Kindai University, Nara, Japan
- 2Agricultural Technology and Innovation Research Institute, Kindai University, Nara, Japan
- 3Institute for Protein Research, Osaka University, Osaka, Japan
Meiotic crossing over is essential for the segregation of homologous chromosomes. The formation and distribution of meiotic crossovers (COs), which are initiated by the formation of double-strand break (DSB), are tightly regulated to ensure at least one CO per bivalent. One type of CO control, CO homeostasis, maintains a consistent level of COs despite fluctuations in DSB numbers. Here, we analyzed the localization of proteins involved in meiotic recombination in budding yeast xrs2 hypomorphic mutants which show different levels of DSBs. The number of cytological foci with recombinases, Rad51 and Dmc1, which mark single-stranded DNAs at DSB sites is proportional to the DSB numbers. Among the pro-CO factor, ZMM/SIC proteins, the focus number of Zip3, Mer3, or Spo22/Zip4, was linearly proportional to reduced DSBs in the xrs2 mutant. In contrast, foci of Msh5, a component of the MutSγ complex, showed a non-linear response to reduced DSBs. We also confirmed the homeostatic response of COs by genetic analysis of meiotic recombination in the xrs2 mutants and found a chromosome-specific homeostatic response of COs. Our study suggests that the homeostatic response of the Msh5 assembly to reduced DSBs was genetically distinct from that of the Zip3 assembly for CO control.
Introduction
Meiotic recombination generates both crossovers (COs) and non-crossovers (NCOs). Crossing over during meiosis is essential to establish a chiasma as a physical connection between homologous chromosomes to ensure proper segregation of these chromosomes during the first meiotic division, meiosis I. Spo11 generates DNA double-strand breaks (DSBs) to initiate the recombination (Bergerat et al., 1997; Keeney et al., 1997). Spo11 forms a topoisomerase VI-like complex with Rec102, Rec104, and Ski8 (Robert et al., 2016; Claeys Bouuaert et al., 2021) and associates with two complexes, the Rec114-Mei4-Mer2 (RMM) and Mre11-Rad50-Xrs2 (MRX) complexes (Kee et al., 2004; Maleki et al., 2007). The number of DSBs exceeds the number of COs in budding yeast and other organisms; e.g., ∼90 COs from ∼170 DSBs in the budding yeast (Moens et al., 2002; Pan et al., 2011).
Meiotic CO formation is strictly regulated by several distinct mechanisms, which together are known as crossover control. Crossover interference negatively regulates CO formation to ensure even spacing and to limit the number of COs on each chromosome (Muller, 1916). Crossover assurance (or obligate CO) is a positive regulatory mechanism that ensures at least one CO on each homolog pair (Jones, 1984). It is thought that a balance between CO interference and assurance is the key feature of CO formation (Kleckner, 2006; Shinohara et al., 2015; Wang et al., 2019a). A third control mechanism, called CO homeostasis, was proposed based on studies of spo11 hypomorphic mutants with differential DSB activities (Martini et al., 2006). CO homeostasis maintains a consistent number of CO events despite fluctuations in the number of meiotic DSBs (Martini et al., 2006). CO homeostasis may be a reflection of CO assurance mechanisms. However, the molecular mechanisms underlying CO homeostasis remain unknown. Moreover, the additional layer of CO control per nucleus basis, called CO covariation, is proposed (Wang et al., 2019b).
Meiosis-specific ZMM (Zip, Mer, Msh) or SIC (Synaptic Initiation Complex) proteins are components of recombination nodules on the synaptonemal complex (SC) and are required for CO formation and CO control; both CO interference and assurance (Sym et al., 1993; Hollingsworth et al., 1995; Nakagawa and Ogawa, 1999; Agarwal and Roeder, 2000; Novak et al., 2001; Tsubouchi et al., 2006; Shinohara et al., 2008). ZMMs include Zip1, Zip2, Zip3, Spo22 (also called Zip4), Mer3, Msh4, Msh5, and Spo16. Mer3 encodes a 5′-3′ DNA helicase and binds recombination intermediates (Nakagawa et al., 2001). Msh4 and Msh5 are homologs of Escherichia coli MutS, forming the Msh4-Msh5 complex (MutSγ), which binds to a recombination intermediate (Hollingsworth et al., 1995; Snowden et al., 2004). Msh4-Msh5 complex activates a nuclease activity of the Mlh1-Mlh3 complex (MutLγ) (Cannavo et al., 2020; Kulkarni et al., 2020; Dai et al., 2021). Zip2, Spo22/Zip4, and Spo16 form a complex (ZZS) required for SC elongation, which also binds to a recombination intermediate (Shinohara et al., 2008; De Muyt et al., 2018; Arora and Corbett, 2019). Msh4-Msh5 and ZZS complexes display differential roles in CO formation and control (Shinohara et al., 2008).
Coordinated activities of two recombinases, Rad51 and Dmc1, are required for proper strand invasion to form a displacement D-loop with a single-stranded DNA of the DSBs with homologous duplex DNA (Bishop et al., 1992; Shinohara et al., 1992; Shinohara et al., 2000; Shinohara et al., 2003). Stabilization of the D-loop to form a single-end invasion (SEI) or ejection of the invading strand is a critical regulatory step in the CO/NCO decision (Allers and Lichten, 2001; Hunter and Kleckner, 2001; Borner et al., 2004). The SEI is a specific intermediate for crossing over, which is converted into double Holliday junctions (dHJ) intermediate (Schwacha and Kleckner, 1994; 1995). Msh4-Msh5 complex stabilizes nascent joint molecules and activate a nuclease activity of the Mlh1-Mlh3 complex (MutLγ) for the resolution of dHJs into COs (Snowden et al., 2004; Cannavo et al., 2020; Kulkarni et al., 2020). Crossover interference is proposed to implement around the SEI formation (Kleckner, 2006; Shinohara et al., 2008). Moreover, recruitment of the Msh4-Msh5 complex to meiotic chromosomes depends on Zip3, but not other ZMM such as Zip2, Spo22/Zip4, or Mer3 (Shinohara et al., 2008). Zip3 has a conserved RING-finger motif and is predicted to function as Ubiquitin-E3 ligase or small ubiquitin-like modifier (SUMO)-E3 ligase (Perry et al., 2005; Cheng et al., 2006; Shinohara et al., 2008).
Xrs2 is a regulatory subunit of the MRX complex, which is required for DSB end resection, the DNA damage response, and nonhomologous end-joining during the vegetative cell growth (Johzuka and Ogawa, 1995; Tsubouchi and Ogawa, 1998; Usui et al., 1998; Palmbos et al., 2005; Matsuzaki et al., 2008; Mimitou and Symington, 2009; Ho and Burgess, 2011). In meiotic prophase I, Xrs2 is necessary for not only DSB end resection but also DSB formation, which could be mediated by the interaction with Mer2 (Arora et al., 2004). In addition, Xrs2 interacts with a meiosis-specific protein Pch2 and the interaction is involved in checkpoint signaling for meiotic recombination (Ho and Burgess, 2011). We previously isolated several xrs2 mutations, and some showed defects in nonhomologous end-joining through interaction with DNA ligase IV in budding yeast (Shima et al., 2005). The mutants also had differential effects on the frequencies of meiotic DSBs, as seen with spo11 hypomorphic mutants (Henderson and Keeney, 2004). The effects of various xrs2 mutations on meiotic DSB frequencies could be explained by varied instability of mutant Xrs2 mutant proteins associated with these alleles (Shima et al., 2005).
Here, we used xrs2 hypomorphic mutants to examine the relationship of global meiotic DSB frequencies with ZMM/SIC assembly on meiotic chromosomes as well as CO formation and control. Immuno-staining revealed that number of foci containing not only Rad51 and Dmc1 but also most ZMM proteins including Zip3 is proportional to DSB frequencies in the xrs2 mutants. On the other hand, Msh5 ensembles on chromosomes showed a non-linear response to reduced DSB numbers. Our genetics analysis also confirmed CO homeostasis in response to reduced DSBs and showed a chromosome-specific effect of CO homeostasis. These suggest an important role of yeast MutSγ complex in the implementation of CO homeostasis, thus CO control.
Materials and methods
Strains and media
All yeast strains and their genotypes are shown in Supplementary Table S1. We used the isogenic Saccharomyces cerevisiae SK1 strain. The spo11 mutant strains were derived from crossing a wild-type strain (MSY831) with SKY330 (spo11-HA) or SKY531 (spo11-YF), gifts from Dr. Scott Keeney. Synthetic complete media with 7.25 µM CuSO4 was used for cup2 selection.
Antibodies
Antibodies specific for Zip1 (generated in rabbit and rat), Zip3 (rabbit and rat), Mer3 (rabbit), Spo22 (chicken), Msh5 (rabbit), Dmc1 (rabbit), and Rad51 (rabbit and guinea pig) were described previously (Shinohara et al., 2008; Zhu et al., 2010; Matsuzaki et al., 2012; Sasanuma et al., 2013). We used two different rabbit anti-Msh5 antisera (Shinohara et al., 2008) and were able to observe two kinds of Msh5 foci dependent on a lot of Msh5 antibodies. In this study, we used an antibody that recognizes brighter ones specifically, which were used in our previous Chromatin-Immunoprecipitation of Msh5 (Nandanan et al., 2021). This might be a reason why we observed fewer Msh5 foci than in our previous report (Nishant et al., 2010).
Cytology
Immunostaining of yeast meiotic chromosome spreads was performed as described (Shinohara et al., 2000). Stained samples were observed using an epifluorescence microscope (Zeiss Axioskop 2) and a ×100 objective (Zeiss AxioPlan, NA1.4). Images were captured with a CCD camera (Retiga; Qimaging) and processed using IP lab (Silicon) and Photoshop (Adobe). To count protein foci, >100 nuclei were counted for each sample. Pairs of foci were considered to colocalize if >50% of one side overlapped as described (Shinohara et al., 2000). The fluorescent intensity of Zip3 single-focus was measured by using the auto-thresholding signal intensity in Imaris software (Oxford Instrument). Strains used for this analysis were wild-type (NKY1551), xrs2–314M (MSY1992), xrs2–228M (MSY1524), and xrs2–84M (MSY1494).
Genetic analysis of meiotic recombination
Genetics distances between markers and CO interference were analyzed using the MacTetrad 6.9.1 program (merlot.wekj.jhu.edu) as described (Shinohara et al., 2003; Shinohara et al., 2008; Shinohara et al., 2019). Parental haploid strains were mated for 3 h on YPAD (1% bacto-yeast extract, 2% bacto-peptone, 2% glucose, 0.004% adenine sulfate) plates at 30°C and then transferred onto SPM (0.3% potassium acetate, 0.02% raffinose) plates. After incubation at 30°C for 48 h, tetrads were dissected onto YPAD plates and incubated for 2 days. Genotyping was performed as described (Shinohara et al., 2003). To avoid aberrant clones (e.g., those containing mitotic COs), at least four independent crosses were carried out and pooled for further analysis. When analyzing interference or calculating genetic distances, we excluded tetrads with non-Mendelian segregation of a diagnostic marker from the analysis. Map distances were determined using Perkins equation: [distance in (cM)] = 100/2 (TT + 6NPD)/(PD + TT + NPD) (Perkins, 1949), where tetra types (TT), non-parental ditypes (NPD), parental ditypes (PD) observed. Standard errors were calculated using the Stahl Lab online tool (https://elizabethhousworth.com/StahlLabOnlineTools/). Interference values are expressed as the NPD ratio. The fraction of tetrads expected to be NPDs was determined from the Papazian equation: NPDexp = 1/2 [1 − TT − (1 − 3TT/2)2/3] (Papazian, 1952). To measure coincident double COs in adjacent intervals, the frequencies of tetrads with recombination in each of the two intervals were determined by summing TT and NPD tetrads for those intervals and dividing by the total number of tetrads (Shinohara et al., 2003). The expected frequency of coincident recombination is given by the product of two single-interval frequencies. Coefficient of coincidence (CoC) CO is calculated as follows: CoC = [CO(A∩B)]/[CO(A) × CO(B)], where A and B are CO frequencies in an adjacent single interval. Strains used for this analysis are wild-type (MSY4304/4245), xrs2–314M (MSY4314/4316), xrs2–228M (MSY4310/4312), and xrs2–84M (MSY4306/4308).
Results
The xrs2 hypomorphic mutants showed differential DSB frequencies
We previously reported that N-terminal truncations of Xrs2 significantly reduce meiotic DSB formation at the HIS4–LEU2 hotspot (Shima et al., 2005). The xrs2–84M, xrs2–228M, and xrs2–314M mutants lack N-terminal 83, 227, and 313 amino acids, respectively (Figure 1A). On the other hand, even in the largest deletion, the xrs2–314M mutation does not cause any reduction of meiotic DSBs at the locus (Shima et al., 2005) with normal spore viability (Table 1). Despite the DSB reduction, xrs2–228M exhibits normal levels of spore viability. In contrast, the xrs2–84M allele, even though it encodes the smallest truncation (Figure 1A), shows significant reductions in spore viability of 52.4% (Table 1), as shown previously (Shima et al., 2005). The reduced spore viability in xrs2–84M cells is not caused by the deletion of the Forkhead-associated (FHA) domain of Xrs2 per se but rather by reduced levels of Xrs2 protein, as overexpression of Xrs2–84M protein rescues spore viability of the xrs2-84M mutant in a dose-dependent manner (Shima et al., 2005).
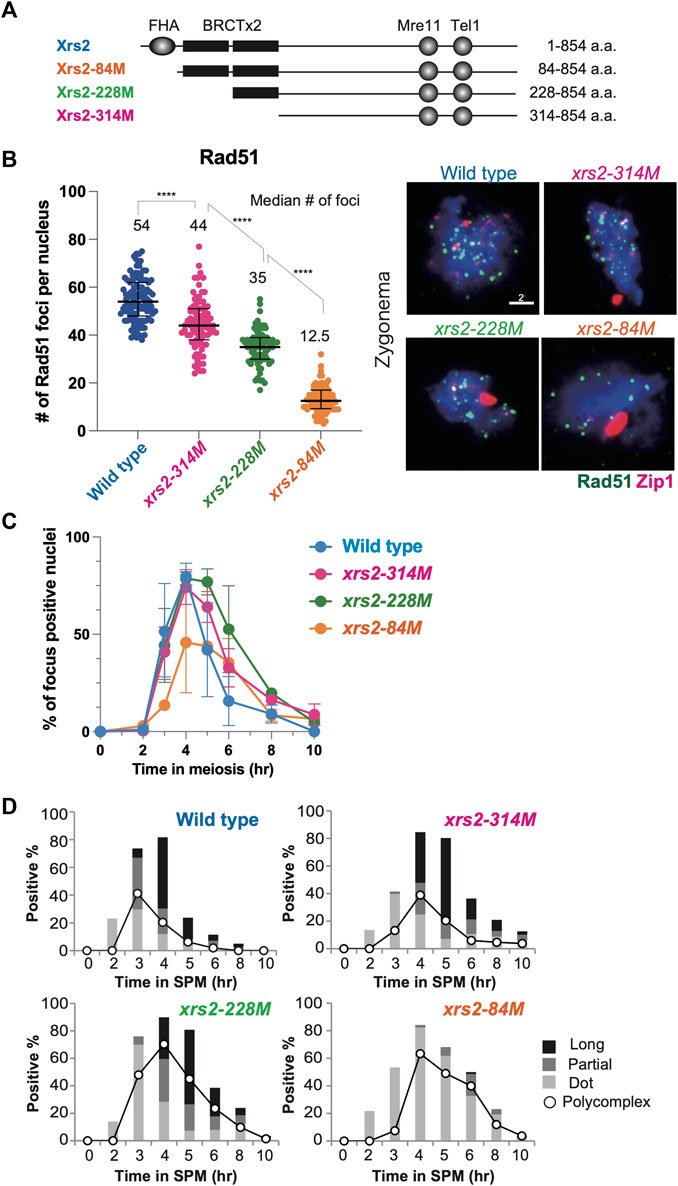
FIGURE 1. Rad51 focus formation and SC elongation in xrs2 hypomorphic alleles. (A) Schematic representation of protein domain structure for yeast Xrs2 and truncated proteins encoded by xrs2 hypomorphic alleles. The FHA domain and BRCA1 C-terminus (BRCT) domains, Mre11-binding and Tel1-binding domains are shown. (B) The number of Rad51 foci in each nucleus of wild-type, xrs2–314M, xrs2–228M, and xrs2–84M strains; wild-type (NKY1551), xrs2–314M (MSY 1992), xrs2–228M (MSY1524), xrs2–84M (MSY1494) was counted at the time point when the presence of focus positive nuclei in each strain peaked (4 h in wild type, xrs2–314M, and xrs2–228M, and 6 h in xrs2–84M). Median numbers of Rad51 were indicated. Error bar shows median and interquartile. Statistical significance was determined using Mann-Whitney U-test (****p < 0.0001). The right panel shows images of nuclear spreads in the zygotene stage that were labeled for Rad51 (green) and Zip1 (red). Scale bar = 2 µm. (C) Kinetics of Rad51-focus assembly and disassembly on meiotic nuclear spreads. A spread with more than 5 Rad51 foci was classified as a focus-positive nucleus. At each time point, more than 100 nuclei were counted. (D) Zip1-positive nuclei were classified into three categories: punctate foci (Dot, light gray), partial linear (Partial, gray), and full SC (Long, black). The kinetics of Zip1 poly-complex formation is represented by opened circles.
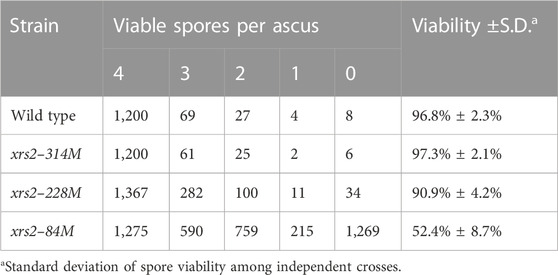
TABLE 1. Spore viability of the xrs2 mutants.
We further characterized meiotic defects for the three xrs2 hypomorph mutants in more detail. We estimated the total number of meiotic DSBs in xrs2 mutants by analyzing the number of immuno-stained Rad51 foci on meiotic chromosome spreads, which correspond to DSB sites (Bishop et al., 1992; Shinohara et al., 2000). We first counted the number of Rad51 foci in spo11 hypomorphic mutants; spo11-HA/spo11-HA, spo11-HA/spo11-Y135F and spo11-Y135F/spo11-Y135F, which decreases DSB levels on chromosomes III, VII and VIII to ∼80%, ∼30% and 0%, respectively (Martini et al., 2006). The average Rad51-focus number in the wild type was 54.2 ± 0.7 (± Standard deviation [SD] at 4 h). The number at 4 h in the spo11-HA/spo11-HA and spo11-HA/spo11-Y135F was 39.4 ± 5.9 and 19.0 ± 0.1, respectively, while the spo11-Y135F/spo11-Y135F mutant formed little Rad51 foci as described previously (Bishop, 1994). The number of Rad51 foci is roughly proportional to DSB frequency on the three chromosomes in the various spo11 hypomorphic mutants (Martini et al., 2006) (Supplementary Figure S1A). Rad51-focus number per spread could be used as a proxy for a total DSB number in a single nucleus.
We then studied the Rad51-focus number in the xrs2 mutants and found that the average number of Rad51 foci within meiotic nuclei of wild type, xrs2–314M, xrs2–228M, and xrs2–84M was 54.2 ± 0.7, 42.8 ± 7.9, 35.7 ± 1.7 and 14.3 ± 4.8, respectively (Figure 1B). To avoid the kinetic effect, we analyzed the Rad51-focus number at 4, 5, or, 6 h, and then we decided to analyze 4-h samples which are when the peak of focus formation in each xrs2 mutant (Figure 1C). Thus, from a relative decrease of Rad51 foci, we estimated that DSBs in xrs2–314M, xrs2–228M, and xrs2–84M mutants were reduced by 21%, 35%, and 74% compared with wild type, respectively. A similar reduction was observed for Dmc1 foci; an average number at 4 h of wild type, xrs2–314M, xrs2–228M, and xrs2–84M was 57.4 ± 3.3, 47.4 ± 5.6, 39.3 ± 1.9 and 18.3 ± 5.6, respectively. The xrs2 mutant cells also showed slight delays in the disappearance of Rad51-focus positive spreads during meiosis (Figure 1C). The delayed disassembly of Rad51 foci suggests the role of the Xrs2 in meiotic DSB repair.
Substantial DSB levels are required for Zip1 elongation
A meiosis-specific chromosome structure, the synaptonemal complex (SC), is formed between homologous chromosome axes. SC formation depends on meiotic recombination, thus DSB formation (Alani et al., 1990; Padmore et al., 1991). We also checked the effect of differential DSB levels in the xrs2 mutants on SC formation by immune-staining analysis of Zip1 protein, which is a component of the central region of the SC (Sym et al., 1993). The Zip1-staining was classified into long, short lines, and dots (Figure 1D) as described previously (Shinohara et al., 2003). Like the wild type, fully-elongated Zip1 lines were observed in both the xrs2–314M and xrs2–228M mutants although the mutants showed only a 1-h delay in the appearance of long Zip1 lines as compared to the wild type, which is associated with a higher frequency of nuclei containing Zip1 poly-complex structures, an indicator for a defect in Zip1 elongation (Sym and Roeder, 1995). And the mutants delayed disassembly of Zip1 structure, consistent with delayed DSB repair in the mutants. The xrs2–84M mutant, which had the lowest level of DSBs (∼25%), showed a clear defect in Zip1 elongation with very few Zip1 long lines (Figure 1D). This indicated that substantial levels of DSBs were required for proper Zip1 elongation, thus chromosome synapsis. Similar results are seen with spo11 mutants (Henderson and Keeney, 2004) and other mutants which reduced DSB levels (Bani Ismail et al., 2014).
The two BRCT-like domains of Xrs2 (amino acids 124-313; Figure 1A) have functions related to Pch2 (Ho and Burgess, 2011), which is required for normal SC formation and timely meiotic recombination progression (San-Segundo and Roeder, 1999; Borner et al., 2008). The pch2 mutant cells show unusual localization of Hop1 protein on pachytene chromosomes with a delay in meiotic recombination (Borner et al., 2008). However, like in the wild type, we found dotty staining of Hop1 along long Zip1 lines in the xrs2-314M cells, which is different from long Hop1 lines on Zip1 lines seen in pch2 cells (Supplementary Figure S2). The BRCT domains of Xrs2 do not appear to play a role in the Pch2 function in the Hop1 loading and/or unloading.
Reduced DSBs decrease the association of ZMM/SIC and recombination proteins on meiotic chromosomes in xrs2 mutants
Previously, it is shown that Zip3-GFP foci show a homeostatic response when DSBs are reduced in spo11 hypomorphic mutants (Henderson and Keeney, 2004). First, we confirmed that Zip3 foci show the non-linear response in the spo11 hypomorphic mutants by using our anti-Zip3 antibody without any tag-conjugation to Zip3 protein like previously reported (Supplementary Figures S1B, C). A steady-state number of Zip3 population was 61.5 (median), 58, 22, and 13 in wild-type, spo11-HA/spo11-HA, spo11-HA/spo11-Y135F, and spo11-Y135F/spo11-Y135F, respectively. The spo11-HA/spo11-HA mutant with ∼78% DSB level maintains a similar Zip3 focus number to the wild type (94%), indicating a non-linear relationship as shown previously (Martini et al., 2006). The spo11-HA/spo11-Y135F mutant with ∼29% DSB levels shows a higher Zip3 focus number (∼36% of the wild-type) that expected.
We also analyzed the number of Zip3 foci as well as other ZMM foci including Spo22/Zip4, Msh5 and Mer3 when DSB frequencies are decreased by the xrs2 hypomorphs (Figure 2A). Immunostaining was carried out and the focus number was counted at 4 h after meiosis entry for wild-type. To avoid the kinetic effect, we counted the focus number at 4 h (xrs2–314M and –228M) or 6 h (xrs2–84M) which is when the peak of focus formation in each xrs2 mutant (Supplementary Figure S3A-representative kinetic analysis and Supplementary Figure S3D). The average number of foci per nucleus from four independent time courses (more than 100 focus-positive nuclei were analyzed for each counting) for Rad51, Dmc1, Zip3, and Msh5, and from two independent time courses for Spo22/Zip4 and Mer3 are shown in Figure 2B. As shown above (Figure 1), the average numbers of Rad51 and Dmc1 foci at 4 h in wild-type nuclei were 54.2 ± 0.7 (SD) and 57.4 ± 3.3, respectively (Figure 2B), which is consistent with a previous study (Shinohara et al., 2000). The ZMM/SIC proteins Zip3, Spo22/Zip4, and Mer3 exhibited similar numbers of foci in wild-type nuclei: 60.9 ± 8.6, 63.4 ± 11, and 65.5 ± 9.8, respectively (Figure 2B). There were few significant differences in a steady-state number of foci between ZMM foci with either Zip3, Mer3, or Spo22/Zip4, and the RecA-like recombinases (Figures 2A,B). Of note, the steady state number of Zip3 foci in the wild type detected by anti-Zip3 was almost the same as the numbers reported to Zip3-myc (∼60 foci) by two independent groups (Yoon et al., 2016; Hong et al., 2019; Tan et al., 2022) but about twice than that reported to Zip3-GFP (Henderson and Keeney, 2004).
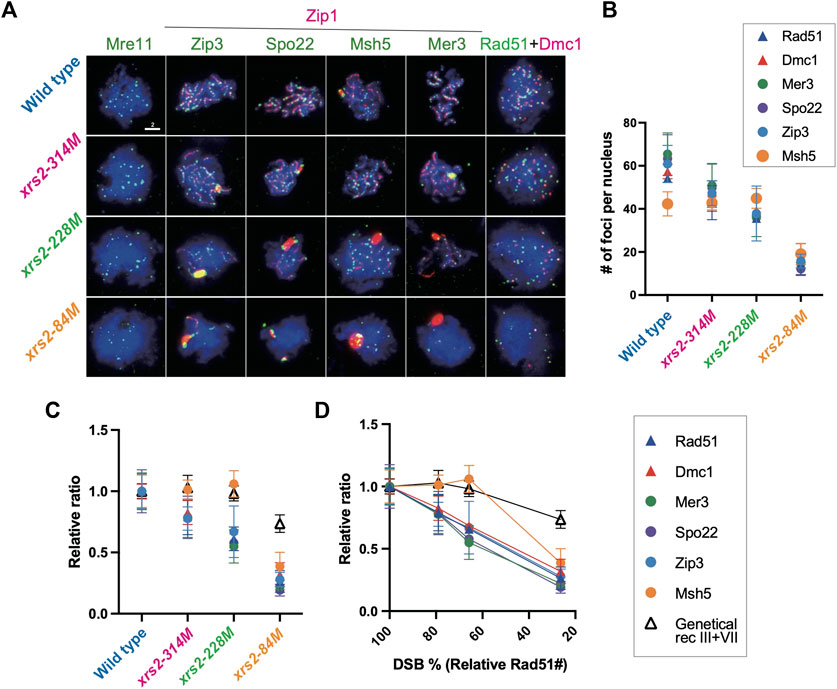
FIGURE 2. Assembly of recombination and ZMM/SIC components when DSB levels are reduced. (A) Colocalization of Zip1 (red; rat) and Zip3 (green; rabbit), Spo22/Zip4 (green; chicken), Msh5 (green; rabbit), or Mer3 (green; rabbit). Colocalization of Rad51 (green; guinea pig) and Dmc1 (red; rabbit). Genotypes are indicated. Wild-type (NKY1551), xrs2–314M (MSY1992), xrs2–228M (MSY1524), xrs2–84M (MSY1494) were used. Scale bar = 2 µm. (B) The number of foci of indicated proteins per nucleus in wild-type and xrs2 mutants. The focus number in wild type, xrs2–314M, xrs2–228M, and xrs2–84M was counted at the time point when the presence of focus positive nuclei in each strain peaked (4, 5, or 6 h) as shown 1B. Error bars show the average and SD. (C) The number of foci of indicated proteins plotted against each average number of Rad51 foci (i.e., DSBs) associated with each strain (Figure 1B). Values are presented as a ratio relative to the wild type. Open triangles indicate relative CO frequencies as shown in (B). Error bars show the average and SD. (D) The number of foci of indicated proteins in wild-type and xrs2 mutants (non-normalized values). Error bars indicate the mean values and standard deviations from at least three independent experiments. Error bars show the average and SD. A black line with open triangles indicates relative CO frequencies of sums of analyzed intervals in chromosomes III and VII shown in Figure 4B. Values are presented as a ratio relative to the wild type.
When xrs2 mutants were examined, the focus number of Rad51, Dmc1, and ZMM/SIC proteins such as Zip3, Spo22/Zip4, and Mer3 reduce linearly along with meiotic DSB frequencies in the mutants (Figures 2B–D). Like Rad51/Dmc1 foci, focus numbers of Zip3, Spo22/Zip4, and Mer3 are decreased when DSB frequencies are reduced. When compared with the number, Zip3, Spo22/Zip4 and Mer3 shows linear correlation with Rad51 (R = 0.999, 0.999, 0.994, and 0.982 for Dmc1, Zip3, Spo22/Zip4 and Mer3, respectively). These suggest that, like Rad51/Dmc1 recombinases, Zip3-, Spo22/Zip4-, and Mer3-focus number is linearly correlated with DSB number. Moreover, these are consistent with the result that the focus formation of these proteins depends on meiotic DSB formation (Agarwal and Roeder, 2000; Nakagawa et al., 2001; Shinohara et al., 2008).
While the Zip3-focus number shows a linear relationship with DSB frequency in the xrs2 mutants (Figure 2B; see below), the number of Zip3-GFP foci (Henderson and Keeney, 2004) and Zip3 foci detected by anti-Zip3 (Supplementary Figure S1B) exhibit a non-linear relationship in spo11 hypomorph mutants. This suggests a role of N-terminal regions such as the FHA domain and/or BRCT repeat in the homeostatic response of ZMM foci of Zip3 as well as Mer3 and Spo22/Zip4 to reduced DSBs.
Msh5-focus numbers are maintained even with reduced meiotic DSBs are reduced
We found that Msh5 foci showed a unique behavior on the chromosomes among ZMM proteins. In the wild type, the average (steady-state) number of Msh5 foci is 42.4 ± 5.6, which is significantly lower than those of Rad51, Dmc1, Zip3, Mer3, and Spo22/Zip4 (Figures 2A, B), suggesting the presence of a regulatory mechanism for Msh5-focus formation.
Different from Zip3, Spo22/Zip4, and Mer3 as well as Rad51/Dmc1, Msh5 foci showed a non-linear relationship in its number to reduced DSBs in the xrs2 mutants. The number of Msh5 foci in the xrs2–314M and xrs2–228M strains was 42.9 ± 3.4 and 44.9 ± 4.6, respectively, which is similar to that in the wild type of 42.4 (Figure 2B; Supplementary Figure S3B). Thus, Msh5 foci exhibited homeostasis as DSBs were reduced by ∼40% (in xrs2–228M). This non-linear response of ZMM foci was reported to the foci containing Zip3-GFP (Henderson and Keeney, 2004) and Zip3 foci detected by anti-Zip3 (Supplementary Figure S1B) in spo11 hypomorph mutants. On the other hand, more dramatic reductions in meiotic DSBs did affect the Msh5-focus number, as the number of Msh5 foci in xrs2–84M mutant cells decreased substantially to 19.1 ± 4.9, which represented 38.6% of wild type. However, this reduction of Msh5-focus number in the xrs2–84M mutant is much milder than those of Rad51, Zip3, Spo22/Zip4, and Mer3 (26.4, 27.9, 19.2, 22.1%, respectively, in Figures 2C, D). This suggests that the homeostatic response of Msh5 foci substantially operates even in the xrs2–84M mutant.
Notably, the similar non-linear relationship was seen for Msh5 foci in spo11 hypomorphic mutants (Supplementary Figure S1C). Importantly, the number of Msh5 foci (41 [median] and 39 foci in wild-type and spo11-HA/spo11-HA strains, respectively) was lower than that of Zip3 foci (61.5 and 58 in wild-type and spo11-HA/spo11-HA strains, respectively, in Supplementary Figure S1C), supporting a distinct response between Msh5 and Zip3 foci.
Msh5-focus formation depends on Zip3 (and Zip1), but not on Spo22/Zip4 or Spo16 (Shinohara et al., 2008). We analyzed the relationship between the Zip3 and Msh5 localization by double staining of “pachytene” cells (at 4 h in wild-type and 5 h in xrs2 mutants) (Figure 3A). Medians of Zip3 foci number distribution in wild type, xrs2–314M, xrs2–228M, and xrs2–84M cells were 63, 56, 54, and 16, respectively (Supplementary Figure S3C). Although the number of Zip3 foci co-stained with Msh5 in the xrs2–84M is similar to that co-stained with Zip1 shown in Figure 2B (16 versus 14), the focus number of Zip3 co-stained with Msh5 in the xrs2–314M and xrs2–228M mutants were significantly higher than that co-stained with Zip1 (56 versus 45 and 54 versus 35 in the xrs2–314M, and xrs2–228M mutants). The focus-number distribution indicates variations of the focus number are smaller in the double-staining of Msh5 and Zip3 than in the co-staining with Zip1 (Supplementary Figures S3B, C). This suggests that Zip3 co-stained with Msh5 showed a homeostatic response as shown previously (Henderson and Keeney, 2004) and in this study (Supplementary Figure S1C). On the other hand, in this double staining of Zip3 and Msh5, the medians of Zip3 focus number distribution were 47, 43, 49, and 10 in wild-type, xrs2–314M, xrs2–228M, and xrs2–84M mutant cells, respectively (Supplementary Figure S3C), which are not different from those co-staining with Zip1. A simple interpretation is a kinetic effect such that the focus numbers of ZMM proteins in the pachytene stage are more than those in earlier stages. Supporting this idea, the focus numbers were increased in later time points of prophase I, especially of Zip3 foci in the xrs2-228M mutant (Supplementary Figure S3A).
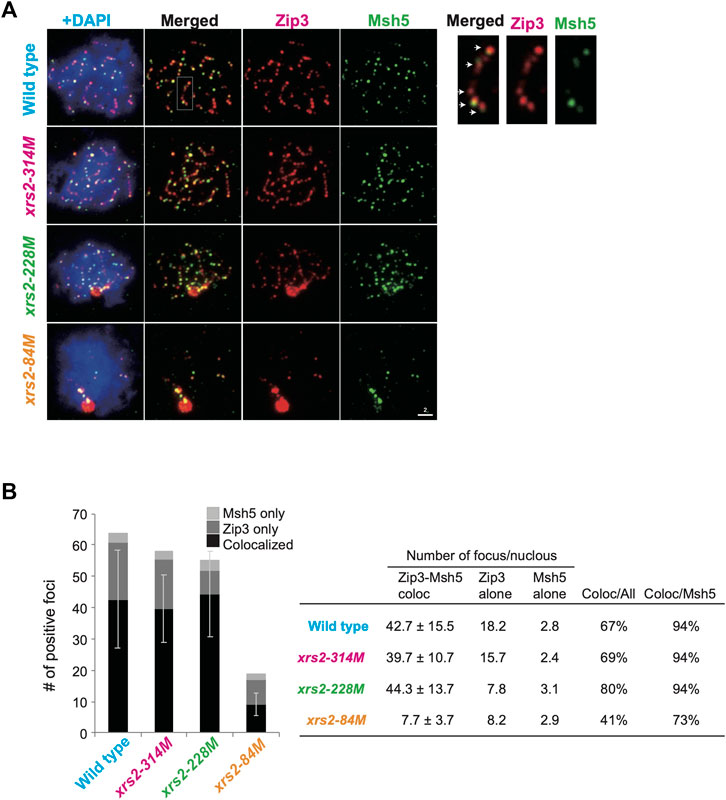
FIGURE 3. Colocalization of Zip3 and Msh5 on meiotic chromosomes (A) Meiotic nuclear spreads were stained for Zip3 (red) and Msh5 (green) by using anti-Zip3 (red; rat) and anti-Msh5 (green; rabbit). Anti-Zip3 used here was different from that in Figure 2. Genotypes are indicated. A magnified image of a wild-type sample is shown on the right. Arrows show colocalization of Zip3 and Msh5. Scale bar = 2 µm. (B) Colocalization frequencies for Zip3 and Msh5. Foci were classified into three categories: Zip3 and Msh5 (colocalized, dark gray), Zip3-only (pale gray), and Msh5-only (gray). The average numbers with standard deviations of foci in three categories in wild-type and xrs2 mutants are shown. The number of nuclei analyzed in wild type (4 h), xrs2-314M (4 h), xrs2-228M (4 h), and xrs2-84M (5 h) is 102, 105, 105, and 59, respectively.
Importantly, even in the double-staining of Msh5 and Zip3, the Zip3-focus number is higher than the Msh5-focus number in any strains (Figure 3B). In the wild type, 67% of Zip3 foci colocalized with Msh5, and 94% of Msh5 foci colocalized with Zip3. In xrs2 mutants, Zip3-Msh5 colocalization frequencies in Zip3 foci were 69%, 80%, and 41% for the xrs2–314M, xrs2–228M, and xrs2–84M mutants, respectively. In addition, 94%, 94%, and 73% of Msh5 foci colocalized with Zip3 in xrs2–314M, xrs2–228M, and xrs2–84M mutants, respectively (Figure 3B). This is consistent with the idea that some Zip3 foci become a site for Msh5 assembly, which is regulated by DSB levels. In addition, Zip3 foci colocalized with Msh5 seemed brighter than Zip3 without Msh5 (Figure 3A; Supplementary Figure S1E). We speculate the presence of stepwise homeostatic response of ZMM-focus assembly in response to meiotic DSBs in a context-dependent manner (See Discussion).
CO homeostasis functions more effectively on chromosome VII
Using spo11 alleles with ∼80%, ∼70%, and ∼20% of wild-type DSB levels, Martini et al. (2006) showed CO homeostasis which maintains CO levels despite reduced meiotic DSBs. We, therefore, asked whether xrs2 alleles with ∼80%, ∼65%, and ∼25% of wild-type DSB levels also exhibited CO homeostasis since Zip3 foci showed non-linear response to reduced DSBs in the spo11-mutants, but not in the xrs2 mutants. We measured CO and NCO frequencies by the dissection of tetrads for SK1 yeast strains with different genetic markers on chromosomes III and VII; a short chromosome (chromosome III with a synthetic recombination hotspot at the HIS4 locus [HIS4–LEU2]) and a long chromosome (chromosome VII) (Higashide and Shinohara, 2016) (Figure 4A). We analyzed the segregation of genetic markers associated with these chromosomes in >1,200 tetrads with four viable spores to calculate CO frequencies (in centimorgans; cM) for each strain (Supplementary Tables S2, S3); the number of tetrads analyzed was larger than that in the previous study (>750 four-viable tetrads; Martini et al., 2006). Tetrad analysis revealed that wild type of SK1 strain, xrs2–314M, xrs2–228M, and xrs2–84M strains had spore viabilities of 96.8%, 97.3%, 90.9%, and 52.4%, respectively (Table 1). The results of genetic analysis in wild-type controls (Figures 4, 5) are generally consistent with our previous report (Shima et al., 2005; Higashide and Shinohara, 2016; Shinohara et al., 2019). We assumed that DSB distribution in various xrs2 strains is not altered and DSB levels are uniformly reduced along the genome, which is a simple but cautious assumption given that DSB formation was controlled in various ways (Yadav and Claeys Bouuaert, 2021) and DSBs are proceeded differentially in the mutant (see above).
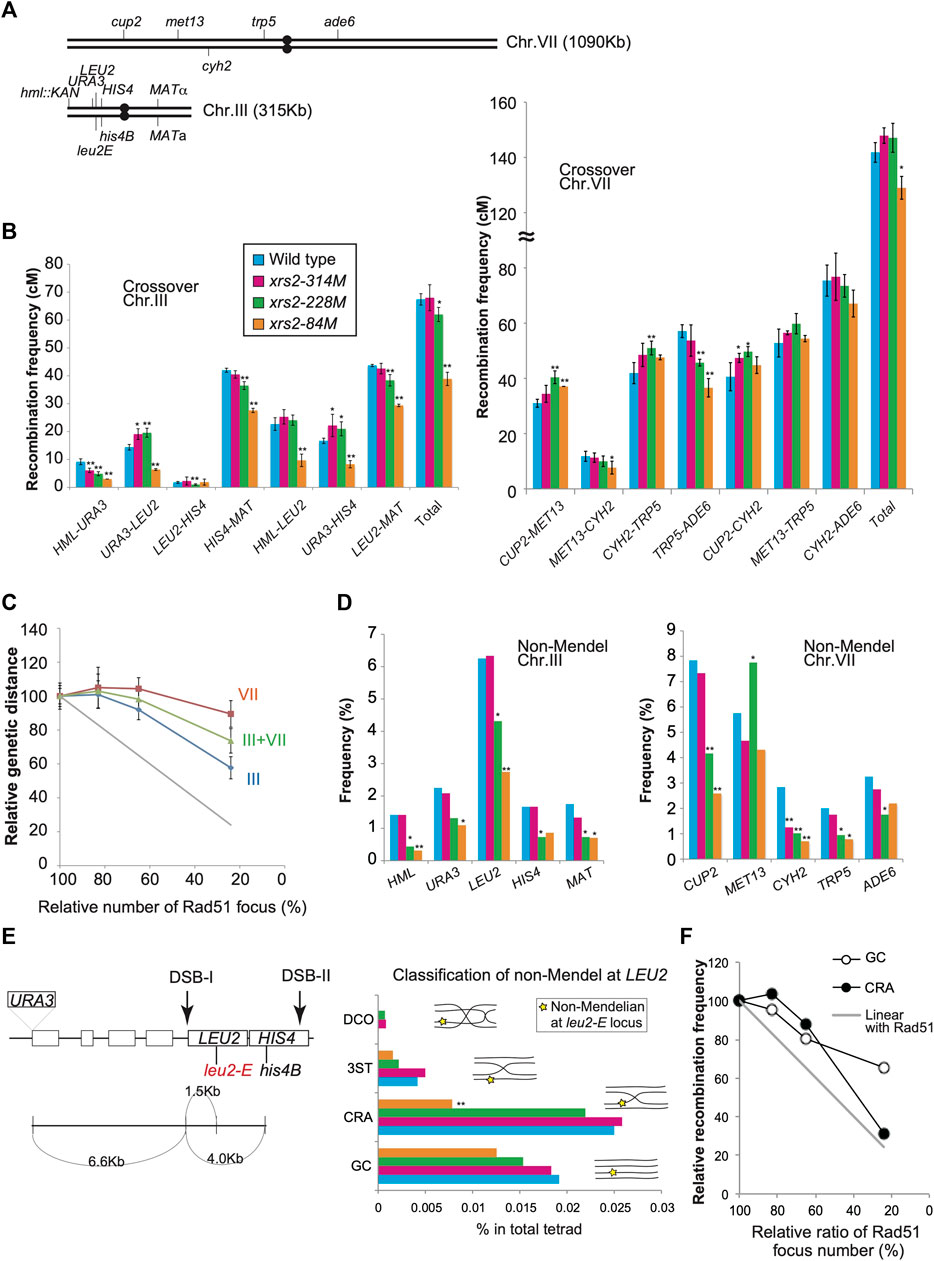
FIGURE 4. Genetic analysis of xrs2 hypomorphic alleles. (A) Schematic representation of genetic markers on chromosomes VII and III. (B) CO frequencies within indicated genetic intervals on chromosomes III and VII. Genotypes are color-coded. Error bars indicate the standard deviation from four independent crosses. Wild-type (MSY4304/4245), xrs2–314M (MSY4314/4316), xrs2–228M (MSY4310/4312), and xrs2–84M (MSY4306/4308) were used. Statistical significances were calculated by using Student’s t-test. (C) Relationships between the CO frequencies and DSB levels. The x-axis values indicate the mean number of Rad51 foci for each xrs2 mutant relative to that in the wild type. The y-axis values indicate the mean genetic distance sums for each xrs2 mutant relative to the wild type (for chromosomes III or VII). The gray line shows a linear relationship. (D) Non-Mendelian segregation frequencies at the indicated genetic loci are shown. Statistical differences were analyzed using Fisher’s exact test with Yates correction. (E) Schematic representation of the HIS4–LEU2 hotspot on chromosome III. Locations of the leu2-E and his4B mutations are shown. Rectangles represent genes. The non-Mendelian fraction at the LEU2 locus was classified by analyzing the linkage of the URA3, LEU2, and HIS4 loci. GC; gene conversion at the LEU2 locus without CO between URA3 and HIS4; CRA; CO-associated gene conversion on the same strand as the CO, 3ST; CO-associated gene conversion on the strand lacking CO, DCO; gene conversion associated with a double CO. (F) Non-linear relationship of COs or NCOs derived from the non-Mendelian fraction at the leu2-E/LEU2 heteroalleles. The x-axis values indicate the relative (the mean) numbers of Rad51 foci for each xrs2 mutant relative to the wild type. The y-axis values indicate the relative frequencies of COs or NCOs for each xrs2 mutant. The gray line shows a linear relationship. Asterisks indicate statistically significant differences between the xrs2 mutant and wild type (**p < 0.01, *p < 0.05) (Supplementary Table S4).
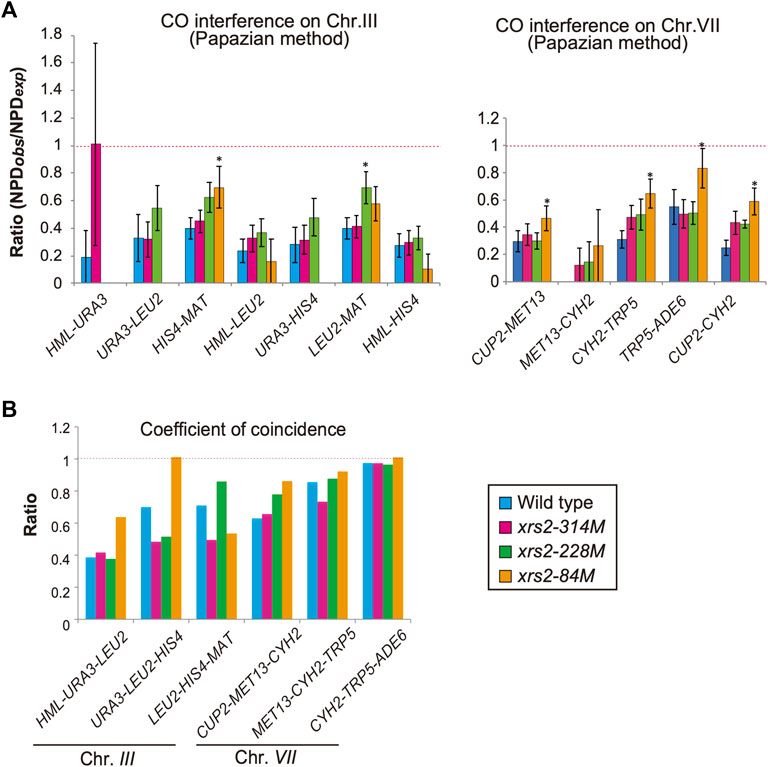
FIGURE 5. CO interference in xrs2 mutants. (A) CO interference for indicated genetic intervals on chromosomes III and VII. Genotypes are color coded. The NPDobs/NPDexp ratio for three intervals was calculated from TT and PD (Supplementary Tables S2, S3). A ratio of 1 indicates no interference. A Ratio <1 indicates positive interference. Error bars indicate the standard error of NPD ratios and the statistical significance of the difference in NPD ratio between the wild type and each xrs2 mutant was confirmed by an overlap of the SE value around the map distance or NPD ratio. (Supplementary Tables S2, S3). (B) The Coefficient of coincidence (CoC) of COs between adjacent intervals on chromosomes III and VII in wild-type and xrs2 mutants are shown. A ratio of 1 indicates no interference. A ratio of <1 indicates positive interference.
Chromosome VII: The xrs2–314M (∼80% DSBs) and xrs2–228M (∼65%) mutants showed wild-type levels of total CO frequency between the CUP2 and ADE6 loci, 127.9 ± 14.6 (105%) and 127.1 ± 7.9 (104%) cM, respectively, compared with 121.8 ± 9.4 cM for wild type (Figure 4B; Supplementary Table S2). The xrs2–84M mutant (∼25% DSBs) slightly, but significantly reduced CO frequency with 109 ± 9.6 cM (89%) relative to the wild type. These showed that CO levels responded non-linearly to a reduction of DSB frequencies (Figure 4C). This supports the CO homeostasis in response to DSB reduction (Martini et al., 2006). Among different intervals inspected, we see the interval-specific response to reduced DSB levels. The xrs2–314M mutant (∼80% DSBs) showed similar CO frequencies in all intervals to the wild type. The xrs2–228M mutant (∼65%) showed a slight reduction in the TRP5-ADE6 interval and similar CO levels in the MET13-CYH2 interval compared to the wild type. Interestingly, the mutant showed significantly increased CO frequencies in two intervals (CUP2-MET13 and CYH2-TRP5) relative to the wild type. This increased response of CO frequencies in response to DSB was not reported in the previous study (Martini et al., 2006). For xrs2–84M, two of the four single intervals showed wild-type levels of CO, despite a 76% reduction in meiotic DSBs. While the CUP2-MET13 interval increased the frequency compared to the wild type, the TRP5-ADE6 interval in the mutant significantly reduced CO frequency.
Chromosome III: The xrs2–314M mutant (∼80% DSB) showed wild-type levels of the total CO frequency between the HML and MAT loci, 68.0 ± 5.5 cM compared with 67.4 ± 3.1 cM for wild-type (Figure 4B; Supplementary Table S3). The xrs2–228M mutant (∼65%) slightly decreased CO frequency of 62.0 ± 4.0 cM (92%). On the other hand, the xrs2–84M mutant (∼25% DSBs) reduced 57.7% of the wild-type level (38.9 ± 4.4 cM), which is much higher than the expected frequency without the homeostasis (∼16.9 cM). For each interval, the xrs2–314M mutant slightly decreased CO in one interval (HML-URA3) among four intervals on the chromosome. The xrs2–228M mutant (∼65%) and the xrs2–84M mutant (∼25% DSBs) showed decreased CO frequencies in two and three intervals, respectively. In the LEU2-HIS4, the xrs2–314M and xrs2–228M mutants maintained wild-type CO levels while the xrs2–84M mutant decreased COs relative to the control (see below). Taken together, these suggested that chromosome III is less robust for CO homeostasis than chromosome VII (Figure 4C). Similar results were obtained in the previous study although it was not emphasized (Martini et al., 2006). However, we do need more caution on the interpretation of recombination on chromosome III, since our strains, but not a previous strain, contains an unusual recombination hot spot, HIS4–LEU2 on the chromosome.
When the combined CO frequencies on chromosomes III and VII are compared with the total DSBs level in the xrs2 mutants, the CO frequencies are maintained even in the xrs2–228M mutant with ∼65% DSBs (Figures 4B, C). This CO homeostasis is roughly correlated with that seen for Msh5 foci (Figure 2D).
NCO formation is sensitive to reduced levels of meiotic DSBs
Next, we analyzed frequencies non-Mendelian segregation at 10 genetic loci on chromosome III and VII in different xrs2 alleles (Figure 4A). For xrs2–228M (∼65% DSBs) mutant, four of five loci on chromosome III and four of five loci on chromosome VII showed significant decreases in non-Mendelian segregation frequencies (Figure 4D; Supplementary Table S4). The xrs2–314M mutant (∼80% DSBs) reduced the frequency only at the CYH2 locus. The xrs2–228M mutant, which maintains CO frequencies with 65% DSB reduction, seems to show reduced NCO. Strangely, the xrs2–228M mutant increased the frequency at the MET13 locus. For the xrs2-84M (∼25% DSBs), four of five loci on chromosome III and three of five loci on chromosome VII showed significant decreases in non-Mendelian segregation frequencies. The other three loci (HIS4, MET13, and ADE6) showed reduced frequencies relative to the wild type, but the difference is not significant. At the LEU2, CUP2, and MET13 loci, frequencies in the xrs2-84M mutant are significantly lower than those in the xrs2–228M mutant. In most cases, however, except for the HML locus, reductions in non-Mendelian segregation were not proportional to reductions in meiotic DSBs, as reported (Martini et al., 2006) (Figure 4D; Supplementary Table S4).
HIS4-LEU2: Non-Mendelian segregation is thought to result from a simple gene conversion or mismatch repair of heteroduplexes formed during CO formation (Nicolas and Rossignol, 1983; White et al., 1985). The URA3–LEU2–HIS4 interval on chromosome III has an artificial meiotic DSB hotspot (DSB-I) with leu2E mutation (an insertion allele of the EcoRI site) and URA3 insertion (Figure 4E). As leu2E and the URA3 insertion are very close to the DSB-I site (∼1.5 and ∼6.6 kb way, respectively), we assumed that LEU2/leu2 gene conversion with or without flanking crossover would come from DSB-I. Non-Mendelian tetrads of LEU2/leu2E heteroalleles (3 Leu+: 1 Leu- or 1 Leu+: 3 Leu-segregation) were initially selected, and then sorted into four classes based on the linkage with flanking markers, URA3 and/or HIS4 alleles; GC, Gene conversion; CRA, Crossover associated gene conversion; DCO, double CO; three strands, 3ST, gene conversion associated with incidental CO (schematic figures in Figure 4E middle graph). A previous study showed 40% and 14% of wild-type levels of DSB-I in the xrs2-228M and xrs2-84M mutants, respectively (Shima et al., 2005). The xrs2-228M maintained ∼90% of wild-type CO level (CRA and DCO classes). Moreover, decreased level of COs (CRA and DCO) in the xrs2-84M mutant (∼30%) is much higher than reduced DSB levels (14%) at the locus. These support the idea that CO homeostasis is operating at this locus (Figure 4F), which was not seen in the physical analysis of this locus in the previous study (Martini et al., 2006). GC frequencies were also reduced in response to decreased DSB levels (Figure 4F), although higher than expected in the xrs2-228M (80% to expected 40%) and xrs2-84M mutants (65% to expected 14%). These high frequencies of meiotic recombination in the xrs2-228M mutant cannot be explained by DSB-I. These might come from an event at DSBs other than DSB-I such as DSB-II.
Reduced levels of meiotic DSBs weaken CO interference
CO interference negatively regulates CO formation to maintain the appropriate number and spacing of COs (Muller, 1916). A previous study on CO interference in response to reduced DSBs (Martini et al., 2006) showed that the interference is maintained when DSB frequencies are reduced. To confirm this, we also analyzed CO interference in xrs2 mutants using the same data described above. In each interval, the tetrads were classified into three classes with a different combination of flanking markers: parental ditypes (PD), tetra types (TT), and non-parental ditypes (NPD). NPD is a tetrad class with “double” COs involving four chromatids in an interval, whose an expected frequency, NPDexp, is calculated from a frequency of the TT class, which mainly contains a single CO event in the interval (Papazian, 1952). First, we used the Papazian method to examine the ability of a CO to interfere with coincident COs in the interval by determining the ratio of observed NPD (NPDobs) to NPDexp (Figure 5A, Supplementary Tables S2, S3). In the wild type, the ratio of NPDobs to NPDexp, called the NPD ratio, is indicative of interference when the ratio is <1. Indeed, as reported previously (Higashide and Shinohara, 2016; Shinohara et al., 2019), the NPD ratio of seven intervals on chromosome III and VII in the wild type is 0.19–0.55 (Figure 5A; Supplementary Tables S2, S3), confirming CO interference within these intervals. In contrast, we did not detect any NPD tetrads within the MET13-CYH2 interval after analyzing >1,200 tetrads, indicating the presence of a strong interference in this interval (Figure 5A; Supplementary Tables S2, S3).
We then analyzed tetrads for the xrs2 mutants. For all xrs2 mutants, the NPD ratio associated with each interval on chromosomes III and VII was <1 (except for HML–URA3) (Figure 5A; Supplementary Tables S2, S3). In all cases, the ratio is statistically significant from one (no interference), showing that the CO interference is maintained in the mutants. Although the NPD ratio at the HML–URA3 in the xrs2–314M was about 1; the number of NPDobs in this interval was too low (1 for wild type, 2 for xrs2–314M, and 0 for the other alleles) to draw any significant conclusions. As Papazian’s NPD analysis requires an NPD fraction, which we could not obtain for some chromosome III intervals (e.g., URA3-LEU2) in xrs2–84M because of severe reductions of COs in the mutant. These suggest that CO interference could function even when the number of DSBs was reduced to 20% levels of the wild type. However, as discussed above, this idea depends on the similar DSB distribution along these reporter chromosomes in the xrs2 mutants to that in the wild type.
When compared with the NPD ratios in various xrs2 mutants with those in the wild type, we found that the NPD ratios in the HIS4-MAT, CUP2-MET13, CYH2-TRP5, and TRP5-ADE6 intervals in the xrs2–84M mutant (∼20% DSBs of wild type) are significantly higher than corresponding ratio in wild-type cells (Figure 5A; Supplementary Tables S2, S3). Higher NPD ratios in the mutant relative to the wild type are also observed in the HIS4-MAT and CYH2-TRP5 intervals of the xrs2–228M mutant (∼65% DSBs) as well as in the CYH2-TRP5 intervals of the xrs2–314M mutant (∼80% DSBs). These suggest weakened CO interference when DSB frequencies are reduced by the xrs2 mutations.
We also analyzed the frequency of double COs in two adjacent intervals using the tetrad data (above) for the coefficient of coincidence (CoC; Figure 5B; Supplementary Table S5). CoC is a ratio of an observed number of tetrads with simultaneous COs in adjacent intervals to an expected number of double crossovers, which is obtained from frequencies of a CO in each interval (Muller, 1916). In the wild type, five adjacent intervals showed a CoC ratio <1 (CoC for CYH2–TRP5–ADE6 is less than one but not statistically significant). The xrs2–314M and xrs2–228M mutants exhibited CoC ratios that were <1 for the five intervals. The xrs2–84M mutant showed CO interference for four adjacent intervals, but in the URA3–LEU2–HIS4 interval the CoC was 1.01 (Figure 5B; Supplementary Table S5). This indicated that a ∼80% reduction in meiotic DSBs caused a defect in CO interference at HIS4–LEU2 hotspot on chromosome III, which is an abnormal response of the xrs2–84M mutant in CO and NCO formation (Figures 4E, F).
CoCs in the xrs2 mutants were compared to those in the wild type. In the xrs2–84M mutant, CoC ratios are higher in four adjacent intervals, HML-URA3-LEU2, URA3-LEU2-HIS4, CUP2-MET13-CYH2, MET13-CYH2-TRP5, and CYH2-TRP5-ADE6 while lower in one interval, LEU2-HIS4-MAT. The xrs2–228M mutant shows a higher CoC ratio in the LEU2-HIS4-MAT and LEU2-HIS4-MAT, but lower in the URA3-LEU2-HIS4. These support the idea that CO interference is weakened when DSB frequencies are largely decreased by the xrs2 mutations.
Discussion
Here we analyzed meiotic CO formation and the assembly of proteins involved in CO formation in xrs2 hypomorphic mutants with different levels of DSB formation. The xrs2–314M and xrs2–228M mutants exhibited 20% and 35% reductions in meiotic DSBs, respectively, but wild-type levels of CO formation and spore viability. This indicated that CO homeostasis functions in the xrs2 mutant cells, as it does in spo11 mutants (Martini et al., 2006). In contrast, when DSBs were reduced by ∼80%, which was the case in xrs2–84M mutant, CO homeostasis weakened. We also described the homeostatic response of the formation of foci containing a ZMM protein, Msh5, but not Zip3 in the xrs2 mutants. These suggest that CO homeostasis is mediated by Msh5, thus, Msh5-containing MutSγ complex with Msh4.
Foci containing Msh5 exhibit homeostasis in response to reduced DSBs
By analyzing the number of foci containing different meiotic recombination proteins in an xrs2 mutant with reduced meiotic DSB formation, we found a linear correlation of the number of ensembles containing ZMM/SIC proteins (Zip3, Mer3, and Spo22/Zip4, but not Msh5) as well as Rad51 and Dmc1 (Figure 2B). The steady-state number of these foci is similar among the proteins. If the lifespan of these foci is similar, we expect the same number of ensembles of these proteins. ZMM-focus formation is independent of Rad51/Dmc1-focus formation (Shinohara et al., 2008), although the formation of both Rad51/Dmc1 and ZMM foci requires the formation of ssDNAs at meiotic DSB sites. These suggested that ensembles containing Zip3, Mer3, and Spo22/Zip4 were closely associated with the ssDNA region near Rad51/Dmc1. This is consistent with recent biochemistry and genome-wide mapping of ZMM proteins including Zip3 which bind the DSB sites in addition to chromosome axes (Serrentino et al., 2013; De Muyt et al., 2018).
Although this study revealed the linear relationship of Zip3-focus number to DSB level in the xrs2 mutants, a previous study showed a non-linear relationship between Zip3 foci and DSBs in spo11 hypomorphic mutants (Henderson and Keeney, 2004). One critical difference between our study and this previous report was the antibody used to detect Zip3 foci. We used two independent raised polyclonal antibodies against recombinant Zip3 protein generated by our lab (see Materials and Methods) that detected 60.9 ± 8.6 (generated in rabbit) and 60.8 ± 14.5 (generated in rat) foci in wild-type zygotene/pachytene cells. This number is compatible with those reported for Zip3-myc (∼60 foci) by two independent groups (Yoon et al., 2016; Hong et al., 2019; Tan et al., 2022). On the other hand, the previous report detected only 35.3 ± 6.2 foci of a Zip3-GFP fusion protein on elongated SCs in wild-type (ZIP3-GFP) cells using an antibody against GFP. GFP-tagging of Zip3 may therefore affect the chromosomal localization of Zip3 proteins. Alternatively, an anti-GFP antibody could detect only the subfraction of Zip3 on chromosomes, which is resistant to reduced DSB levels. Indeed, by using our Zip3 antibody, we also found a non-linear response of the Zip3-focus number in the spo11 hypomorph mutants. A steady-state number of Msh5 foci (∼40) is much lower than that of Zip3 and other recombination foci (∼60). Given Msh4/5-focus kinetics is similar to those of Rad51/Dmc1 (Zhu et al., 2021 and here), a difference in the life span could not explain the difference in the number of foci, suggesting the presence of a distinct regulatory mechanism to assembly Msh5-ensembles than those of Rad51 and other ZMM proteins.
We propose two distinct homeostatic responses to the assembly of ZMM proteins to DSBs (Figure 6). First, DSB formation and/or associated regulatory mechanisms control the number of ensembles containing ZMM core proteins including Zip3. Second, a subset of Zip3 ensembles might be converted into ensembles with Msh4/Msh5. This second step is also under the control of DSB responses. The double-staining analysis of Zip3 with Msh5 (Figure 3B) supports the presence of two populations of Zip3 foci on meiotic chromosomes. Zip3 foci associated with Msh5 show a homeostatic response to DSBs and become brighter relative to early Zip3 foci (Figure 3A; Supplementary Figure S3E). This might be positive feedback of Zip3-focus formation once colocalized with Msh5. The first step seems to be sensitive to the N-terminal region of Xrs2 with the FHA domain. This region is critical for Tel1 (ATM)-mediated phosphorylation of Hop1-pT318 on meiotic chromosomes in the rad50S background (Iwasaki et al., 2016). Tel1 is shown to control a feedback mechanism of meiotic DSB formation (Anderson et al., 2015; Garcia et al., 2015). The xrs2 mutation-specific effect of Zip3 homeostasis might be related to the Tel1 function, which should be studied in the future.
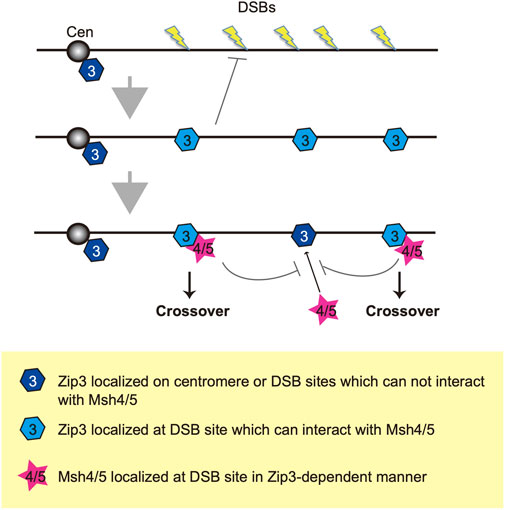
FIGURE 6. A model of two-step selection of CO formation through Zip3 and Msh4-Msh5. Once DSBs are formed on the chromosome, Zip3 may translocate onto roughly selected DSB sites and suppresses additional DSB formation. There are two kinds of modes of Zip3: One is localized at the DSB site and can recruit Msh4-Msh5 (pale blue) and another cannot recruit Msh4-Msh5 (dark blue). Then, the Msh4-Msh5 complex is recruited to the pro-CO site in a Zip3-dependent manner. Zip3 and Msh4-Msh5 suppress additional complex formation in a coordinated manner. Cen indiate a centromere.
Msh5 foci show homeostatic response to reduced DSB levels, particularly in the xrs2–314M (∼80% DSB level) and xrs2–228M mutants (∼60% DSB level), which also show robust CO homeostasis. This suggests that Msh5, thus, the Msh4-Msh5 complex (MutSγ) is a critical machinery for CO homeostasis. As the Msh4-Msh5 complex stabilized recombination intermediates (Snowden et al., 2004; Cannavo et al., 2020; Kulkarni et al., 2020), it was previously reported that MutSγ recruitment is a critical step in the CO/NCO decision and for CO interference (Bishop and Zickler, 2004; Snowden et al., 2004; Stahl et al., 2004; Shinohara et al., 2008). The MutSγ complex seems to be a key effector for CO control during meiosis. Alternatively, the complex is a downstream readout for the control.
In mouse spermatocytes, MutSγ foci persist longer in late zygotene/early pachytene stages relative to RAD51/DMC1 foci (Moens et al., 2002). Moreover, the number of MSH4-MSH5 foci is less than RAD51/DMC1 foci but is more than MLH1-MLH3 (MutLγ) foci, suggesting the step-wise implementation of ZMM foci for CO formation/control during mouse meiotic prophase I (Reynolds et al., 2013; Qiao et al., 2014). Similarly in Sordaria, MSH4 foci appear in early meiotic prophase than MLH1 foci and the number of MSH4 is higher than that of MLH1 (Storlazzi et al., 2010). Interestingly, a recent study showed a chromosomal localization of a tagged version of Mlh1 in the budding yeast and the number of Mlh1 foci is less than ZMM foci in wild type, supporting a regulatory transition from MutSγ to MutLγ is operating in yeast meiosis (Sanchez et al., 2020).
Prior to Msh4-Msh5 assembly, Zip3 is recruited to chromosomes and promotes the assembly of Msh4-Msh5 (Shinohara et al., 2008). We found that 94% of Msh5 foci contained Zip3 foci (Figure 3). A constant Msh5 foci (42-45) level was maintained in each nucleus when CO homeostasis was functioning (Figures 2, 3). The Msh5-Zip3 colocalization frequency was reduced, however, when CO homeostasis was compromised, i.e., in xrs2–84M mutant cells. We hypothesize that Zip3-dependent recruitment of Msh4-Msh5 complexes to DSB sites is critical in CO homeostasis and interference. Again, in both mouse spermatocytes and Sordaria meiosis, Zip3 orthologues, Rnf212 and Hei10 (and also Mer3/Hfm1 foci) appear earlier than Msh4 foci (Reynolds et al., 2013; Qiao et al., 2014; De Muyt et al., 2018; Dubois et al., 2019). Thus, it is likely that a Zip3-dependent assembly of the Msh4-Msh5 complex in CO formation/control is evolutionarily conserved.
Previous cytological studies on ZMM foci such as Zip3 revealed that Zip3 foci are evenly spaced along chromosome axes (Fung et al., 2004; Zhang et al., 2020). Based on these, the establishment of the CO designation may occur prior to ZMM assembly. Since the number of Msh5 foci maintain on chromosomes when DSB frequencies are reduced, Msh5-mediated CO homeostasis might operate after the CO designation thus, CO interference and/or CO assurances.
In this study, we observed homeostatic responses to ZMM protein to reduced DSBs in a context-dependent manner, which includes a type of mutant, a tag to the protein, and antibodies or a combination of antibodies used for the immuno-staining. Thus, we need a more careful evaluation of the conclusion obtained by cytological analyses.
CO homeostasis varies between a short and a long chromosome
A previous study by Martini et al. (2006) analyzed CO homeostasis on chromosome III (3 intervals), VII (3 intervals), and VIII (2 intervals) in spo11 mutants and focused on the effect of reduced DSB levels on total COs on all three chromosomes but did not study the chromosome-specific variation of CO homeostasis in detail. In this study, by analyzing one more additional interval in both chromosome III and VII, we not only confirmed “global” CO homeostasis but also examined the chromosome-specific effect on CO homeostasis. In CO homeostasis, the relatively short chromosome III was more sensitive to DSB reductions than the longer chromosome VII (Figure 4C).
In the wild type, five of seven intervals on chromosome III (URA3–LEU2, HIS4–MAT, HML–LEU2, URA3–HIS4, and LEU2–MAT) were genetically longer than the MET13–CYH2 interval (12 cM) on chromosome VII (Figure 2B; Supplementary Tables S2, S3). CO frequency associated with the MET13–CYH2 interval was only mildly affected as DSBs were reduced to ∼20% (in the xrs2–84M mutant). In contrast, the five intervals on chromosome III showed significant reductions in CO frequencies (p < 0.001) in the xrs2–84M mutant. This suggested that chromosome III is more sensitive to DSB reductions than chromosome VII. CO homeostasis likely works in a long chromosome better than a short chromosome. Alternatively, given that, together with the two shortest chromosomes I and VI, chromosome III is unique in the regulation of DSB formation (Murakami et al., 2020), rather than chromosome length by itself, the chromosome-specific property may determine the level of CO homeostasis.
We observed reduced and increased CO frequencies in MET13–CYH2 and CYH2–TRP5, respectively, in the three xrs2 mutants. These intervals previously analyzed in spo11 hypomorphic mutants (Martini et al., 2006) exhibited similar tendencies. This suggests that different intervals exhibit different sensitivities or responses to reduced frequencies of DSBs, even for intervals on the same chromosome. In addition, we found that the xrs2–314M mutant (∼65% DSBs) showed weakened CO homeostasis in two intervals that spanned a centromere, HIS4–MAT and TRP5–ADE6 compared to other intervals, which is consistent with the suggestion that centromeres may represent a barrier for CO homeostasis, as has been suggested (Martini et al., 2006).
COs were maintained at the expense of NCO, and reduced level of DSBs weakened CO interference
NCOs tend to be more sensitive to DSB reductions than COs in a manner that is independent of chromosome size. This is particularly seen in the xrs2–228M mutant (∼65% DSBs), which showed reduced NCO frequencies at 9 loci while maintaining wild-type levels of COs. COs may be maintained at the expense of NCOs, roughly as proposed (Martini et al., 2006). On the other hand, CO and NCO formation showed similar responses to severe reductions in meiotic DSBs (i.e., they did not simply compensate for one another in the case of xrs2–84M mutant), suggesting that CO and NCO were controlled through different mechanisms, consistent with previous reports that NCOs differentiate earlier than CO in DSB processing (Allers and Lichten, 2001; Hunter and Kleckner, 2001). Moreover, these suggested that, in CO homeostasis, certain thresholds of DSBs might upregulate meiotic CO formation within each chromosome or genetic interval.
Although CO interference function even when DSBs were reduced by 80% (xrs2–84M mutant), we observed CO interference with reduced its strength. Moreover, for the URA3–LEU2–HIS4 interval on chromosome III, no CO interference was seen in the xrs2–84M mutant (Figure 5B). In addition, the non-Mendelian fraction associated with CO (CRA class) at this locus showed reduced CO homeostasis in the xrs2–84M mutant (Figure 4F). This suggested that there might be a coordinating mechanism between CO interference and CO homeostasis, as well as DSB formation.
We note a remarkable difference between reductions in the relative ratio of Msh5 foci and CO frequency, which dropped to 38.6% and 73.6% of wild type, respectively, in the xrs2–84M mutant (Figure 2B, 4C). One possibility is that reduced DSB frequencies may stimulate ZMM-independent CO formation pathway(s) that are out of CO interference regulation (Sym et al., 1993; Shinohara et al., 2008). SC elongation is required for the downregulation of meiotic DSB formation (Xu et al., 1995; Tung et al., 2000; Carballo et al., 2013; Gray et al., 2013; Rockmill et al., 2013). The completion of SC elongation may provide a signal that there are sufficient DSBs to generate COs and control CO formation. In contrast, incomplete SC elongation may promote additional meiotic DSB formation which may result in the formation of non-interfering COs (Lee et al., 2021). SC elongation may be involved in CO homeostasis by regulating DSB formation (and non-interfering CO). In the xrs2–84M mutant, which had 76% fewer DSBs of the wild type, elongation of Zip1 was severely reduced, whereas CO interference still functions, albeit at reduced effectiveness. This indicated that Zip1 elongation was not critical for CO interference as proposed previously (Zhang et al., 2014).
Data availability statement
The original contributions presented in the study are included in the article/Supplementary Material, further inquiries can be directed to the corresponding author.
Author contributions
MS and AS conceived the study. MS performed all experiments. MS and AS analyzed the data. MS initially wrote the manuscript, MS and AS finalized the paper. All authors listed have made a substantial, direct, and intellectual contribution to the work and approved it for publication.
Funding
This work was supported by a Grant-in-Aid from the JSPS KAKENHI Grant Number; 16H04742, 19H00981 to AS, 19K22402 to MS.
Acknowledgments
We are grateful to N. Kleckner, S. Keeney, and Neil Hunter for helpful discussion and critical reading of the manuscript. We thank S. Umetani, M. Kitamura, A. Okabe, H. Wakabayashi, A. Tokumura, and A. Murakami for their excellent technical assistance. We also thank N. Hunter for providing yeast strains.
Conflict of interest
The authors declare that the research was conducted in the absence of any commercial or financial relationships that could be construed as a potential conflict of interest.
Publisher’s note
All claims expressed in this article are solely those of the authors and do not necessarily represent those of their affiliated organizations, or those of the publisher, the editors and the reviewers. Any product that may be evaluated in this article, or claim that may be made by its manufacturer, is not guaranteed or endorsed by the publisher.
Supplementary material
The Supplementary Material for this article can be found online at: https://www.frontiersin.org/articles/10.3389/fcell.2023.1170689/full#supplementary-material
SUPPLEMENTARY FIGURE S1 | Rad51 focus formation in the spo11 hypomorph mutants. (A) Y-axis showed an average number of Rad51 foci in nuclei in wild type (100%), spo11-HA/spo11-HA (80%), spo11-HA/spo11-YF (30%), and spo11-YF/spo11-YF (0%). Values of the X-axis were referred from Martini et al. (Martini et al., 2006). Error bars indicate standard deviations from independent trials (left). The distribution of the number of Rad51 foci in wild-type and spo11 hypomorph mutants (raw values) is shown. Error bars show medians and interquartile ranges. (B) The distributions of the number of Zip3 and Msh5 foci in wild-type and spo11 hypomorph mutants are shown. Error bars show medians and interquartile ranges. The numbers at the top of the graph indicate the median value. The statistical significance of differences was determined using the Mann-Whitney U-test (****p < 0.0001). (C) The average number of Zip3 and Msh5 foci plotted in each spo11 mutant strain (left). Values are presented as a ratio relative to the wild type against each relative number of Rad51 foci [i.e., DSBs, (A)] in each strain (right).
SUPPLEMENTARY FIGURE S2 | Hop1 localization in the BRCT-like domain-deleted xrs2 mutant Localization of Zip1 (red; rabbit) and Hop1 (green; guinea pig) in wild type, xrs2-314M, and pch2 mutant cells are shown. Scale bar = 2 µm.
SUPPLEMENTARY FIGURE S3 | Comparison of focus number of Zip3 and Msh5 in various xrs2 mutants. (A) The number of foci of Zip3 and Msh5 per nucleus in different time points after meiosis entry in wild type, xrs2-84M, xrs2-228M, and xrs2-314M. Error bars show medians and interquartile ranges. (B) The number of foci of Zip3 and Msh5 per nucleus from Figure 2B was shown in a scatter dot plot. The number of nuclei analyzed for Figure 2; wild type, xrs2-84M, xrs2-228M, and xrs2-314M are 459, 416, 542, and 339, respectively (Zip3 foci), and 454, 338, 345, and 219, respectively (Msh5 foci). Error bars show medians and interquartile ranges. (C) The number of Zip3- and Msh5-foci from co-localization analysis shown in Figure 3 is shown in a scatter dot plot. Error bars show medians and interquartile ranges. (D) Kinetics of frequency of Zip3- and Msh5-focus positive nuclei in wild type, xrs2–228M, and xrs2–84M during meiosis. Error bars show the average and SD. (E) The fluorescent signal intensity of Zip3 foci colocalized with or without Msh5 foci was measured and plotted. The p-value was calculated with Mann-Whitney U-test. Note the number of Zip3 alone foci is smaller than that of Zip3 foci with Msh5 (Figure 3B).
References
Agarwal, S., and Roeder, G. S. (2000). Zip3 provides a link between recombination enzymes and synaptonemal complex proteins. Cell 102 (2), 245–255. doi:10.1016/s0092-8674(00)00029-5
Alani, E., Padmore, R., and Kleckner, N. (1990). Analysis of wild-type and rad50 mutants of yeast suggests an intimate relationship between meiotic chromosome synapsis and recombination. Cell 61 (3), 419–436. doi:10.1016/0092-8674(90)90524-i
Allers, T., and Lichten, M. (2001). Differential timing and control of noncrossover and crossover recombination during meiosis. Cell 106 (1), 47–57. doi:10.1016/s0092-8674(01)00416-0
Anderson, C. M., Oke, A., Yam, P., Zhuge, T., and Fung, J. C. (2015). Reduced crossover interference and increased ZMM-independent recombination in the absence of Tel1/ATM. PLoS Genet. 11 (8), e1005478. doi:10.1371/journal.pgen.1005478
Arora, C., Kee, K., Maleki, S., and Keeney, S. (2004). Antiviral protein Ski8 is a direct partner of Spo11 in meiotic DNA break formation, independent of its cytoplasmic role in RNA metabolism. Mol. Cell 13 (4), 549–559. doi:10.1016/s1097-2765(04)00063-2
Arora, K., and Corbett, K. D. (2019). The conserved XPF:ERCC1-like Zip2:Spo16 complex controls meiotic crossover formation through structure-specific DNA binding. Nucleic Acids Res. 47 (5), 2365–2376. doi:10.1093/nar/gky1273
Bani Ismail, M., Shinohara, M., and Shinohara, A. (2014). Dot1-dependent histone H3K79 methylation promotes the formation of meiotic double-strand breaks in the absence of histone H3K4 methylation in budding yeast. PLoS One 9 (5), e96648. doi:10.1371/journal.pone.0096648
Bergerat, A., de Massy, B., Gadelle, D., Varoutas, P. C., Nicolas, A., and Forterre, P. (1997). An atypical topoisomerase II from Archaea with implications for meiotic recombination. Nature 386 (6623), 414–417. doi:10.1038/386414a0
Bishop, D. K., Park, D., Xu, L., and Kleckner, N. (1992). DMC1: A meiosis-specific yeast homolog of E. coli recA required for recombination, synaptonemal complex formation, and cell cycle progression. Cell 69 (3), 439–456. doi:10.1016/0092-8674(92)90446-j
Bishop, D. K. (1994). RecA homologs Dmc1 and Rad51 interact to form multiple nuclear complexes prior to meiotic chromosome synapsis. Cell 79 (6), 1081–1092. doi:10.1016/0092-8674(94)90038-8
Bishop, D. K., and Zickler, D. (2004). Early decision; meiotic crossover interference prior to stable strand exchange and synapsis. Cell 117 (1), 9–15. doi:10.1016/s0092-8674(04)00297-1
Borner, G. V., Barot, A., and Kleckner, N. (2008). Yeast Pch2 promotes domainal axis organization, timely recombination progression, and arrest of defective recombinosomes during meiosis. Proc. Natl. Acad. Sci. U. S. A. 105 (9), 3327–3332. doi:10.1073/pnas.0711864105
Borner, G. V., Kleckner, N., and Hunter, N. (2004). Crossover/noncrossover differentiation, synaptonemal complex formation, and regulatory surveillance at the leptotene/zygotene transition of meiosis. Cell 117 (1), 29–45. doi:10.1016/s0092-8674(04)00292-2
Cannavo, E., Sanchez, A., Anand, R., Ranjha, L., Hugener, J., Adam, C., et al. (2020). Regulation of the MLH1-MLH3 endonuclease in meiosis. Nature 586 (7830), 618–622. doi:10.1038/s41586-020-2592-2
Carballo, J. A., Panizza, S., Serrentino, M. E., Johnson, A. L., Geymonat, M., Borde, V., et al. (2013). Budding yeast ATM/ATR control meiotic double-strand break (DSB) levels by down-regulating Rec114, an essential component of the DSB-machinery. PLoS Genet. 9 (6), e1003545. doi:10.1371/journal.pgen.1003545
Cheng, C. H., Lo, Y. H., Liang, S. S., Ti, S. C., Lin, F. M., Yeh, C. H., et al. (2006). SUMO modifications control assembly of synaptonemal complex and polycomplex in meiosis of Saccharomyces cerevisiae. Genes Dev. 20 (15), 2067–2081. doi:10.1101/gad.1430406
Claeys Bouuaert, C., Tischfield, S. E., Pu, S., Mimitou, E. P., Arias-Palomo, E., Berger, J. M., et al. (2021). Structural and functional characterization of the Spo11 core complex. Nat. Struct. Mol. Biol. 28 (1), 92–102. doi:10.1038/s41594-020-00534-w
Dai, J., Sanchez, A., Adam, C., Ranjha, L., Reginato, G., Chervy, P., et al. (2021). Molecular basis of the dual role of the Mlh1-Mlh3 endonuclease in MMR and in meiotic crossover formation. Proc. Natl. Acad. Sci. U. S. A. 118 (23), e2022704118. doi:10.1073/pnas.2022704118
De Muyt, A., Pyatnitskaya, A., Andreani, J., Ranjha, L., Ramus, C., Laureau, R., et al. (2018). A meiotic XPF-ERCC1-like complex recognizes joint molecule recombination intermediates to promote crossover formation. Genes Dev. 32 (3-4), 283–296. doi:10.1101/gad.308510.117
Dubois, E., De Muyt, A., Soyer, J. L., Budin, K., Legras, M., Piolot, T., et al. (2019). Building bridges to move recombination complexes. Proc. Natl. Acad. Sci. U. S. A. 116 (25), 12400–12409. doi:10.1073/pnas.1901237116
Fung, J. C., Rockmill, B., Odell, M., and Roeder, G. S. (2004). Imposition of crossover interference through the nonrandom distribution of synapsis initiation complexes. Cell 116 (6), 795–802. doi:10.1016/s0092-8674(04)00249-1
Garcia, V., Gray, S., Allison, R. M., Cooper, T. J., and Neale, M. J. (2015). Tel1(ATM)-mediated interference suppresses clustered meiotic double-strand-break formation. Nature 520 (7545), 114–118. doi:10.1038/nature13993
Gray, S., Allison, R. M., Garcia, V., Goldman, A. S., and Neale, M. J. (2013). Positive regulation of meiotic DNA double-strand break formation by activation of the DNA damage checkpoint kinase Mec1(ATR). Open Biol. 3 (7), 130019. doi:10.1098/rsob.130019
Henderson, K. A., and Keeney, S. (2004). Tying synaptonemal complex initiation to the formation and programmed repair of DNA double-strand breaks. Proc. Natl. Acad. Sci. U. S. A. 101 (13), 4519–4524. doi:10.1073/pnas.0400843101
Higashide, M., and Shinohara, M. (2016). Budding yeast SLX4 contributes to the appropriate distribution of crossovers and meiotic double-strand break formation on bivalents during meiosis. G3 (Bethesda) 6 (7), 2033–2042. doi:10.1534/g3.116.029488
Ho, H. C., and Burgess, S. M. (2011). Pch2 acts through Xrs2 and Tel1/ATM to modulate interhomolog bias and checkpoint function during meiosis. PLoS Genet. 7 (11), e1002351. doi:10.1371/journal.pgen.1002351
Hollingsworth, N. M., Ponte, L., and Halsey, C. (1995). MSH5, a novel MutS homolog, facilitates meiotic reciprocal recombination between homologs in Saccharomyces cerevisiae but not mismatch repair. Genes Dev. 9 (14), 1728–1739. doi:10.1101/gad.9.14.1728
Hong, S., Joo, J. H., Yun, H., Kleckner, N., and Kim, K. P. (2019). Recruitment of Rec8, Pds5 and Rad61/Wapl to meiotic homolog pairing, recombination, axis formation and S-phase. Nucleic Acids Res. 47 (22), 11691–11708. doi:10.1093/nar/gkz903
Hunter, N., and Kleckner, N. (2001). The single-end invasion: An asymmetric intermediate at the double-strand break to double-holliday junction transition of meiotic recombination. Cell 106 (1), 59–70. doi:10.1016/s0092-8674(01)00430-5
Iwasaki, D., Hayashihara, K., Shima, H., Higashide, M., Terasawa, M., Gasser, S. M., et al. (2016). The MRX complex ensures NHEJ fidelity through multiple pathways including xrs2-FHA-dependent Tel1 activation. PLoS Genet. 12 (3), e1005942. doi:10.1371/journal.pgen.1005942
Johzuka, K., and Ogawa, H. (1995). Interaction of Mre11 and Rad50: Two proteins required for DNA repair and meiosis-specific double-strand break formation in Saccharomyces cerevisiae. Genetics 139 (4), 1521–1532. doi:10.1093/genetics/139.4.1521
Kee, K., Protacio, R. U., Arora, C., and Keeney, S. (2004). Spatial organization and dynamics of the association of Rec102 and Rec104 with meiotic chromosomes. EMBO J. 23 (8), 1815–1824. doi:10.1038/sj.emboj.7600184
Keeney, S., Giroux, C. N., and Kleckner, N. (1997). Meiosis-specific DNA double-strand breaks are catalyzed by Spo11, a member of a widely conserved protein family. Cell 88 (3), 375–384. doi:10.1016/s0092-8674(00)81876-0
Kleckner, N. (2006). Chiasma formation: chromatin/axis interplay and the role(s) of the synaptonemal complex. Chromosoma 115 (3), 175–194. doi:10.1007/s00412-006-0055-7
Kulkarni, D. S., Owens, S. N., Honda, M., Ito, M., Yang, Y., Corrigan, M. W., et al. (2020). PCNA activates the MutLγ endonuclease to promote meiotic crossing over. Nature 586 (7830), 623–627. doi:10.1038/s41586-020-2645-6
Lee, M. S., Higashide, M. T., Choi, H., Li, K., Hong, S., Lee, K., et al. (2021). The synaptonemal complex central region modulates crossover pathways and feedback control of meiotic double-strand break formation. Nucleic Acids Res. 49 (13), 7537–7553. doi:10.1093/nar/gkab566
Maleki, S., Neale, M. J., Arora, C., Henderson, K. A., and Keeney, S. (2007). Interactions between Mei4, Rec114, and other proteins required for meiotic DNA double-strand break formation in Saccharomyces cerevisiae. Chromosoma 116 (5), 471–486. doi:10.1007/s00412-007-0111-y
Martini, E., Diaz, R. L., Hunter, N., and Keeney, S. (2006). Crossover homeostasis in yeast meiosis. Cell 126 (2), 285–295. doi:10.1016/j.cell.2006.05.044
Matsuzaki, K., Shinohara, A., and Shinohara, M. (2008). Forkhead-associated domain of yeast Xrs2, a homolog of human Nbs1, promotes nonhomologous end joining through interaction with a ligase IV partner protein, Lif1. Genetics 179 (1), 213–225. doi:10.1534/genetics.107.079236
Matsuzaki, K., Terasawa, M., Iwasaki, D., Higashide, M., and Shinohara, M. (2012). Cyclin-dependent kinase-dependent phosphorylation of Lif1 and Sae2 controls imprecise nonhomologous end joining accompanied by double-strand break resection. Genes cells. 17 (6), 473–493. doi:10.1111/j.1365-2443.2012.01602.x
Mimitou, E. P., and Symington, L. S. (2009). DNA end resection: Many nucleases make light work. DNA Repair (Amst) 8 (9), 983–995. doi:10.1016/j.dnarep.2009.04.017
Moens, P. B., Kolas, N. K., Tarsounas, M., Marcon, E., Cohen, P. E., and Spyropoulos, B. (2002). The time course and chromosomal localization of recombination-related proteins at meiosis in the mouse are compatible with models that can resolve the early DNA-DNA interactions without reciprocal recombination. J. Cell Sci. 115 (8), 1611–1622. doi:10.1242/jcs.115.8.1611
Murakami, H., Lam, I., Huang, P. C., Song, J., van Overbeek, M., and Keeney, S. (2020). Multilayered mechanisms ensure that short chromosomes recombine in meiosis. Nature 582 (7810), 124–128. doi:10.1038/s41586-020-2248-2
Nakagawa, T., Flores-Rozas, H., and Kolodner, R. D. (2001). The MER3 helicase involved in meiotic crossing over is stimulated by single-stranded DNA-binding proteins and unwinds DNA in the 3' to 5' direction. J. Biol. Chem. 276 (34), 31487–31493. doi:10.1074/jbc.M104003200
Nakagawa, T., and Ogawa, H. (1999). The Saccharomyces cerevisiae MER3 gene, encoding a novel helicase-like protein, is required for crossover control in meiosis. EMBO J. 18 (20), 5714–5723. doi:10.1093/emboj/18.20.5714
Nandanan, K. G., Salim, S., Pankajam, A. V., Shinohara, M., Lin, G., Chakraborty, P., et al. (2021). Regulation of Msh4-Msh5 association with meiotic chromosomes in budding yeast. Genetics 219 (2), iyab102. doi:10.1093/genetics/iyab102
Nicolas, A., and Rossignol, J. L. (1983). Gene conversion: Point-mutation heterozygosities lower heteroduplex formation. EMBO J. 2 (12), 2265–2270. doi:10.1002/j.1460-2075.1983.tb01733.x
Nishant, K. T., Chen, C., Shinohara, M., Shinohara, A., and Alani, E. (2010). Genetic analysis of baker's yeast msh4-msh5 reveals a threshold crossover level for meiotic viability. Plos Genet. 6 (8), e1001083. doi:10.1371/journal.pgen.1001083
Novak, J. E., Ross-Macdonald, P. B., and Roeder, G. S. (2001). The budding yeast Msh4 protein functions in chromosome synapsis and the regulation of crossover distribution. Genetics 158 (3), 1013–1025. doi:10.1093/genetics/158.3.1013
Padmore, R., Cao, L., and Kleckner, N. (1991). Temporal comparison of recombination and synaptonemal complex formation during meiosis in S. cerevisiae. Cell 66 (6), 1239–1256. doi:10.1016/0092-8674(91)90046-2
Palmbos, P. L., Daley, J. M., and Wilson, T. E. (2005). Mutations of the Yku80 C terminus and Xrs2 FHA domain specifically block yeast nonhomologous end joining. Mol. Cell Biol. 25 (24), 10782–10790. doi:10.1128/MCB.25.24.10782-10790.2005
Pan, J., Sasaki, M., Kniewel, R., Murakami, H., Blitzblau, H. G., Tischfield, S. E., et al. (2011). A hierarchical combination of factors shapes the genome-wide topography of yeast meiotic recombination initiation. Cell 144 (5), 719–731. doi:10.1016/j.cell.2011.02.009
Papazian, H. P. (1952). The analysis of tetrad data. Genetics 37 (2), 175–188. doi:10.1093/genetics/37.2.175
Perkins, D. D. (1949). Biochemical mutants in the smut fungus ustilago maydis. Genetics 34 (5), 607–626. doi:10.1093/genetics/34.5.607
Perry, J., Kleckner, N., and Borner, G. V. (2005). Bioinformatic analyses implicate the collaborating meiotic crossover/chiasma proteins Zip2, Zip3, and Spo22/Zip4 in ubiquitin labeling. Proc. Natl. Acad. Sci. U. S. A. 102 (49), 17594–17599. doi:10.1073/pnas.0508581102
Qiao, H., Prasada Rao, H. B., Yang, Y., Fong, J. H., Cloutier, J. M., Deacon, D. C., et al. (2014). Antagonistic roles of ubiquitin ligase HEI10 and SUMO ligase RNF212 regulate meiotic recombination. Nat. Genet. 46 (2), 194–199. doi:10.1038/ng.2858
Reynolds, A., Qiao, H., Yang, Y., Chen, J. K., Jackson, N., Biswas, K., et al. (2013). RNF212 is a dosage-sensitive regulator of crossing-over during mammalian meiosis. Nat. Genet. 45 (3), 269–278. doi:10.1038/ng.2541
Robert, T., Nore, A., Brun, C., Maffre, C., Crimi, B., Bourbon, H. M., et al. (2016). The TopoVIB-Like protein family is required for meiotic DNA double-strand break formation. Science 351 (6276), 943–949. doi:10.1126/science.aad5309
Rockmill, B., Lefrancois, P., Voelkel-Meiman, K., Oke, A., Roeder, G. S., and Fung, J. C. (2013). High throughput sequencing reveals alterations in the recombination signatures with diminishing Spo11 activity. PLoS Genet. 9 (10), e1003932. doi:10.1371/journal.pgen.1003932
San-Segundo, P. A., and Roeder, G. S. (1999). Pch2 links chromatin silencing to meiotic checkpoint control. Cell 97 (3), 313–324. doi:10.1016/s0092-8674(00)80741-2
Sanchez, A., Adam, C., Rauh, F., Duroc, Y., Ranjha, L., Lombard, B., et al. (2020). Exo1 recruits Cdc5 polo kinase to MutLγ to ensure efficient meiotic crossover formation. Proc. Natl. Acad. Sci. U. S. A. 117 (48), 30577–30588. doi:10.1073/pnas.2013012117
Sasanuma, H., Tawaramoto, M. S., Lao, J. P., Hosaka, H., Sanda, E., Suzuki, M., et al. (2013). A new protein complex promoting the assembly of Rad51 filaments. Nat. Commun. 4, 1676. doi:10.1038/ncomms2678
Schwacha, A., and Kleckner, N. (1995). Identification of double Holliday junctions as intermediates in meiotic recombination. Cell 83 (5), 783–791. doi:10.1016/0092-8674(95)90191-4
Schwacha, A., and Kleckner, N. (1994). Identification of joint molecules that form frequently between homologs but rarely between sister chromatids during yeast meiosis. Cell 76 (1), 51–63. doi:10.1016/0092-8674(94)90172-4
Serrentino, M. E., Chaplais, E., Sommermeyer, V., and Borde, V. (2013). Differential association of the conserved SUMO ligase Zip3 with meiotic double-strand break sites reveals regional variations in the outcome of meiotic recombination. PLoS Genet. 9 (4), e1003416. doi:10.1371/journal.pgen.1003416
Shima, H., Suzuki, M., and Shinohara, M. (2005). Isolation and characterization of novel xrs2 mutations in Saccharomyces cerevisiae. Genetics 170 (1), 71–85. doi:10.1534/genetics.104.037580
Shinohara, A., Ogawa, H., and Ogawa, T. (1992). Rad51 protein involved in repair and recombination in S. cerevisiae is a RecA-like protein. Cell 69 (3), 457–470. doi:10.1016/0092-8674(92)90447-k
Shinohara, M., Bishop, D. K., and Shinohara, A. (2019). Distinct functions in regulation of meiotic crossovers for DNA damage response clamp loader rad24(rad17) and Mec1(ATR) kinase. Genetics 213 (4), 1255–1269. doi:10.1534/genetics.119.302427
Shinohara, M., Gasior, S. L., Bishop, D. K., and Shinohara, A. (2000). Tid1/Rdh54 promotes colocalization of Rad51 and Dmc1 during meiotic recombination. Proc. Natl. Acad. Sci. U. S. A. 97 (20), 10814–10819. doi:10.1073/pnas.97.20.10814
Shinohara, M., Hayashihara, K., Grubb, J. T., Bishop, D. K., and Shinohara, A. (2015). DNA damage response clamp 9-1-1 promotes assembly of ZMM proteins for formation of crossovers and synaptonemal complex. J. Cell Sci. 128 (8), 1494–1506. doi:10.1242/jcs.161554
Shinohara, M., Oh, S. D., Hunter, N., and Shinohara, A. (2008). Crossover assurance and crossover interference are distinctly regulated by the ZMM proteins during yeast meiosis. Nat. Genet. 40 (3), 299–309. doi:10.1038/ng.83
Shinohara, M., Sakai, K., Shinohara, A., and Bishop, D. Y. (2003). Crossover interference in Saccharomyces cerevisiae requires a TID1/RDH54- and DMC1-dependent pathway. Genetics 163 (4), 1273–1286. doi:10.1093/genetics/163.4.1273
Snowden, T., Acharya, S., Butz, C., Berardini, M., and Fishel, R. (2004). hMSH4-hMSH5 recognizes Holliday Junctions and forms a meiosis-specific sliding clamp that embraces homologous chromosomes. Mol. Cell 15 (3), 437–451. doi:10.1016/j.molcel.2004.06.040
Stahl, F. W., Foss, H. M., Young, L. S., Borts, R. H., Abdullah, M. F., and Copenhaver, G. P. (2004). Does crossover interference count in Saccharomyces cerevisiae? Genetics 168 (1), 35–48. doi:10.1534/genetics.104.027789
Storlazzi, A., Gargano, S., Ruprich-Robert, G., Falque, M., David, M., Kleckner, N., et al. (2010). Recombination proteins mediate meiotic spatial chromosome organization and pairing. Cell 141 (1), 94–106. doi:10.1016/j.cell.2010.02.041
Sym, M., Engebrecht, J. A., and Roeder, G. S. (1993). ZIP1 is a synaptonemal complex protein required for meiotic chromosome synapsis. Cell 72 (3), 365–378. doi:10.1016/0092-8674(93)90114-6
Sym, M., and Roeder, G. S. (1995). Zip1-induced changes in synaptonemal complex structure and polycomplex assembly. J. Cell Biol. 128 (4), 455–466. doi:10.1083/jcb.128.4.455
Tan, T., Tan, Y., Wang, Y., Yang, X., Zhai, B., Zhang, S., et al. (2022). Negative supercoils regulate meiotic crossover patterns in budding yeast. Nucleic Acids Res. 50 (18), 10418–10435. doi:10.1093/nar/gkac786
Tsubouchi, H., and Ogawa, H. (1998). A novel mre11 mutation impairs processing of double-strand breaks of DNA during both mitosis and meiosis. Mol. Cell Biol. 18 (1), 260–268. doi:10.1128/mcb.18.1.260
Tsubouchi, T., Zhao, H., and Roeder, G. S. (2006). The meiosis-specific zip4 protein regulates crossover distribution by promoting synaptonemal complex formation together with zip2. Dev. Cell 10 (6), 809–819. doi:10.1016/j.devcel.2006.04.003
Tung, K. S., Hong, E. J., and Roeder, G. S. (2000). The pachytene checkpoint prevents accumulation and phosphorylation of the meiosis-specific transcription factor Ndt80. Proc. Natl. Acad. Sci. U. S. A. 97 (22), 12187–12192. doi:10.1073/pnas.220464597
Usui, T., Ohta, T., Oshiumi, H., Tomizawa, J., Ogawa, H., and Ogawa, T. (1998). Complex formation and functional versatility of Mre11 of budding yeast in recombination. Cell 95 (5), 705–716. doi:10.1016/s0092-8674(00)81640-2
Wang, S., Liu, Y., Shang, Y., Zhai, B., Yang, X., Kleckner, N., et al. (2019a). Crossover interference, crossover maturation, and human aneuploidy. Bioessays 41 (10), e1800221. doi:10.1002/bies.201800221
Wang, S., Veller, C., Sun, F., Ruiz-Herrera, A., Shang, Y., Liu, H., et al. (2019b). Per-nucleus crossover covariation and implications for evolution. Cell 177 (2), 326–338. doi:10.1016/j.cell.2019.02.021
White, J. H., Lusnak, K., and Fogel, S. (1985). Mismatch-specific post-meiotic segregation frequency in yeast suggests a heteroduplex recombination intermediate. Nature 315 (6017), 350–352. doi:10.1038/315350a0
Xu, L., Ajimura, M., Padmore, R., Klein, C., and Kleckner, N. (1995). NDT80, a meiosis-specific gene required for exit from pachytene in Saccharomyces cerevisiae. Mol. Cell Biol. 15 (12), 6572–6581. doi:10.1128/mcb.15.12.6572
Yadav, V. K., and Claeys Bouuaert, C. (2021). Mechanism and control of meiotic DNA double-strand break formation in S. cerevisiae. Front. Cell Dev. Biol. 9, 642737. doi:10.3389/fcell.2021.642737
Yoon, S. W., Lee, M. S., Xaver, M., Zhang, L., Hong, S. G., Kong, Y. J., et al. (2016). Meiotic prophase roles of Rec8 in crossover recombination and chromosome structure. Nucleic Acids Res. 44 (19), 9296–9314. doi:10.1093/nar/gkw682
Zhang, L., Espagne, E., de Muyt, A., Zickler, D., and Kleckner, N. E. (2014). Interference-mediated synaptonemal complex formation with embedded crossover designation. Proc. Natl. Acad. Sci. U. S. A. 111 (47), E5059–E5068. doi:10.1073/pnas.1416411111
Zhang, Y., Suzuki, T., Li, K., Gothwal, S. K., Shinohara, M., and Shinohara, A. (2020). Genetic interactions of histone modification machinery Set1 and PAF1C with the recombination complex rec114-mer2-mei4 in the formation of meiotic DNA double-strand breaks. Int. J. Mol. Sci. 21 (8), 2679. doi:10.3390/ijms21082679
Zhu, Z., Bani Ismail, M., Shinohara, M., and Shinohara, A. (2021). SCF(Cdc4) ubiquitin ligase regulates synaptonemal complex formation during meiosis. Life Sci. Alliance 4 (2), e202000933. doi:10.26508/lsa.202000933
Keywords: crossover control, meiotic recombination, crossover homeostasis, DSB formation, synaptonemal complex, Msh4-Msh5
Citation: Shinohara M and Shinohara A (2023) The Msh5 complex shows homeostatic localization in response to DNA double-strand breaks in yeast meiosis. Front. Cell Dev. Biol. 11:1170689. doi: 10.3389/fcell.2023.1170689
Received: 21 February 2023; Accepted: 09 May 2023;
Published: 18 May 2023.
Edited by:
Mónica Pradillo, Complutense University of Madrid, SpainReviewed by:
Andreas Hochwagen, New York University, United StatesJoao Matos, Max F. Perutz Laboratories GmbH, Austria
Copyright © 2023 Shinohara and Shinohara. This is an open-access article distributed under the terms of the Creative Commons Attribution License (CC BY). The use, distribution or reproduction in other forums is permitted, provided the original author(s) and the copyright owner(s) are credited and that the original publication in this journal is cited, in accordance with accepted academic practice. No use, distribution or reproduction is permitted which does not comply with these terms.
*Correspondence: Miki Shinohara, bWlraXNAbmFyYS5raW5kYWkuYWMuanA=