 Haoqiang Jiang
 Shipeng Shang
 Yutong Sha1†
 Lin Zhang
 Ningning He
 Lei Li
94% of researchers rate our articles as excellent or good
Learn more about the work of our research integrity team to safeguard the quality of each article we publish.
Find out more
METHODS article
Front. Cell Dev. Biol., 28 April 2023
Sec. Cellular Biochemistry
Volume 11 - 2023 | https://doi.org/10.3389/fcell.2023.1149535
This article is part of the Research TopicMechanistic Insights Into The Regulation Of Tumor Progression And Metastasis By Post-translational Modifications Of ProteinsView all 5 articles
The in situ post-translational modification (PTM) crosstalk refers to the interactions between different types of PTMs that occur on the same residue site of a protein. The crosstalk sites generally have different characteristics from those with the single PTM type. Studies targeting the latter’s features have been widely conducted, while studies on the former’s characteristics are rare. For example, the characteristics of serine phosphorylation (pS) and serine ADP-ribosylation (SADPr) have been investigated, whereas those of their in situ crosstalks (pSADPr) are unknown. In this study, we collected 3,250 human pSADPr, 7,520 SADPr, 151,227 pS and 80,096 unmodified serine sites and explored the features of the pSADPr sites. We found that the characteristics of pSADPr sites are more similar to those of SADPr compared to pS or unmodified serine sites. Moreover, the crosstalk sites are likely to be phosphorylated by some kinase families (e.g., AGC, CAMK, STE and TKL) rather than others (e.g., CK1 and CMGC). Additionally, we constructed three classifiers to predict pSADPr sites from the pS dataset, the SADPr dataset and the protein sequences separately. We built and evaluated five deep-learning classifiers in ten-fold cross-validation and independent test datasets. We also used the classifiers as base classifiers to develop a few stacking-based ensemble classifiers to improve performance. The best classifiers had the AUC values of 0.700, 0.914 and 0.954 for recognizing pSADPr sites from the SADPr, pS and unmodified serine sites, respectively. The lowest prediction accuracy was achieved by separating pSADPr and SADPr sites, which is consistent with the observation that pSADPr’s characteristics are more similar to those of SADPr than the rest. Finally, we developed an online tool for extensively predicting human pSADPr sites based on the CNNOH classifier, dubbed EdeepSADPr. It is freely available through http://edeepsadpr.bioinfogo.org/. We expect our investigation will promote a comprehensive understanding of crosstalks.
The in situ post-translational modification (PTM) crosstalk refers to the interactions between different types of PTMs that occur on the same residue site of a protein. Different PTM types on the same site have different effects on the activity, stability, localization, and interactions of the modified protein (Yang and Gregoire, 2006; Hunter, 2007; Swaney et al., 2013; Xu et al., 2018). The crosstalk sites generally have different characteristics from those with the single PTM type; Nevertheless, the former is rarely investigated compared to the latter. This study focused on the crosstalk between serine phosphorylation (pS) and ADP-ribosylation (SADPr). Serine phosphorylation, catalyzed by hundreds of kinases, plays a regulatory role in the cell cycle, growth, apoptosis, and signal transduction (Zolnierowicz and Bollen, 2000). Serine ADP-ribosylation, catalyzed by over twenty ADP-ribosyltransferases (Luscher et al., 2018), regulates many cellular processes, including chromatin organization, epigenetic transcription regulation, cell differentiation and cytoplasm stress response (Nowak et al., 2020; Brustel et al., 2022). Both serine modifications can co-occur on the same residue on a competitive basis as the in situ PTM crosstalk (dubbed pSADPr). This crosstalk represents a significantly high degree of overlap, similar to the site-specific crosstalk between lysine acetylation and ubiquitylation (Larsen et al., 2018). Identification of PTM crosstalk sites has emerged to be an intriguing topic and attracted much attention, relevant works of which have been ongoing before our study (Peng et al., 2014; Venne et al., 2014; Xu et al., 2021). For example, the classifier mUSP was developed to predict in situ crosstalk sites of ubiquitylation and SUMOylation (Xu et al., 2021). Nevertheless, the in situ crosstalk of serine phosphorylation and ADP-ribosylation has not been investigated. Although a few in silico classifiers have been developed for predicting pS and SADPr sites (Luo et al., 2019; Sha et al., 2021), the classifier for predicting pSADPr sites is unavailable.
Figure 1 showed the overview map of this study. This study collected 3,250 human pSADPr, 151,227 pS, 7,520 SADPr and 80,096 unmodified serine sites. Accordingly, we investigated the characteristics of pSADPr and constructed classifiers to predict pSADPr sites. We found that pSADPr’s characteristics are more similar to those of SADPr than pS and unmodified serine sites. We also found that pSADPr sites were preferred to be phosphorylated by four subfamilies of serine kinases (i.e., AGC, CAMK, STE and TKL). Moreover, we built and evaluated five deep-learning classifiers in ten-fold cross-validation and independent test datasets. We also developed a few advanced stacking-based ensemble classifiers. The best classifiers had the AUC values of 0.700, 0.914 and 0.954 for recognizing pSADPr sites from the SADPr, pS and unmodified serine sites. Finally, we developed an online tool for extensively predicting human pSADPr sites, dubbed EdeepSADPr. It is freely available through http://edeepsadpr.bioinfogo.org/. We anticipate that accurate prediction by EdeepSADPr will facilitate the discovery of new pSADPr sites and promote the understanding of their functional characteristics.
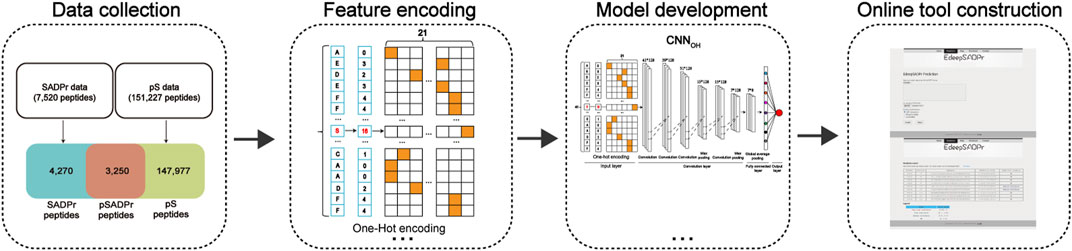
FIGURE 1. Flowchart of the model construction.
Figure 2 shows the procedure of dataset construction and preprocessing. 7,520 human SADPr sites with high confidence (i.e., ADPr peptides with Andromeda scores >40 and localization probability >0.75) were collected from the literature (Larsen et al., 2018; Hendriks et al., 2019; Buch-Larsen et al., 2020; Nowak et al., 2020) (Figure 2A). 151,227 human pS sites were obtained from the database PhosphositePlus (Hornbeck et al., 2012) and the literature (Luo et al., 2019) (Figure 2A). We compared both datasets and found 3,250 pSADPr peptides, 147,977 pS peptides, and 4,270 SADPr peptides. We also collected 80,096 unmodified serine (UM) sites after removing modified serine sites (i.e., pSADPr, SADPr and pS) from the reported dataset (Luo et al., 2019).
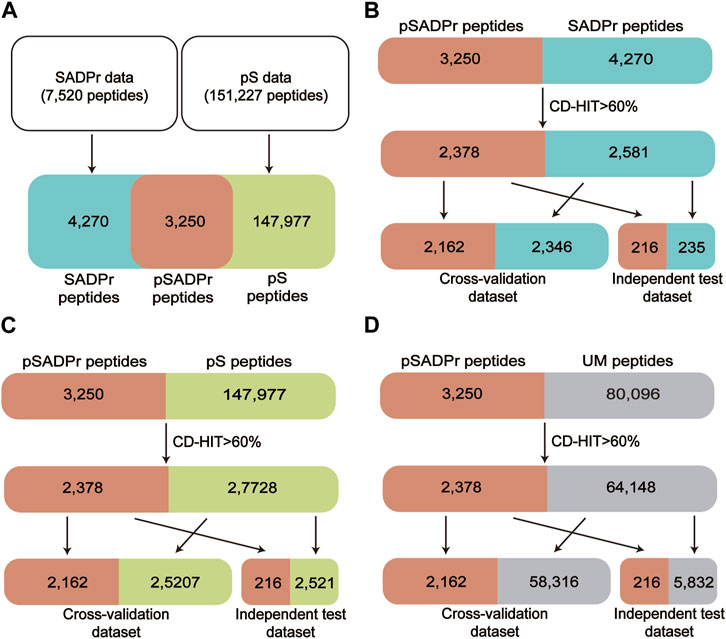
FIGURE 2. Schematic diagram of data collection and preprocessing for human pSADPr datasets. Construction of the pSADPr, pS and SADPr datasets (A). The construction and preprocessing of the pSADPr-SADPr dataset (B), the pSADPr-pS dataset (C) and the pSADPr-UM dataset (D). UM stands for unmodified serine.
Each serine site of the above datasets was represented by a 41-residue-long sequence segment with the serine at the center (Sha et al., 2021). CD-HIT (Li and GodzikCd-hit, 2006; Huang et al., 2010) was applied to eliminate the homologous peptides by setting the threshold to 60% sequence identity, which is valuable for avoiding overestimation. Specifically, we combined the pSADPr peptides with SADPr peptides, pS peptides, and UM peptides, respectively, and clustered them using CD-HIT. Accordingly, we obtained 4,959 clusters, 30,106 clusters and 66,526 clusters. We selected one sequence randomly from each cluster according to the criterion: One pSADPr peptide was selected if it was included in the cluster; otherwise, one of the other peptides was selected. After that, 2,378 pSADPr, 2,581 SADPr, 27,728 pS and 64,148 UM peptides were collected (Figures 2B–D). Furthermore, each of the three datasets was divided into 11 groups, where ten groups were used as a cross-validation dataset, and the rest group was considered an independent test dataset (Figures 2B–D). It should be noted that if the central serine residue is located near the N or C terminus of the protein sequence, the complement symbol “_” was added to the input sequences at the affected terminus to ensure the length was maintained. All these data are available at http://edeepsadpr.bioinfogo.org/.
We selected five encoding features representing the input peptides for the model construction. They included the One-Hot encoding (OH) (Wang D. et al., 2020), the Enhanced Amino Acid Composition Encoding (EAAC) (Chen et al., 2018), the Enhanced Grouped Amino Acids Content encoding (EGAAC) (Chen et al., 2018), the ZSCALE Encoding (ZSCALE) and the Word Embedding (WE).
In the One-hot coding, the 20 amino acids and complement symbol “_” are encoded into a 21-dimensional binary vector. In the vector corresponding to an amino acid, the element related to the amino acid is marked as 1 and others are marked as 0. For example, “A” is represented by “100000000000000000000” and “V” is represented by “0100000000000000000000.”
In ZSCALE encoding, every amino acid type is characterized by five physicochemical descriptor variables (Chen et al., 2012; Zhang et al., 2020). Therefore, each input sequence is represented as a vector of 205 (=41 × 5) dimensions. The filling character “_” is encoded as a 5-dimensional zero vector.
Word embedding (Ge and Moh, 2018) relies on the numerical encoding approach (Lyu et al., 2020), which maps each type of amino acid residue to an integer. After the NUM encoding, each integer is mapped to a predefined five-dimension word vector. Therefore, each sequence is encoded as a vector of 205 (= 41 × 5) items.
In EAAC encoding, the frequency of each amino acid from the N-terminal to the C-terminal within a fixed sliding window size (the default length being 5) is calculated (Lyu et al., 2020). Therefore, each peptide sequence is encoded as a vector of 740 = ((41–5 + 1) × 20) items.
The EGAAC encoding is developed based on grouped amino acid content (GAAC) characteristics (Wei et al., 2021). In the GAAC encoding, the 20 amino acid types are divided into five groups according to their physical and chemical properties (G1: GAVLMI, FYW, G3: KRH, G4: DE, and G5: STCPNQ). In the EGAAC encoding, the GAAC value is calculated from N-terminal to C-terminal within a fixed sliding window (the default length being 5).
We constructed five classifiers based on Convolutional Neural Network (CNN). They included the model combined with the One-Hot Encoding (CNNOH), the model with the Word Embedding Encoding (CNNWE), the model with the ZSCALE Encoding (CNNZSCALE), the model with the EAAC encoding (CNNEAAC) and the model with the EGAAC encoding (CNNEGAAC). We took the CNN Model with the One-Hot encoding (CNNOH) as an example to demonstrate the architecture (Figure 3).
(1) Input layer. Each sequence is converted into a feature vector with One-Hot encoding.
(2) The convolution layer. It contains two convolution sublayers followed by two sequentially connected blocks. Each block includes a convolution sublayer and a max pooling sublayer. There are 128 convolution kernels with the sizes of 1 and 3 for the first and second convolution sublayers, respectively. A dropout layer with a rate of 0.7 follows each convolution kernel to prevent potential overfitting. In these two blocks, there were 128 convolution kernels with a size of 9 and 10 for these two convolution sublayers of two blocks, respectively; the parameter pool_size of the max-pooling sublayer was set as 2; the dropout rate was set to 0.5. The rectified linear unit (ReLU) is considered the activation function.
(3) Fully connected layer. It contains a dense sublayer with 128 neurons without flattening and a global average pooling sublayer to calculate and output an average value.
(4) Output layer: This layer contains a single neuron, activated by a sigmoid function, to output the probability score (within the range from 0 to 1), indicating the likelihood of the crosstalk. If the probability score of an input sequence is greater than a specified threshold, the central serine in the sequence is predicted as a crosstalk site.
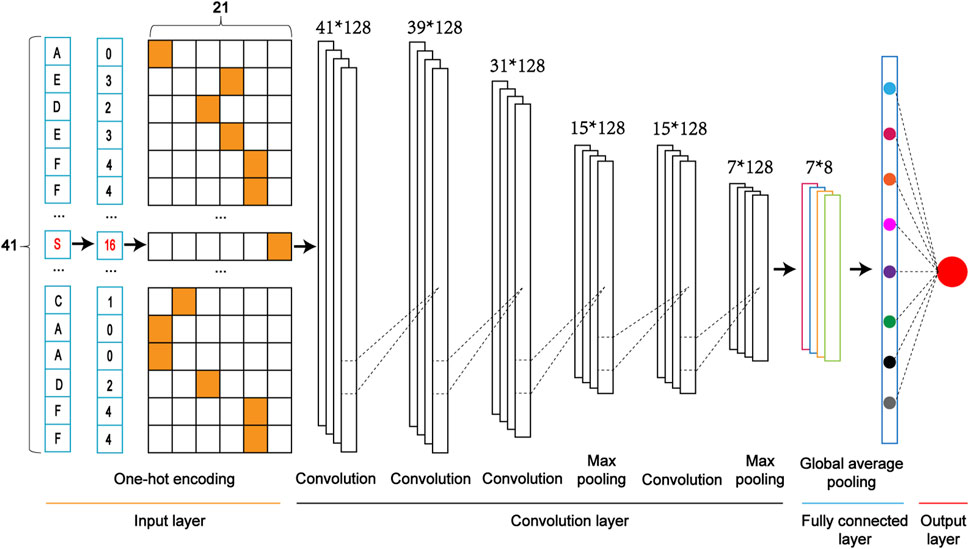
FIGURE 3. The architecture of a one-dimensional convolutional neural network with the One-Hot encoding approach (i.e., CNNOH).
Several statistical measures were used to evaluate prediction performance, including sensitivity (SN), specificity (SP), overall accuracy (ACC), Matthew correlation coefficient (MCC) and the area under the receiver operating characteristic (ROC) curve (AUC). The definitions of SN, SP, ACC, and MCC are given as follows:
In the above formulas, TP, TN, FP, and FN are the number of true positives, true negatives, false positives, and true negatives, respectively.
We created three datasets for constructing classifiers to predict pSADPr sites (Figure 2). The first dataset was the pSADPr-SADPr dataset, containing pSADPr and SADPr peptides. The related model was used to recognize pSADPr sites from known SADPr sites (Figure 2B). The second was the pSADPr-pS dataset, including pSADPr and pS peptides (Figure 2C). The third was the pSADPr-UM dataset, containing pSADPr and UM peptides (Figure 2D). Because the vast majority of serine residues are unmodified in the human proteome, the model based on the third dataset was expected to recognize pSADPr sites from the human proteome (Figure 2D). Each of the three datasets contained two parts: cross-validation and independent test datasets (Figures 2B–D).
We explored the characteristics of the pSADPr crosstalks by comparing pSADPr-containing and other peptides in the three datasets through the Two-Sample-Logo program (Vacic et al., 2006). For the pSADPr-SADPr dataset, the amino acid R was significantly enriched at positions −2 and −3 (i.e., P-2 and P-3), whereas K was depleted at P-1 (Figure 4A). For the rest datasets, the pSADPr crosstalks showed similar characteristics (Figures 4B, C). Specifically, K was enriched entirely except P+1 and G was enriched at P1 and P2; D and E were depleted at P-3 to P+5 and L was depleted entirely. The maximum enriched/depleted value (29.3%) for the pSADPr-pS dataset was similar to that (32.0%) for the pSADPr-UM dataset, and both were more than twice as large as that (13.2%) for the pSADPr-SADPr dataset (Figure 4). It indicates that the differences between pSADPr and SADPr sites are smaller than those between pSADPr and pS/UM sites. In other words, it is easy to distinguish pSADPr sites from pS/UM sites, compared to recognizing pSADPr sites from SADPr sites.
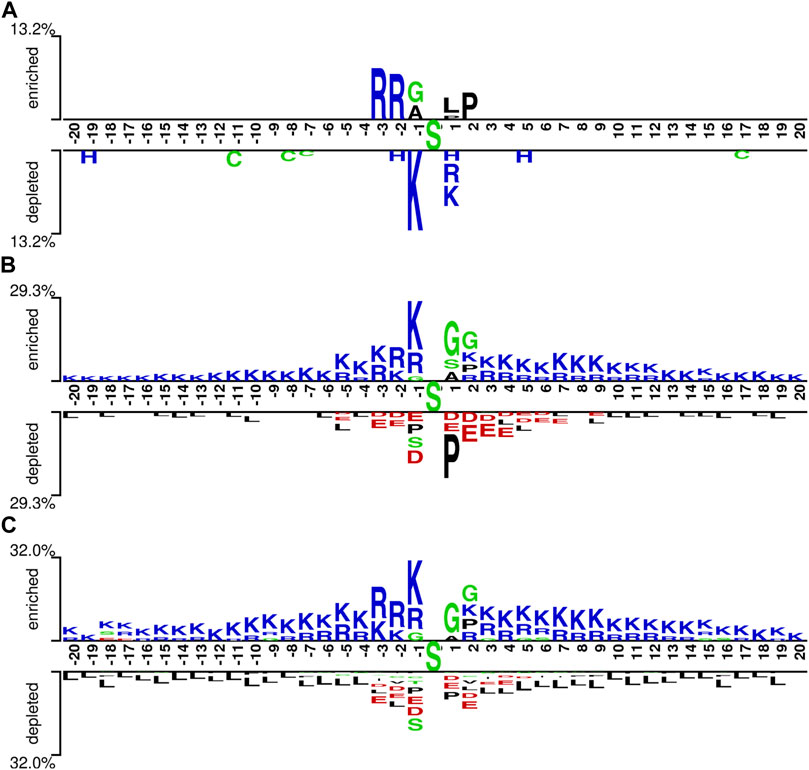
FIGURE 4. Sequence pattern surrounding the pSADPr sites. Enriched and depleted residues flanking the central pSADPr sites were shown for the pSADPr-SADPr dataset (A), the pSADPr-pS dataset (B), and the pSADPr-UM dataset (C) (p < 0.05, t-test with Bonferroni correction). The patterns were generated using the Two-Sample-Logo program (Vacic et al., 2006).
The human serine kinase family contains a few subfamilies, each with its characteristics. We explored which subfamilies preferred phosphorylating the pSADPr sites. To perform this analysis, we used the human pS sites as the background and the pSADPr sites as the test dataset. We employed the GPS program (Wang C. et al., 2020) to predict pS sites for each subfamily from both datasets (Figure 5). We found that four subfamilies (i.e., AGC, CAMK, STE and TKL) tended to phosphorylate pSADPr sites (p < 5.0 × 10⁻²⁶, hyper-geometric test). In comparison, two subfamilies (i.e., CK1 and CMGC) prefer not to phosphorylate pSADPr sites (p < 5.1 × 10⁻²⁹, hyper-geometric test). For example, 68% of pSADPr sites could be phosphorylated by the AGC subfamily, whereas only 44% of pS sites are modified by this subfamily (p = 2.3 × 10−174, hyper-geometric test). This observation suggests that the pSADPr sites may be related to specific subfamilies of serine kinases.
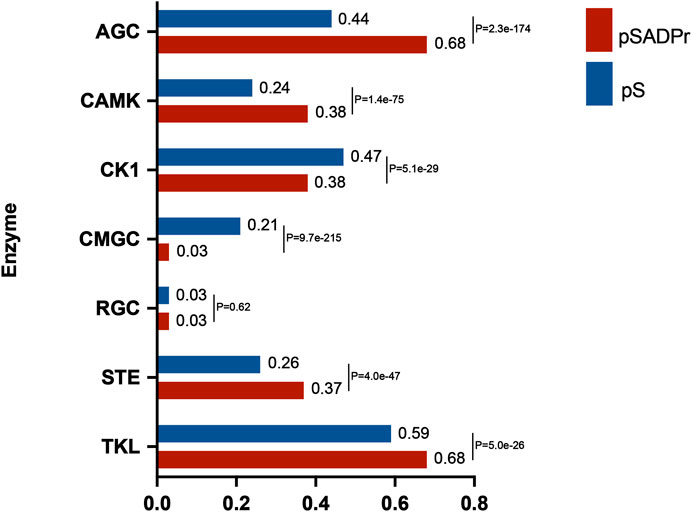
FIGURE 5. Enrichment analysis of human pSADPr sites as the substrates of serine kinase subfamilies predicted by GPS (Wang C. et al., 2020). Human pS sites were used as the background. p-value was calculated using the hyper-geometric test.
In the three datasets, the pSADPr-pS and pSADPr-UM datasets were imbalanced because the numbers of pS and UM peptides were far more than the number of pSADPr peptides (Figures 2C, D). To explore the effect of the imbalanced dataset on the predictor’s performance, we built the related balanced cross-validation dataset where the number (2,162) of randomly selected pS or UM peptides was the same as that of pSADPr peptides. We constructed the CNNOH models related to the imbalanced and balanced datasets and evaluated their prediction performances in terms of the independent test. The CNNOH model based on the imbalanced dataset had better performance than the counterpart constructed using the balanced dataset (p = 0.002 for both pSADPr-pS and pSADPr-UM datasets, Wilcoxon rank sum test; Figure 6). Therefore, we chose the imbalanced dataset for model construction.
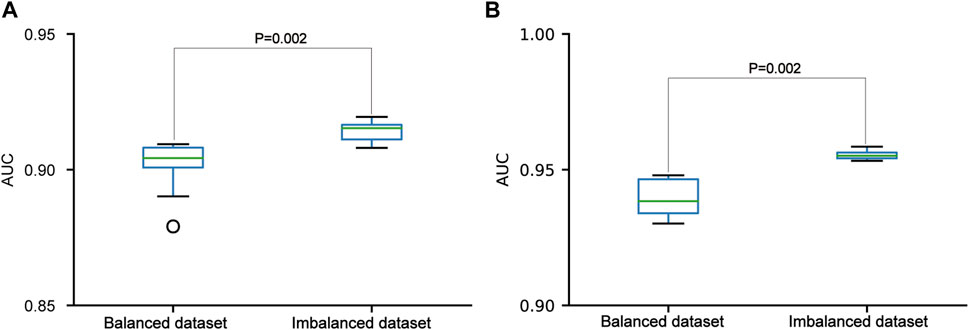
FIGURE 6. Performance comparisons between the CNNOH models based on balanced and imbalanced datasets in the independent test dataset. The models were developed for the pSADPr-pS dataset (A) and the pSADPr-UM dataset (B).
We constructed five CNN classifiers (i.e., CNNOH, CNNWE, CNNEAAC, CNNEGAAC and CNNZSCALE) to recognize pSADPr sites from the three datasets and compared their prediction performances. Here, we used the pSADPr-SADPr dataset to demonstrate the process. Three out of the five classifiers (i.e., CNNOH, CNNWE and CNNZSCALE) showed similar performances and superiority over the rest two (i.e., CNNEAAC and CNNEGAAC) in ten-fold cross-validation and independent test (Table 1; Figure 7 and Supplementary Figure S1). For instance, the CNNOH model had an AUC value of 0.712, larger than that (0.659) of the CNNEAAC model in the cross-validation. We repeated this analysis for the pSADPr-pS and pSADPr-UM datasets and made similar observations that the three classifiers had the best performances (Supplementary Tables S1, S2; Supplementary Figures S1–S5). Furthermore, we compared the classifiers’ performances for the three datasets. We found that the AUC values (0.921 and 0.953) of the CNNOH classifiers for pSADPr-pS and pSADPr-UM datasets were significantly larger than that (0.712) for the pSADPr-SADPr dataset. These results were consistent with our observation that the differences between pSADPr and SADPr sites are smaller than those between pSADPr and pS/UM sites (Figure 4). Since the One-Hot feature is the simplest compared to the WE and ZSCALE features, we chose the CNN classifier with the One-Hot scheme as the representative of the three classifiers.
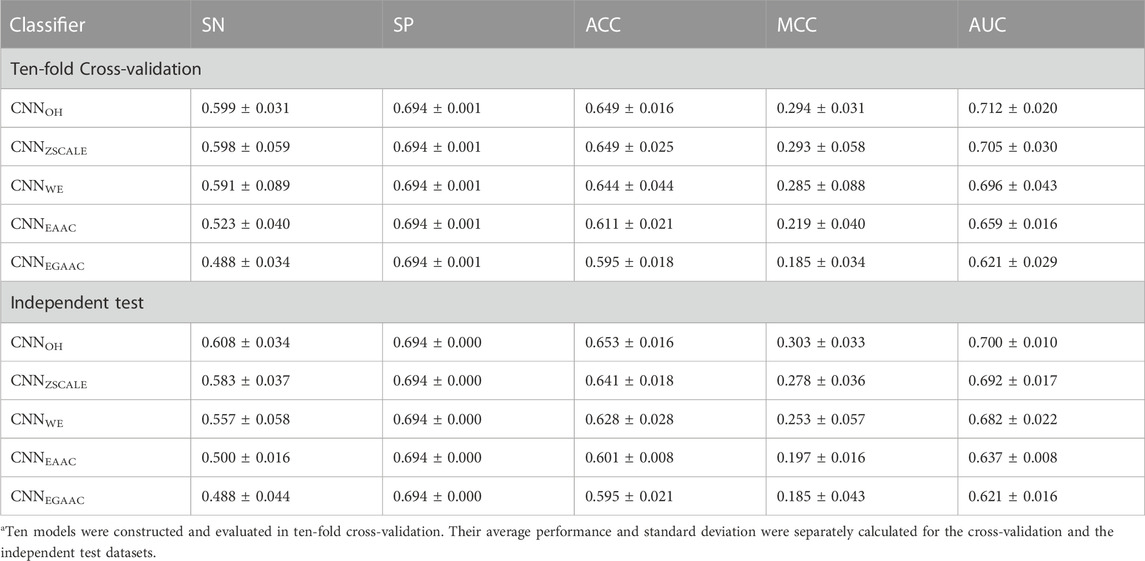
TABLE 1. Prediction performances of CNN-based classifiers for the pSADPr-SADPr dataseta.
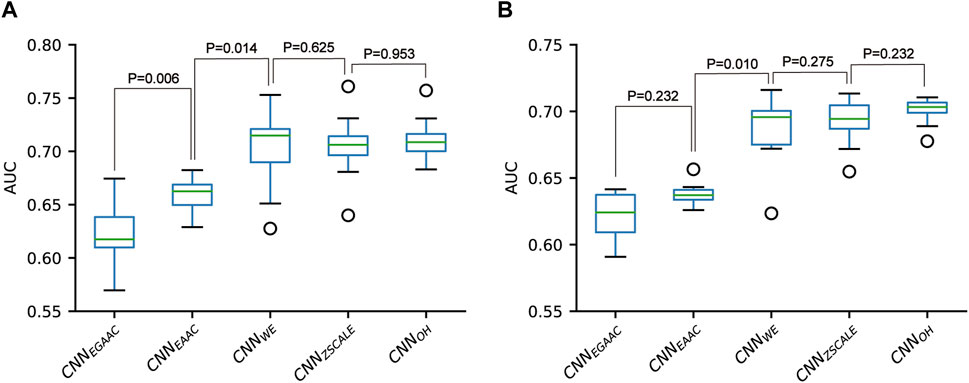
FIGURE 7. Performance comparison of CNN-based classifiers built for the pSADPr-SADPr dataset in ten-fold cross-validation (A) and independent test (B).
A stacking-based ensemble learning architecture is one of the ensemble techniques in which multiple learning models are integrated to produce one optimal predictive model, which performs better than the base models taken alone. In the stacking ensemble architecture, a meta-learner is trained to output a prediction based on the different base learner’s predictions. The stacking ensemble architecture has been used to improve the prediction performance in various bioinformatics applications (e.g., lysine acetylation site prediction) (Mishra et al., 2019; Zhang et al., 2021; Basith et al., 2022). Here, we introduced the two-stage stacking ensemble approach to improve the performance of the pSADPr site prediction (Figure 8). In the first stage, different CNN algorithms (e.g., CNNOH, CNNWE and CNNZSCALE) were selected to construct base classifiers. Specifically, ten base classifiers for each CNN algorithm were built and validated using the ten-fold cross-validation dataset. The base classifiers were then used for prediction in the independent test dataset, and their prediction results were averaged. Therefore, each CNN algorithm corresponds to the validation result and the averaged result for the independent test dataset. In the second stage, the validation and the averaged results were merged as a meta cross-validation dataset and a meta-independent test dataset, respectively (Figure 8). The former dataset was used to train and validate a meta-classifier, whereas the latter was employed to evaluate the meta-classifier’s performance. Here, we constructed the meta-classifier using the random forest algorithm (RF), which was optimized using the GridSearchCV package. The optimized parameters included max_depth as 8, max_features as “sqrt,” min_samples_leaf as 20, min_samples_split as 300 and n_estimators as 100.
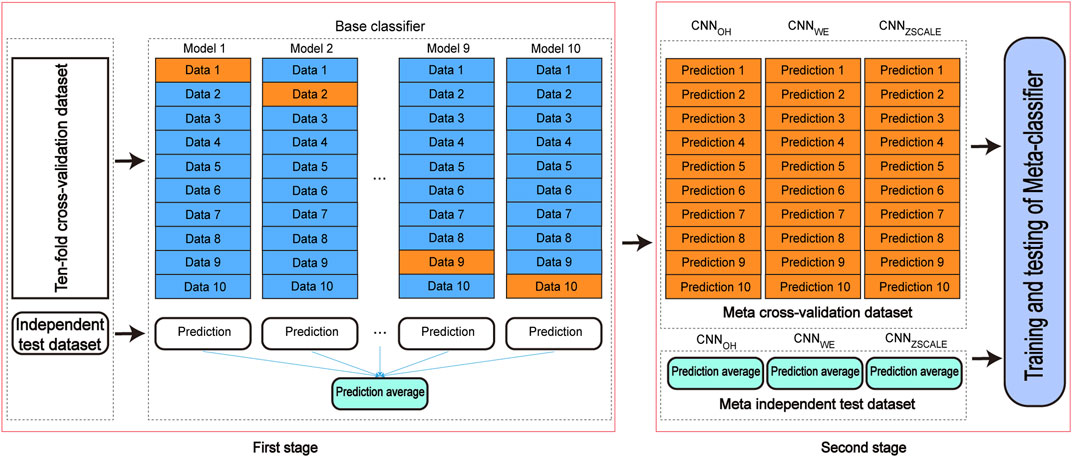
FIGURE 8. The architecture of the two-stage stacking ensemble classifier.
According to the above analysis, the three classifiers (i.e., CNNOH, CNNWE and CNNZSCALE) had better performances than two other classifiers (i.e., CNNEAAC and CNNEGAAC) for all three datasets. Based on the observation, we fused them as base classifiers to build the two-stage stacking ensemble approach with a good performance. We started with the fusion of the three best classifiers until we fused all the classifiers. The related stacking models included StackingO+Z+W, StackingO+Z+W+E and StackingO+Z+W+E+EG, where O stands for OH, Z for ZSCALE, W for WE, E for EAAC and, EG for EGAAC. For the pSADPr-SADPr dataset, the three stacking models showed similar performances in meta ten-fold cross-validation and independent test (Table 2; Figure 9 and Supplementary Figure S6). For instance, their average AUC/MCC values were around 0.719/0.313 in cross-validation (Table 2). The stacking models for the two other datasets (pSADPr-pS and pSADPr-UM) also performed similarly (Supplementary Figures S7–S10).
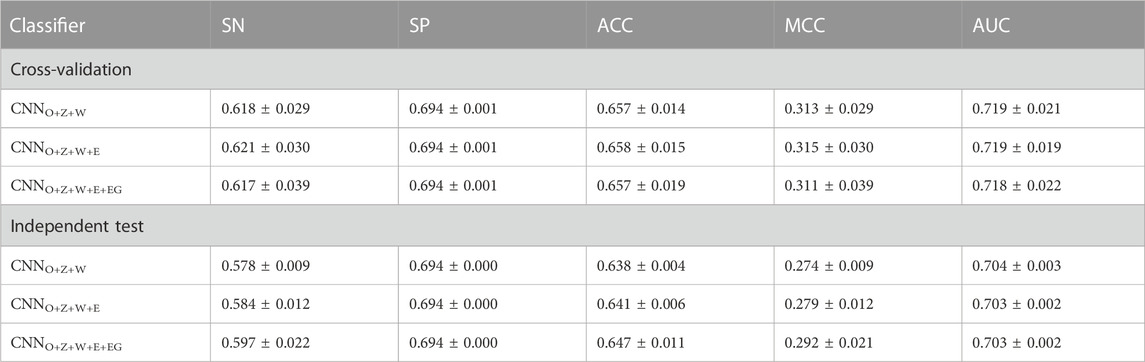
TABLE 2. Prediction performances of stacking ensemble classifiers for the pSADPr-SADPr dataset.
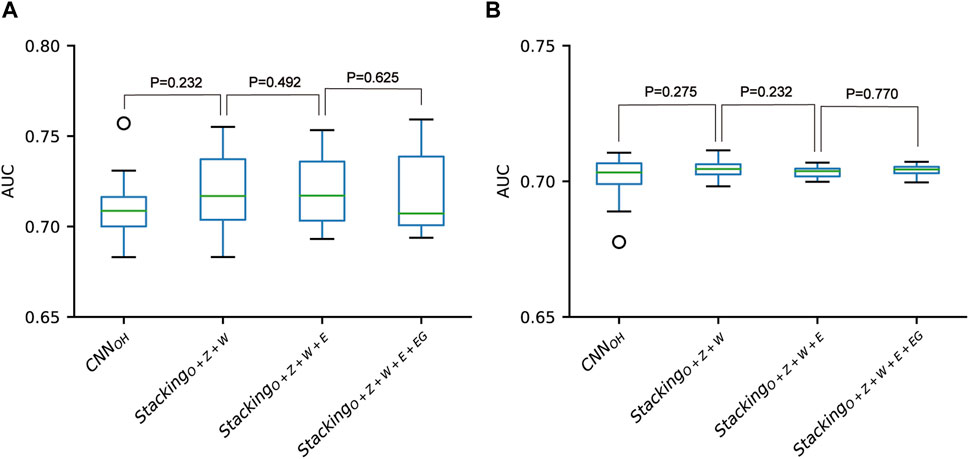
FIGURE 9. Performance comparison between CNN-based classifiers and the stacking-based ensemble classifiers for the pSADPr-SADPr dataset in the ten-fold cross-validation (A) and independent test (B). p values were calculated using the two-sided Mann–Whitney U test.
We compared the performances of the CNN-based models and the stacking ensemble models for each of the three datasets. We found no statistical difference between the CNNOH model and these stacking ensemble models for each dataset (Figure 9 and Supplementary Figures S9, S10). The observation that the meta-classifiers perform similarly to the base classifier is consistent with the previous report for predicting bacterial Type IV secreted effectors, in which the meta-classifier and base classifier performed similarly (Xiong et al., 2018). It suggests that the base classifiers may have sufficient predictive ability, and the stacking ensemble architecture does not constantly improve prediction accuracy.
We developed an online prediction tool for predicting human pSADPr sites extensively from different conditions, dubbed EdeepSADPr. This tool consists of three models, each corresponding to the prediction from the SADPr dataset, the serine phosphorylation dataset or the human proteome. As the CNNOH classifier had no less predictive performance than other methods, we selected this classifier to construct EdeepSADPr. The usage of this tool was described as follows. After the model selection, the input sequence with the fasta format would be uploaded. The prediction results were output in tabular form with five columns: sequence header, position, sequence, prediction score, and prediction category. The predicted results can also be downloaded as a data file. EdeepSADPr is accessible via http://edeepsadpr.bioinfogo.org/.
The main goal of this study is the development of a model to predict pSADPr sites based on protein sequence information and the investigation of pSADPr’s characteristics. We developed different deep-learning classifiers and used them as base classifiers to construct a few stacking-based ensemble models. We found that the base classifiers and the ensemble models had similar performances. The reason why the performance of the ensemble model was not improved is that there may not be much difference between the features used for model construction or the base models may not comprehensively cover the pSADPr’s characteristics. In the near future, we may integrate sequential information, structural information and evolutionary information to improve model performance (Xu et al., 2021). Additionally, the performance may be boosted by increasing the data amount and optimizing the model architecture (Zhu et al., 2022). Moreover, we found the characteristics of pSADPr sites, which may boost the understanding of this crosstalk. In summary, we developed the first classifier to predict human pSADPr sites and expect accurate prediction facilitate the discovery of new pSADPr sites. This architecture is applicable to the model construction for predicting other types of in situ crosstalks.
The original contributions presented in the study are included in the article/Supplementary Material, further inquiries can be directed to the corresponding author.
LL conceived this project. HJ and YS constructed the algorithms; HJ analyzed the data. LZ and HJ constructed the website. HJ, SS, YS, NH, and LL wrote the manuscript. All authors have read and agreed to the published version of the manuscript.
This work was partially supported by the National Natural Science Foundation of China (Grant 32071430 and Grant 32271504) and Innovation Capability Improvement Project of Science and Technology for Small and Medium-sized Enterprises in Shandong Province (2021TSGC1295).
HJ was an intern of Sino Genomics Technology Co., Ltd.
The remaining authors declare that the research was conducted in the absence of any commercial or financial relationships that could be construed as a potential conflict of interest.
All claims expressed in this article are solely those of the authors and do not necessarily represent those of their affiliated organizations, or those of the publisher, the editors and the reviewers. Any product that may be evaluated in this article, or claim that may be made by its manufacturer, is not guaranteed or endorsed by the publisher.
The Supplementary Material for this article can be found online at: https://www.frontiersin.org/articles/10.3389/fcell.2023.1149535/full#supplementary-material
Basith, S., Lee, G., and Manavalan, B. (2022). Stallion: A stacking-based ensemble learning framework for prokaryotic lysine acetylation site prediction. Brief. Bioinform 23 (1)–bbab412. doi:10.1093/bib/bbab412
Brustel, J., Muramoto, T., Fumimoto, K., Ellins, J., Pears, C. J., and Lakin, N. D. (2022). Linking DNA repair and cell cycle progression through serine ADP-ribosylation of histones. Nat. Commun. 13 (1), 185. doi:10.1038/s41467-021-27867-4
Buch-Larsen, S. C., Hendriks, I. A., Lodge, J. M., Rykaer, M., Furtwangler, B., Shishkova, E., et al. (2020). Mapping physiological ADP-ribosylation using activated ion electron transfer dissociation. Cell Rep. 32 (12), 108176. doi:10.1016/j.celrep.2020.108176
Chen, Y. Z., Chen, Z., Gong, Y. A., and Ying, G. (2012). SUMOhydro: A novel method for the prediction of sumoylation sites based on hydrophobic properties. PLoS One 7 (6)–e39195. doi:10.1371/journal.pone.0039195
Chen, Z., Zhao, P., Li, F., Leier, A., Marquez-Lago, T. T., Wang, Y., et al. (2018). iFeature: a Python package and web server for features extraction and selection from protein and peptide sequences. Bioinformatics 34 (14), 2499–2502. doi:10.1093/bioinformatics/bty140
Ge, L., and Moh, T. S. (2018). “Improving text classification with word embedding,” in IEEE International Conference on Big Data, Boston, MA, USA, 11-14 December 2017.
Hendriks, I. A., Larsen, S. C., and Nielsen, M. L. (2019). An advanced strategy for comprehensive profiling of ADP- ribosylation sites using mass spectrometry-based proteomics. Mol. Cell. Proteomics 18 (5), 1010–1026. doi:10.1074/mcp.TIR119.001315
Hornbeck, P. V., Kornhauser, J. M., Tkachev, S., Zhang, B., Skrzypek, E., Murray, B., et al. (2012). PhosphoSitePlus: A comprehensive resource for investigating the structure and function of experimentally determined post-translational modifications in man and mouse. Nucleic Acids Res. 40, D261–D270. doi:10.1093/nar/gkr1122
Huang, Y., Niu, B., Gao, Y., Fu, L., and Li, W. (2010). CD-HIT suite: A web server for clustering and comparing biological sequences. Bioinformatics 26 (5), 680–682. doi:10.1093/bioinformatics/btq003
Hunter, T. (2007). The age of crosstalk: Phosphorylation, ubiquitination, and beyond. Mol. Cell 28 (5), 730–738. doi:10.1016/j.molcel.2007.11.019
Larsen, S. C., Hendriks, I. A., Lyon, D., Jensen, L. J., and Nielsen, M. L. (2018). Systems-wide analysis of serine ADP-ribosylation reveals widespread occurrence and site-specific overlap with phosphorylation. Cell Rep. 24 (9), 2493–2505. doi:10.1016/j.celrep.2018.07.083
Li, W., and GodzikCd-hit, A. (2006). Cd-Hit: A fast program for clustering and comparing large sets of protein or nucleotide sequences. Bioinformatics 22 (13), 1658–1659. doi:10.1093/bioinformatics/btl158
Luo, F., Wang, M., Liu, Y., Zhao, X. M., and Li, A. (2019). DeepPhos: Prediction of protein phosphorylation sites with deep learning. Bioinformatics 35 (16), 2766–2773. doi:10.1093/bioinformatics/bty1051
Luscher, B., Butepage, M., Eckei, L., Krieg, S., Verheugd, P., and Shilton, B. H. (2018). ADP-ribosylation, a multifaceted posttranslational modification involved in the control of cell physiology in Health and disease. Chem. Rev. 118 (3), 1092–1136. doi:10.1021/acs.chemrev.7b00122
Lyu, X. R., Li, S. H., Jiang, C. Y., He, N. N., Chen, Z., Zou, Y., et al. (2020). DeepCSO: A deep-learning network approach to predicting cysteine S-sulphenylation sites. Front. Cell Dev. Biol. 8, 594587. doi:10.3389/fcell.2020.594587
Mishra, A., Pokhrel, P., and Hoque, M. T. (2019). StackDPPred: A stacking based prediction of DNA-binding protein from sequence. Bioinformatics 35 (3), 433–441. doi:10.1093/bioinformatics/bty653
Nowak, K., Rosenthal, F., Karlberg, T., Butepage, M., Thorsell, A. G., Dreier, B., et al. (2020). Engineering Af1521 improves ADP-ribose binding and identification of ADP-ribosylated proteins. Nat. Commun. 11 (1), 5199. doi:10.1038/s41467-020-18981-w
Peng, M., Scholten, A., Heck, A. J., and van Breukelen, B. (2014). Identification of enriched PTM crosstalk motifs from large-scale experimental data sets. J. Proteome Res. 13 (1), 249–259. doi:10.1021/pr4005579
Sha, Y., Ma, C., Wei, X., Liu, Y., Chen, Y., and Li, L. (2021). DeepSADPr: A hybrid-learning architecture for serine ADP-ribosylation site prediction. Methods 203, 575–583. doi:10.1016/j.ymeth.2021.09.008
Swaney, D. L., Beltrao, P., Starita, L., Guo, A., Rush, J., Fields, S., et al. (2013). Global analysis of phosphorylation and ubiquitylation cross-talk in protein degradation. Nat. Methods 10 (7), 676–682. doi:10.1038/nmeth.2519
Vacic, V., Iakoucheva, L. M., and Radivojac, P. (2006). Two sample logo: A graphical representation of the differences between two sets of sequence alignments. Bioinformatics 22 (12), 1536–1537. doi:10.1093/bioinformatics/btl151
Venne, A. S., Kollipara, L., and Zahedi, R. P. (2014). The next level of complexity: Crosstalk of posttranslational modifications. Proteomics 14 (4-5), 513–524. doi:10.1002/pmic.201300344
Wang, D., Liu, D., Yuchi, J., He, F., Jiang, Y., Cai, S., et al. (2020a). MusiteDeep: A deep-learning based webserver for protein post-translational modification site prediction and visualization. Nucleic Acids Res. 48 (W1), W140–W146. doi:10.1093/nar/gkaa275
Wang, C., Xu, H., Lin, S., Deng, W., Zhou, J., Zhang, Y., et al. (2020b). Gps 5.0: An update on the prediction of kinase-specific phosphorylation sites in proteins. Genomics Proteomics Bioinforma. 18 (1), 72–80. doi:10.1016/j.gpb.2020.01.001
Wei, X. L., Sha, Y. T., Zhao, Y. M., He, N. N., and Li, L. (2021). DeepKcrot: A deep-learning architecture for general and species-specific lysine crotonylation site prediction. IEEE Access 9, 49504–49513. doi:10.1109/access.2021.3068413
Xiong, Y., Wang, Q., Yang, J., Zhu, X., and Wei, D. Q. (2018). PredT4SE-Stack: Prediction of bacterial type IV secreted effectors from protein sequences using a stacked ensemble method. Front. Microbiol. 9, 2571. doi:10.3389/fmicb.2018.02571
Xu, H. D., Liang, R. P., Wang, Y. G., and Qiu, J. D. (2021). mUSP: a high-accuracy map of the in situ crosstalk of ubiquitylation and SUMOylation proteome predicted via the feature enhancement approach. Brief. Bioinform 22 (3), bbaa050. doi:10.1093/bib/bbaa050
Xu, H. D., Wang, L. N., Wen, P. P., Shi, S. P., and Qiu, J. D. (2018). Site-specific systematic analysis of lysine modification crosstalk. Proteomics 18 (9), e1700292. doi:10.1002/pmic.201700292
Yang, X. J., and Gregoire, S. (2006). A recurrent phospho-sumoyl switch in transcriptional repression and beyond. Mol. Cell 23 (6), 779–786. doi:10.1016/j.molcel.2006.08.009
Zhang, L., Wang, X., Zhang, L., Meng, Y., Wang, Z., Chen, Y., et al. (2021). SBP-SITA: A sequence-based prediction tool for S-itaconation. bioRxiv.
Zhang, L., Zou, Y., He, N., Chen, Y., Chen, Z., and Li, L. (2020). DeepKhib: A deep-learning framework for lysine 2-hydroxyisobutyrylation sites prediction. Front. Cell Dev. Biol. 8–580217. doi:10.3389/fcell.2020.580217
Zhu, Y., Liu, Y., Chen, Y., and Li, L. (2022). ResSUMO: A deep learning architecture based on residual structure for prediction of lysine SUMOylation sites. Cells 11 (17)–2646. doi:10.3390/cells11172646
Keywords: proteomics, machine learning and AI, post-translational modification (PTM), phosphorylation, prediction model, ADP-ribosylation, bioinforamtics
Citation: Jiang H, Shang S, Sha Y, Zhang L, He N and Li L (2023) EdeepSADPr: an extensive deep-learning architecture for prediction of the in situ crosstalks of serine phosphorylation and ADP-ribosylation. Front. Cell Dev. Biol. 11:1149535. doi: 10.3389/fcell.2023.1149535
Received: 22 January 2023; Accepted: 17 April 2023;
Published: 28 April 2023.
Edited by:
Utpal Ghosh, University of Kalyani, IndiaReviewed by:
Jia Meng, Xi’an Jiaotong-Liverpool University, ChinaCopyright © 2023 Jiang, Shang, Sha, Zhang, He and Li. This is an open-access article distributed under the terms of the Creative Commons Attribution License (CC BY). The use, distribution or reproduction in other forums is permitted, provided the original author(s) and the copyright owner(s) are credited and that the original publication in this journal is cited, in accordance with accepted academic practice. No use, distribution or reproduction is permitted which does not comply with these terms.
*Correspondence: Lei Li, bGlsZWltZUBob3RtYWlsLmNvbQ==
†These authors have contributed equally to this work and share first authorship
Disclaimer: All claims expressed in this article are solely those of the authors and do not necessarily represent those of their affiliated organizations, or those of the publisher, the editors and the reviewers. Any product that may be evaluated in this article or claim that may be made by its manufacturer is not guaranteed or endorsed by the publisher.
Research integrity at Frontiers
Learn more about the work of our research integrity team to safeguard the quality of each article we publish.