 Ming-Kin Wong1†
 Vincy Wing Sze Ho1†
 Xiaotai Huang2,3Lu-Yan Chan1Dongying Xie1
 Runsheng Li1Xiaoliang Ren1Guoye Guan4
 Yiming Ma1Boyi Hu1,5Hong Yan3
 Zhongying Zhao1,6*
- 1Department of Biology, Hong Kong Baptist University, Kowloon, Hong Kong SAR, China
- 2School of Computer Science and Technology, Xidian University, Xi’an, China
- 3Department of Electronic Engineering, City University of Hong Kong, Kowloon, Hong Kong SAR, China
- 4Center for Quantitative Biology, Peking University, Beijing, China
- 5Department of Biology, Southern University of Science and Technology, Shenzhen, China
- 6State Key Laboratory of Environmental and Biological Analysis, Hong Kong Baptist University, Kowloon, Hong Kong SAR, China
Early embryonic cell cycles usually alternate between S and M phases without any gap phase. When the gap phases are developmentally introduced in various cell types remains poorly defined especially during embryogenesis. To establish the cell-specific introduction of gap phases in embryo, we generate multiple fluorescence ubiquitin cell cycle indicators (FUCCI) in C. elegans. Time-lapse 3D imaging followed by lineal expression profiling reveals sharp and differential accumulation of the FUCCI reporters, allowing the systematic demarcation of cell cycle phases throughout embryogenesis. Accumulation of the reporters reliably identifies both G1 and G2 phases only in two embryonic cells with an extended cell cycle length, suggesting that the remaining cells divide either without a G1 phase, or with a brief G1 phase that is too short to be picked up by our reporters. In summary, we provide an initial picture of gap phase introduction in a metazoan embryo. The newly developed FUCCI reporters pave the way for further characterization of developmental control of cell cycle progression.
Introduction
The developmental control of cell cycle progression is essential to ensure a balance between cell proliferation or growth and cell fate differentiation. Dysregulation of the balance may lead to catastrophes such as carcinogenesis or abnormal cell death. Unlike cell division in a single-celled organism or a cultured cell, which progresses through a full cell cycle with four phases: two gap phases, G1 and G2, that interrupt the DNA synthesis (S) phase from mitosis (M) phase, early embryonic division in most metazoans consists of M and S phases only without any gap phase (Farrell and O’Farrell, 2014). After certain rounds of synchronous divisions that are mostly driven by maternal factors, cell cycles become asynchronous, and gap phases are presumably introduced in a cell type- or developmental time-dependent manner. The transition from synchronous to asynchronous divisions coincides with zygotic genome activation when zygotic gene expression is initiated (Lee et al., 2014; Pálfy et al., 2017). However, the exact details of when the gaps are systematically introduced spatiotemporally during embryogenesis remains poorly defined.
One of the major difficulties in defining embryonic cell cycle phases is the lack of reliable reporters for a precise demarcation of cell cycle phases. The recent development of fluorescent ubiquitination-based cell cycle indicator (FUCCI) has paved the way for demarcation of cell cycle phases, especially in cultured cells (Sakaue-Sawano et al., 2008). The initial FUCCI system developed in human cell line relied on pairs of fluorescent proteins fused to the degrons derived from Cdt1 and Geminin proteins which are a DNA replication licensing factor and its inhibitor, respectively (Arias and Walter, 2007). The CDT1 level peaks in the G1 phase, and declines quickly after the initiation of the S phase due to the degradation by SCFSkp2 (Li et al., 2003; Nishitani et al., 2004); whereas the Geminin reaches a high level in the S and G2 phases, but falls to a low level in the late M and G1 phases due to the degradation by APC/CCdh1 (McGarry and Kirschner, 1998; Arias and Walter, 2007). The reciprocal oscillations of the two factors during the cell cycle progression permit distinguishing cells in G1 phase from those in S/G2/M phase. Since their first introduction in human cell lines, FUCCI reporters have been developed in both cultured cells and intact animals (Sakaue-Sawano et al., 2013; Zielke et al., 2014; Bajar et al., 2016; Özpolat et al., 2017), greatly facilitating the study of regulation of developmental control over cell cycle progression. However, these reporters have not been generated in C. elegans, a well-established model organism.
Another difficulty in defining embryonic cell cycle phases lies in the systematic acquisition of the cellular accumulation patterns of fluorescence reporters with a high temporal resolution. This is because that cell divisions are rapid during early embryogenesis, which can be as fast as 8.6 min per generation (Foe and Alberts, 1983; Farrell and O’Farrell, 2014). Therefore, tracing the division of individual cells and measurement of reporter accumulation therein become a great challenge. C. elegans embryo is an excellent model for investigating gap phase introduction with cellular resolution. First, its embryo is transparent and develops with an invariant cell lineage within roughly 14 h at room temperature (Sulston et al., 1983), allowing live-cell imaging of the entire embryogenesis process at a high temporal resolution. Second, various automated tools have been developed to trace cell division and profile reporter accumulation with cellular resolution at 1.5-min intervals (Bao et al., 2006; Murray et al., 2008; Zhao et al., 2010a). Third, C. elegans embryogenesis demonstrates frequent division asymmetry in cell cycle length between two sister cells that develop into the same or different fate(s) (Sulston et al., 1983). We have previously shown that these asymmetries are primarily controlled by the regulatory factors determining fate differentiation (Ho et al., 2015). However, the method for systematic profiling of gap phase introduction has not been established in C. elegans though a postembryonic fluorescence reporters for cell cycle entry has been developed, which were based on reporter’s translocation rather than its accumulation or degradation to mark cell cycle commitment (vanRijnberk et al., 2017; Adikes et al., 2020). In addition, their dependence on the ratio between cytoplasmic and nuclear CDK abundance makes it not feasible for automated quantification of reporter intensity that relies on expression in nuclei, especially in late embryonic cells with minimal cytoplasm.
In this study, we determined the gap phase introduction for every cell during the embryogenesis of C. elegans. This was achieved by the development of multiple FUCCI reporters as a single-copy transgene in C. elegans (hereafter referred to as Worm-FUCCI), the degradation of which was biochemically and functionally validated. Aided by the automated tools for lineage and expression analysis (Bao et al., 2006; Murray et al., 2008), a combination of the individual FUCCI reporters with a lineaging marker allowed us to quantify the reporters’ lineal accumulation level for every cell at 1.5-min intervals throughout C. elegans embryogenesis, leading to a first-ever global picture of gap phase introduction throughout metazoan embryogenesis. We demonstrated that most embryonic cells appear to divide either with a very brief G1 phase or skipping the G1 and G2 phases altogether except one pair of cells, which apparently divide with a full cell cycle. We also demonstrated the potential of the reporters for cell cycle analysis during postembryonic development, including the development of germline and intestine. Availability of the Worm-FUCCI will aid future study of the coordination between cell division and fate differentiation during embryonic and postembryonic development.
Materials and methods
Worm strains and maintenance
All the animals were maintained on NGM plates seeded with OP50 at room temperature. The genotypes of the strains used in this paper were listed in the Supplementary Table S1. Imaging of postembryonic tissues was performed as described (Shao et al., 2013).
DNA constructs
his-72 promoter (2,349 bps from immediately upstream of its start codon), pie-1 3′UTR (787bp immediately after the stop codon), the nuclear localization signal (NLS) of EGL-13 (1-25aa), the degrons of CDT-1 (1-189aa) and CYB-1 (8-80aa) were amplified from the N2 genomic DNA, respectively. mCherry fragment was amplified from pCFJ104 (Frokjaer-Jensen et al., 2014), while eGFP was amplified from pZZ31 (Zhao et al., 2010a). The fusion cassette consisting of Phis-72::mCherry::CDT-1(1-189aa)::pie-1 3′UTR was cloned into the miniMos vector pCFJ909 (Frokjaer-Jensen et al., 2014) to generate plasmid pZZ176 using Gibson Assembly according to the manufacturer’s description. Plasmid pZZ180 [Phis-72::GFP::EGL-13 (1-25aa)::CYB-1 (8-80aa)::pie-1 3′UTR + unc-119(+)] was generated in the similar way as pZZY176. EGL-13 (1-25aa) was fused with the N-terminal of CYB-1 degron to serve as an NLS (Lyssenko et al., 2007). pZZ147 [Phis-72::mCherry::EGL-13 (1-25aa)::CYB-1 (8-80aa)::pie-1 3′UTR + unc-119(+)] was made by cutting the pZZ141 (Supplementary Table S1) with ApaI and SpeI, respectively, to replace the HIS-24 coding region with the fusion between EGL-13 (1-25aa) and CYB-1 (8-80aa). The details of these constructs built in this study was listed in the Supplementary Table S2. Vector sequences and annotations can be found in the links below:
pZZ176—CDT-1D: https://benchling.com/s/seq-iUCSfeZIg DycQ5RkrD2s/edit pZZ147—CYB-1D: https://benchling.com/s/seq-mN00xlJVIAwAU66QJIDA/edit pZZ180—CYB-1DG: https://benchling.com/s/seq-LBAUfkXMHsEbc 8Z6uRE4/edit.
5-ethynyl-2′-deoxyuridine staining
Prior to EdU staining, L4 worms were fed with perm-1 RNAi bacteria to permeabilize the eggshell as described (Carvalho et al., 2011). To confirm the permeabilization of eggshell, part of the embryos from the RNAi animals were stained with FM® 4–64 dyes (Invitrogen). Embryos were retrieved from about 10 dissected worms and allowed to develop under the Boyd’s buffer/methyl cellulose for 3 h (Murray et al., 2006). Click-iT® EdU Imaging Kit (Invitrogen) was used for EdU staining. After 3 h development, embryos were incubated with EdU for 15 min, followed by freeze-cracking, fixation and DAPI staining as described (Seydoux and Dunn, 1997). Embryos were then imaged for DAPI and mCherry accumulation of CDT-1D and CYB-1D, followed by EdU staining with Alexa Fluor® 647 using Leica SP5 Confocal microscope. Both DAPI and Alexa Fluor® 647 in the same embryos were imaged again, using DAPI for cell alignment to overlay the Worm-FUCCI accumulation with EdU signal in the nuclei.
RNA interference
RNAi against cdt-2, fzr-1, cul-1, pat-3 or cyd-1 was performed by microinjection as described (Ho et al., 2015). RNAi against ddb-1 was performed by feeding on the NGM plates supplemented with 50 μg/ml Ampicillin and 1 mM IPTG. RNAi against perm-1 was performed similar to that of ddb-1, except the perm-1 RNAi bacteria was diluted by “empty” vector (L4440) expressing bacteria in 1:6 ratio as described (Carvalho et al., 2011). The RNAi bacteria was derived from the Ahringer C. elegans RNAi feeding library (Kamath et al., 2001).
Fluorescence microscopy for embryo
Micrographs of embryos were acquired with a Leica SP5 confocal microscope with an objective of ×63 magnification. Early embryos were dissected from young adult worms and mounted with Boyd’s buffer/methyl cellulose (Murray et al., 2006), and late embryos were picked from the NGM plate. For 3D imaging, GFP and mCherry were simultaneously illuminated with 488nm and 594 nm laser beams, respectively, and micrographs of their expression were collected with two separate hybrid detectors through a water immersion objective. Imaging setting was similar to what was used previously using a frame size of 712 × 512 pixels except the scanning speed was changed to 200 Hz (hz) (Ho et al., 2015). Laser compensation was applied during the stack acquisition to ensure the comparable brightness of the images acquired between the lower stack and upper stack. DIC images were acquired separately for a single focal plane typically in the middle of the embryo. For time lapse 3D imaging, it was performed as described (Murray et al., 2006) with the following modifications. Micrographs from 41 focal planes were collected consecutively for three embryos per imaging session from top to bottom of the embryo at an interval of about 1.5 min with a Z-axis resolution of 0.71 µm. Images were continuously collected for at least 200 time points. The entire imaging duration was divided into four blocks based on the time point, i.e., 1–60, 61–130, 131–200, and beyond 201. Z axis compensation was 0.4%–4% for 488 nm laser and 19%–95% for the 594 nm laser. The pinhole sizes for the four blocks were 2.3, 2.0, 1.6, 1.3 AU (airy unit). In general, the imaging duration for control embryos were around 6 h, whereas for the cyd-1 RNAi embryos, the imaging duration was extended to 7 h to compensate the slower development of the embryo after RNAi. 3D projection was generated using Leica Application Suite X (LAS X).
Imaging and data analysis beyond time point when embryo starts twitching
To image a developing embryo beyond the time point when it started twitching, knockdown of pat-3 by RNAi was performed through microinjection. For automated lineaging of all embryonic cells up to 1.5-fold stage, the same settings were used as described above except the imaging duration was extended from 6 h to 9 h. For manual curation of the cells, V5QL/R, beyond the 1.5-fold stage, the RNAi embryo arrested at two-fold stage that specifically accumulated CYB-1DG was traced backward till the time point when their exact identities were established through automated lineaging at approximately 1.5-fold stage.
Automated lineaging and gene expression profiling
Strains expressing Worm-FUCCI were individually crossed either with strain RW10029 that broadly expresses a fusion between histone and GFP or RW10226 that broadly expresses a fusion between histone and mCherry, which were referred to as lineaging marker (Chen et al., 2018). FUCCI reporter contains mCherry or GFP was crossed with RW10029 and RW10226, respectively to allow automated cell tracing and lineal expression profiling. Both the lineaging marker and FUCCI reporter were rendered homozygous before automated lineaging and lineal gene expression profiling as described (Murray et al., 2008). Automated lineaging results were manually curated up to approximately 1.5-fold stage unless stated otherwise. All the expression data were normalized for the subsequent comparison.
Transgenesis
The Worm-FUCCI strains carrying a single-copy transgene were generated using miniMos technique (Frokjaer-Jensen et al., 2014). Only strains with bright maternal and zygotic expression of Worm-FUCCI transgene were selected for the subsequent analysis (Supplementary Table S2). Transgene insertion site was mapped using inverse PCR as described (Frokjaer-Jensen et al., 2014). To facilitate simultaneous visualization of both degron reporters in the same animal, the transgenes consisting of Phis-72::mCherry::CDT-1(1-189aa)::pie-1 3′UTR and Phis-72::GFP::EGL-13(1-25aa)::CYB-1(8-80aa)::pie-1 3′UTR were rendered doubly homozygous by crossing.
Fluorescence microscopy for postembryonic stages
Micrographs of larvae and gonads were acquired with tile scanning using the same confocal microscope as that for the embryo. Dissected gonads or intact adults were mounted with Boyd’s buffer/methyl cellulose (Murray et al., 2006) for imaging. Animals were mounted on a 1% agarose pad with 0.1 M sodium azide in M9 buffer for imaging with scanning speed of 200–400 hz depending on the size of the animals. For acquisition of 3D image stacks, imaging settings were similar to those used for the embryo except using 1 µm per z-step vs. 0.71 µm per z-step for the embryo.
Time-lapse imaging of larvae
Synchronized L1 larvae were obtained through egg prep. Animal development time (in hour) was counted from the start of feeding. Five larvae were selected for imaging each hour before and after the feeding for a continuous duration of 13 h. Micrographs were acquired only for part of the intestine using 0.3 µm per z-step and 200 hz scanning speed. Micrographs of mCherry and DIC were collected simultaneously. A representative micrograph for the cells int2 and int3 were collected for illustration.
Quantification and statistical analysis
To facilitate the comparison of accumulation intensities of the two reporters in the same cells from two different embryos throughout embryogenesis, two sets of reporter expression series (
There were four types of unavoidable experimental variations that needed to be normalized before the comparison of reporter expressions.
A. Due to high dynamic range of the lineaging marker expression values, the entire imaging process was separated by multiple blocks that applying different pinholes. However, the changes of pinhole would also sharply and constantly change the absolute recorded value of FUCCI reporter expressions. To maintain the continuity and comparability of both sets of the reporter expression series, linear scaling on the expression data was subsequently applied on each change of pinhole at the exact time point
B. The expression level of both FUCCI reporters varied globally among the embryos. Therefore, the data from them were linearly scaled to a closer order of magnitude for better visualization and comparison. The proportional scaling coefficient
C. The global variation in developmental paces between embryos, which was revealed by the slightly changeable cell cycle length (
D. Despite the global normalization on developmental pace, the cell cycle length of each specific cell would still be different in the two embryos. Hence, for each cell with complete lifespan recorded, its time points in Embryo G to fit the ones in Embryo R were linearly transformed by setting the actual time of appearance and the end of a cell that was totally same for both embryos, namely,
All four experimental variations were normalized, and the expression data of Embryo G were aligned onto that of Embryo R, which served as a reference regarding both reporter expression level and developmental pace. Finally, the expression values of two reporters from two different embryos were drawn on a single linage tree or plotted individually for each cell.
Results
Generation of Worm-fluorescence ubiquitin cell cycle indicators
To map the developmental introduction of gap phases during C. elegans development, we built a worm version of FUCCI, which consisted of degron reporters derived from two proteins: C. elegans orthologues of human CDT1 and cyclin B1 (CCNB1) protein, i.e., CDT-1 and CYB-1. Initial CDT1 derived FUCCI relied on one of its two degrons, i.e., Cy motif (Sakaue-Sawano et al., 2008). Although the degron is absent in the C. elegans CDT-1, the other degron of CDT1, PIP box, is present. As the PIP degron is rapidly degraded by CUL4Ddb1 during the S phase onset in humans (Sakaue-Sawano et al., 2017), CDT1 is extremely abundant in the G1 phase but barely detectable in the S phase. This degradation pathway was also shown to be conserved in C. elegans (Zhong et al., 2003; Kim and Kipreos, 2007; Özpolat et al., 2017). A recent study demonstrated the superiority of the PIP-containing degron as a G1-specific degron over the Cy motif, as it provided a sharper boundary between G1 and S phases in a human cell line (Sakaue-Sawano et al., 2017). To generate a G1-and G2-specific reporter in C. elegans, a sequence consisting of 1–189 CDT-1 amino acids that carried the PIP box but lacked the putative cyclin binding motif was fused with the C-terminus of mCherry (referred to as CDT-1D hereafter) (Figures 1A,B). To achieve broad spatial and temporal expression, the fusion was flanked by a his-72 promoter and a pie-1 3′ untranslated region (UTR). The his-72 promoter drives strong zygotic expression but is less capable in driving germline expression (Ooi et al., 2006). The inclusion of a pie-1 3’ UTR has been shown to significantly boost germline expression (Merritt et al., 2008; Zhao et al., 2010a) (Figure 1B). Therefore, the reporters are expected to show strong and broad expression in both germline and Soma in the absence of robust degradation. The truncated CDT-1 sequence seems to contain a cryptic NLS that directs the reporters into nuclei (Figures 2A, 3B). The cassette was introduced into random locations of the C. elegans genome as a single copy using the miniMos technique (Frokjaer-Jensen et al., 2014). The transgenic strain with the brightest and broadest expression but without apparent developmental defect was selected for the subsequent analysis. Nuclear expression is important to the subsequent analysis of reporter expression based on automated lineaging and expression profiling technologies (Bao et al., 2006; Murray et al., 2008). Broad accumulation of the reporter was observed for nearly all cells after they completed their last round of division during embryogenesis (Supplementary Figure S1). The accumulation dynamics of the reporter were expected to mimic those of their human equivalents, i.e., accumulation of the reporter was high in the G1 but completely absent in the S phase, followed by accumulation starting from the G2 and peaking again in the G1 phase (Figures 1C,D).
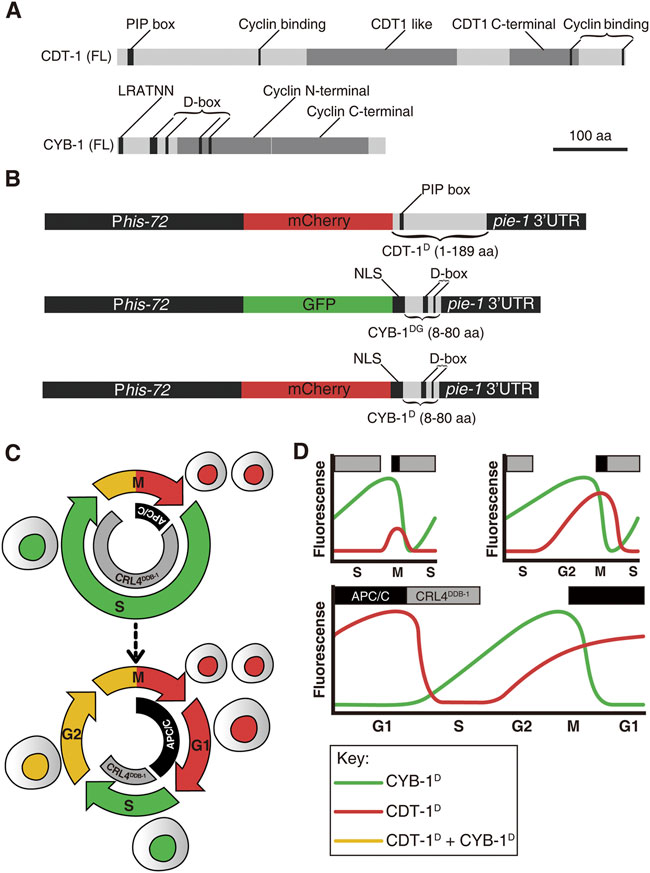
FIGURE 1. An overview of Worm-FUCCI design and expected marker expression dynamics in embryos. (A) Schematic representations of predicted domains in the full-length (FL) CDT-1 (top) and CYB-1 (bottom) proteins. Protein size in amino acid (aa) is shown in scale. PIP box: PCNA-interacting protein (CDT-1 degron). D-box: Destruction box (CYB-1 degron). LRVTRN: amino acid sequence of a chromosome localization motif. (B) Worm-FUCCI construct design. To ensure broad expression both maternally and zygotically, all expression cassettes are driven by a his-72 promoter and flanked by a pie-1 3′ UTR. Top: the CDT-1 degron consisting of 1–189 aa of CDT-1 is fused to the C-terminus of mCherry (referred to as CDT-1D) to label the G0/G1 and G2 phases. The PIP box with the sequence of QTAVTDFF in the degron is targeted for degradation by CRL4DDB−1 complex. Middle: the CYB-1 degrons consisting of 8–80 aa of CYB-1 is fused to the C-terminus of GFP (referred to as CYB-1DG) to label the S and G2 phases. The putative D-boxes are targeted for degradation by APC/CFZR−1 complex. An NLS from EGL-13 (1–25 aa) is introduced between the GFP and the truncated CYB-1 to ensure nuclear localization of expression. Bottom: Same as the CYB-1 fusion with GFP except the substitution of the GFP with mCherry (referred to as CYB-1D). All of the fusion constructs are integrated into C. elegans genome as a single copy transgene via miniMos technique. (C) Current view of early embryonic cell cycle (top) and full cell cycle (bottom) with the reported degradation complexes for the degrons mentioned in “(B)” in C. elegans indicated, i.e., degradation of CDT-1 (red) and CYB-1 (green) by CRL4DDB−1 and APC/C complex at S and M/G1 phase respectively. (D) Predicted expression dynamics of the degron reporters mentioned in “B” during C. elegans embryogenesis. The degron reporters and their corresponding degradation complexes are color coded as in “(C)”. Three different cell cycle scenarios, i.e., with no gap phase, with only G2 phase, and with both G1 and G2 phases, are shown. Note that the introduction of G2 phase results in an earlier increase in CDT-1D accumulation before M phase, whereas the introduction of G1 phase results in accumulation of CDT-1D but degradation of CYB-1D or CYB-1DG after M phase. The upper rectangle boxes denote the timing of the active degradation complexes (gray: CRL4DDB−1; black: APC/C).
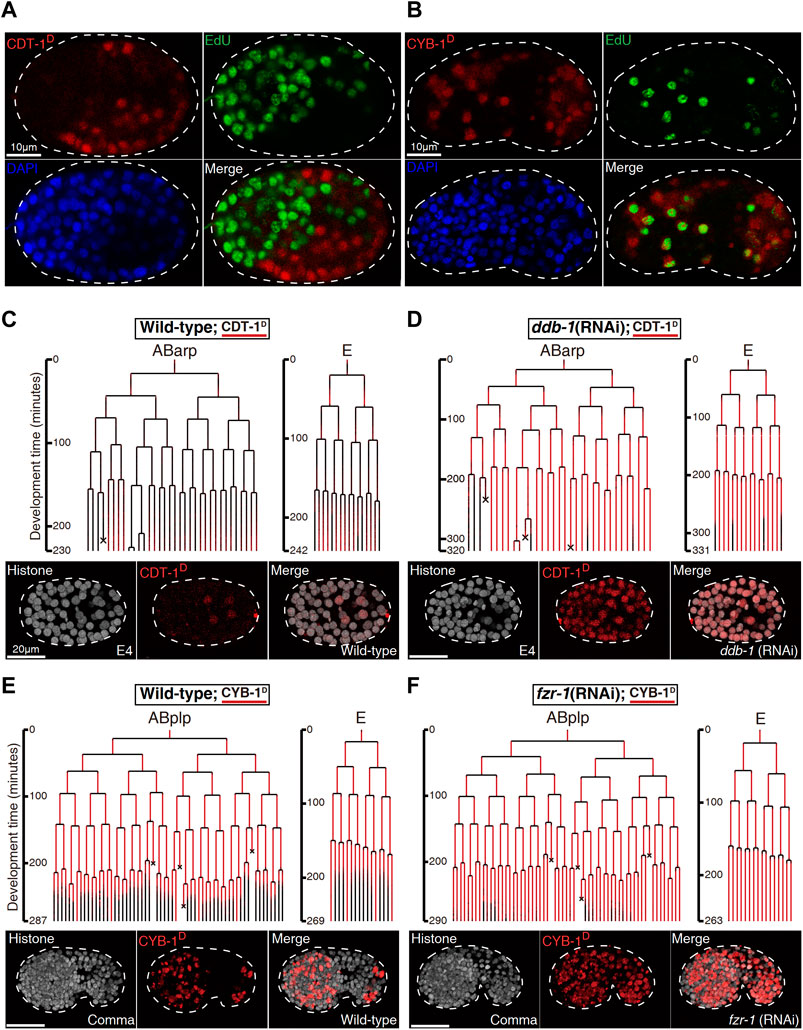
FIGURE 2. Biochemical and functional validation of Worm-FUCCI degradation (See also Supplementary Figures S3,S4). (A). EdU staining of the embryo expressing mCherry::CDT-1_PIP-box (referred to as CDT-1D). Note that the localization of CDT-1D (red) is mutually exclusive (merge) with the nuclei showing the staining of EdU (green) in a perm-1 RNAi embryo. Nuclei stained with DAPI are shown in blue. (B). Same as “(A)” except the embryo is expressing mCherry::CYB-1_D-box (referred to as CYB-1D). Note that the reporter-expressing cells (red) cover all the cells stained with EdU. The CYB-1-expressing cells that do not incorporated with EdU are presumably at G2/M phase. (C) Lineal expression (redness) of CDT-1D in the sublineages, “ABarp” and “E” in a wild-type embryo. Development time starting from the birth of the ancestral cell of interest is shown on the left and cell deaths are indicated with an “×”. Epifluorescence micrographs for a representative time point at the “E4” stage [“E” divides into four daughters] are shown at the bottom. Histone, histone::GFP used for cell tracking during lineage analysis. (D) Same as “(C)” except the embryo is treated by RNAi against ddb-1. Note that expression onset of CDT-1 becomes much earlier and expression intensity becomes much higher in most cells after the RNAi. (E) Lineal expression of CYB-1D in the sublineages of “ABplp” and “E” in a wild-type embryo. Development time and cell deaths are shown as in “(C)”. Epifluorescence micrographs for a representative embryo at comma stage are shown at the bottom. (F). Same as “(E)” except that the embryo is treated by RNAi against fzr-1. Note that the degradation of the reporter during late embryogenesis is mostly abolished after the RNAi.
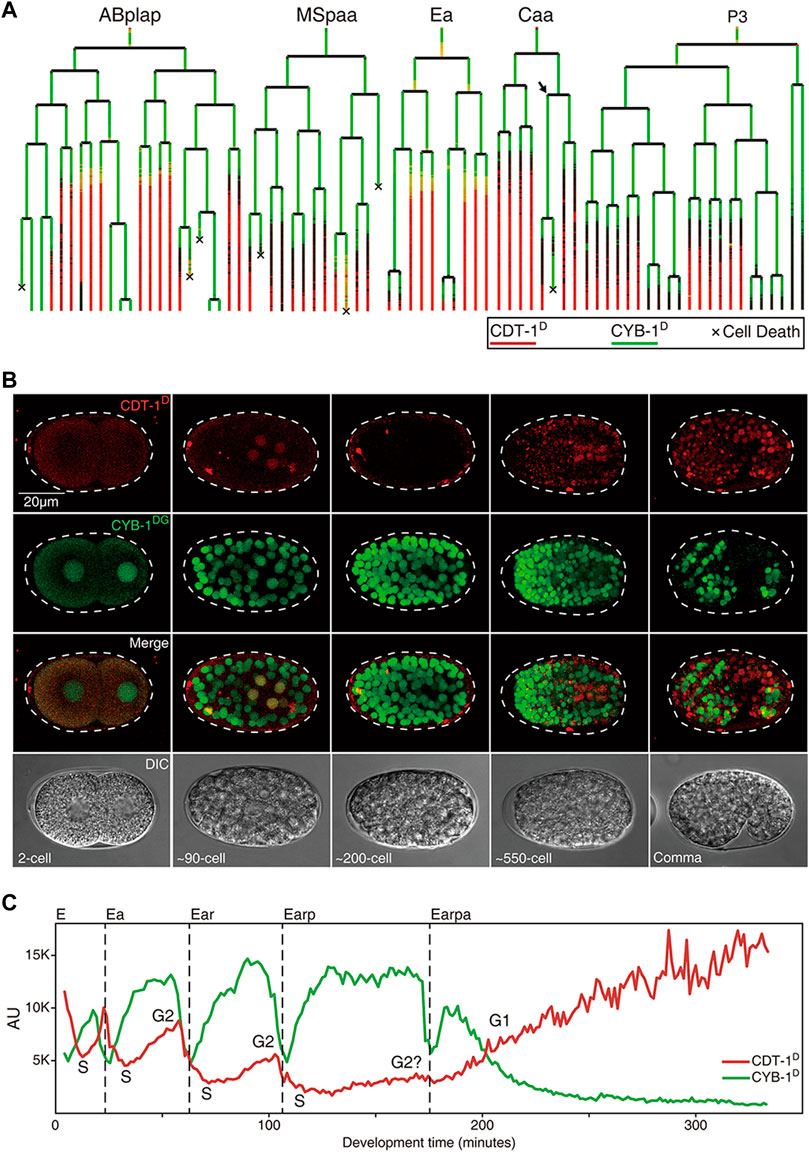
FIGURE 3. Expression dynamics of Worm-FUCCI in representative cell lineages during C. elegans embryogenesis (see also Supplementary Figures S1,S2). (A) Cell lineage trees showing the superimposed lineal accumulation of CDT-1D (colored in red) and CYB-1D (colored in green) in the representative sublineages of “ABplap”, “MSpaa”, “Ea”, “Caa”, and “P3”. Asynchrony of division between sister cells, “Caapa” and “Caapp”, is indicated with an arrow. Cell death is indicated with a “ד. Note the overall complementary expression patterns between the two reporters, i.e., the CYB-1D is ubiquitously expressed during early embryogenesis, while the CDT-1D is usually not expressed until a cell completes its last round of division. Long lasting CDT-1 expression is predictive of a cell cycle exit. (B) Epifluorescence micrographs of the embryos at different stages as indicated, which simultaneously express CDT-1D and CYB-1DG in the same embryo in some cells. The Nomarski micrographs of the same embryos are shown at the bottom. (C) Quantification of accumulation dynamics of CDT-1D (red) and CYB-1D (green) during the development of E lineage (only “Earpa” sublineage is shown). Normalized fluorescence intensity in the arbitrary unit (AU) is plotted on the Y axis. Development time from “E” to “Earpa” cells starting from the birth of “E” is plotted on the X axis. Cell cycle phases are indicated based on the expression dynamics of the two reporters. Division time point of each cell are indicated with a dashed line.
To develop a second reporter in assisting the CDT-1D in defining cell phase boundaries, we attempted to use a C. elegans equivalent as that in humans, i.e., Geminin. However, the Geminin orthologue (gmn-1) was barely identifiable by sequence alignment in C. elegans, although its function appeared to be conserved (Yanagi et al., 2005). We therefore used a highly conserved degron of cyclin B1 (CYB-1), whose Drosophila orthologue has been demonstrated to show accumulation dynamics that is comparable to those of human Geminin (Zielke et al., 2014). The N-terminal sequences of both C. elegans CYB-1 and its mouse orthologue, cyclin B1, contain a degron called the destruction box (D-box) (Figure 1A). The mouse cyclin B1 was demonstrated to be degraded by APC/CFzr/Cdh1 in human cell line (Zur and Brandeis, 2002). The CYB-1 N-terminal sequence (8–80 amino acid) contains the first two D-boxes but lacks the putative mitotic chromosome association motif (Pfaff and King, 2013). The full N-terminal sequence also carries another two putative D-box degrons located within the cyclin N-terminal domain. We omitted the two D-box degrons within the cyclin N-terminal domain to avoid the potential functional interference of the native protein, which may lead to abnormal degradation. The truncated fragment was fused with the C-terminus of either GFP (referred to as CYB-1DG) or mCherry (referred to as CYB-1D) (Figure 1B). The truncated CYB-1 sequence contains the first two D-boxes with the sequences of REILALKPSN and RINL, respectively. Again, the fusion was flanked by the same regulatory sequences as those for the cassette CDT-1D to achieve broad expression in germline and Soma. However, the transgenic animals generated with these constructs were not expressed in the nuclei (Wang et al., 2013). An NLS sequence derived from EGL-13 (Lyssenko et al., 2007) was fused between the fluorescence protein sequence and the degron sequence, resulting in bright expression of the single-copy transgenes in the nuclei (Figures 2B, 3B). In contrast with the high abundance of CDT-1D in the G1 phase, the accumulation of the CYB-1D was expected to be barely detectable in the G1 phase, but to accumulate from the S phase and peak at the start of the G2 phase (Figures 1C,D). In summary, we created the transgenic strains that carry a single copy of reporters fused with degrons from CDT-1 or CYB-1, which we referred to as Worm-FUCCI. The high abundance of CDT-1D accumulation in the absence of the CYB-1D or CYB-1DG would be indicative of the G1 or G0 phase of a cell; whereas the absence of the CDT-1D with the initial accumulation of CYB-1D or CYB-1DG would be indicative of the S phase; and a high abundance of both degron reporters would be indicative of the G2 phase (Figures 1C,D).
Validation of degradation dynamics of the Worm-fluorescence ubiquitin cell cycle indicators
To validate whether the Worm-FUCCI was temporally degraded as expected, we first examined whether the CDT-1D was absent but the CYB-1D was present in the S phase of embryonic cells. To this end, we investigated the concurrence between the incorporation of 5-ethynyl-2′-deoxyuridine (EdU) and the accumulation of the CDT-1D. EdU was expected to be incorporated into DNA only at the S phase. To permeabilize the egg shell for EdU, we partially inactivated perm-1 by RNA interference (RNAi) as reported previously (Carvalho et al., 2011). As expected, the accumulation of CDT-1D was mutually exclusive to the staining of EdU in nearly all embryonic cells (Figure 2A; Supplemenary Figure S4A), while the accumulation of CYB-1D was mostly overlapped with the staining of EdU (Figure 2B; Supplemenary Figure S4B). Because the CYB-1D was expected to be accumulated also in the G2 phase, those cells showing CYB-1D accumulation but no staining of EdU were expected to be at the G2 phase.
We next functionally validated the S phase-specific degradation of CDT-1D, which was reported to be degraded by cullin 4-based complex, i.e., cullin-RING ligase (CRL) coupled with adaptor protein DDB-1 (together referred to as CRL4DDB−1), in C. elegans (Kim and Kipreos, 2007). We first performed RNAi against the gene encoding the adaptor of CUL-4, ddb-1, using a strain that simultaneously expressed the degron reporter and a lineaging marker, i.e., histone::GFP (Murray et al., 2008). We then performed automated lineaging and lineal gene expression analysis using this strain with and without RNAi treatment as described (Zhao et al., 2010b). We did not detect any accumulation of CDT-1D in most cells until about 550-cell stage of embryogenesis in a control embryo, which refers to a wild-type embryo without any perturbation except transgenesis-related genetic modification (Figures 2C; Supplemenary Figure S1). In contrast, the RNAi led to the continuous accumulation of the degron reporter much earlier than that in the control embryo (Figure 2D), confirming that the degron had been targeted by the degradation pathway involving DDB-1 as expected. In addition to the adaptor DDB-1, CDT-2 was shown to function as a substrate recognition subunit in the CRL4 ubiquitin ligase for CDT-1D degradation (Kim et al., 2008). RNAi against cdt-2 led to an increased accumulation of CDT-1D in most cells when compared with the control embryo (Supplemenary Figure S3), further confirming that the CDT-1D was degraded by the cullin-RING ubiquitin ligase, CRL4DDB−1, in C. elegans.
The CYB-1D was expected to accumulate in any cells with an active S and/or G2 phase and to abolish its accumulation in embryonic cells starting from M phase until the end of G0/G1 phase. The transgenic strain carrying CYB-1D construct indeed demonstrated CYB-1D accumulation throughout early embryonic cell cycle but degraded in most of the late embryonic cells (Figure 2E; Supplemenary Figure S2). Notably, CYB-1D also demonstrated an unexpected accumulation during and after the M phase. This could be due to the omission of other degrons within the CYB-1D sequence, which led to a deviation from its native degradation pattern. A previous study showed that the mammalian CYB-1 orthologue, cyclin B1 was first targeted by APC/CFzy/Cdc20 for degradation from prometaphase up to late M phase or anaphase (Clijsters et al., 2013). The degradation was relayed by APC/CFzr/Cdh1, which remained active till late G1 phase (Zur and Brandeis, 2002). Since the functions of both degradation complexes were known to be conserved in C. elegans (Fay et al., 2002; The et al., 2015; Kipreos and van denHeuvel, 2019), we reasoned that one the one hand the improper perdurance of CYB-1D through M phase till the early stage of next cycle (Figure 2E), could be due to the failure of the Cdc20/Fzy orthologue (FZY-1) to target the truncated cyclin for degradation because of missing degrons. On the other hand, it was possible that the Cdh1/Fzr orthologue (FZR-1) may not be robust enough to completely degrade CYB-1D before the end of the M phase. In addition, mutation in fzy-1 led to early embryonic arrest (Tarailo et al., 2007), making it infeasible to perform lineage analysis. We therefore performed RNAi against C. elegans fzr-1 followed by automated lineage and lineal gene expression analysis to see if CYB-1D was indeed targeted by APC/CFZR−1 for degradation. Instead of the absence of accumulation in the wild-type embryo around 550-cell stage, we observed a substantial increase in the accumulation of CYB-1D in most of the embryonic cells that completed their last round of division (Figure 2F), confirming that the C. elegans D-boxes within CYB-1D was targeted by the degradation complex APC/CFZR−1.
Worm-fluorescence ubiquitin cell cycle indicators detects a G1 phase present at only a few embryonic cells before they complete their last round of division
Equipped with the Worm-FUCCI reporters that showed expected accumulation dynamics, which were predictive of cell cycle phases, we set out to systematically determine the gap phase introduction during C. elegans development, with a focus on embryonic cell cycles. Aided by the automated lineaging and gene expression profiling technologies (Bao et al., 2006; Murray et al., 2008), we took time-lapse 3D images to trace cell lineage and acquire lineal expression up to the 1.5-fold stage of embryogenesis, upon which lineaging analysis became impractical due to twitching (Supplementary Figures S1,S2, Supplementary Movie S1). Notably, most of the embryonic cells had completed their last rounds of division by this stage with a few exceptions discussed below. To facilitate the comparison and quantification of accumulation of CDT-1D and CYB-1D, we superimposed the lineal accumulation patterns of the two reporters in a single lineage tree (Figure 3A) as described previously (Murray et al., 2008). To allow visualization of the two reporters in the same embryo, we crossed the transgenic CDT-1D and CYB-1DG alleles into the same animal in which both were rendered homozygous (Figure 3B).
Strikingly, the accumulation patterns of the two reporters barely overlapped but were mostly complementary both spatially and temporally in nearly all embryonic cells, i.e., CYB-1D accumulated broadly during early embryogenesis, whereas CDT-1D did not accumulate in most of the embryonic cells until they had completed their last round of embryonic division (Figures 3A,C). These results suggest that most embryonic cell cycles progress mostly with the S and M phases only and arrest in the G0 or G1 phase after they have completed their last rounds of division. However, it remains possible that there might be some brief G1 phases present in the embryonic cells, but may not be picked up by our reporters due to the limited temporal resolution imposed by the mCherry maturation time and the degradation efficiency of the reporters. Consequently, the CDT-1D expression signal enables the accurate prediction of cell cycle exit, i.e., the CDT-1D signal is not observed until a cell completes its last round of division, after which the CDT-1D signals are seen in nearly all embryonic cells in a cell fate-independent way (Figures 3A,B; Supplementary Figure S1). As our reporters could not distinguish the G1 phase from the G0 phase, we assume that most CDT-1D-expressing cells that have completed the last round of division in their life cycle are arrested in the G0 phase.
To functionally validate this observation, we used RNAi to inactivate cul-1, which encodes a key cell cycle regulator required for cell cycle exit. Its perturbation was expected to prevent the embryonic cells from entering G0 or G1 phase (Kipreos et al., 1996). As expected, only CYB-1D accumulation was detected in the perturbed embryos even they died (Supplementary Figure S5), indicating that cells of the RNAi embryo failed to arrest in the G0 or G1 phase. Due to the inability of our markers in distinguishing G0 from G1 phase, further resolving the arresting phase in the dead embryo requires independent markers, such as those that have been recently developed (Adikes et al., 2020).
We observed an inconsistence of Worm-FUCCI in demarcating cell cycle progression of germline progenitor P4 and its two daughter cells, “Z2.” and “Z3.” Despite embryonic arrest of the “Z2” and the “Z3,” CDT-1D accumulation was not observed, while CYB-1D accumulation was lost after the 350-cell stage (Figure 3A, Supplementary Figures S1,S2). This appeared to be due to the inability of the his-72 promoter to drive the zygotic expression of Worm-FUCCI in the germline progenitors of the embryo rather than its cell cycle-specific degradation (Murray et al., 2006; Ooi et al., 2006; Zhao et al., 2010a). Therefore, a promoter that is able to simultaneously drive reporter expression in the germline progenitors is necessary to indicate cell cycle progression therein.
Division asynchronies between sister cells seem mainly due to the differential durations of the S phase during embryogenesis
Unlike synchronous cell divisions in the early embryo of many other metazoans, C. elegans embryonic cell division is asynchronous from the very first division and becomes more obvious during late embryogenesis (Bao et al., 2008; Budirahardja and Gonczy, 2008; Rivers et al., 2008). As only CYB-1D accumulation was seen in the sister cells between which division asymmetry in cell cycle length was observed (Figure 3A, Supplementary Figures S1,S2), lack of accumulation of CDT-1D indicating that no involvement of G1 phase in the asymmetry. For example, the division asymmetry between the sister cells “Caapa” and “Caapp” is around 50 min during which accumulation of CDT-1D or degradation of CYB-1D is expected to be observed, but we did not observe either of them. Then the asymmetry could be due to differential duration of M, S or G2 phase. However, the entire duration from chromatin condensation to mitosis (assumed to be the M phase) was only around two minutes (Suppmentary Figure S6), suggesting that the differential duration of the M phase between the two sister cells was unlikely to be responsible for the observed asymmetry. Therefore, a differential duration of S or G2 phase was responsible for the observed division asymmetries in cell cycle length. However, we expected accumulation of both CDT-1D and CYB-1D during the G2 phase. Presence of CYB-1D accumulation only suggests that it was the differential duration of the S phase that was responsible for most of the observed division asymmetries in cell cycle length.
G2 phase is first introduced in the intestine precursors during embryogenesis
The “E2” (two daughters of “E,” the intestine progenitor) and “E4” (four granddaughters of “E”) of the intestine primordium (“E”) were found to accumulate both CDT-1D and CYB-1D simultaneously at the late stage in their cell cycles, indicated that a G2 phase was introduced in these cells (Figures 3A,C). Consistent with this, a previous study with DAPI staining also demonstrated that “E2” cells acquired the G2 phase (Edgar and McGhee, 1988). However, the accumulation of CDT-1D was become barely detectable in E8 (eight daughters of E4), which suggests that the G2 phase was lost (Figures 3A,C). It was also possible that the accumulation level of CDT-1D in the E8 cells was too low to be detected. Alternatively, maternal contribution of either mRNAs or proteins or both could boost the abundance of CDT-1D. Consistent with this, ddb-1 RNAi led to robust accumulation of CDT-1D in E8 cells when it lacks degradation (Figure 2D). It remains possible that the degradation of CDT-1D was so robust that the accumulation window of CDT-1D was too short to be visualized due to relatively long mCherry’s maturation time, whereas the G2 duration in the E2 or E4 cells could be substantially longer than that in the E8 cells. Intriguingly, upon the E16 (daughters of E8) stage, most of the cells arrested in the G1 phase unless they underwent one more round of embryonic division, as judged by the accumulation of the two degron reporters (Figure 3A, Supplementary Figures S1,S2), which mirrors the cell cycle characteristics of most other embryonic cells.
Worm-fluorescence ubiquitin cell cycle indicators reporters reliably detect an obvious G1 and G2 phase only in the last round division of “ABplapapaa” and “ABprapapaa” during embryogenesis
As stated above, most of embryonic cells did not accumulate CDT-1D until they had completed their last round of embryonic division. Notably, a few cells did not complete their last round of division until about one hour before hatching, meaning that they had a very long cell cycle duration (Supplementary Figure S7) (Sulston et al., 1983). We wondered whether any gap phases had been introduced in these cells. However, these cells continued to divide after the embryo had started twitching, presenting a significant challenge to the live-cell imaging required for the subsequent lineaging analysis (Supplementary Movie S1) (Murray et al., 2008). To facilitate imaging during development of these cells, we depleted the activity of pat-3, which encodes a β-integrin subunit required for normal muscle filament assembly and function (Gettner et al., 1995). This depletion permitted the perturbed embryo to continue developing without twitching and rotating until its arrest at around the 2-fold stage (Supplementary Movie S2). This allowed us to trace cell division beyond the 1.5-fold stage using extended imaging time. As expected, we observed a clear two-way accumulation dynamic of CDT-1D in one cell pair, consisting of “ABplapapaa” and “ABprapapaa,” referred to as “V5QL” and “V5QR,” respectively hereafter, which divided about one hour before hatching (Supplememtary Figure S7). CDT-1D accumulated soon after birth of the two cells, peaked and got completely degraded at around 150 and 220 min after their birth, respectively, in both cells. Importantly, the CDT-1D accumulated again at roughly 450 min and peaked around 550 min after their birth till the end of the imaging process (Figures 4A,B). The two cells developed into symmetrical cell fates, i.e., dividing into “V5L” and “QL” cells (postembryonic blast cells for hypodermis and neuron, respectively) or “V5R” and “QR” cells, respectively, during embryogenesis. The two cells resume cell division during postembryonic development, giving rise to hypodermal or neuronal cells (Sulston et al., 1983). Notably, “V5QL” and “V5QR” were the last cells to divide during embryogenesis (Supplememtary Figure S7, Supplementary Movie S1) (Sulston et al., 1983). Immediately after the disappearance of CDT-1D, CYB-1D started to accumulate, and peaked about 7 h after their birth in the same cells (Figures 4A,B). The presence of CDT-1D but the absence of CYB-1D in this long duration (roughly two hours) indicated a G1 phase, whereas the absence of CDT-1D indicated an S phase here. The simultaneous accumulation of the two degron reporters indicated a G2 phase.
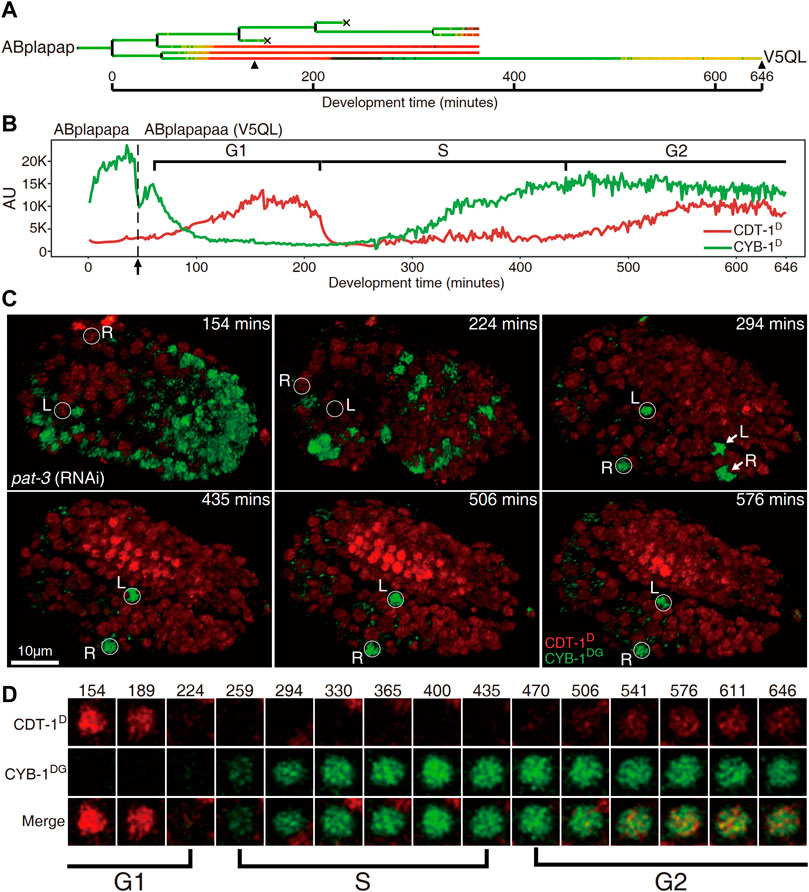
FIGURE 4. Cells “V5QL” (“ABplapapaa”) and “V5QR” (“ABprapapaa”) divide with a full cell cycle during C. elegans embryogenesis. (A). Lineal accumulation of CDT-1D (red) and CYB-1D (green) in the sublineage of “ABplapap,” the grandparent of V5QL in the embryos treated with RNAi against pat-3 to inhibit twitching. All cells are curated up to 365 min after the birth of “ABplapap” or up to their apoptotic cell death except the “V5QL” cell, which is curated up to 646 min after its birth (see Materials and Methods). For simplicity, only the expression of “V5QL” is shown. (B). Quantification of accumulation of CDT-1D (red) and CYB-1D (green) in the “V5QL” cell and its parent (“ABplapapa”). Fluorescence intensity in the arbitrary unit (AU) is plotted on the Y axis and development time from the birth of “ABplapap” on the X axis. Durations of cell cycle phases are indicated with scaled bar above based on the expression dynamics of the two reporters. Division time point of “ABplapapa” is indicated with an arrow. (C) Expression dynamics of CDT-1D and CYB-1DG in a late embryo treated with RNAi against pat-3 (see also Supplementary Movies S1,S2). Shown is the 3D projection of epifluorescence micrographs at six time points as indicated with CYB-1DG (green) and CDT-1D (red). The embryo is oriented so that both “V5QL” and “V5QR” (highlighted with white circles and indicated with L and R, respectively) are located at the posterior of the embryo. Development time is shown as in “(B)”. Note that the CYB-1DG is degraded in most cells at 1.5 fold stage (224 min) but is highly accumulated only in “V5QL(R)” and “ABpl(r)apappppa” (indicated with L and R, respectively) upon two-fold stage (294 min). The CYB-1DG becomes completely degraded in the latter two cells about 140 min later. Also note that the CDT-1D is accumulated at the bean stage (154 min) and becomes completely degraded upon 294 min in the “V5QL(R)” cells. Most cells accumulate a high level of CDT-1D during late embryogenesis, indicating their arrest at G1 or G0 phase. (D) Magnified views of the “V5QL” cells shown in “C” that simultaneously accumulate CDT-1D (red) and CYB-1DG (green) over development. Development time in minute is shown on the top. The first and the last time points correspond to those indicated with black triangles in “(A)”. Cell cycle phases are indicated based on reporter expression dynamics.
In addition to “V5QL” and “V5QR”, coelomocyte precursors, “MSapapaa” and “MSppapaa,” also completed their last round of embryonic division relatively late during embryogenesis, which has long been speculated to divide with G1 phase (Boxem and van denHeuvel, 2001; Yanowitz and Fire, 2005; Kipreos and van denHeuvel, 2019). However, only CYB-1D but not CDT-1D showed accumulation in these two cells before their division (Supplementary Figures S8A,B), suggesting that an elongated S phase was responsible for their relative long cell cycle duration. It is also possible that the accumulation window of CDT-1D may be too short to be detected by our reporters. To test this, we performed RNAi against cyd-1, which is expected to lead to arrest of these cells at the G1 phase before their last round of cell division during embryogenesis. As expected, despite the lack of CDT-1D accumulation in the control embryo, we detected an obvious accumulation of CDT-1D and degradation of CYB-1D in one of the coelomocyte precursors after the RNAi (Supplementary Figures S8C,D), which strongly argue the presence of a brief G1 phase in these cells that is beyond of reach by the reporters in the control embryo.
Most other cells arrested at the G0 or G1 phase up to the late “2-fold” stage (actually beyond the 2-fold stage in a control embryo due to embryonic arrest caused by the depletion of pat-3), which can be judged by the apparent accumulation of CDT-1D. “V5QL” and “V5QR” were the only two cells still expressing CYB-1DG in the late “2-fold” stage (Figures 4C,D, Supplementary Movie S2). Based on the degradation characteristics of the two degron reporters, our Worm-FUCCI demonstrated obvious G1 and G2 phases only in two embryonic cells, “ABplapapaa” and “ABprapapaa” cells, which apparently develop with a full cycle consisting of G1, S, G2, and M phases. Ability of our degron reporters to detect G1 in V5QL/R cells but not in coelomocyte precursors indicates that G1 phase duration is not uniform and can be quite short in cells that have to wait a long time before dividing.
Accumulation dynamics of Worm-fluorescence ubiquitin cell cycle indicators during postembryonic development
The Worm-FUCCI showed accumulation dynamics not only during embryogenesis, but also during postembryonic development (Supplementary Figures S9A–D). For example, as expected, CDT-1D but not CYB-1DG was accumulated in nearly all the cells at dauer stage, indicating these cells arrested at G0 or G1 stage (Supplementary Figure S9E). Given that there is a wide spectrum of cells showing accumulation dynamics during postembryonic development, including vulva, seam cells and neurons, here we only explored on the accumulation dynamics in the germline and the intestine of larvae.
Both CDT-1D and CYB-1D or CYB-1DG demonstrated accumulation dynamics in the germline (Figure 5; Supplementary Figures S10–12). Notably, their accumulation patterns were largely non-overlapping between each other. For example, the reporter CDT-1D showed overall accumulation mostly at the pachytene stage; whereas the reporter CYB-1D showed accumulation mostly at the diplotene and diakinesis stages during oogenesis (Figure 5). The specious non-nuclear accumulation of CYB-1D in the mitotic zone and at the pachytene stage (Figure 5) apparently resulted from the autofluorescence of the tissue rather than from the CYB-1D itself. This was because that the epifluorescence signals in these regions were comparable to those in the wild-type (N2) germline (Supplementary Figure S11). Despite the lack of CYB-1DG accumulation in the mitotic zone of the germline, the reporter CYB-1D did show additional nuclear accumulation in the mitotic zone and during oogenesis (Supplementary Figure S10B,S12). The accumulation in the mitotic zone became barely detectable upon the meiotic prophase entry that extended through late pachytene, and this accumulation drop was apparently not due to a shift to cytoplasmic enrichment (Supplementary Figure S12). Therefore, despite the consistent accumulation patterns in the Soma between CYB-1D and CYB-1DG, the two reporters did show discordant accumulation patterns in the germline, making the CYB-1-based reporters unsuitable for deducing gap phase of cell cycle progression in the tissue.
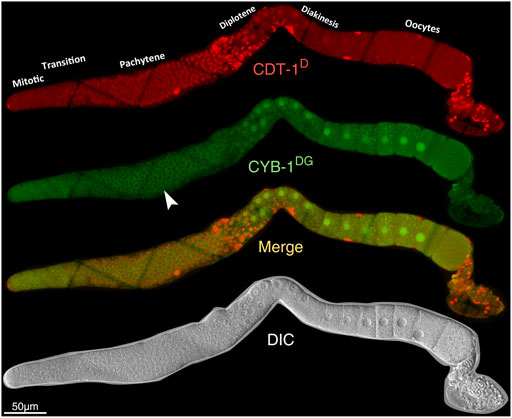
FIGURE 5. Overview of the accumulation dynamics of CDT-1D (red) or CYB-1DG (green) in adult germline. From top to bottom: Epifluorescence micrographs of CDT-1D, CYB-1DG, the merge between the two, and DIC micrograph. Specious accumulation of CYD-1DG in the cytoplasm of pachytene stage (indicated with white arrowhead) is an artifact from autofluorescence rather than the accumulation of CYD-1DG itself (see also Supplementary Figures S10,S11).
Cell cycle progression in the mitotic zone occurs rapidly, continuously, with little or no time spent on the G1 phase (Fox et al., 2011). Consistent with this, few of the cells in this region showed an accumulation of CDT-1D only, which was indicative of G1 phase. Most cells in the mitotic zone also showed an accumulation of CYB-1D (Supplementary Figure S10). Only a very small portion of cells in the region did not show accumulation of CDT-1D, and most cells also show accumulation of CYB-1D (Supplementary Figure S10). The results suggested that most of the cells were at G2 phase of cell cycle in the mitotic zone.
CDT-1D accumulation was high in the dorsal and ventral intestine cells, including int2 (referred to as “int2D” and “int2V” hereafter, respectively) and int3 (referred to as “int3D” and “int3V” hereafter, respectively), of the synchronized L1 animals 5 h after feeding (Supplementary Figure S13). The “int2D/V” cells are known to undergo DNA endoreplication while the int3D/V cells to undergo both DNA replication and division during the late L1 stage (Hedgecock and White, 1985). The accumulation patterns of Worm-FUCCI were consistent with these observations. The presence of CDT-1D only indicated that all of these cells arrested at the G1 phase during the first six hours of feeding of the starved L1 animals. Approximately 10 and 7 h after feeding, the int2 and int3 cells entered the S phase, as judged by the absence of CDT-1D. CDT-1D was observed again roughly 12 h after feeding, indicating that the cells had entered the G2 phase. For the “int2D/V” cells, which undergo endoreplication without division, we referred to the relevant cell cycle phase as the G phase rather than the G2 phase due to the endoreplication without division. For the int3D/V cells, which undergo both DNA replication and division, we referred to the period of CDT-1D re-accumulation before next round of division as G2 phase.
In summary, we generated Worm-FUCCI reporters whose accumulation dynamics faithfully indicates cell cycle progression in the Soma. Accumulation dynamics of the reporters during C. elegans embryogenesis demonstrated that only a few pairs of cells with an extended cell cycle length during the last round of division divide with a full cell cycle. The Worm-FUCCI strains constitute an invaluable resource for further study of coordination between cell cycle progression and cell fate differentiation, which has so far poorly defined in any species.
Discussion
Embryonic cell cycles are unique in that barely any gap phase is present in the early embryo of most species, including C. elegans (Edgar and McGhee, 1988; Farrell and O’Farrell, 2014). However, the precise knowledge on gap phase introduction throughout embryogenesis remains elusive in all the metazoans studies so far. Here we developed Worm-FUCCI as faithful cell cycle progression reporters in C. elegans Soma. Automated profiling of the Worm-FUCCI accumulation allowed us to produce a first ever global picture of gap phase introduction throughout metazoan embryogenesis. These reporters greatly facilitate the future study of coordination between cell cycle progression and cell fate differentiation during development.
In Drosophila melanogaster, the first 13 embryonic cell cycles before mid-blastula transition (MBT) are synchronous but with increasing cell cycle length, which was thought to be dominated by the DNA replication checkpoint (Blythe and Wieschaus, 2015). After MBT, cell cycle length is mainly dictated by the introduction of gap phase which coincides with zygotic genome activation. Unlike Drosophila embryogenesis, cell division in C. elegans is asynchronous during the first cell division. Division asymmetry in cell cycle length between sister cells becomes increasingly frequent over development. Our data suggest that the overall cell cycle length and the division asymmetries in cell cycle length are mainly dictated by the S phase duration in most cells, although a short G1 phase that is beyond of detection by our reporter could also contribute to the asymmetry. Consistent with this, CDK-4 and Cyclin D (CYD-1), which are required for the progression through G1 phase during larval muscle development (Korzelius et al., 2011), are dispensable for most embryonic divisions except the following cases, i.e., the final division of some intestinal cells, the division of coelomocyte mother cells and the division of V5Q cells (Kipreos et al., 1996; Bao et al., 2008; Budirahardja and Gonczy, 2008; Clijsters et al., 2013; Adikes et al., 2020). Division asymmetry of the first cell cycle in C. elegans involves cell cycle check point protein and asymmetric regulation of DNA replication (Brauchle et al., 2003; Benkemoun et al., 2014).
The rapid and efficient degradation of the PIP-box-containing degron, CDT-1D, in the S phase makes this reporter an effective marker in accurately defining the boundary between the G1 and S phases. However, the Worm-FUCCI does have difficult in defining boundary between the S and G2 phase. Despite the lack of an obvious Cy motif in CDT-1, the degradation pathway of PIP box is conserved between worm and human. However, same as the degradation of PIP-box-containing CDT1 in human, the CDT-1D of this study accumulates slowly from the G2 phase and peaks again in the G1 phase (Figures 1C, 3C), making it difficult in defining the boundary between S and G2 than that between G1 and S. The dynamics of CYB-1D allow it to serve as a complement to the CDT-1D in demarcating these boundaries. This is because that CYB-1D shows no accumulation in the G1 phase when the abundance of CDT-1D reaches its highest level; it starts to accumulate from the S phase and peaks in the G2 phase (Figures 3C, 4B). Therefore, the high level of CDT-1D coupled with the absence of CYB-1D is a reliable indicator of the G1 phase, and the absence of CDT-1D coupled with a relatively low level of CYB-1D is indicative of the S phase. Given that histone expression can serve as a clear indicator for the M phase, simultaneous accumulation of both reporters in the same cell can reliably indicate the G2 phase (Figure 1D). Apparently, our CDT-1D-based degradation cannot distinguish the G1 from G0 phase. Fortunately, a CDK sensor has recently been developed. The sensor consists of a fluorescently tagged CDK substrate that can steadily translocate from the nucleus to the cytoplasm in response to increasing CDK activity and consequent sensor phosphorylation, which enables distinguishing cycling cells in G1 from quiescent cells in G0 in C. elegans (Adikes et al., 2020).
Broad accumulation of the degron reporters was spatially and temporally achieved by his-72 promoter and pie-1 3′UTR, providing an advantage in systematic delineation of cell cycle progression. Nevertheless, tissue-specific or conditionally expressed reporters may be necessary in other cases to facilitate the study of cell cycle progression and fate differentiation in specific cell types, especially during postembryonic development. Another limitation of the Worm-FUCCI reporter is the temporal sensitivity. Although the degradation of CDT-1D is rapid, the degradation of CYB-1D takes about 50 min to reach the basal level (Figures 3C, 4B). Also, the CDT-1D accumulation is not fast enough to be detected due to a relatively slow maturation rate of mCherry, which may make a brief G1 phase undetectable. For example, only the two embryonic cells, “V5QL” and “V5QR,” were found to divide with a full cycle, which carry an apparent G1 phase. It remains possible that a brief gap phase with a very short duration, for example, within 10–20 min, is likely to be missed by our reporters. Consistent with this, depletion of cyd-1 that is required for cell cycle progression through G1 phase not only led to abolishment of the last round of division, but also produced a sharp increase of CDT-1D accumulation in the precursors of coelomocyte Supplementary Figure S8C,D), arguing the presence of a brief G1 phase that was missed by the reporter in the wild-type embryo. A robust quantification of Worm-FUCCI accumulation may help alleviate the problem but this is further complicated by a relatively low expression level derived from single-copy transgene. Therefore, a FUCCI reporter with a faster maturation time than the mCherry is needed to provide a better temporal resolution in deducing a short G1 phase. For example, mRFP1 is approximately 15 min faster than mCherry (Balleza et al., 2018). mNeonGreen, another fast-folding fluorescence protein has a maturation time less than 10 min (Hirano et al., 2022). However, the photobleaching and quantum yield of fluorescence protein have to be taken into consideration in prioritizing a reporter. Despite the broad expression of the reporters, we observed a slightly lower expression level of CDT-1D in some sublineages, including a few cells in the D sublineages. However, further curation of the cell lineage with an extended time point revealed a clear CDT-1D accumulation in those D sublineage cells (Supplementary Figure S1). The lack of CDT-1D accumulation in the Z2 and Z2 cells (Supplementary Figure S1) were probably due to maternal inhibition or transcriptional quiescence (Ghosh and Seydoux, 2008; Guven-Ozkan et al., 2008), or the inability of the his-72 promoter in driving zygotic expression, making it unsuitable for monitoring cell cycle progression of the two germline progenitor cells.
The broad accumulation of the Worm-FUCCI offers an opportunity to study the coordination of the cell cycle and cell fate differentiation during postembryonic development, including development of seam cells and vulva. Given that some of the postembryonic intestine cells are known to undergo endoreplication, the dynamics of the reporters in these cells also lay a foundation for mechanistic research into the regulation of endoreplication. However, the CYB-1-based reporter may not be suitable for deducing cell cycle progression in the germline due to their discordant of accumulation dynamics (Supplementary Figures S10–12).
Data availability statement
The original contributions presented in the study are included in the article/Supplementary Material, further inquiries can be directed to the corresponding author.
Author contributions
Conceptualization, ZZ, M-KW; Methodology, M-KW, XH, DX, and RL; Investigation, M-KW, VH, L-YC, YM, BH, and XR; Data Analysis, M-KW, RL, GG, and ZZ; Validation, M-KW; Resources, HY; Writing-Original Draft, M-KW, and ZZ; Writing-Review and Editing, ZZ, M-KW, VH, and HY; and Supervision, ZZ and HY.
Funding
This work is supported by the Hong Kong Research Grants Council (Project 12101522, 12101520, 12100118 and N-HKBU2018) and SKL GRF grant (2022-23) to ZZ. This work is partially supported by the Hong Kong Innovation and Technology Commission (InnoHK Project CIMDA) to HY.
Acknowledgments
We thank Dr. T Tan for logistic support and helpful discussion with the members of Z Zhao’s laboratory, Dr. Marie-Ann Felix for analysis with postembryonic expression, Dr. KWY Yuen for assistance in EdU staining and reagent and Dr. YC Tse for assistance in imaging. We also thank Mr. Khandker K. ISLAM for initiation of the project.
Conflict of interest
The authors declare that the research was conducted in the absence of any commercial or financial relationships that could be construed as a potential conflict of interest.
Publisher’s note
All claims expressed in this article are solely those of the authors and do not necessarily represent those of their affiliated organizations, or those of the publisher, the editors and the reviewers. Any product that may be evaluated in this article, or claim that may be made by its manufacturer, is not guaranteed or endorsed by the publisher.
Supplementary material
The Supplementary Material for this article can be found online at: https://www.frontiersin.org/articles/10.3389/fcell.2022.978962/full#supplementary-material
References
Adikes, R. C., Kohrman, A. Q., Martinez, M. A. Q., Palmisano, N. J., Smith, J. J., Medwig-Kinney, T. N., et al. (2020). Visualizing the metazoan proliferation-quiescence decision in vivo. Elife 9, e63265. doi:10.7554/eLife.63265
Arias, E. E., and Walter, J. C. (2007). Strength in numbers: Preventing rereplication via multiple mechanisms in eukaryotic cells. Genes Dev. 21, 497–518. doi:10.1101/gad.1508907
Bajar, B. T., Lam, A. J., Badiee, R. K., Oh, Y. H., Chu, J., Zhou, X. X., et al. (2016). Fluorescent indicators for simultaneous reporting of all four cell cycle phases. Nat. Methods 13, 993–996. doi:10.1038/nmeth.4045
Balleza, E., Kim, J. M., and Cluzel, P. (2018). Systematic characterization of maturation time of fluorescent proteins in living cells. Nat. Methods 15, 47–51. doi:10.1038/nmeth.4509
Bao, Z., Murray, J. I., Boyle, T., Ooi, S. L., Sandel, M. J., and Waterston, R. H. (2006). Automated cell lineage tracing in Caenorhabditis elegans. Proc. Natl. Acad. Sci. U. S. A. 103, 2707–2712. doi:10.1073/pnas.0511111103
Bao, Z., Zhao, Z., Boyle, T. J., Murray, J. I., and Waterston, R. H. (2008). Control of cell cycle timing during C. elegans embryogenesis. Dev. Biol. 318, 65–72. doi:10.1016/j.ydbio.2008.02.054
Benkemoun, L., Descoteaux, C., Chartier, N. T., Pintard, L., and Labbé, J.-C. (2014). PAR-4/LKB1 regulates DNA replication during asynchronous division of the early C. elegans embryo. J. Cell Biol. 205, 447–455. doi:10.1083/jcb.201312029
Blythe, S. A., and Wieschaus, E. F. (2015). Zygotic genome activation triggers the DNA replication checkpoint at the midblastula transition. Cell 160, 1169–1181. doi:10.1016/j.cell.2015.01.050
Boxem, M., and van denHeuvel, S. (2001). lin-35 Rb and cki-1 Cip/Kip cooperate in developmental regulation of G1 progression in C. elegans. Development 128, 4349–4359. doi:10.1242/dev.128.21.4349
Brauchle, M., Baumer, K., and Gonczy, P. (2003). Differential activation of the DNA replication checkpoint contributes to asynchrony of cell division in C. elegans embryos. Curr. Biol. 13, 819–827. doi:10.1016/s0960-9822(03)00295-1
Budirahardja, Y., and Gonczy, P. (2008). PLK-1 asymmetry contributes to asynchronous cell division of C. elegans embryos. Development 135, 1303–1313. doi:10.1242/dev.019075
Cao, J., Guan, G., Ho, V. W. S., Wong, M. K., Chan, L. Y., Tang, C., et al. (2020). Establishment of a morphological atlas of the Caenorhabditis elegans embryo using deep-learning-based 4D segmentation. Nat. Commun. 11, 6254. doi:10.1038/s41467-020-19863-x
Carvalho, A., Olson, S. K., Gutierrez, E., Zhang, K., Noble, L. B., Zanin, E., et al. (2011). Acute drug treatment in the early C. elegans embryo. PLoS One 6, e24656. doi:10.1371/journal.pone.0024656
Chen, L., Ho, V. W. S., Wong, M. K., Huang, X., Chan, L. Y., Ng, H. C. K., et al. (2018). Establishment of signaling interactions with cellular resolution for every cell cycle of embryogenesis. Genetics 209, 37–49. doi:10.1534/genetics.118.300820
Clijsters, L., Ogink, J., and Wolthuis, R. (2013). The spindle checkpoint, APC/CCdc20, and APC/CCdh1 play distinct roles in connecting mitosis to S phase. J. Cell Biol. 201, 1013–1026. doi:10.1083/jcb.201211019
Edgar, L. G., and McGhee, J. D. (1988). DNA synthesis and the control of embryonic gene expression in C. elegans. Cell 53, 589–599. doi:10.1016/0092-8674(88)90575-2
Farrell, J. A., and O’Farrell, P. H. (2014). From egg to gastrula: How the cell cycle is remodeled during the Drosophila mid-blastula transition. Annu. Rev. Genet. 48, 269–294. doi:10.1146/annurev-genet-111212-133531
Fay, D. S., Keenan, S., and Han, M. (2002). fzr-1 and lin-35/Rb function redundantly to control cell proliferation in C. elegans as revealed by a nonbiased synthetic screen. Genes Dev. 16, 503–517. doi:10.1101/gad.952302
Foe, V. E., and Alberts, B. M. (1983). Studies of nuclear and cytoplasmic behaviour during the five mitotic cycles that precede gastrulation in drosophila embryogenesis. J. Cell Sci. 61, 31–70. doi:10.1242/jcs.61.1.31
Fox, P. M., Vought, V. E., Hanazawa, M., Lee, M. H., Maine, E. M., and Schedl, T. (2011). Cyclin E and CDK-2 regulate proliferative cell fate and cell cycle progression in the C. elegans germline. Development 138, 2223–2234. doi:10.1242/dev.059535
Frokjaer-Jensen, C., Davis, M. W., Sarov, M., Taylor, J., Flibotte, S., LaBella, M., et al. (2014). Random and targeted transgene insertion in Caenorhabditis elegans using a modified Mos1 transposon. Nat. Methods 11, 529–534. doi:10.1038/nmeth.2889
Gettner, S. N., Kenyon, C., and Reichardt, L. F. (1995). Characterization of beta pat-3 heterodimers, a family of essential integrin receptors in C. elegans. J. Cell Biol. 129, 1127–1141. doi:10.1083/jcb.129.4.1127
Ghosh, D., and Seydoux, G. (2008). Inhibition of transcription by the Caenorhabditis elegans germline protein PIE-1: Genetic evidence for distinct mechanisms targeting initiation and elongation. Genetics 178, 235–243. doi:10.1534/genetics.107.083212
Guan, G., Fang, M., Wong, M. K., Ho, V. W. S., An, X., Tang, C., et al. (2020). Multilevel regulation of muscle-specific transcription factor hlh-1 during Caenorhabditis elegans embryogenesis. Dev. Genes Evol. 230, 265–278. doi:10.1007/s00427-020-00662-9
Guan, G., Vincy, H., Ming-Kin, W., Xiaomeng, A., Lu Yan, C., Binghui, T., et al. (2019). System-level quantification and phenotyping of early embryonic Morphogenesis of Caenorhabditis elegans. Beijing. bioRxiv, 776062. doi:10.1101/776062
Guven-Ozkan, T., Nishi, Y., Robertson, S. M., and Lin, R. (2008). Global transcriptional repression in C. elegans germline precursors by regulated sequestration of TAF-4. Cell 135, 149–160. doi:10.1016/j.cell.2008.07.040
Hedgecock, E. M., and White, J. G. (1985). Polyploid tissues in the nematode Caenorhabditis elegans. Dev. Biol. 107, 128–133. doi:10.1016/0012-1606(85)90381-1
Hirano, M., Ando, R., Shimozono, S., Sugiyama, M., Takeda, N., Kurokawa, H., et al. (2022). A highly photostable and bright green fluorescent protein. Nat. Biotechnol. 40, 1132–1142. doi:10.1038/s41587-022-01278-2
Ho, V. W. S., Wong, M. K., An, X., Guan, D., Shao, J., Ng, H. C. K., et al. (2015). Systems-level quantification of division timing reveals a common genetic architecture controlling asynchrony and fate asymmetry. Mol. Syst. Biol. 11, 814. doi:10.15252/msb.20145857
Kamath, R. S., Martinez-Campos, M., Zipperlen, P., Fraser, A. G., and Ahringer, J. (2001). Effectiveness of specific RNA-mediated interference through ingested double-stranded RNA in Caenorhabditis elegans. Genome Biol. 2, RESEARCH0002. doi:10.1186/gb-2000-2-1-research0002
Kim, Y., and Kipreos, E. T. (2007). The Caenorhabditis elegans replication licensing factor CDT-1 is targeted for degradation by the CUL-4/DDB-1 complex. Mol. Cell. Biol. 27, 1394–1406. doi:10.1128/MCB.00736-06
Kim, Y., Starostina, N. G., and Kipreos, E. T. (2008). The CRL4Cdt2 ubiquitin ligase targets the degradation of p21Cip1 to control replication licensing. Genes Dev. 22, 2507–2519. doi:10.1101/gad.1703708
Kipreos, E. T., Lander, L. E., Wing, J. P., He, W. W., and Hedgecock, E. M. (1996). cul-1 is required for cell cycle exit in C. elegans and identifies a novel gene family. Cell 85, 829–839. doi:10.1016/s0092-8674(00)81267-2
Kipreos, E. T., and van denHeuvel, S. (2019). Developmental control of the cell cycle: Insights from Caenorhabditis elegans. Genetics 211, 797–829. doi:10.1534/genetics.118.301643
Korzelius, J., The, I., Ruijtenberg, S., Prinsen, M. B. W., Portegijs, V., Middelkoop, T. C., et al. (2011). Caenorhabditis elegans cyclin D/CDK4 and cyclin E/CDK2 induce distinct cell cycle Re-entry programs in differentiated muscle cells. PLoS Genet. 7, e1002362. doi:10.1371/journal.pgen.1002362
Lee, M. T., Bonneau, A. R., and Giraldez, A. J. (2014). Zygotic genome activation during the maternal-to-zygotic transition. Annu. Rev. Cell Dev. Biol. 30, 581–613. doi:10.1146/annurev-cellbio-100913-013027
Li, X., Zhao, Q., Liao, R., Sun, P., and Wu, X. (2003). The SCF(Skp2) ubiquitin ligase complex interacts with the human replication licensing factor Cdt1 and regulates Cdt1 degradation. J. Biol. Chem. 278, 30854–30858. doi:10.1074/jbc.C300251200
Lyssenko, N. N., Hanna-Rose, W., and Schlegel, R. A. (2007). Cognate putative nuclear localization signal effects strong nuclear localization of a GFP reporter and facilitates gene expression studies in Caenorhabditis elegans. Biotechniques 43, 596 598 560. doi:10.2144/000112615
McGarry, T. J., and Kirschner, M. W. (1998). Geminin, an inhibitor of DNA replication, is degraded during mitosis. Cell 93, 1043–1053. doi:10.1016/s0092-8674(00)81209-x
Merritt, C., Rasoloson, D., Ko, D., and Seydoux, G. (2008). 3’ UTRs are the primary regulators of gene expression in the C. elegans germline. Curr. Biol. 18, 1476–1482. doi:10.1016/j.cub.2008.08.013
Murray, J. I., Bao, Z., Boyle, T. J., Boeck, M. E., Mericle, B. L., Nicholas, T. J., et al. (2008). Automated analysis of embryonic gene expression with cellular resolution in C. elegans. Nat. Methods 5, 703–709. doi:10.1038/nmeth.1228
Murray, J. I., Bao, Z., Boyle, T. J., and Waterston, R. H. (2006). The lineaging of fluorescently-labeled Caenorhabditis elegans embryos with StarryNite and AceTree. Nat. Protoc. 1, 1468–1476. doi:10.1038/nprot.2006.222
Nishitani, H., Lygerou, Z., and Nishimoto, T. (2004). Proteolysis of DNA replication licensing factor Cdt1 in S-phase is performed independently of geminin through its N-terminal region. J. Biol. Chem. 279, 30807–30816. doi:10.1074/jbc.M312644200
Ooi, S. L., Priess, J. R., and Henikoff, S. (2006). Histone H3.3 variant dynamics in the germline of Caenorhabditis elegans. PLoS Genet. 2, e97. doi:10.1371/journal.pgen.0020097
Özpolat, B. D., Handberg-Thorsager, M., Vervoort, M., and Balavoine, G. (2017). Cell lineage and cell cycling analyses of the 4d micromere using live imaging in the marine annelid Platynereis dumerilii. Elife 6, e30463. doi:10.7554/eLife.30463
Pálfy, M., Joseph, S. R., and Vastenhouw, N. L. (2017). The timing of zygotic genome activation. Curr. Opin. Genet. Dev. 43, 53–60. doi:10.1016/j.gde.2016.12.001
Pfaff, K. L., and King, R. W. (2013). Determinants of human cyclin B1 association with mitotic chromosomes. PLoS One 8, e59169. doi:10.1371/journal.pone.0059169
Rivers, D. M., Moreno, S., Abraham, M., and Ahringer, J. (2008). PAR proteins direct asymmetry of the cell cycle regulators Polo-like kinase and Cdc25. J. Cell Biol. 180, 877–885. doi:10.1083/jcb.200710018
Sakaue-Sawano, A., Hoshida, T., Yo, M., Takahashi, R., Ohtawa, K., Arai, T., et al. (2013). Visualizing developmentally programmed endoreplication in mammals using ubiquitin oscillators. Development 140, 4624–4632. doi:10.1242/dev.099226
Sakaue-Sawano, A., Kurokawa, H., Morimura, T., Hanyu, A., Hama, H., Osawa, H., et al. (2008). Visualizing spatiotemporal dynamics of multicellular cell-cycle progression. Cell 132, 487–498. doi:10.1016/j.cell.2007.12.033
Sakaue-Sawano, A., Yo, M., Komatsu, N., Hiratsuka, T., Kogure, T., Hoshida, T., et al. (2017). Genetically encoded tools for optical dissection of the mammalian cell cycle. Mol. Cell 68, 626e5–640. doi:10.1016/j.molcel.2017.10.001
Seydoux, G., and Dunn, M. A. (1997). Transcriptionally repressed germ cells lack a subpopulation of phosphorylated RNA polymerase II in early embryos of Caenorhabditis elegans and Drosophila melanogaster. Development 124, 2191–2201. doi:10.1242/dev.124.11.2191
Shao, J., He, K., Wang, H., Ho, W. S., Ren, X., An, X., et al. (2013). Collaborative regulation of development but independent control of metabolism by two epidermis-specific transcription factors in Caenorhabditis elegans. J. Biol. Chem. 288, 33411–33426. doi:10.1074/jbc.M113.487975
Sulston, J. E., Schierenberg, E., White, J. G., and Thomson, J. N. (1983). The embryonic cell lineage of the nematode Caenorhabditis elegans. Dev. Biol. 100, 64–119. doi:10.1016/0012-1606(83)90201-4
Tarailo, M., Kitagawa, R., and Rose, A. M. (2007). Suppressors of spindle checkpoint defect (such) mutants identify new mdf-1/MAD1 interactors in Caenorhabditis elegans. Genetics 175, 1665–1679. doi:10.1534/genetics.106.067918
The, I., Ruijtenberg, S., Bouchet, B. P., Cristobal, A., Prinsen, M. B. W., van Mourik, T., et al. (2015). Rb and FZR1/Cdh1 determine CDK4/6-cyclin D requirement in C. elegans and human cancer cells. Nat. Commun. 6, 5906. doi:10.1038/ncomms6906
vanRijnberk, L. M., van derHorst, S. E. M., van denHeuvel, S., and Ruijtenberg, S. (2017). A dual transcriptional reporter and CDK-activity sensor marks cell cycle entry and progression in C. elegans. PLoS One 12, e0171600. doi:10.1371/journal.pone.0171600
Wang, R., Kaul, Z., Ambardekar, C., Yamamoto, T. G., Kavdia, K., Kodali, K., et al. (2013). HECT-E3 ligase ETC-1 regulates securin and cyclin B1 cytoplasmic abundance to promote timely anaphase during meiosis in C. elegans. Development 140, 2149–2159. doi:10.1242/dev.090688
Yanagi, K., Mizuno, T., Tsuyama, T., Tada, S., Iida, Y., Sugimoto, A., et al. (2005). Caenorhabditis elegans geminin homologue participates in cell cycle regulation and germ line development. J. Biol. Chem. 280, 19689–19694. doi:10.1074/jbc.C500070200
Yanowitz, J., and Fire, A. (2005). Cyclin D involvement demarcates a late transition in C. elegans embryogenesis. Dev. Biol. 279, 244–251. doi:10.1016/j.ydbio.2004.12.022
Zhao, Z., Boyle, T. J., Liu, Z., Murray, J. I., Wood, W. B., and Waterston, R. H. (2010). A negative regulatory loop between microRNA and Hox gene controls posterior identities in Caenorhabditis elegans. PLoS Genet. 6, e1001089. doi:10.1371/journal.pgen.1001089
Zhao, Z., Flibotte, S., Murray, J. I., Blick, D., Boyle, T. J., Gupta, B., et al. (2010). New tools for investigating the comparative biology of Caenorhabditis briggsae and C. elegans. Genetics 184, 853–863. doi:10.1534/genetics.109.110270
Zhong, W., Feng, H., Santiago, F. E., and Kipreos, E. T. (2003). CUL-4 ubiquitin ligase maintains genome stability by restraining DNA-replication licensing. Nature 423, 885–889. doi:10.1038/nature01747
Zielke, N., Korzelius, J., van Straaten, M., Bender, K., Schuhknecht, G. F. P., Dutta, D., et al. (2014). Fly-FUCCI: A versatile tool for studying cell proliferation in complex tissues. Cell Rep. 7, 588–598. doi:10.1016/j.celrep.2014.03.020
Keywords: FUCCI, cell cycle phase, embryogenesis, C. elegans, cell lineage
Citation: Wong M-K, Ho VWS, Huang X, Chan L-Y, Xie D, Li R, Ren X, Guan G, Ma Y, Hu B, Yan H and Zhao Z (2022) Initial characterization of gap phase introduction in every cell cycle of C. elegans embryogenesis. Front. Cell Dev. Biol. 10:978962. doi: 10.3389/fcell.2022.978962
Received: 27 June 2022; Accepted: 20 September 2022;
Published: 25 October 2022.
Edited by:
Silvia Garagna, University of Pavia, ItalyReviewed by:
Yuichiro Nakajima, The University of Tokyo, JapanMike Boxem, Utrecht University, Netherlands
Copyright © 2022 Wong, Ho, Huang, Chan, Xie, Li, Ren, Guan, Ma, Hu, Yan and Zhao. This is an open-access article distributed under the terms of the Creative Commons Attribution License (CC BY). The use, distribution or reproduction in other forums is permitted, provided the original author(s) and the copyright owner(s) are credited and that the original publication in this journal is cited, in accordance with accepted academic practice. No use, distribution or reproduction is permitted which does not comply with these terms.
*Correspondence: Zhongying Zhao, enl6aGFvQGhrYnUuZWR1Lmhr
†These authors share first authorship