
94% of researchers rate our articles as excellent or good
Learn more about the work of our research integrity team to safeguard the quality of each article we publish.
Find out more
ORIGINAL RESEARCH article
Front. Cell Dev. Biol., 23 August 2022
Sec. Cellular Biochemistry
Volume 10 - 2022 | https://doi.org/10.3389/fcell.2022.948331
 Zicong Shang†Lin Yang†Ziwu Wang†Yu TianYanjing GaoZihao SuRongliang GuoWeiwei LiGuoping LiuXiaosu Li
 Zhengang Yang
 Zhenmeiyu Li*
 Zhuangzhi Zhang*
The striatum is primarily composed of two types of medium spiny neurons (MSNs) expressing either D1- or D2-type dopamine receptors. However, the fate determination of these two types of neurons is not fully understood. Here, we found that D1 MSNs undergo fate switching to D2 MSNs in the absence of Zfp503. Furthermore, scRNA-seq revealed that the transcription factor Zfp503 affects the differentiation of these progenitor cells in the lateral ganglionic eminence (LGE). More importantly, we found that the transcription factors Sp8/9, which are required for the differentiation of D2 MSNs, are repressed by Zfp503. Finally, sustained Zfp503 expression in LGE progenitor cells promoted the D1 MSN identity and repressed the D2 MSN identity. Overall, our findings indicated that Zfp503 promotes the D1 MSN identity and represses the D2 MSN identity by regulating Sp8/9 expression during striatal MSN development.
The striatum, the major component of the basal ganglia, consists of the caudate and putamen in humans. The majority of striatal neurons are medium-sized spiny neurons (MSNs), which can be further divided into two cell types: one cell type that expresses the dopamine receptor DRD1 (D1 MSNs) and another cell type that expresses the dopamine receptor DRD2 (D2 MSNs). D1 MSNs directly project to the substantia nigra pars reticulata to form the direct pathway, whereas D2 MSNs give rise to the indirect pathway, which projects to the external part of the globus pallidus (Gerfen et al., 1990; Kawaguchi et al., 1995; Gerfen and Surmeier, 2011). Although a subset of MSNs co-express DRD1 and DRD2 receptors, the proportion of these neurons is very small, especially in dorsal striatum (Gerfen et al., 1990; Bertran-Gonzalez et al., 2008). Dysfunction of the striatum is closely associated with multiple neuropsychiatric diseases, including Huntington’s disease (HD), Parkinson’s disease (PD), schizophrenia and obsessive-compulsive disorder/attention deficit hyperactivity disorder (DeLong, 1990; Wichmann and DeLong, 1996; Gerfen and Surmeier, 2011). The diversity of striatal function is critically dependent on the normal development of MSNs at the embryonic stage. Previous studies have shown that the lateral ganglionic eminence (LGE), the primordium of the striatum, contains two distinct regions: a dorsal region (dLGE) and a ventral region (vLGE). The dLGE generates most interneurons of the olfactory bulb. In contrast, the vLGE mainly gives rise to striatal MSNs (Olsson et al., 1995; Anderson et al., 1997; Yun et al., 2001; Stenman et al., 2003; Waclaw et al., 2006; Wen et al., 2021). Initially, the transcription factors (TFs) Gsx1/2, Ascl1, Dlx1/2 and Meis2 control the differentiation of progenitors into immature MSNs (Anderson et al., 1997; Yun et al., 2003; Long et al., 2009; Waclaw et al., 2009; Wang et al., 2009; Pei et al., 2011; Wang et al., 2013; Chapman et al., 2018; Su et al., 2022). Although D1 MSNs and D2 MSNs share many properties, they specifically express different molecules to fate acquisition (Lobo et al., 2006; Gokce et al., 2016; Stanley et al., 2019; Puighermanal et al., 2020). Our previous studies showed that the TFs Sp8/9 and Six3 are specifically required for the differentiation of most D2 MSNs (Zhang et al., 2016; Xu et al., 2018; Song et al., 2021). Although many studies have reported that some TFs control the differentiation of subpopulation of the D1 MSNs, such as Zfhx3, Ebf1, Isl1 and Foxo1 (Garel et al., 1999; Lobo et al., 2008; Ehrman et al., 2013; Lu et al., 2014; Waclaw et al., 2017; Zhang et al., 2019), the TFs that specifically guide the differentiation of most D1 MSNs still need to be further explored. To date, two studies have indicated that the transcription factor Zfp503 is required for the differentiation of the most D1 MSNs (Chen et al., 2020; Soleilhavoup et al., 2020). However, the mechanism involved in these processes is still largely unknown.
Here we investigated the role of Zfp503 in the development of striatal MSNs. Zfp503 is specifically expressed in most striatal MSNs at later stages of striatal development. We used Sp9-Cre and Dlx2-Cre to knock out Zfp503 expression in the ganglionic eminences (GEs) and found switching of D1 MSNs to D2 MSNs in Zfp503 conditional knockout (Zfp503-CKO) mice. Furthermore, our scRNA-seq revealed that D1 MSNs mature faster (at E14.5) than D2 MSNs. At the cell population level, we found that progenitor cells and D2 MSNs were increased but D1 MSNs were significantly decreased in the LGE of Zfp503-CKO mice. Finally, we found that the TFs Sp8/9 were significantly increased in the LGE of Zfp503-CKO mice. Zfp503 gain of function experiments showed promotion of the D1 MSN identity and repression of the D2 MSN identity. Taken together, our findings suggest that the TF Zfp503 promotes D1 MSN cell identity and represses D2 MSN cell identity by regulating Sp8/9 expression during striatal development.
Previously, we and others reported that Zfp503 is highly expressed in the LGE (Chang et al., 2004; Ko et al., 2013; Su et al., 2022), but the temporal expression of Zfp503 during striatal development is not fully understood. Firstly, we performed double immunostaining of ZFP503 with the pan-striatal MSN marker BCL11B at E14.5 and E18.5 (Figures 1A,B). Our results showed that approximately 90% of BCL11B positive cells are ZFP503/BCL11B double-positive cells in the subventricular zone (SVZ), but the percentage was decreased to 70% in the mantle zone (MZ) at E14.5 (Figure 1C). Interestingly, nearly all BCL11B-positive cells were co-labelled with ZFP503 in the SVZ/MZ at E18.5 (Figures 1B,C). Next, we performed immunostaining in the developing mouse brain with the ZFP503 antibody. The expression of ZFP503 was detected in the LGE (striatal primordia) at E12.5 and E14.5 (Supplementary Figures S1A,B). A similar expression of ZFP503 was also observed in the LGE at E16.5 (Supplementary Figure S1C). At perinatal period, ZFP503 was present in the entire striatum, including the caudoputamen (CP), nucleus accumbens (NAc) and olfactory tubercle (OT) (Supplementary Figures S1D,E). These results indicated that Zfp503 is highly expressed in the LGE during striatal MSN development.
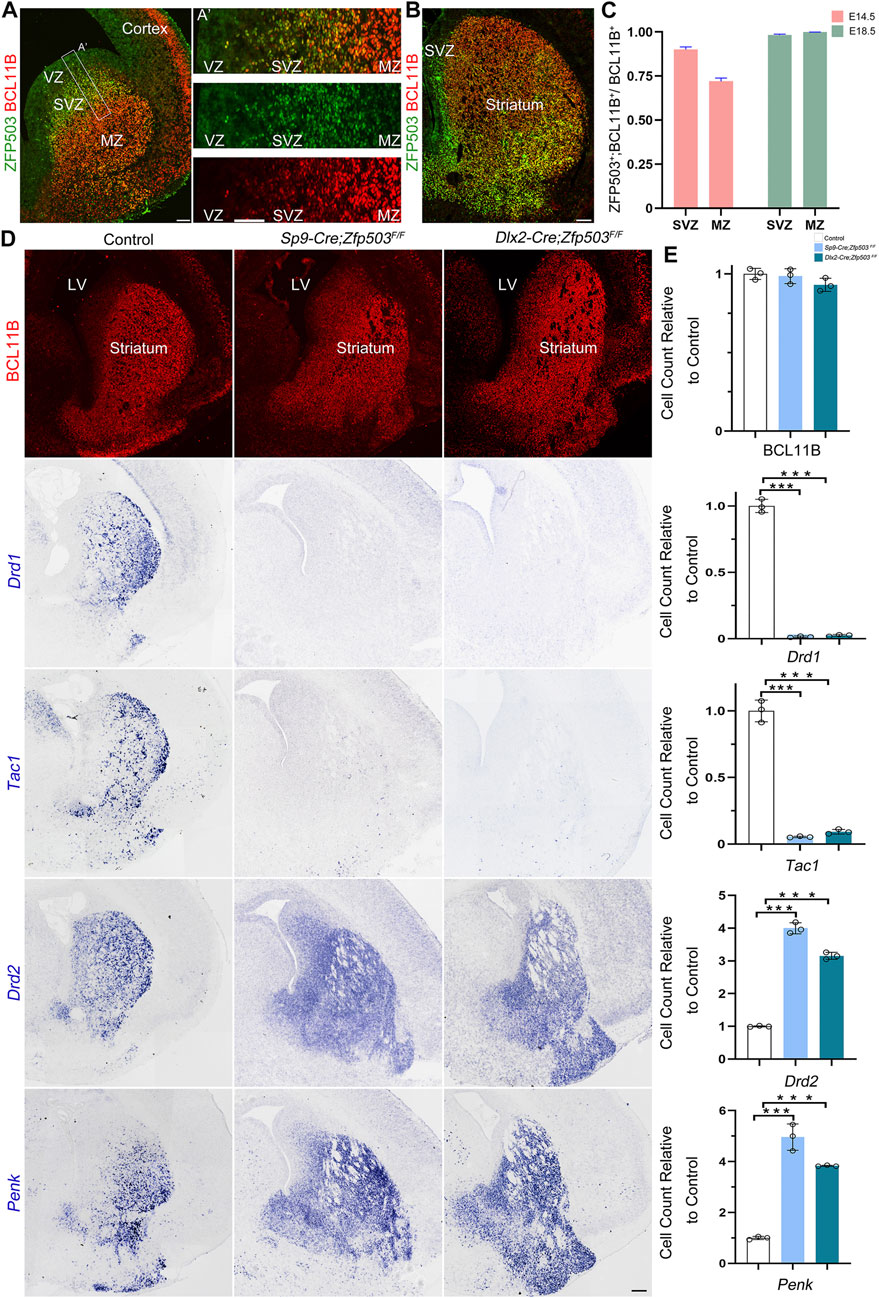
FIGURE 1. Fate switching of D1 MSNs into D2 MSNs in Zfp503-CKO mice. (A) ZFP503/BCL11B double-immunostained coronal hemisection at E14.5. (A') High magnification images of the boxed region in (A). (B) ZFP503/BCL11B double-immunostained coronal hemisection at E18.5. (C) Quantification showing that most of the ZFP503-positive cells in the LGE were colabelled with BCL11B at E14.5 and E18.5. (D) BCL11B-positive cells, which represent the vast majority of striatal MSNs, were similar between Zfp503-CKO mice and control mice. Drd1 and Tac1 expression was significantly decreased whereas Drd2 and Penk expression was markedly increased in the LGE at E18.5 in the Zfp503-CKO mice compared to the controls. (E) The quantification data of the (D). (one-way ANOVA followed by Tukey–Kramer post-hoc test, ***P < 0.001, n = 3, mean ± SEM). Abbreviations: lateral ventricle (LV), mantle zone (MZ), ventricular zone (VZ), subventricular zone (SVZ). Scale bars: 100 µm in A; 100 µm in A’; 200 µm in (D).
To examine the role of Zfp503 in regulating the fate of MSNs, we used two Cre lines (Sp9-Cre and Dlx2-Cre) to delete the expression of Zfp503 in the basal ganglia. The phenotype of the Zfp503 mutant mice was analyzed at E18.5. We found that there was no significant difference in BCL11B expression between control mice and Zfp503-CKO mice (Figures 1D,E). These results were further confirmed by our RNA-seq data (Supplementary Table 1) and were consistent with previous research (Chen et al., 2020). Drd1 and Tac1, which are specifically expressed in D1 MSNs were dramatically decreased in the striatum of Zfp503-CKO mice compared to controls. In contrast, Drd2 and Penk, which are specifically expressed in D2 MSNs, were markedly increased in Zfp503-CKO mice (Figures 1D,E). Next, we analysed the phenotype of the Sp9-Cre; Zfp503F/F (Zfp503-SCKO) mice at the transcriptional level. RNA-seq of the entire LGE was performed at E18.5. Again, our results showed that D1 MSN marker genes (Drd1, Tac1, Isl1, Sox8, and Pdyn) were significantly decreased. In contrast, D2 MSN marker genes (Drd2, Penk, Six3, Grik3, and Gucy1a3) were significantly increased (Supplementary Table 1). Taken together, our results indicated that striatal D1 MSNs are converted into D2 MSNs in the absence of Zfp503.
To investigate the mechanism by which Zfp503 control fate switching between D1 and D2 MSNs, scRNA-seq experiments were performed to analyze LGE progenitors undergoing fate switching (Figure 2A). LGE samples from E14.5 Zfp503-DCKO (Dlx2-Cre; Zfp503F/F, n = 3) mice were dissected, dissociated into single-cell suspensions, and sequenced using the 10X genomics platform. We also used the published scRNA-seq data (Li et al., 2022) of the wild type (WT) LGE at E14.5 from our lab. After removing outlier cells that had a high percentage of ribosomal or mitochondrial genes, 14,001 cells in the WT samples and 12,225 cells in the Zfp503-DCKO samples were used for analysis, with an average of 2,107 genes detected per cell (Figure 2B). Our initial clustering analysis revealed 16 (C0-C15) major cell populations with distinct gene expression patterns (Figure 2B; Supplementary Table 2). We used marker genes to define the identities of the 16 clusters more precisely, which resulted in eight discrete populations: RGs, APs, BPs, IPs, Pre-MSNs, imm-D1 MSNs, D1 MSNs, and D2 MSNs (Figure 2C; Supplementary Table 2). According to analysis of marker genes, we determined the identity of the remaining cell clusters: C7: striatal interneurons (Lhx6, Lhx8, Sst, and Npy); C9: cortical projection neurons (Neurod6, Tbr1 and Cux2); C10: intercalated cells (Zic1 and Resp18); C11: ependymal cells (S100a11, Anxa2 and Cryab); C12: endothelial cells (Cdh5 and Cd34); C13: blood cells (Alas2); C14: microglial cells (Bcl2a1b, P2ry12 and Trem2); and C15: oligodendrocyte cells (Olig1/2 and Sox10).
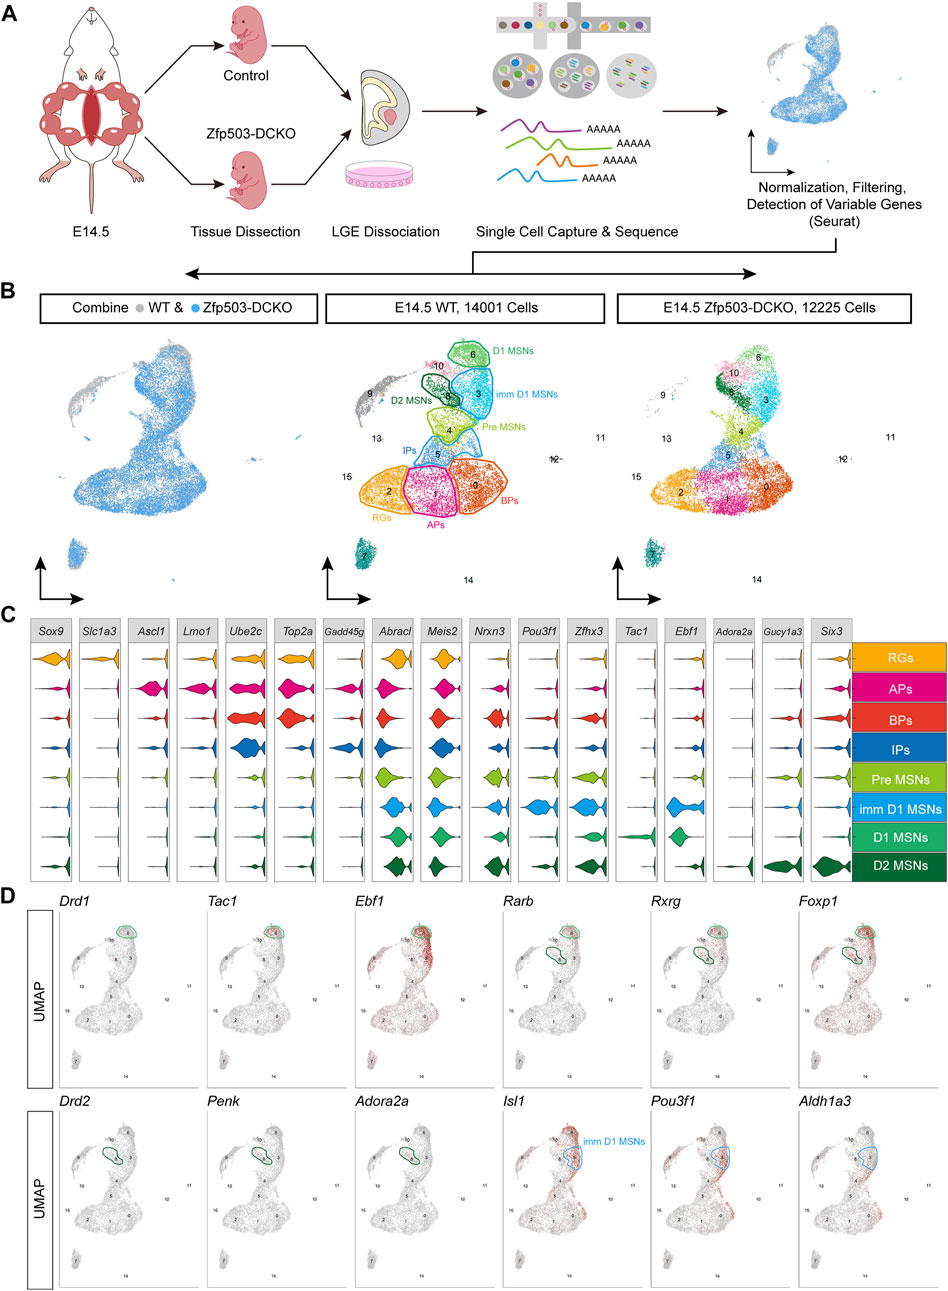
FIGURE 2. The maturation of D1 MSNs occurs earlier than that of D2 MSNs. (A) Workflow of scRNA-seq of LEG samples at E14.5. LGE tissues were dissected from embryos and dissociated into single-cell suspensions. Single cells were captured into droplets with the 10x platform. After sequencing, cells were classified by their transcriptomes. (B) UMAP showing 16 clusters (C0–C15); the major cell types are annotated in both the WT sample and the Dlx2-Cre; Zfp503F/F (Zfp503-DCKO) sample. (C) Violin plot showing cluster annotations, cell type assignments (y-axis) and the expression of 17 marker genes (x-axis). (D) Feature plots of the 12 marker genes in 16 different cell types in the WT sample. Abbreviations: Radial glia cells (RGs); apical progenitors (APs); basal progenitors (BPs); intermediate progenitors (IPs); premature MSNs (Pre-MSNs); immature D1 MSNs (Imm-D1 MSNs).
Next, we systematically characterized the gene features of the D1 and D2 MSNs. To date, the generation sequence of D1 and D2 MSNs during striatal development is not fully understood. Interestingly, we found very low expression levels of Drd1 and Drd2 suggesting that the D1 and D2 MSNs were not fully matured at E14.5 (Figure 2D). However, D1 MSN marker genes (Tac1 and Ebf1) were highly expressed. In contrast, D2 MSN marker genes (Penk and Adora2a) were weakly expressed (Figure 2D). Furthermore, the pan-striatal MSN markers (Rarb, Rxrg and Foxp1) were highly expressed in D1 MSNs (C6) but not in D2 MSNs (C8) (Figure 2D). These results indicated that D1 MSN maturation seems faster than D2 MSN maturation. Recent studies indicated that Isl1, Zfhx3 and Zfp503 are expressed in the immature D1 MSNs (Ko et al., 2013; Zhang et al., 2019; Song et al., 2021; Ehrman et al., 2022; Li et al., 2022). Interestingly, we found that Pou3f1 and Aldh1a3 are specifically expressed in immature D1 MSNs (C3). Recently studies (Bocchi et al., 2022; Su-Feher et al., 2022) reported that Pou3f1 and Aldh1a3 are enriched in immature D1 MSNs. Thus, our findings and previous studies suggested that Pou3f1 and Aldh1a3 represent new markers for immature D1 MSNs.
Next, we explored the mechanism underlying fate switching between D1 MSNs and D2 MSNs in Zfp503-DCKO (Dlx2-Cre; Zfp503F/F) mice. Thus, we focused our further analysis on the major cell types in the LGE at E14.5 (Figure 3A). The radial glia cells (RGs) that expressed Aldh1l1 and Aldoc were not significantly altered between Zfp503-DCKO mice and WT mice (Figures 3B,C,L). Sox2 is highly expressed in the progenitors of the LGE and downregulated in immature neurons. Surprisingly, our results showed that Sox2 expression was upregulated in most cell types, especially in immature MSNs in Zfp503-DCKO mice (Figures 3D,L). Recent studies reported that Ascl1 and Vax1 are highly expressed in basal progenitors (BPs) (Li et al., 2021; Wen et al., 2021; Bocchi et al., 2022), and a study showed that Gadd45g is a direct downstream target of Ascl1 (Huang et al., 2010). These genes were increased in the Zfp503-DCKO mice (Figures 3E–G,L). We also found that the proliferating cells expressing Ki67 (Mki67) and Top2a were increased in the Zfp503-DCKO mice compared to the WT mice (Figures 3H,I,L). Finally, our results showed that Dlx2 and its direct downstream target Gad2 were increased in MSNs (Figures 3J–L). In addition, we performed immunostaining of the progenitor cell markers, including PCNA, ASCL1 and KI67 at E14.5 to further support our findings. Our results showed that the number of the PCNA-, ASCL1-, and KI67-positive cells are increased in the Zfp503-DCKO mice compared to control mice (Supplementary Figures S2A–I). Taken together, these findings indicated that the differentiation of progenitors is blocked in Zfp503-DCKO mice.
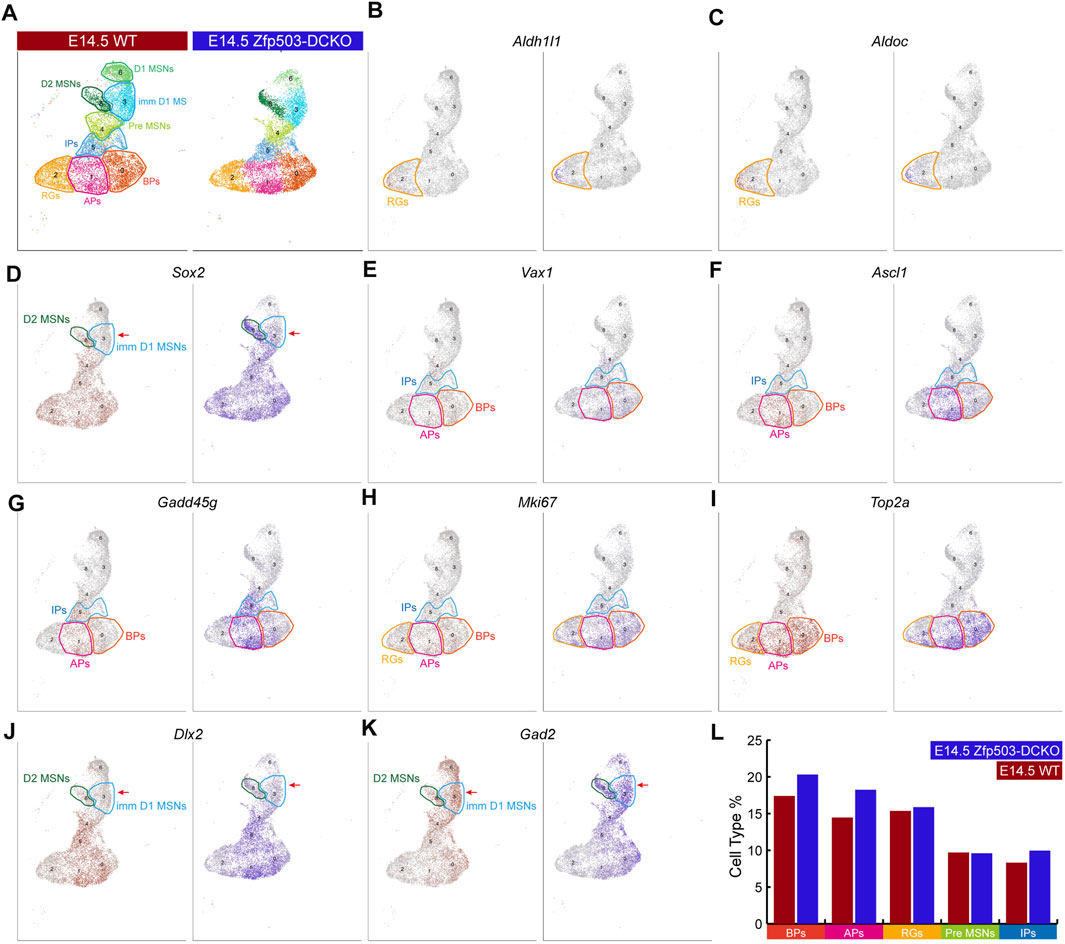
FIGURE 3. Zfp503 regulates the differentiation of progenitor cells. (A) The major cell populations of the LGE at E14.5. (B–C) There were no significant differences in the expression of Aldh1l1 and Aldoc between WT and Zfp503-DCKO mice. (D–K) The expression of Sox2, Vax1, Ascl1, Gadd45g, Mki67, Top2a, Dlx2, and Gad2 was increased in the Zfp503-mutant sample compared to the WT sample. (L) The percentages of BPs, APs, and IPs were increased but the percentages of RGs and Pre-MSNs were not altered in the Zfp503-DCKO sample compared to the WT sample. Abbreviations: radial glia cells (RGs); apical progenitors (Aps); basal progenitors (BPs); intermediate progenitors (IPs); premature MSNs (Pre-MSNs); immature D1 MSNs (Imm D1 MSNs).
To further confirm our results regarding D1 and D2 MSN identity at the cell population level, we begin to analyze D1 and D2 MSN clusters in our scRNA-seq data. Previous work and our studies showed that Pou3f1, Isl1 and Zfhx3 are expressed in immature D1 MSNs (Ehrman et al., 2013; Lu et al., 2014; Zhang et al., 2019). We found that the expression of these genes in the immature D1 MSN cluster was not significantly changed between WT mice and Zfp503-DCKO mice (Figures 4A–C,O). However, Ebf1, Ikzf1, Tac1, Rarb, and Foxp2, which were highly expressed in D1 MSNs were reduced in the D1 MSN cluster of Zfp503-DCKO mice compared to WT mice (Figures 4D–H,O). Our previous studies showed that the TFs Sp9 and Six3 are required for the differentiation of D2 MSNs (Zhang et al., 2016; Xu et al., 2018; Song et al., 2021). In the absence of Zfp503, these genes were upregulated in D2 MSNs (Figures 4I,J). Furthermore, Tle4 and Gucy1a3 tend to be expressed in D2 MSNs, and our results showed that these genes were upregulated in D2 MSNs and immature D1 MSNs in Zfp503-DCKO mice (Figures 4K–L). In addition, the specific D2 MSN markers Penk and Adora2a were upregulated in Zfp503-DCKO mice compared to WT mice (Figures 4M–O). Again, our findings indicated that D1 MSNs undergo fate switching into D2 MSNs at the cell population level in Zfp503-DCKO mice.
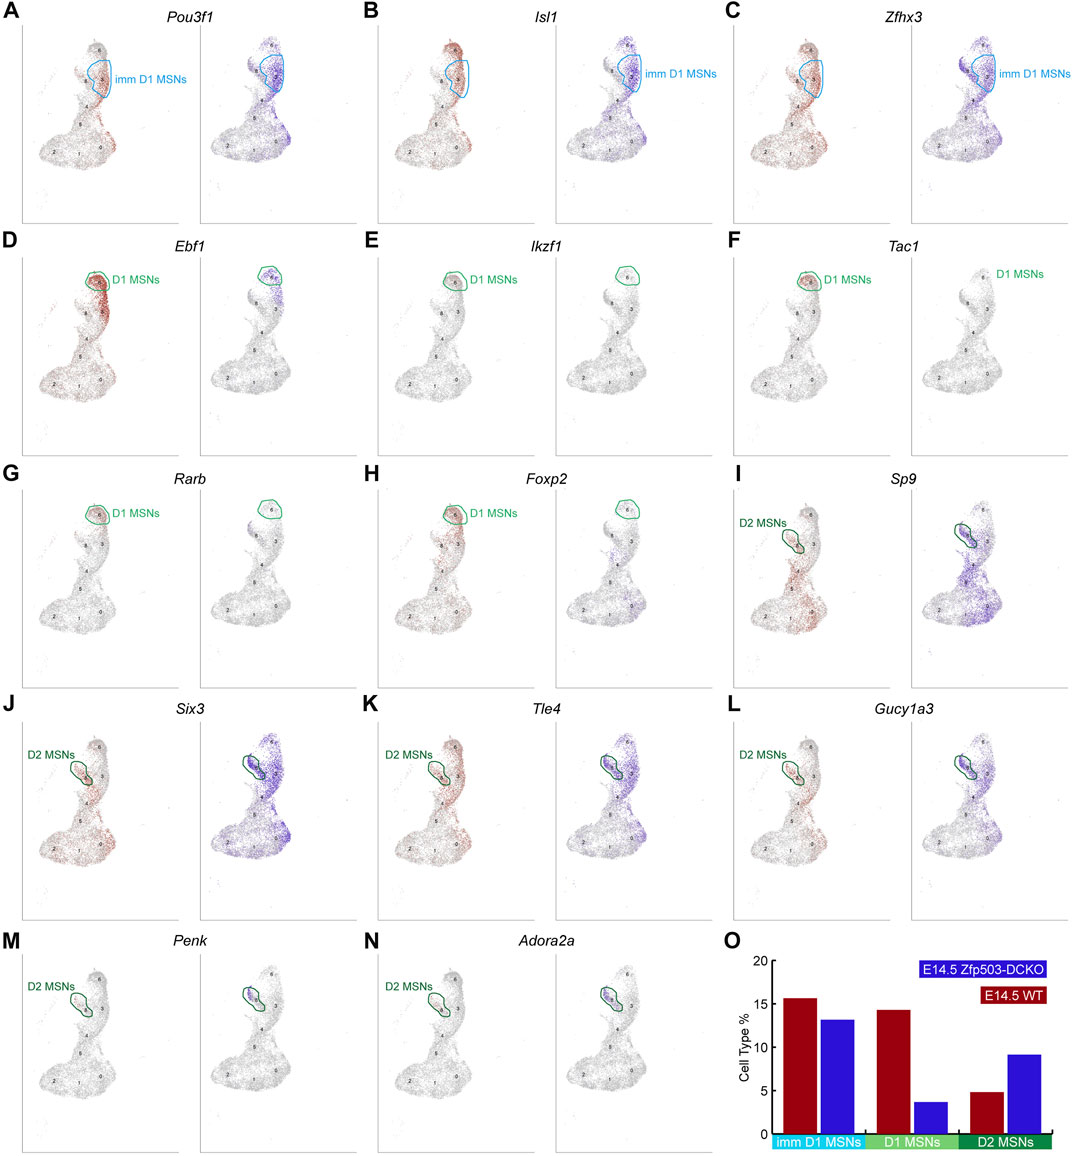
FIGURE 4. scRNA-seq reveals that Zfp503 promotes the D1 MSN identity and represses the D2 MSN identity. (A-C) There were no significant changes in the expression of immature D1 MSN markers, including Pou3f1, Isl1, and Zfhx3, between Zfp503-DCKO mice and WT mice. (D-H) The expression of Ebf1, Ikzf1, Tac1, Rarb, and Foxp2 was decreased in Zfp503-DCKO mice. (I-N) The expression of Sp9, Six3, Tle4, Gucy1a3, Penk, and Adora2a was increased in Zfp503-DCKO mice compared to WT mice. (O) The cell types percentage in Zfp503-DCKO mice and WT mice.
To gain insights into the mechanism by which Zfp503 regulates the fate switching of striatal MSNs, we performed immunostaining at E16.5 and E18.5. Previous studies reported that TF Sox2 was mainly expressed in the neural precursor cells and regulated multiple aspects of telencephalic development (Cimadamore et al., 2013; Feng et al., 2013; Feng and Wen, 2015). Our previous studies demonstrated that the TFs Sp8/9 and Six3 are required for the differentiation of D2 MSNs (Zhang et al., 2016; Xu et al., 2018; Song et al., 2021). Here, we found that SOX2 expression was significantly upregulated in the whole striatum at E16.5 and E18.5 in Zfp503-CKO mice compared to controls (Figures 5A–D, 6A–D). Considering that striatal MSNs express relatively mature markers, such as Drd2 and Penk (Figure 1D), we speculate that the striatal MSNs is not well differentiated due to blockade of differentiation at the progenitor stage. Moreover, our results showed that the TFs Sp8/9 were dramatically increased in the striatum at E16.5 and E18.5 in the Zfp503-CKO mice compared to controls (Figures 5E–L, 6E–L). Interestingly, Sp8 expression was significantly increased at E16.5 (Figures 5I–L) and E14.5 (data not shown) in both Cre lines, but the expression of Sp8 was not altered at E18.5 in the Dlx2-Cre line (Figures 6I–L). Due to the Dlx2-Cre deleted Zfp503 expression mainly in LGE radial glial cells and the Sp9-Cre deleted Zfp503 expression mainly in progenitors which were located in the LGE SVZ. Therefore, we speculate that Zfp503 may exert its function in radial glial cells. It may be that Zfp503 promotes cell cycle exit of radial glial cells, which leads to Sp8 expression showing the different phenotypes at different time points. In addition, Six3, a direct downstream target of Sp8/9 was significantly increased in Zfp503-CKO mice at E16.5 and E18.5 (Figures 5M–P, 6M–P). Taken together, these findings suggest that Zfp503 represses the D2 MSN identity by repressing the expression of Sp8/9.

FIGURE 5. Abnormal expression of precursor marker genes in Zfp503-CKO mice at E16.5. (A–D) The expression of SOX2 was increased in the entire striatum of Zfp503-CKO mice at E16.5. (E–L) The transcription factors Sp8 and Sp9 were increased in the striatum of Zfp503-CKO mice at E16.5. (M–P) Six3 expression was present in the whole striatum in Zfp503-CKO mice, but not in control mice. One-way ANOVA followed by the Tukey–Kramer post hoc test, ***P < 0.001, n = 3, mean ± SEM. Scale bar: 200 µm in O for (A–O).

FIGURE 6. Abnormal expression of precursor marker genes in the striatum of Zfp503-CKO mice at E18.5. (A–D) The expression of SOX2 was increased in the entire striatum of Zfp503 mutants at E18.5. (E–L) The transcription factors Sp8 and Sp9 were increased in the striatum of Zfp503-CKO mice at E18.5. (M–P) Six3 expression was present in the whole striatum in Zfp503-CKO mice, but not in control mice. Abbreviations: lateral ventricle (LV). One-way ANOVA followed by Tukey–Kramer post hoc test, ***P < 0.001, n = 3, mean ± SEM. Scale bar: 200 µm in O for (A–O).
In addition to investigating the effects of Zfp503 loss-of-function, we also explored the effects of Zfp503 gain-of-function in striatal MSNs. First, we generated a Zfp503 overexpression allele (Zfp503-OE). A CAG promoter followed by a Zfp503 CDS and three HA-tag sequences was inserted into the Rosa-26 site with the CRISPR/Cas9 strategy (Figure 7A). Then, we crossed Zfp503-OE mice with Dlx2-Cre mice to obtain Zfp503 overexpressing mice (Dlx2-Cre; Zfp503-OE). Dlx2-Cre; Zfp503-OE embryos showed robust Ha-tag signals in Dlx2-expressing regions along the dorso-ventral (DV) axis, including the septum, striatum, and cortex interneuron (Figure 7B). To study the function of Zfp503 in regulating the cell identity of striatal MSNs, we used in situ hybridization to detect the expression of D1 MSN and D2 MSN markers. Consistent with our expectations, the expression of Isl1, Tac1, and Ebf1 was increased in the Zfp503 overexpressing mice (Figures 7C–E,H). In contrast, TFs Sp9 and Six3, which control the differentiation of D2 MSNs were reduced in Zfp503 overexpressing mice compared to control mice (Figures 7F–H). In addition, the RNA-seq data showed that the D1 MSN identity was enhanced and the D2 MSN identity was compromised in the Dlx5/6-Cre; Zfp503-OE mice compared to the control mice (Supplementary Table 3). Overall, our findings suggested that Zfp503 promotes the D1 MSN identity and represses the D2 MSN identity.
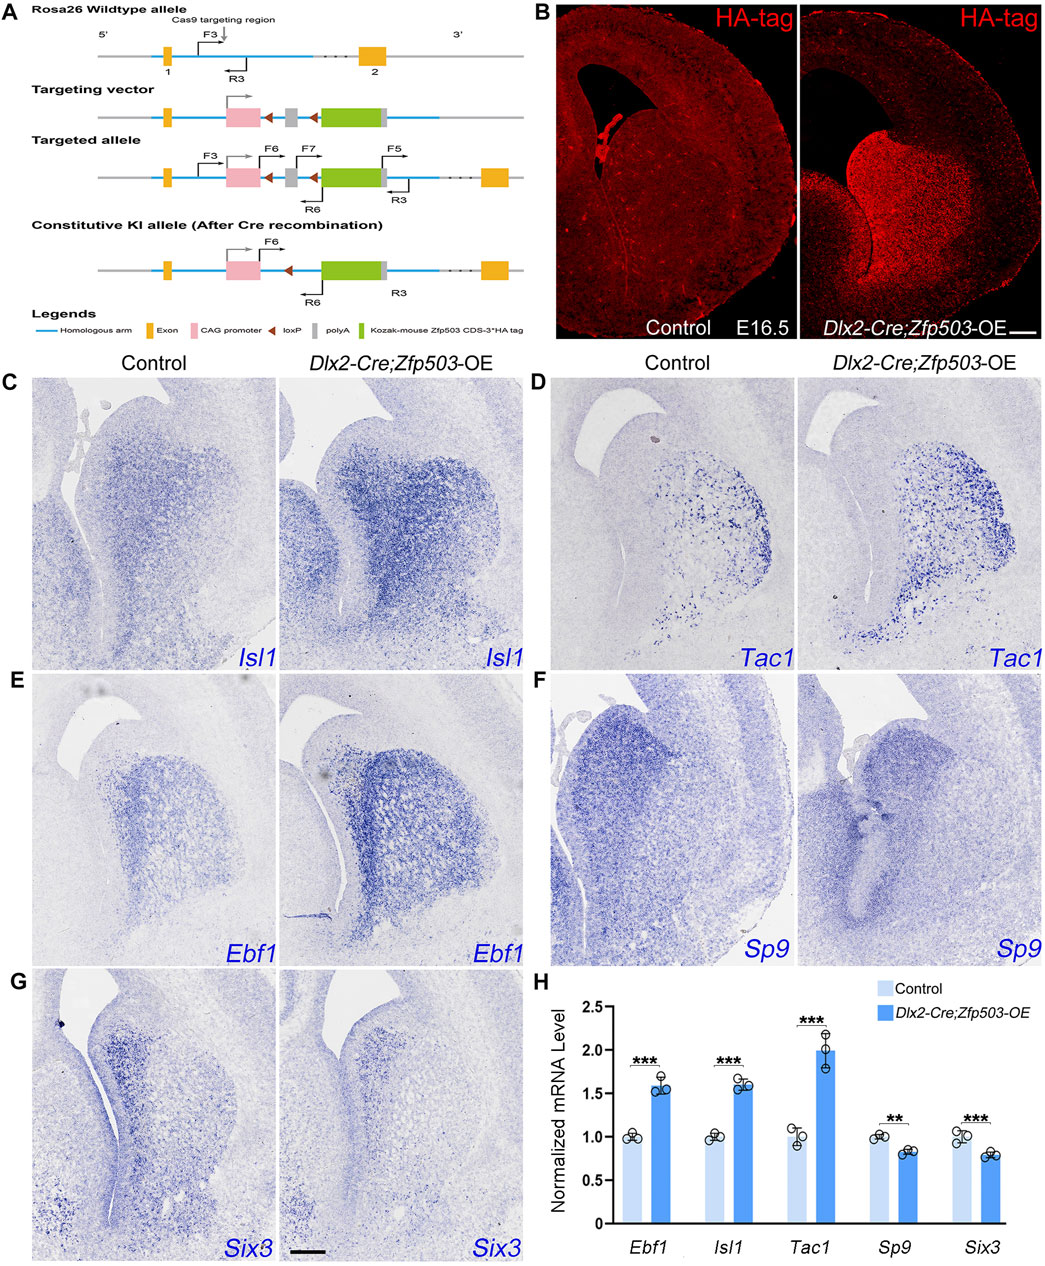
FIGURE 7. The D1 MSN identity is enhanced and the D2 MSN identity is compromised in Zfp503-overexpressing mice. (A) Generation of the Zfp503 overexpression allele. A CAG promoter followed by a Zfp503 CDS and three HA‐tag sequences was inserted into the Rosa-26 site with the CRISPR/Cas9 strategy. (B) HA-tag was expressed in the septum, striatum and cortical interneurons, which is consistent with the Dlx2 expression in the forebrains. (C–E) The expression of Isl1, Tac1, and Ebf1, which are specifically expressed in D1 MSNs, was increased in Dlx2-Cre; Zfp503-OE mice at E16.5 compared to controls. (F–G) The expression of the TFs Sp9 and Six3 was reduced in Dlx2-Cre; Zfp503-OE mice compared to controls. (H) Histogram shows quantification data of the above markers in the Dlx2-Cre; Zfp503-OE, and control mice at E16.5 (unpaired two-tailed Student’s t-test, **P < 0.01, ***P < 0.001, n = 3 mice per group, mean ± SEM). Scale bar: 100 µm in B for (B), 100 µm in G for (C‐G).
The generation of striatal D1 versus D2 MSNs is controlled by different TFs. In this study, we found that the TF Zfp503 is intensely expressed in MSNs during striatal development. The absence of Zfp503 resulted in fate switching of D1 MSNs into D2 MSNs. Single-cell RNA-seq and histochemical analyses revealed that Zfp503 promotes the D1 MSN identity and represses the D2 MSN identity. Mechanistically, our results suggest the upregulation of the TFs Sp8/9 is the key factor leading to the switching of D1 MSNs to the D2 MSNs in Zfp503-CKO mice. Overall, we speculate that TF Zfp503 controls the fate of D1 MSNs by repressing Sp8/9 expression during striatal development.
Understanding the mechanisms underlying neuronal fate acquisition is a major challenge in developmental neurobiology, because there are many distinct regions and different progenitors in the mammalian telencephalon, particularly in the subpallium (Yun et al., 2001; Corbin et al., 2003; Stenman et al., 2003; Flames et al., 2007; Wen et al., 2021). More recent evidence has shown that TF Zfp503 expression is enriched in the ventral parts of the vLGE (Chen et al., 2020), while the TF Six3 expression preferentially present in the dorsal parts of the vLGE at an early stage (Xu et al., 2018). Furthermore, the differentiation of D1 MSNs and D2 MSNs is completely blocked in Zfp503-CKO and Six3-CKO mice, respectively (Xu et al., 2018; Soleilhavoup et al., 2020). These results support that D1 MSNs are generated from the ventral part of the vLGE, in contrast to D2 MSNs which are derived from the dorsal part of the vLGE.
Retinoic acid (RA) has been implicated as an extrinsic signal regulating the differentiation of distinct cell types, including specific neuronal subtypes (Toresson et al., 1999; Chatzi et al., 2011; Cunningham and Duester, 2015; Rataj-Baniowska et al., 2015; Podleśny-Drabiniok et al., 2017). RA is derived from vitamin A through a two-step enzymatic process, employing retinol dehydrogenase (Rdh10) for the oxidation of retinol to retinaldehyde, and the retinaldehyde dehydrogenases Aldh1a1, Aldh1a2, and Aldh1a3 for the oxidation of retinaldehyde to RA, which then functions as a ligand for nuclear RA receptors (Chatzi et al., 2011). During striatal development, Aldh1a3 is predominantly expressed in LGE (striatal primordium) progenitors and is nearly absent in adjacent structures of the medial ganglionic eminence and cerebral cortex (Toresson et al., 1999; Molotkova et al., 2007). Its expression is regulated by Gsx2 and Meis2 (Waclaw et al., 2004; Su et al., 2022). In fact, the expression of the Aldh1a3 is located in the ventral vLGE (Li et al., 2000; Smith et al., 2001; Waclaw et al., 2004; Chatzi et al., 2011). The roles of RA in the LGE have been investigated, including promoting striatal neurogenesis and neuronal differentiation (Molotkova et al., 2007; Liao et al., 2008; Urban et al., 2010; Al Tanoury et al., 2014; Rataj-Baniowska et al., 2015). The absence of Aldh1a3 leads to abnormal differentiation of striatal MSNs (Chatzi et al., 2011). Interestingly, RA can promote the expression of Zfp503 in the LGE at the early stage of striatal development (Urban et al., 2010). These studies support that RA can induce Zfp503 expression in ventral vLGE progenitors at an early stage. Therefore, we speculate that the progenitors located in the ventral vLGE tend to give rise to D1 MSNs. In contrast, the progenitors located in the dorsal vLGE tend to generate D2 MSNs.
The Forkhead box P2 (FOXP2) has been identified as a gene related to neurodevelopmental disorders, and it was also the first gene to be associated with vocal functions in songbirds and rodents (Bacon and Rappold, 2012; Chiu et al., 2014). Indeed, mutations in the FOXP2 gene have been identified in patients with a severe speech and language disorders (Lai et al., 2001). Naturally, Foxp2 is enriched in the striatum and controls the differentiation of striatal MSNs (Lai et al., 2001; Chiu et al., 2014; Chen et al., 2016; Fong et al., 2018; van Rhijn et al., 2018). The mechanisms, however, of regulating Foxp2 expression in the striatum are largely unknown. More recent evidence supports that Foxp2 is highly expressed in D1 MSNs and weakly expressed in the D2 MSNs (Liu et al., 2018; Tinterri et al., 2018; van Rhijn et al., 2018; Wei et al., 2019). In this study, we found that the expression of Foxp2 was significantly reduced in Zfp503-DCKO mice (Figure 4H; Supplementary Table 1). In contrast, the expression of Six3 was present in the whole striatum (Figures 6M–O). Six3 is known as a key factor for the generation of D2 MSNs (Xu et al., 2018; Song et al., 2021). Thus, we speculated that Six3 represses the expression of Foxp2 in D2 MSNs. Actually, in our recent works and unpublished data, we found that Foxp2 expression is upregulated in Six3 mutant mice and downregulated in Six3 overexpressing mice (Xu et al., 2018; Song et al., 2021). Therefore, our findings suggested that Foxp2 expression is closely regulated by Six3 in D2 MSNs.
Overall, our findings have demonstrated that Zfp503 is critical for the fate acquisition of D1 versus D2 MSNs during striatal development. Zfp503 appears to repress the expression of the TF Sp8/9 in precursor cells to control the fate of D1 MSNs. The results of this work will deepen our understanding of fate determination in striatal MSNs and open up new opportunities for translational investigations of degenerative diseases, such as PD and HD.
All experiments conducted in this study were in accordance with guidelines from Fudan University, China. Zfp503F/+ (Su et al., 2022), Sp9-Cre (Zhang et al., 2016), and Dlx5/6-CIE (Liu et al., 2018) mice have been previously described. Dlx2-Cre mice were generated via the CRISPR/Cas9 strategy. IRES elements and Cre sequences were knocked into the coding region of exon 3 of Dlx2. Genotyping of the Dlx2-Cre constitutive knock-in (KI) allele was performed by PCR using the following primers:
F1: 5′- CCTCGGCCTTTCTGGGAAACTAC-3′;
R1: 5′- CTTGCAGGTACAGGAGGTAGTCC-3′;
R2: 5′- TTGGCACTAAAGGATCCCACGAG-3′. These primers yielded bands of 390 and 501 bp for the WT and knock-in (KI) alleles, respectively. Rosa26-Zfp503-OE/+ mice that conditionally overexpressed Zfp503 were generated by CRISPR/Cas9 techniques (Figure 7A). An expression vector containing CAG-promoter-Flox-PolyA STOP-Flox-Kozak-mouse Zfp503 CDS-3 XHA tag-PolyA was knocked into the Rosa26 locus. With this strategy, the Zfp503-HA tag fusion protein was continuously expressed in CRE recombinase-positive cells. In cells after CRE recombination, both the HA tag and the Zfp503 protein were specifically detected. Genotyping of the Zfp503-OE allele was performed by PCR using the following primers:
WT-F3: 5′-CACTTGCTCTCCCAAAGTCGCTC-3′;
WT-R3: 5′-ATACTCCGAGGCGGATCACAA-3′;
OE-F5: 5′-GCATCTGACTTCTGGCTAATAAAG-3′. These primers yield bands of 453 and 633 bp for the WT and overexpression alleles, respectively. All mice were maintained in a mixed genetic background of C57BL/6J and CD1. The day of vaginal plug detection was considered E0.5, and the day of birth was defined as P0. Both male and female mice were used in all experiments.
Tissue preparation was performed as previously described (Yang et al., 2021).
In this study, 6-μm and 12-μm thick frozen sections were used for immunostaining. The sections were washed with 0.05 M Tris buffered saline (TBS) for 10 min, (If necessary, the sections were immersed in antigenic repair solution(pH = 6.0) and boiled before the Triton step, and cooled naturally to room temperature (RT) incubated in Triton X-100 (0.5% in 0.05 M TBS) for 30 min at RT, and then incubated with blocking solution (10% donkey serum + 0.5%; Triton-X-100 in 0.05 M TBS, pH 7.2) for 2 h at RT. The primary antibodies were diluted in 10% donkey serum blocking solution, incubated overnight at 4°C and then rinsed three times with 0.05 M TBS. Secondary antibodies matching the appropriate species were added and incubated for 2-4 h at RT. Fluorescently stained sections were then washed three times with 0.05 M TBS. This was followed by 4′,6-diamidino-2-phenylindole (DAPI) (Sigma-Aldrich, 200 ng/ml) staining for 5 min, and the sections were then cover-slipped with Gel/Mount (Biomeda).
In situ hybridization (ISH) was performed on 20-μm cryosections using digoxigenin riboprobes as previously described (Su et al., 2022). Probes were made from P0 WT mouse brain cDNA amplified by PCR.
LGE samples of E16.5 Zfp503-OE, E18.5 Zfp503-CKO and littermate control mice were dissected (n > = 3 for each group). Total RNA was purified with a Mini RNA Isolation Kit (Zymo) followed by library generation according to the manufacturer’s protocol (Illumina TruSeq Stranded Total RNA Library Prep Kit with Ribo-Zero Mouse). Fragment size distribution was assessed using a Bioanalyzer 2100. The concentration of the libraries was measured using a Kapa Library Quantification Kit. The purified libraries were sequenced on a HiSeq 4000 platform. Gene expression levels were reported as fragments per kilobase of exon per million fragments mapped (FPKM) values. Genes with a p value < 0.05 were considered to be differentially expressed.
Embryonic mouse (E14.5) brains were quickly collected and placed in HBSS. The LGE samples were dissected and incubated in 1 mg/ml papain in HBSS for 20 min at 37°C. The tissues were gently dissociated into a single-cell suspension by pipetting. Cells were centrifuged and washed twice, filtered through Flowmi Tip 40 μM strainers, and resuspended in HBSS+ 0.04% BSA. Cell viability was assessed by trypan blue exclusion.
The Chromium Droplet-based Sequencing Platform (10X Genomics) was used to generate scRNA-seq libraries, following the manufacturer’s instructions (manual document part number: CG00052 Rev C). The cDNA libraries were purified, quantified using an Agilent 2100 Bioanalyzer, and sequenced on an Illumina HiSeq4000. High quality sequences (clean reads) were obtained by removing low quality sequences and joints. The clean reads were then processed with Cell Ranger software to obtain quantitative information on gene expression. Genes expressed in < 3 cells and cells with < 750 detected genes were filtered out. Cells with >10% mitochondrial genes were also filtered out. The global-scaling normalization method “Log Normalize” was applied to the raw read counts generated by 10X Cell Ranger to normalize the gene expression measurements for each cell based on the total expression. The log-transformed normalized single-cell expression values were used for differential expression tests. Potential sources of variation, including technical noise, batch effects, and biological sources of variation such as cell-cycle stage, were removed to improve downstream dimensionality reduction and clustering. We regressed gene expression on the number of detected molecules per cell and the cell-cycle stage score. The scaled z-scored residuals were used for principal component analysis (PCA). Statistically significant principal components determined by a resampling test were kept for uniform manifold approximation and projection (UMAP) analysis. Differentially-expressed genes (DEGs) among clusters were identified by comparing cells in each cluster against all other cells with the likelihood-ratio test. Gene A was defined as a biomarker of cluster X if it was detected in ≥25% cells, and had an adjusted p-value < 5%, and fold change ≥2 between cells of cluster X and all other cells. All these analyses were performed in Seurat v3.2 (https://satijalab.org/seurat/).
Images for quantitative analyses were acquired using an Olympus VS 120 microscope with a 20X objective. Bright-field images were acquired using an Olympus VS 120 microscope with a 10X objective. Images were merged, cropped and optimized in Adobe Photoshop CC without distorting the original information. Analyses were performed using GraphPad Prism 6.0, Microsoft Excel and the R language. Unpaired two-tailed t-test or one-way ANOVA followed by the Tukey–Kramer post-hoc test was used to determine statistical significance. All quantification results are presented as the mean ± SEM. Differences with p-values < 0.05 were considered significant.
For quantification of BCL11B+ and ZFP503+ cells in the striatum of Wild type at E14.5 and E18.5, four anatomically matched 6-μm thick coronal sections were selected (n = 3 mice per group). We counted BCL11B+ and ZFP503+ cells in the striatum under a 20X objective lens. The striatum was delineated by DAPI staining. The numbers of BCL11B+ and ZFP503+ cells per section for each LGE SVZ were presented as the relative to these in the control group.
For quantification of BCL11B+ cells in the striatum of control and two Zfp503-CKO mice at E18.5, four anatomically matched 12-μm thick coronal sections were selected (n = 3 mice per group). We counted BCL11B+ cells in the striatum under a 20X objective lens. The striatum was delineated by DAPI staining. The numbers of BCL11B+ cells per section for each striatum were presented as the relative to these in the control group.
For quantification of Drd1+, Tac1+, Penk+, and Drd2+ cells in the striatum of control and two Zfp503-CKO mice at E18.5, four anatomically matched 20-μm thick coronal sections were selected (n = 3 mice per group). We counted Drd1+, Tac1+, Penk+, and Drd2+ cells in the striatum under a 10X objective lens. The numbers of Drd1+, Tac1+, Penk+, and Drd2+ cells per section for each striatum were presented as the relative to these in the control group.
For quantification of SIX3+, SOX2+, and SP9+ cells in the striatum of control and two Zfp503-CKO mice at E16.5 and E18.5, four anatomically matched 12-μm thick coronal sections were selected (n = 3 mice per group). We used the histogram tool in Adobe Photoshop CC to calculate the fluorescence intensity of SIX3+, SOX2+, and SP9+ cells in the striatum. Data were presented in proportion to the control group.
For quantification of SP8+ cells in the striatum of control and two Zfp503-CKO mice at E16.5 and E18.5, four anatomically matched 12-μm thick coronal sections were selected (n = 3 mice per group). We counted SP8+ cells in the striatum under a 20X objective lens. The striatum was delineated by DAPI staining. The numbers of SP8+ cells per section for each striatum were presented as the relative to these in the control group.
For quantification of Ebf1+, Isl1+, Six3+, and Sp9+ cells in the striatum of control and Dlx2-Cre; Zfp503-OE mice at E16.5, four anatomically matched 12-μm thick coronal sections were selected (n = 3 mice per group). We used the Adobe Photoshop CC to invert the image, and then used histogram tool in Adobe Photoshop CC to calculate the fluorescence intensity of Ebf1+, Isl1+, Six3+, and Sp9+ cells in the striatum. Data were presented in proportion to the control group.
For quantification of Tac1+ cells in the striatum of control and Dlx2-Cre; Zfp503-OE mice at E16.5, four anatomically matched 12-μm thick coronal sections were selected (n = 3 mice per group). We counted Tac1+ cells in the striatum under a 10X objective lens. The numbers of Tac1+ cells per section for each striatum were presented as the relative to these in the control group.
For quantification of PCNA+, KI67+, and ASCL1+ cells in the striatum of control and Zfp503-DCKO mice at E14.5, four anatomically matched 12-μm thick coronal sections were selected (n = 3 mice per group). We used the histogram tool in Adobe Photoshop CC to calculate the fluorescence intensity of PCNA+, KI67+, and ASCL1+ cells in the striatum. The striatum was delineated by DAPI staining. Data were presented in proportion to the control group.
The datasets presented in this study can be found in online repositories. The names of the repository/repositories and accession number(s) can be found below: https://www.ncbi.nlm.nih.gov/geo/, GSE202439.
The animal study was reviewed and approved by All experiments conducted in this study were in accordance with guidelines from Fudan University, China.
ZS, LY, and ZW performed all experiments and analyzed data. YT, YG, ZS, RG, WL, GL, XL, and WZ helped to conduct experiments and analyze the data. ZZ and ZL designed the experiments and analyzed the results. ZZ and ZY wrote the manuscript and revised the manuscript.
This study was supported by grants from National Key Research and Development Program of China (2018YFA0108000, 2021ZD0202300), National Natural Science Foundation of China (NSFC 31820103006, NSFC 32070971 and NSFC32100768), and supported by Shanghai Municipal Science and Technology Major Project (No.2018SHZDZX01), ZJ Lab, and Shanghai Center for Brain Science and Brain-Inspired Technology.
We are grateful to Kenneth Campbell at University of Cincinnati College of Medicine for the Dlx5/6-CIE mice.
The authors declare that the research was conducted in the absence of any commercial or financial relationships that could be construed as a potential conflict of interest.
All claims expressed in this article are solely those of the authors and do not necessarily represent those of their affiliated organizations, or those of the publisher, the editors and the reviewers. Any product that may be evaluated in this article, or claim that may be made by its manufacturer, is not guaranteed or endorsed by the publisher.
The Supplementary Material for this article can be found online at: https://www.frontiersin.org/articles/10.3389/fcell.2022.948331/full#supplementary-material
Al Tanoury, Z., Gaouar, S., Piskunov, A., Ye, T., Urban, S., Jost, B., et al. (2014). Phosphorylation of the retinoic acid receptor RAR 2 is crucial for the neuronal differentiation of mouse embryonic stem cells. J. Cell. Sci. 127 (9), 2095–2105. doi:10.1242/jcs.145979
Anderson, S. A., Qiu, M., Bulfone, A., Eisenstat, D. D., Meneses, J., Pedersen, R., et al. (1997). Mutations of the homeobox genes Dlx-1 and Dlx-2 disrupt the striatal subventricular zone and differentiation of late born striatal neurons. Neuron 19 (1), 27–37. doi:10.1016/s0896-6273(00)80345-1
Bacon, C., and Rappold, G. A. (2012). The distinct and overlapping phenotypic spectra of FOXP1 and FOXP2 in cognitive disorders. Hum. Genet. 131 (11), 1687–1698. doi:10.1007/s00439-012-1193-z
Bertran-Gonzalez, J., Bosch, C., Maroteaux, M., Matamales, M., Herve, D., Valjent, E., et al. (2008). Opposing patterns of signaling activation in dopamine D1 and D2 receptor-expressing striatal neurons in response to cocaine and haloperidol. J. Neurosci. 28 (22), 5671–5685. doi:10.1523/jneurosci.1039-08.2008
Bocchi, V. D., Conforti, P., Vezzoli, E., Besusso, D., Cappadona, C., Lischetti, T., et al. (2022). The coding and long noncoding single-cell atlas of the developing human fetal striatum. Science 2021 (6542), 372.
Chang, C. W., Tsai, C. W., Wang, H. F., Tsai, H. C., Chen, H. Y., Tsai, T. F., et al. (2004). Identification of a developmentally regulated striatum-enriched zinc-finger gene, Nolz-1, in the mammalian brain. Proc. Natl. Acad. Sci. U. S. A. 101 (8), 2613–2618. doi:10.1073/pnas.0308645100
Chapman, H., Riesenberg, A., Ehrman, L. A., Kohli, V., Nardini, D., Nakafuku, M., et al. (2018). Gsx transcription factors control neuronal versus glial specification in ventricular zone progenitors of the mouse lateral ganglionic eminence. Dev. Biol. 442 (1), 115–126. doi:10.1016/j.ydbio.2018.07.005
Chatzi, C., Brade, T., and Duester, G. (2011). Retinoic acid functions as a key GABAergic differentiation signal in the basal ganglia. PLoS Biol. 9 (4), e1000609. doi:10.1371/journal.pbio.1000609
Chen, S. Y., Lu, K. M., Ko, H. A., Huang, T. H., Hao, J. H., Yan, Y. T., et al. (2020). Parcellation of the striatal complex into dorsal and ventral districts. Proc. Natl. Acad. Sci. U. S. A. doi:10.1073/pnas.1921007117
Chen, Y. C., Kuo, H. Y., Bornschein, U., Takahashi, H., Chen, S. Y., Lu, K. M., et al. (2016). Foxp2 controls synaptic wiring of corticostriatal circuits and vocal communication by opposing Mef2c. Nat. Neurosci. 19 (11), 1513–1522. doi:10.1038/nn.4380
Chiu, Y. C., Li, M. Y., Liu, Y. H., Ding, J. Y., Yu, J. Y., and Wang, T. W. (2014). Foxp2 regulates neuronal differentiation and neuronal subtype specification. Dev. Neurobiol. 74 (7), 723–738. doi:10.1002/dneu.22166
Cimadamore, F., Amador-Arjona, A., Chen, C., Huang, C. T., and Terskikh, A. V. (2013). SOX2-LIN28/let-7 pathway regulates proliferation and neurogenesis in neural precursors. Proc. Natl. Acad. Sci. U. S. A. 110 (32), E3017–E3026. doi:10.1073/pnas.1220176110
Corbin, J. G., Rutlin, M., Gaiano, N., and Fishell, G. (2003). Combinatorial function of the homeodomain proteins Nkx2.1 and Gsh2 in ventral telencephalic patterning. Development 130 (20), 4895–4906. doi:10.1242/dev.00717
Cunningham, T. J., and Duester, G. (2015). Mechanisms of retinoic acid signalling and its roles in organ and limb development. Nat. Rev. Mol. Cell. Biol. 16 (2), 110–123. doi:10.1038/nrm3932
DeLong, M. R. (1990). Primate models of movement disorders of basal ganglia origin. Trends Neurosci. 13 (7), 281–285. doi:10.1016/0166-2236(90)90110-v
Ehrman, J. M., Merchan-Sala, P., Ehrman, L. A., Chen, B., Lim, H. W., Waclaw, R. R., et al. (2022). Formation of the mouse internal capsule and cerebral peduncle: A pioneering role for striatonigral axons as revealed in Isl1 conditional mutants. J. Neurosci. 42 (16), 3344–3364. doi:10.1523/jneurosci.2291-21.2022
Ehrman, L. A., Mu, X., Waclaw, R. R., Yoshida, Y., Vorhees, C. V., Klein, W. H., et al. (2013). The LIM homeobox gene Isl1 is required for the correct development of the striatonigral pathway in the mouse. Proc. Natl. Acad. Sci. U. S. A. 110 (42), E4026–E4035. doi:10.1073/pnas.1308275110
Feng, R., and Wen, J. (2015). Overview of the roles of Sox2 in stem cell and development. Biol. Chem. 396 (8), 883–891. doi:10.1515/hsz-2014-0317
Feng, R., Zhou, S., Liu, Y., Song, D., Luan, Z., Dai, X., et al. (2013). Sox2 protects neural stem cells from apoptosis via up-regulating survivin expression. Biochem. J. 450 (3), 459–468. doi:10.1042/bj20120924
Flames, N., Pla, R., Gelman, D. M., Rubenstein, J. L., Puelles, L., and Marin, O. (2007). Delineation of multiple subpallial progenitor domains by the combinatorial expression of transcriptional codes. J. Neurosci. 27 (36), 9682–9695. doi:10.1523/jneurosci.2750-07.2007
Fong, W. L., Kuo, H. Y., Wu, H. L., Chen, S. Y., and Liu, F. C. (2018). Differential and overlapping pattern of Foxp1 and Foxp2 expression in the striatum of adult mouse brain. Neuroscience 388, 214–223. doi:10.1016/j.neuroscience.2018.07.017
Garel, S., Marin, F., Grosschedl, R., and Charnay, P. (1999). Ebf1 controls early cell differentiation in the embryonic striatum. Development 126 (23), 5285–5294. doi:10.1242/dev.126.23.5285
Gerfen, C. R., Engber, T. M., Mahan, L. C., Susel, Z., Chase, T. N., Monsma, F. J., et al. fnm D1 and D2 dopamine receptor-regulated gene expression of striatonigral and striatopallidal neurons. Science 1990, 250(4986): 1429–1432.doi:10.1126/science.2147780
Gerfen, C. R., and Surmeier, D. J. (2011). Modulation of striatal projection systems by dopamine. Annu. Rev. Neurosci. 34, 441–466. doi:10.1146/annurev-neuro-061010-113641
Gokce, O., Stanley, G. M., Treutlein, B., Neff, N. F., Camp, J. G., Malenka, R. C., et al. (2016). Cellular taxonomy of the mouse striatum as revealed by single-cell RNA-seq. Cell. Rep. 16 (4), 1126–1137. doi:10.1016/j.celrep.2016.06.059
Huang, H. S., Kubish, G. M., Redmond, T. M., Turner, D. L., Thompson, R. C., Murphy, G. G., et al. (2010). Direct transcriptional induction of Gadd45gamma by Ascl1 during neuronal differentiation. Mol. Cell. Neurosci. 44 (3), 282–296. doi:10.1016/j.mcn.2010.03.014
Kawaguchi, Y., Wilson, C. J., Augood, S. J., and Emson, P. C. (1995). Striatal interneurones: Chemical, physiological and morphological characterization. Trends Neurosci. 18 (12), 527–535. doi:10.1016/0166-2236(95)98374-8
Ko, H. A., Chen, S. Y., Chen, H. Y., Hao, H. J., and Liu, F. C. (2013). Cell type-selective expression of the zinc finger-containing gene Nolz-1/Zfp503 in the developing mouse striatum. Neurosci. Lett. 548, 44–49. doi:10.1016/j.neulet.2013.05.020
Lai, C. S., Fisher, S. E., Hurst, J. A., Vargha-Khadem, F., and Monaco, A. P. (2001). A forkhead-domain gene is mutated in a severe speech and language disorder. Nature 413 (6855), 519–523. doi:10.1038/35097076
Li, H., Wagner, E., McCaffery, P., Smith, D., Andreadis, A., and Drager, U. C. (2000). A retinoic acid synthesizing enzyme in ventral retina and telencephalon of the embryonic mouse. Mech. Dev. 95 (1-2), 283–289. doi:10.1016/s0925-4773(00)00352-x
Li, X., Liu, G., Yang, L., Li, Z., Zhang, Z., Xu, Z., et al. (2021). Decoding cortical glial cell development. Neurosci. Bull. doi:10.1007/s12264-021-00640-9
Li, Z., Shang, Z., Sun, M., Jiang, X., Tian, Y., Yang, L., et al. (2022). Transcription factor Sp9 is a negative regulator of D1-type MSN development. Cell. Death Discov. 8 (1). doi:10.1038/s41420-022-01088-0
Liao, W. L., Tsai, H. C., Wang, H. F., Chang, J., Lu, K. M., Wu, H. L., et al. (2008). Modular patterning of structure and function of the striatum by retinoid receptor signaling. Proc. Natl. Acad. Sci. U. S. A. 105 (18), 6765–6770. doi:10.1073/pnas.0802109105
Liu, Z., Zhang, Z., Lindtner, S., Li, Z., Xu, Z., Wei, S., et al. (2018). Sp9 regulates medial ganglionic eminence-derived cortical interneuron development. Cereb. Cortex. doi:10.1093/cercor/bhy133
Lobo, M. K., Karsten, S. L., Gray, M., Geschwind, D. H., and Yang, X. W. (2006). FACS-array profiling of striatal projection neuron subtypes in juvenile and adult mouse brains. Nat. Neurosci. 9 (3), 443–452. doi:10.1038/nn1654
Lobo, M. K., Yeh, C., and Yang, X. W. (2008). Pivotal role of early B-cell factor 1 in development of striatonigral medium spiny neurons in the matrix compartment. J. Neurosci. Res. 86 (10), 2134–2146. doi:10.1002/jnr.21666
Long, J. E., Swan, C., Liang, W. S., Cobos, I., Potter, G. B., and Rubenstein, J. L. (2009). Dlx1&2 and Mash1 transcription factors control striatal patterning and differentiation through parallel and overlapping pathways. J. Comp. Neurol. 512 (4), 556–572. doi:10.1002/cne.21854
Lu, K. M., Evans, S. M., Hirano, S., and Liu, F. C. (2014). Dual role for Islet-1 in promoting striatonigral and repressing striatopallidal genetic programs to specify striatonigral cell identity. Proc. Natl. Acad. Sci. U. S. A. 111 (1), E168–E177. doi:10.1073/pnas.1319138111
Molotkova, N., Molotkov, A., and Duester, G. (2007). Role of retinoic acid during forebrain development begins late when Raldh3 generates retinoic acid in the ventral subventricular zone. Dev. Biol. 303 (2), 601–610. doi:10.1016/j.ydbio.2006.11.035
Olsson, M., Campbell, K., Wictorin, K., and Björklund, A. (1995). Projection neurons in fetal striatal transplants are predominantly derived from the lateral ganglionic eminence. Neuroscience 69 (4), 1169–1182. doi:10.1016/0306-4522(95)00325-d
Pei, Z., Wang, B., Chen, G., Nagao, M., Nakafuku, M., and Campbell, K. (2011). Homeobox genes Gsx1 and Gsx2 differentially regulate telencephalic progenitor maturation. Proc. Natl. Acad. Sci. 108 (4), 1675–1680. doi:10.1073/pnas.1008824108
Podleśny-Drabiniok, A., Sobska, J., de Lera, A. R., Gołembiowska, K., Kamińska, K., Dollé, P., et al. (2017). Distinct retinoic acid receptor (RAR) isotypes control differentiation of embryonal carcinoma cells to dopaminergic or striatopallidal medium spiny neurons. Sci. Rep. 7 (1). doi:10.1038/s41598-017-13826-x
Puighermanal, E., Castell, L., Esteve-Codina, A., Melser, S., Kaganovsky, K., Zussy, C., et al. (2020). Functional and molecular heterogeneity of D2R neurons along dorsal ventral axis in the striatum. Nat. Commun. 11 (1), 1957. doi:10.1038/s41467-020-15716-9
Rataj-Baniowska, M., Niewiadomska-Cimicka, A., Paschaki, M., Szyszka-Niagolov, M., Carramolino, L., Torres, M., et al. (2015). Retinoic acid receptor beta controls development of striatonigral projection neurons through FGF-dependent and meis1-dependent mechanisms. J. Neurosci. 35 (43), 14467–14475. doi:10.1523/jneurosci.1278-15.2015
Smith, D., Wagner, E., Koul, O., McCaffery, P., and Dräger, U. C. (2001). Retinoic acid synthesis for the developing telencephalon. Cereb. Cortex 11 (10), 894–905. doi:10.1093/cercor/11.10.894
Soleilhavoup, C., Travaglio, M., Patrick, K., Garcao, P., Boobalan, E., Adolfs, Y., et al. (2020). Nolz1 expression is required in dopaminergic axon guidance and striatal innervation. Nat. Commun. 11 (1), 3111. doi:10.1038/s41467-020-16947-6
Song, X., Chen, H., Shang, Z., Du, H., Li, Z., Wen, Y., et al. (2021). Homeobox gene Six3 is required for the differentiation of D2-type medium spiny neurons. Neurosci. Bull. 37 (7), 985–998. doi:10.1007/s12264-021-00698-5
Stanley, G., Gokce, O., Malenka, R. C., Südhof, T. C., and Quake, S. R. (2019). Continuous and discrete neuron types of the adult murine striatum. Neuron.
Stenman, J., Toresson, H., and Campbell, K. (2003). Identification of two distinct progenitor populations in the lateral ganglionic eminence: Implications for striatal and olfactory bulb neurogenesis. J. Neurosci. 23 (1), 167–174. doi:10.1523/jneurosci.23-01-00167.2003
Su, Z., Wang, Z., Lindtner, S., Yang, L., Shang, Z., Tian, Y., et al. (2022). Dlx1/2-dependent expression of Meis2 promotes neuronal fate determination in the mammalian striatum. Development 149 (4). doi:10.1242/dev.200035
Su-Feher, L., Rubin, A. N., Silberberg, S. N., Catta-Preta, R., Lim, K. J., Ypsilanti, A. R., et al. (2022). Single cell enhancer activity distinguishes GABAergic and cholinergic lineages in embryonic mouse basal ganglia. Proc. Natl. Acad. Sci. U. S. A. 119 (15), e2108760119. doi:10.1073/pnas.2108760119
Tinterri, A., Menardy, F., Diana, M. A., Lokmane, L., Keita, M., Coulpier, F., et al. (2018). Active intermixing of indirect and direct neurons builds the striatal mosaic. Nat. Commun. 9 (1). doi:10.1038/s41467-018-07171-4
Toresson, H., Mata de Urquiza, A., Fagerstrom, C., Perlmann, T., and Campbell, K. (1999). Retinoids are produced by glia in the lateral ganglionic eminence and regulate striatal neuron differentiation. Development 126 (6), 1317–1326. doi:10.1242/dev.126.6.1317
Urban, N., Martin-Ibanez, R., Herranz, C., Esgleas, M., Crespo, E., Pardo, M., et al. (2010). Nolz1 promotes striatal neurogenesis through the regulation of retinoic acid signaling. Neural Dev. 5, 21. doi:10.1186/1749-8104-5-21
van Rhijn, J-R., Fisher, S. E., Vernes, S. C., and Nadif Kasri, N. (2018). Foxp2 loss of function increases striatal direct pathway inhibition via increased GABA release. Brain Structure and Function. doi:10.1007/s00429-018-1746-6
Waclaw, R. R., Allen, Z. J., Bell, S. M., Erdelyi, F., Szabo, G., Potter, S. S., et al. (2006). The zinc finger transcription factor Sp8 regulates the generation and diversity of olfactory bulb interneurons. Neuron 49 (4), 503–516. doi:10.1016/j.neuron.2006.01.018
Waclaw, R. R., Ehrman, L. A., Merchan-Sala, P., Kohli, V., Nardini, D., and Campbell, K. (2017). Foxo1 is a downstream effector of Isl1 in direct pathway striatal projection neuron development within the embryonic mouse telencephalon. Mol. Cell. Neurosci. 80, 44–51. doi:10.1016/j.mcn.2017.02.003
Waclaw, R. R., Wang, B., and Campbell, K. (2004). The homeobox gene Gsh2 is required for retinoid production in the embryonic mouse telencephalon. Development 131 (16), 4013–4020. doi:10.1242/dev.01272
Waclaw, R. R., Wang, B., Pei, Z., Ehrman, L. A., and Campbell, K. (2009). Distinct temporal requirements for the homeobox gene Gsx2 in specifying striatal and olfactory bulb neuronal fates. Neuron 63 (4), 451–465. doi:10.1016/j.neuron.2009.07.015
Wang, B., Long, J. E., Flandin, P., Pla, R., Waclaw, R. R., Campbell, K., et al. (2013). Loss of Gsx1 and Gsx2 function rescues distinct phenotypes in Dlx1/2 mutants. J. Comp. Neurology 521 (7), 1561–1584. doi:10.1002/cne.23242
Wang, B., Waclaw, R. R., Allen, Z. J., Guillemot, F., and Campbell, K. (2009). Ascl1 is a required downstream effector of Gsx gene function in the embryonic mouse telencephalon. Neural Dev. 4, 5. doi:10.1186/1749-8104-4-5
Wei, S., Du, H., Li, Z., Tao, G., Xu, Z., Song, X., et al. (2019). Transcription factors Sp8 and Sp9 regulate the development of caudal ganglionic eminence-derived cortical interneurons. J. Comp. Neurol.
Wen, Y., Su, Z., Wang, Z., Yang, L., Liu, G., Shang, Z., et al. (2021). Transcription factor VAX1 regulates the regional specification of the subpallium through repressing Gsx2. Mol. Neurobiol. 58 (8), 3729–3744. doi:10.1007/s12035-021-02378-x
Wichmann, T., and DeLong, M. R. (1996). Functional and pathophysiological models of the basal ganglia. Curr. Opin. Neurobiol. 6 (6), 751–758. doi:10.1016/s0959-4388(96)80024-9
Xu, Z., Liang, Q., Song, X., Zhang, Z., Lindtner, S., Li, Z., et al. (2018). Sp8 and Sp9 coordinately promote D2-type medium spiny neuron production by activating Six3 expression. Development, 145 (14). doi:10.1242/dev.165456
Yang, L., Su, Z., Wang, Z., Li, Z., Shang, Z., Du, H., et al. (2021). Transcriptional profiling reveals the transcription factor networks regulating the survival of striatal neurons. Cell. death Dis. 12 (3), 262. doi:10.1038/s41419-021-03552-8
Yun, K., Garel, S., Fischman, S., and Rubenstein, J. L. (2003). Patterning of the lateral ganglionic eminence by the Gsh1 and Gsh2 homeobox genes regulates striatal and olfactory bulb histogenesis and the growth of axons through the basal ganglia. J. Comp. Neurol. 461 (2), 151–165. doi:10.1002/cne.10685
Yun, K., Potter, S., and Rubenstein, J. L. (2001). Gsh2 and Pax6 play complementary roles in dorsoventral patterning of the mammalian telencephalon. Development 128 (2), 193–205. doi:10.1242/dev.128.2.193
Zhang, Q., Zhang, Y., Wang, C., Xu, Z., Liang, Q., An, L., et al. (2016). The zinc finger transcription factor Sp9 is required for the development of striatopallidal projection neurons. Cell. Rep. 16 (5), 1431–1444. doi:10.1016/j.celrep.2016.06.090
Keywords: ZFP503, striatum, fate switch, LGE, medium-sized spiny neurons
Citation: Shang Z, Yang L, Wang Z, Tian Y, Gao Y, Su Z, Guo R, Li W, Liu G, Li X, Yang Z, Li Z and Zhang Z (2022) The transcription factor Zfp503 promotes the D1 MSN identity and represses the D2 MSN identity. Front. Cell Dev. Biol. 10:948331. doi: 10.3389/fcell.2022.948331
Received: 19 May 2022; Accepted: 19 July 2022;
Published: 23 August 2022.
Edited by:
Edwin Wang, University of Calgary, CanadaReviewed by:
Meital Oren-Suissa, Weizmann Institute of Science, IsraelCopyright © 2022 Shang, Yang, Wang, Tian, Gao, Su, Guo, Li, Liu, Li, Yang, Li and Zhang. This is an open-access article distributed under the terms of the Creative Commons Attribution License (CC BY). The use, distribution or reproduction in other forums is permitted, provided the original author(s) and the copyright owner(s) are credited and that the original publication in this journal is cited, in accordance with accepted academic practice. No use, distribution or reproduction is permitted which does not comply with these terms.
*Correspondence: Zhenmeiyu Li, MTUxMTE1MjAwMTdAZnVkYW4uZWR1LmNu; Zhuangzhi Zhang, enpfemhhbmdAZnVkYW4uZWR1LmNu
†These authors have contributed equally to this work
Disclaimer: All claims expressed in this article are solely those of the authors and do not necessarily represent those of their affiliated organizations, or those of the publisher, the editors and the reviewers. Any product that may be evaluated in this article or claim that may be made by its manufacturer is not guaranteed or endorsed by the publisher.
Research integrity at Frontiers
Learn more about the work of our research integrity team to safeguard the quality of each article we publish.