- 1Department of Biosciences, Biotechnologies and Biopharmaceutics, University of Bari Aldo Moro, Bari, Italy
- 2Department of Surgical, Medical, Molecular Pathology, and Critical Area, University of Pisa, Pisa, Italy
- 3Department of Surgery, University of Pisa, Pisa, Italy
- 4Department of Onco-haematology, IRCCS Ospedale Pediatrico Bambino Gesù, Rome, Italy
Vasopressin (AVP) plays a key function in controlling body water and salt balance through the activation of the vasopressin receptors V1aR and V2R. Abnormal secretion of AVP can cause the syndrome of inappropriate antidiuresis that leads to hyponatremia, which is an electrolyte disorder often observed in the elderly hospitalized and oncologic patients. Beyond kidneys, the colonic epithelium modulates water and salt homeostasis. The water channel AQP3, expressed in villus epithelial cells is implicated in water absorption across human colonic surface cells. Here, the action of dDAVP, a stable vasopressin analog, was evaluated on the AQP3 expression and function using human colon HCT8 cells as an experimental model. Confocal and Western Blotting analysis revealed that HCT8 cells express both V1aR and V2R. Long-term (72 h) treatment with dDAVP reduced glycerol uptake and cell viability. These effects were prevented by SR49059, a synthetic antagonist of V1aR, but not by tolvaptan, a specific V2R antagonist. Of note, the SR49059 action was impaired by DFP00173, a selective inhibitor of AQP3. Interestingly, compared to the normal colonic mucosa, in the colon of patients with adenocarcinoma, the expression of V1aR was significantly decreased. These findings were confirmed by gene expression analysis with RNA-Seq data. Overall, data suggest that dDAVP, through the V1aR dependent pathway, reduces AQP3 mediated glycerol uptake, a process that is reversed in adenocarcinoma, suggesting that the AVP-dependent AQP3 pathway may represent a novel target in colon diseases associated with abnormal cell growth.
Introduction
The hormone vasopressin (AVP) controls numerous functions under physiological and pathophysiological conditions. The actions evoked by AVP are mediated by three G protein-coupled receptors (V1aR, V1bR, and V2R). Stimulation of V1Rs causes the activation of PLC/PKC signaling and the mobilization of intracellular calcium (Thibonnier, 1992; Briley et al., 1994). The major role of AVP is to modulate the sodium and water body’s homeostasis. In the kidney, AVP binds V2R and stimulates the cAMP/PKA signal transduction pathway leading to AQP2 phosphorylation and trafficking to the plasma membrane where water reabsorption takes place (Boone and Deen, 2008; Ranieri et al., 2019). In long term, stimulation with AVP or thirsting increases the expression of AQP2 and AQP3 which have a cAMP response element CRE in their promoters (Yasui et al., 1997; Okahira et al., 2008). Beyond its endocrine roles (i.e., vasoconstriction and antidiuretic action), AVP also controls apoptosis, mitogenesis, cell growth, and death (Carter et al., 1993; Forti and Armelin, 2011; Miller et al., 2013). Abnormal release of AVP from the pituitary gland or non-pituitary sources causes the syndrome of inappropriate antidiuretic hormone secretion (SIADH), a condition characterized by water body deregulation and hyponatremia. SIADH has been associated with some forms of cancers including head and neck cancers, olfactory neuroblastomas, pancreatic neuroendocrine tumors, lymphoma, breast and colon cancers (Cabrijan et al., 1985; Gupta et al., 1986; Jayadeep et al., 2020; Navarro-Almenzar and Perianes, 2020; Li et al., 2021; Yasir and Mechanic, 2022). Importantly, several types of cancers express vasopressin receptors (VRs) that cause contrasting responses depending on receptor subtypes, their relative expression, and signaling (North et al., 1999; North, 2000; Heasley, 2001). Besides normal VRs, neoplastic tissue can express abnormal receptors concerning the sequence and signaling. Different subtypes of small cell lung cancer (SCLC) cells (NCI-H345; NCI-H82) express normal V1aR displaying, however, differential sensitivity to the action of vasopressin. In NCI-H82, stimulation with vasopressin increases the total level of inositol phosphate without a relevant rise of intracellular calcium compared to “classical” SCLC (North et al., 1997). On another hand, MCF7 cells express normal V2R and a C-terminally truncated V2R receptor (Rosenthal et al., 1994) which is mainly located intracellularly (Robben et al., 2005).
V1R stimulation is often associated with increased cell growth (Thibonnier et al., 2000) whereas V2R activation is correlated with cytostatic effects (Pifano et al., 2017).
Aquaporins are known targets of vasopressin action in health and disease (Yasui et al., 1997; Okahira et al., 2008; Valenti and Tamma, 2021).
Interestingly aquaporins have been found expressed in several tumor cells possibly playing a role in cell proliferation, invasion, and migration (Levin and Verkman, 2006; Jung et al., 2011; Di Giusto et al., 2012) but their regulatory actions remain still unclear. Aquaporins may promote water flux through the plasma membrane protrusion of migrating cells (Papadopoulos et al., 2008). In this respect, it has been nicely hypothesized that the compartmentalized cytoplasm, closed to the leading edge of migrating cells, may be subjected to changes in osmolality, secondary to actin depolymerization and ion flux. On the other hand, aquaporins may modulate cell proliferation being involved in mechanisms controlling cell volume, transport of glycerol, and other small molecules (Jung et al., 2021). Glycerol is a pivotal metabolite involved in the synthesis of triacylglycerols and glucose. Glycerol constitutes a substrate for ATP generation that is crucial for cell growth and proliferation (Méndez-Giménez et al., 2014). AQP3 is an aquaglyceroporin permeable to water, glycerol, urea, and hydrogen peroxide (H2O2) (Marlar et al., 2017). Importantly, it has been demonstrated that water and glycerol transport in AQP3 is gated by H+ (Zeuthen and Klaerke, 1999). Conversely, the permeability of other AQPs, such as AQP1, AQP4, and AQP5, occurs in pH independent manner (Zeuthen and Klaerke, 1999). AQP3 is expressed in several human epithelia including kidney, skin, airways, breast, liver, and gastrointestinal tract. Moreover, AQP3 is expressed in gastric mucosa, in the ileum and colon where it is involved in water and glycerol transport (Kreda et al., 2001; Yamamoto et al., 2001; Mobasheri et al., 2005; Aburada et al., 2011; Gregoire et al., 2015; Yde et al., 2016; Marlar et al., 2017). Abnormal expression of AQP3 may be associated with different diseases including cancer. Physiologically, AQP1 and AQP3 are expressed in the colon, however, their expression profile is altered in colorectal cancer (CRC). Compared to adjacent normal colon epithelia, the abundance of AQP1 and AQP3 increased significantly in CRC tissue (Mobasheri and Marples, 2004; Pei et al., 2011). Numerous studies have demonstrated abnormal expression of AQP3 in various types of diseases. However, the molecular mechanisms controlling the AQP3 expression and function are poorly shown. In this study, we provide novel evidence that AVP controls the expression and the function of AQP3 in human colon carcinoma HCT8 cells. The obtained results suggest that the AVP-dependent AQP3 pathway might represent a possible target in colon diseases associated with abnormal cell growth.
Materials and Methods
Chemicals and Reagents
Cell culture media and FBS (fetal bovine serum) were obtained from GIBCO (Thermo Fisher Scientific, Waltham, MA, United States). Desmopressin (dDAVP) was purchased from Merck (Merck KGaA, Darmstadt, Germany). Calcein-AM and Fluo-4 were bought from Molecular Probes (Thermo Fisher Scientific, Waltham, MA, United States). Tolvaptan was kindly gifted from Otsuka (Otsuka Pharmaceutical Co., Ltd, Tokyo Japan), SR49059 was from Merck (Merck KGaA, Darmstadt, Germany) and DFP00173 was purchased from Axon MedChem (S.I.A.L. s.r.l., Rome, Italy). TransFectin™ Lipid Reagent and Clarity Western ECL Substrates were bought from Bio-Rad (Bio-Rad Laboratories, Inc., Hercules, CA, United States).
Antibodies
A goat polyclonal antibody against Aquaporin-3 (C-18) was purchased from Santa Cruz Biotechnology (S.I.A.L. s.r.l., Rome, Italy). Recombinant rabbit monoclonal antibody against AVPR1A (7H23L17) was obtained from Invitrogen (Thermo Fisher Scientific, Waltham, MA, United States). Rabbit polyclonal antibody against AVPR2 (MBS8242744) was from MyBioSource (S.I.A.L. s.r.l., Rome, Italy). Secondary goat anti-rabbit and donkey anti-goat antibodies conjugated to horseradish peroxidase (HRP) were obtained respectively from Merck (Merck KGaA, Darmstadt, Germany) and Santa Cruz Biotechnology (S.I.A.L. s.r.l., Rome, Italy). Secondary donkey anti-goat and donkey anti-rabbit antibodies coupled to Alexa-488 were purchased from Thermo Fisher Scientific (Thermo Fisher Scientific, Waltham, MA, United States).
Cell Culture and Treatment
HCT8, human ileocecal adenocarcinoma cell line were cultured as previously described (Centrone et al., 2020a). Briefly, cells were grown in Advanced RPMI-1640 supplemented with 10% FBS, 100 i.u. ml−1 penicillin, 100 µg·ml−1 streptomycin at 37°C in 5% CO2. Cells were left under basal condition (untreated), treated with 100 nM desmopressin (dDAVP) for 72 h and/or treated with 100 nM tolvaptan or 100 nM SR49059 for 72 h or 2.5 µM DFP00173 for 48 h. As an internal control, cells were treated with 100 nM DMSO for 72 h.
Fluorescence Resonance Energy Transfer Measurements
To evaluate intracellular cAMP levels, fluorescence resonance energy transfer (FRET) experiments were performed. Briefly, HCT8 cells were seeded onto 12 mm diameter glass coverslips at 37°C, 5% CO2, and transiently transfected with a plasmid encoding the H96 sensor (Klarenbeek et al., 2011) (a gift from Dr. K. Jalink) containing the cAMP-binding sequence of Epac1 sandwiched between ECFP (donor) and EYFP (acceptor). In detail, cells were transfected with 0.5 μg of DNA/cm2 using TransFectin™ Lipid Reagent (1.5 μL/cm2) according to the protocol provided by the manufacturer (Bio-Rad Laboratories, Inc., Hercules, CA, United States) and left under basal condition or treated as mentioned before. Experiments were performed 48 h after transfection. Visualization of ECFP- and/or EYFP-expressing cells and detection of FRET was performed on an inverted microscope (Nikon Eclipse TE2000-S) controlled by Metamorph® Microscopy Automation and Image Analysis Software (Molecular Devices, LLC, San Jose, CA, United States). Each image was corrected and analyzed as previously shown (Di Mise et al., 2019).
Intracellular Calcium Measurements
HCT8 cells were grown on 40-mm glass coverslips and then loaded with 4 µM Fluo-4 for 15 min at 37°C in Advanced RPMI 1640. Ringer’s solution was used to perfuse cells during the experiment and containing 137 mM NaCl, 5.4 mM KCl, 0.5 mM MgCl2, 1.3 mM CaCl2, 4.2 mM NaHCO3, 0.4 mM KH2PO4, 3 mM Na2HPO4, 10 mM Hepes sulfonic acid, 10 mM glucose, pH 7.4. In fluorescence measurements, the coverslips with dye-loaded cells were mounted in a perfusion chamber (FCS2 Closed Chamber System, BIOPTECHS, Butler, United States). Measurements were performed using an inverted TE2000-S microscope (Nikon Eclipse microscope, Tokyo, Japan). The Fluo-4 loaded sample was excited at 490 nm. Fluorescence signals were captured by a cooled ECCD camera (CoolSNAP HQ, Photometrics, Tucson, AZ, United States) and measured with Metafluor software (Molecular Devices, MDS Analytical Technologies, Toronto, ON, Canada). Responses were analyzed as changes in fluorescence intensity normalized to the initial value of Fluo-4 intensity (F0) and compared with changes induced by ATP as a control stimulus, using GraphPad Prism (GraphPad Software, San Diego, CA, United States). Data are reported as mean values ± S.E.M. with n equal to the number of cells.
Human Cancer Specimens
Patients (3 females and 1 male) with colon mucinous adenocarcinoma provided written informed consent for sample collection and analysis. Fresh frozen samples of normal or neoplastic mucosa isolated from the same patient were used for Real-Time PCR and immunoblotting analysis.
Real-Time PCR Analysis of AQP3, V1aR, and V2R mRNA in HCT8 Cells and Human Colon Adenocarcinoma Biopsies
Real-Time PCR experiments were performed as previously described (Ranieri et al., 2021). Briefly, HCT8 cells were grown on 60-mm dishes and lysates in Trizol (Thermo Fisher Scientific, Waltham, MA, United States). Alternatively, human biopsies were equilibrated for 10 min in a buffer containing 118 mM NaCl, 16 mM HEPES, 17 mM Na-Hepes, 14 mM glucose, 3.2 mM KCl, 2.5 mM CaCl2, 1.8 mM MgSO4, and 1.8 mM KH2PO4 (pH 7.4). Specimens were then minced with a scissor directly in Trizol. Reverse transcription was performed on 2.5 µg of total RNA using SuperScript Vilo Master Mix (Thermo Fisher Scientific, Waltham, MA, United States), according to the manufacturer’s suggestions (25°C for 10 min; 42°C for 60 min; 85°C for 5 min). Real-Time PCR amplification was performed by using TaqMan Fast Advanced Master Mix with AQP3 (Assay ID: Hs00185020_m1), V1aR (Assay ID: Hs00176122_m1), V2R (Assay ID: Hs04195588_s1), and 18S assays (Assay ID: Hs99999901_s1) (Thermo Fisher Scientific, Waltham, MA, United States) in StepOne Real-Time PCR System (Thermo Fisher Scientific, Waltham, MA, United States), setting the thermal cycling conditions as specified by the manufacturer (95°C for 20 s; 40 cycles alternatively at 95°C for 1 s and 60°C for 20 s). Results were expressed as 2−ΔΔCt values (relative quantification) with ΔΔCt = (Ct target—Ct 18S) treated—(Ct target—Ct 18S) untreated.
Immunofluorescence
HCT8 cells were grown on 12 mm diameter glass coverslips and left untreated or stimulated as mentioned before. At 80% confluence, HCT8 cells were fixed in 4% paraformaldehyde solution for 20 min and permeabilized with 0.1% Triton X-100 in PBS for 5 min. Alternatively, cells were fixed using ice-cold methanol for 5 min. After blocking with 1% bovine serum albumin in PBS, cells were incubated overnight at 4°C with primary antibodies. After three washing in PBS, cells were incubated for 1 h with the appropriated Alexa Fluor-conjugated secondary antibodies. After washings, samples were mounted onto glass slides with Mowiol. Images were obtained with a confocal laser-scanning fluorescence microscope Leica TCS SP2 (Leica Microsystems, Heerbrugg, Switzerland).
Glycerol Permeability Assay
Glycerol permeability in HCT8 cells was measured using a calcein-quenching method (Mola et al., 2009; Mola et al., 2021). Nearly 80% of confluent cells were grown on 40-mm glass coverslips. After exposure to each treatment, cells were loaded with 12 μM membrane-permeable Calcein-AM in Advanced RPMI 1640 for 45 min at 37°C. Cytosolic calcein fluorophore exhibits concentration-dependent quenching by proteins or salts so that measured changes in fluorescence were directly proportional to changes in cell volume. The coverslips were mounted in a perfusion chamber (FCS2 Closed Chamber System, BIOPTECHS, Butler, United States) and single-cell measurements were performed using an inverted fluorescence microscope (Nikon ECLIPSE TE2000-S, Tokyo, Japan) equipped with a cooled CCD camera controlled by the Metafluor 4.6 software (Molecular Devices, MDS Analytical Technologies, Toronto, Canada). Calcein fluorescence was excited at 490 nm and detected at 520 nm. Cells in isotonic buffer (137 mM NaCl, 5.4 mM KCl, 0.5 mM MgCl2, 1.3 mM CaCl2, 4.2 mM NaHCO3, 0.4 mM KH2PO4, 3 mM Na2HPO4, 10 mM Hepes sulfonic acid, 10 mM glucose, pH 7.4) were exposed to 100 mOsm/L inwardly directed glycerol osmotic gradient. Time course fluorescence data were acquired over the indicated period to record both the shrinking phase, induced by the osmotic water efflux, and the subsequent swelling phase indicative of the osmotic influx of water following glycerol entry along its gradient. The time constant (expressed as 1/τ, sec−1) of the cell swelling, promoted by glycerol entry into the cells, was obtained by fitting the data with an exponential function using GraphPad Software (San Diego, CA, United States). Under such conditions, the calculated 1/τ value is considered an index reflecting the membrane glycerol permeability. Solution osmolarities were measured using a vapor pressure osmometer (Wescor, United States).
Cell Viability Assay
As a measurement of cell viability, the crystal violet assay and the cell growth assay were performed. Crystal violet assay was performed as previously described (Centrone et al., 2020b). Briefly, cells were grown in a 96-well plate and left under basal conditions or treated as previously described. Cells were fixed with 4% paraformaldehyde for 20 min, washed in PBS, and stained with a solution containing 0.1% crystal violet in 20% methanol for 20 min. After washing, cells were lysed with 10% acetic acid. The optical density at 595 nm (DO595) of each well was measured with a Microplate Reader (Bio-Rad Laboratories, Inc., Hercules, CA, United States) and was used as a measurement of cell viability.
Alternatively, 3.000 cells per condition, were seeded on 12-mm glass coverslips and treated as mentioned above. Cells were fixed in 4% paraformaldehyde solution for 20 min, washed in PBS, and stained for 20 min with 0.2% Coomassie blue solution in 10% acetic acid and 45% methanol. Cells were then washed in destaining solution (10% acetic acid, 45% methanol) for 5 min and with dH2O. After washing, digital pictures for each experimental condition were taken using the ChemiDoc System and the captured images were analyzed using Metamorph® software.
Human Colon Biopsies Homogenates
Biopsies sections were prepared and equilibrated for 10 min in a buffer containing 118 mM NaCl, 16 mM HEPES, 17 mM Na-Hepes, 14 mM glucose, 3.2 mM KCl, 2.5 mM CaCl2, 1.8 mM MgSO4, and 1.8 mM KH2PO4 (pH 7.4). Biopsies were minced with scissors in the same buffer in the presence of proteases and phosphatases inhibitors, sonicated (80 kHz for 20 s) and centrifuged at 12,000 g for 10 min at 4°C. Supernatants were collected and 15 μg of protein sample were separated by SDS-PAGE, transferred onto PVDF, and probed by Western blot analysis.
Gel Electrophoresis and Immunoblotting
Proteins were separated by SDS-PAGE (Corciulo et al., 2019) using 12% stain-free polyacrylamide gels (Bio-Rad Laboratories, Inc., Hercules, CA, United States). Protein bands were electrophoretically transferred onto PVDF Transfer membrane (Thermo Fisher Scientific, Waltham, MA, United States) and analyzed by Western blotting as previously described (Centrone et al., 2020b). Membranes were developed using Clarity Western ECL Substrate with the ChemiDoc System gels (Bio-Rad Laboratories, Milan, Italy). Obtained bands were normalized to total protein using the stain-free technology gels. Densitometry was performed using Image Lab software (Bio-Rad Laboratories, Milan, Italy).
RNA-Seq Analysis
Gene expression data relating to the AVPR1a, AVPR2, and AQP3 genes, from the TCGA (https://www.cancer.gov) for 288 colon tumors and the GTEx project (https://gtexportal.org) for 308 normal controls, were downloaded using the UCSC Xena browser (https://xena.ucsc.edu). The TPM (Transcripts Per Million) values for each gene obtained by bioinformatic analysis of RNA-Seq were compared by Mann-Whitney test and plotted on logarithmic scale in base 2.
Statistical Analysis
All values are reported as means ± S.E.M. Statistical analysis was performed by one-way ANOVA followed by Dunnett’s multiple comparisons test. When applicable, the Student t-test was also applied. A difference of p < 0.05 was considered statistically significant.
Supplementary Data
Antibodies
A goat polyclonal antibody against Aquaporin-1 (L-19), a monoclonal antibody against PCNA (PC10), and a monoclonal antibody against AQP2 (E-2) were purchased from Santa Cruz Biotechnology (S.I.A.L. s.r.l., Rome, Italy). Rabbit polyclonal antibodies against Aquaporin-4 (PA5-85767) and Aquaporin-5 (PA5-36529) were obtained from Invitrogen (Thermo Fisher Scientific, Waltham, MA, United States).
Water Permeability Video Imaging Measurements
Osmotic water permeability was measured by video imaging experiments. HCT8 cells were grown on 40 mm glass coverslips and exposed to specific treatments. Cells were loaded with 12 µM Calcein-AM in culture medium for 45 min at 37°C and then rinsed in isotonic solution (137 mM NaCl, 5.4 mM KCl, 0.5 mM MgCl2, 1.3 mM CaCl2, 4.2 mM NaHCO3, 0.4 mM KH2PO4, 3 mM Na2HPO4, 10 mM Hepes sulfonic acid, 10 mM glucose, pH 7.4). The coverslips were mounted in a perfusion chamber (FCS2 Closed Chamber System, BIOPTECHS, Butler, United States). Fluorescence signal changes in dye-loaded cells after 100 mOsm/L hypertonic gradient were recorded continuously using a Nikon inverted epifluorescence microscope (Nikon Eclipse TE2000-S) equipped with a ×40 objective lens [oil immersion, numerical aperture (NA) 1.3]. Calcein fluorescence was excited at 490 nm and the emitted fluorescence at 520 nm was captured by a cooled ECCD camera (CoolSNAP HQ, Photometrics). The changes in fluorescence intensity were directly proportional to changes in cell volume. The signal decreased upon the addition of hypertonic solution as a consequence of water efflux and cell shrinkage. Data acquisition was performed by Metafluor software (Molecular Devices, MDS Analytical Technologies, Toronto, ON, Canada) and the data were analyzed with GraphPad Prism software (La Jolla, CA, United States). The time constant (1/τ, s−1) of cell volume change upon hypertonic stimulus was obtained by fitting the experimental kinetic with an exponential function.
Results
Expression of Vasopressin Receptors in HCT8 Cells
Normal and abnormal VRs are expressed in different tissues and several types of tumor cells including lung, breast, prostate and colon (North, 2000; Moon et al., 2003). To investigate the possible function of vasopressin in the colon, human colon carcinoma HCT8 cells were used as an experimental model, and the expression of V1aR and V2R was evaluated. Immunoblotting analysis revealed immunoreactive bands of the expected mass of 45 kDa in homogenates isolated from HCT8 cells, indicating that V1aR and V2R are expressed in this cell model. Mouse kidney lysates were used as a positive control, whereas the negative control lanes are shown on the right of the panel (Figure 1A). Besides the expected bands, other few additional bands were detected which might correspond to variants or modified VRs. The expression of both receptors was further confirmed by immunohistochemistry (Figure 1B) revealing that HCT8 cells express V1aR and V2R. In particular, the xz scan suggests that V1aR is mainly localized at the plasma membrane. Conversely, V2R is expressed within the entire cell, including the plasma membrane. To test the functionality of the endogenous expressed V1aR, which is coupled to Gq (Thibonnier, 1992), changes in intracellular calcium were measured by single-cell epifluorescence imaging. Cells were loaded with Fluo-4 (4 µM) and exposed to dDAVP (1 μM) and ATP (100 μM) (Figure 2). Variations in intracellular calcium evoked by dDAVP were compared to the ATP response as a positive control. Statistical analysis of data revealed that stimulation with dDAVP caused a moderate increase in cytosolic calcium content (dDAVP = 10.17 ± 1.32% vs. ATP considered as 100%; n = 108 cells). The dDAVP triggered the increase in cytosolic calcium was prevented by preincubation with SR49059, a specific V1R antagonist (dDAVP/SR49059 = 5.32 ± 0.70% vs. ATP n = 58 cells), indicating that intracellular calcium increase occurs possibly through V1aR signaling. To evaluate the functionality of the endogenous expressed V2R, known to be coupled to Gs, (Birnbaumer et al., 1994), variations in intracellular cAMP, evoked by dDAVP stimulation, were measured using Fluorescence Resonance Energy Transfer (FRET) technology as previously described (Russo et al., 2017). HCT8 cells were transiently transfected with a plasmid encoding the H96 probe carrying the cAMP-binding motif of EPAC1 sandwiched between the CFP and Venus proteins (Ranieri et al., 2021). Compared to untreated cells, corrected netFRET signals are decreased with short-term (5 min) dDAVP stimulation (Figure 3, dDAVP = 68.52 ± 3.44%, n = 100 cells vs. untreated = 100 ± 7.72%, n = 105 cells), consistent with a significant increase in intracellular cAMP. Preincubation with tolvaptan, a selective V2R antagonist, abolished the dDAVP-induced increase in intracellular cAMP (dDAVP/TLV = 108.7 ± 8.13%, n = 96 cells). The treatment with tolvaptan did not alter intracellular cAMP levels (TLV = 112.6 ± 15.5%, n = 51 cells). Together these findings suggest that endogenous VRs are responding to dDAVP stimulation.
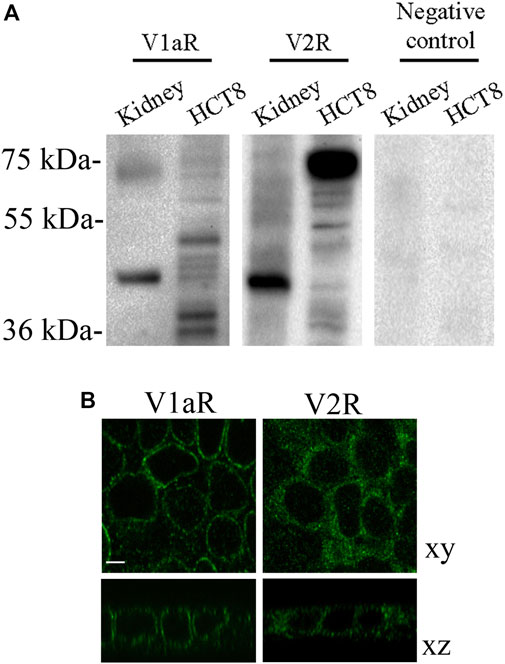
FIGURE 1. Endogenous expression and localization of vasopressin receptors in HCT8 cells. (A) An equal amount of proteins (60 µg) of total homogenates from HCT8 cells were blotted and probed with the indicated antibodies. Immunodetection revealed that V1aR and V2R are expressed in this cell model. Mouse kidney homogenates were used as a positive control. (B) Representative confocal images of immunofluorescence studies show that HCT8 cells express V1aR and V2R endogenously. Bar = 10 µm.
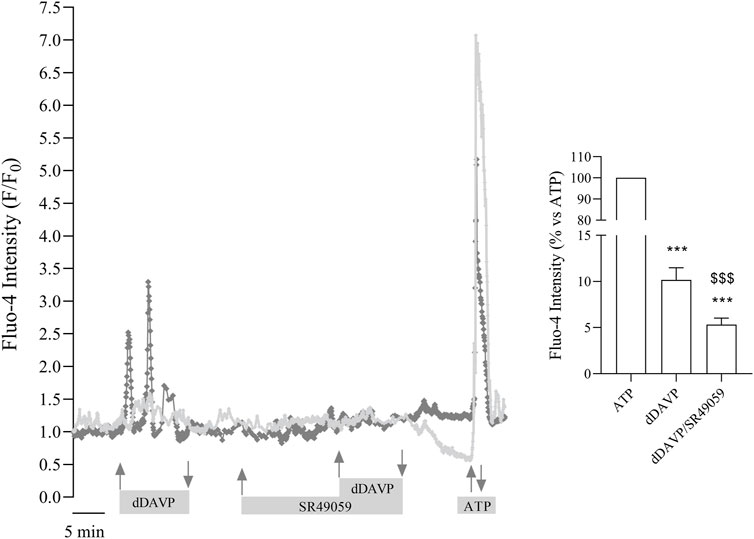
FIGURE 2. Functional characterization of endogenous V1aR receptors in HCT8 cells. Cells were stimulated with 1 µM dDAVP or with 1 µM dDAVP and 100 nM SR49059, a V1aR antagonist. ATP (100 µM) stimulation was used as a positive control. dDAVP significantly increased cytosolic calcium. Stimulation with dDAVP in the presence of 100 nM SR49059 prevented the effect of dDAVP raising cytosolic calcium. Data are expressed as means ± S.E.M. and analyzed by one-way ANOVA followed by Tukey’s multiple Comparisons test (***p < 0.001 vs. ATP; $$$p < 0.001 vs. dDAVP).
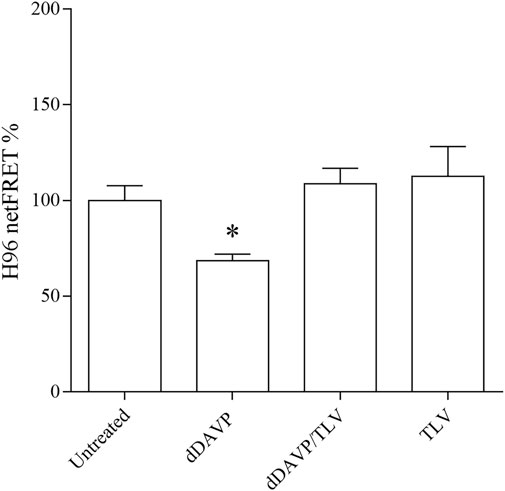
FIGURE 3. Functional characterization of endogenous V2R receptor in HCT8 cells. cAMP levels were evaluated by FRET experiments in HCT8 cells transiently transfected with H96, as described in the Methods section. 5 min of stimulation with 100 nM dDAVP significantly reduced the netFRET signals consistent with a significant increase in the cAMP levels compared with untreated cells. Data are expressed as means ± S.E.M. and analyzed by one-way ANOVA followed by Dunnett’s Multiple Comparison test (*p < 0.05 vs. untreated).
dDAVP Action on AQP3 Expression and Function
To test the possible involvement of dDAVP on AQP3 expression, Real-Time PCR experiments were performed (Figure 4). Cells were left untreated or incubated with DMSO as vehicle control. Alternatively, cells were stimulated with dDAVP or cotreated with dDAVP and tolvaptan (dDAVP/TLV) or with dDAVP and SR49059 (dDAVP/SR49059). Compared to untreated condition, stimulation with dDAVP significantly increases AQP3 mRNA expression (dDAVP = 1.23 ± 0.11 vs. untreated = 1.0 ± 0.02; n = 6). Importantly, cotreatment with dDAVP and SR49059 also increased AQP3 mRNA expression (dDAVP/SR49059 = 1.33 ± 0.06 vs. untreated = 1.0 ± 0.02, DMSO = 1.07 ± 0.03; n = 6), suggesting that the dDAVP-induced AQP3 expression is not regulated by V1aR signaling. By contrast, treatment with tolvaptan prevented the increase of AQP3 induced by dDAVP stimulation (dDAVP/TLV = 0.99 ± 0.04 vs. untreated = 1.0 ± 0.02, DMSO = 1.07 ± 0.03; n = 6), likely indicating that the increase of the AQP3 mRNA is dependent on V2R stimulation. No relevant change in AQP3 protein abundance was found under treatment with dDAVP (Supplementary Figure S1). Also, immunocytochemistry revealed that AQP3 is mainly expressed in the plasma membranes (Figure 5). However, a slight reduction of the membrane-stained AQP3 was detected in HCT8 cells treated with dDAVP or with dDAVP and tolvaptan (dDAVP/TLV). Whereas, the AQP3 staining in cells treated with dDAVP and SR49059 is similar to that observed in untreated cells. To further investigate the action of dDAVP on AQP3 function, glycerol uptake was measured using a calcein-based assay (Figure 6). Stimulation with dDAVP significantly reduced the temporal osmotic response (reported as 1/τ) generated using a glycerol hyperosmotic solution (dDAVP = 62.46 ± 3.27, n = 87 cells vs. untreated = 100 ± 2.72, n = 428 cells). Similar results were obtained in cells treated with dDAVP and tolvaptan (dDAVP/TLV = 65.49 ± 2.56, n = 108 cells vs. untreated = 100 ± 2.72, n = 428 cells; DMSO = 94.14 ± 4.18, n = 181 cells). By contrast, selective inhibition of the V1aR, with SR49059, prevented the dDAVP action on glycerol intake rate (dDAVP/SR49059 = 96.04 ± 4.15, n = 160 cells vs. untreated = 100 ± 2.72, n = 428 cells; DMSO = 94.14 ± 4.18, n = 181 cells). Data are also summarized in Table 1. Parallel studies, however, revealed that dDAVP treatment slightly increased the water transport rate which might be due to the endogenous expression of the classical water channels AQP1, AQP4, and AQP5 (Supplementary Figure S2). Glycerol is an important metabolite playing a role in controlling cell growth and proliferation (Méndez-Giménez et al., 2014). In non-small cells, lung cancer downregulation of AQP3 is associated with a relevant suppression of cell growth (Xia et al., 2014). Moreover, dDAVP displays antimetastatic properties in a mouse model of mammary cancer (Alonso et al., 1999; Giron et al., 2002) and antiproliferative action in colon carcinoma cell lines (Ripoll et al., 2010). Here, the effect of dDAVP on cell viability was tested by the crystal violet assay (Table 1; Figure 7) in HCT8 cells. Compared to the control condition, treatment with dDAVP significantly reduced cell viability (dDAVP = 71.14 ± 3.38% vs. untreated = 100 ± 6.55%; n = 6). Similar observations were obtained in cells treated with dDAVP and tolvaptan (dDAVP/TLV = 64.59 ± 6.09% vs. untreated = 100 ± 6.55%, DMSO = 106.3 ± 7.00%; n = 6). Conversely, incubation with SR49059 abolished the effect of dDAVP on cell viability (dDAVP/SR49059 = 102.9 ± 3.70%; n = 6). To further investigate the action of dDAVP on cell growth, HCT8 cells were seeded and treated, as described in the methods. The total area of the growth cells was stained with 0.2% Coomassie Blue solution and measured using Metamorph software (Table 1; Figure 8). Compared to untreated cells, dDAVP significantly decreased the total growth area (dDAVP = 47.07 ± 3.00% vs. untreated = 100 ± 6.51%; n = 6). Similar observations were obtained in cells treated with dDAVP and tolvaptan (dDAVP/TLV = 46.12 ± 4.13% vs. untreated = 100 ± 6.51%, DMSO = 89.54 ± 5.13%; n = 6). Incubation with SR49059 prevented the action of dDAVP on cell viability (dDAVP/SR49059 = 86.16 ± 6.63%; n = 6). Moreover, dDAVP treatment did not alter the abundance of pCNA, a known proliferation marker (Supplementary Figure S3).
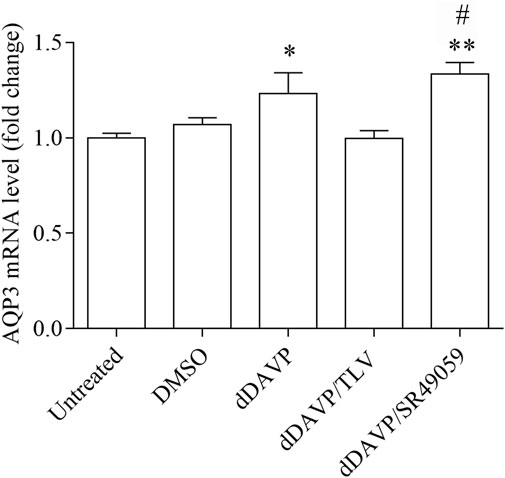
FIGURE 4. AQP3 gene expression in HCT8 cells. Real-Time PCR was performed as described in the Methods. Treatment with dDAVP significantly increased AQP3 mRNA level compared with untreated cells. Cotreatment with dDAVP and SR49059 significantly increased AQP3 mRNA compared to untreated cells. By contrast, cotreatment with dDAVP and tolvaptan did not alter the AQP3 mRNA level. Data are shown as mean ± S.E.M. of 6 independent experiments and analyzed by one-way ANOVA followed by Dunnett’s Multiple Comparison test (*p < 0.05 and **p < 0.01 vs. untreated; #p < 0.05 vs. DMSO).
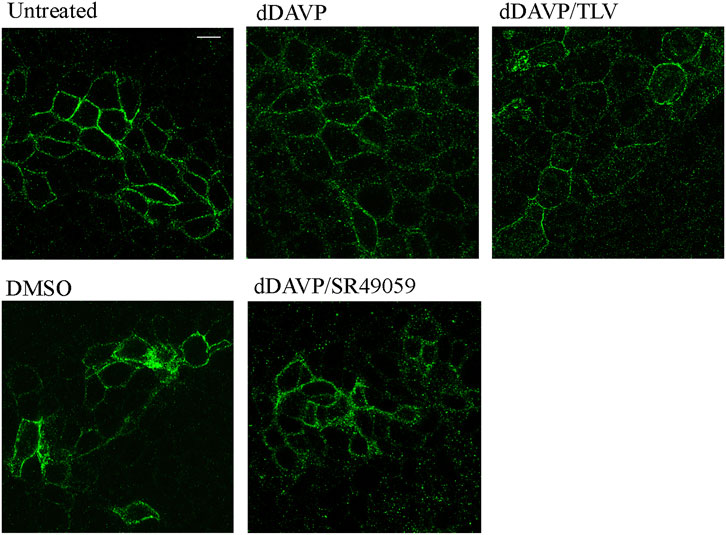
FIGURE 5. Immunofluorescence localization of AQP3 in HCT8 cells. HCT8 cells were treated (as described in the methods section), stained for AQP3, and subjected to confocal laser scanning microscopy. Under basal conditions, AQP3 staining was mainly in the plasma membrane. Treatment with dDAVP or with dDAVP and tolvaptan caused a slight reduction of the AQP3 membrane localization. Bar = 10 µm.
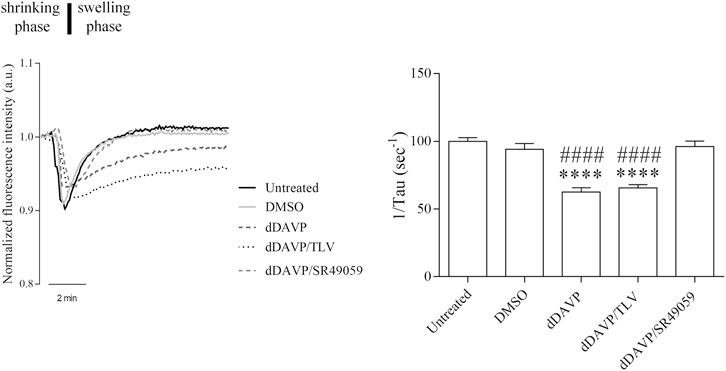
FIGURE 6. Effect of Vasopressin receptors on glycerol permeability. Osmotically induced volume changes recorded by the calcein-quenching method in HCT8 cells exposed to dDAVP stimulation or cotreated with V1aR antagonist (dDAVP/TLV) or VR2 antagonist (dDAVP/SR49059) compared to control conditions (untreated, DMSO). On the left, a representative time course of cell shrinking (water exit) followed by cell swelling indicative of the osmotic influx of water promoted by glycerol entry along its gradient (Δ 100 mOsm/L). On the right, a bar plot showing the mean ± S.E.M. values of the cell swelling time constants (1/τ, s-1) reflecting glycerol entry into the cells. Note that the treatment with 100 nM dDAVP significantly reduced glycerol permeability. A comparable effect was observed after cotreatment with 100 nM dDAVP and 100 nM tolvaptan for 72 h. By contrast, treatment with 100 nM SR49059 for 72 h prevented the dDAVP effect on glycerol uptake. Data are obtained from 35 to 56 different measurements of 3 independent experiments. A one-way ANOVA and Dunnett’s Multiple Comparison test were performed (****p < 0.0001 vs. untreated; ####p < 0.0001 vs. DMSO).

TABLE 1. Glycerol permeability, cell viability and total area of cell. Values represent the mean ± S.E.M. and analyzed by one-way ANOVA followed by Dunnett’s Multiple Comparison test. *Significantly different versus Untreated (****p < 0.0001, **p < 0.01, *p < 0.05). #Significantly different versus DMSO (####p < 0.0001, ###p < 0.001, ##p < 0.01).
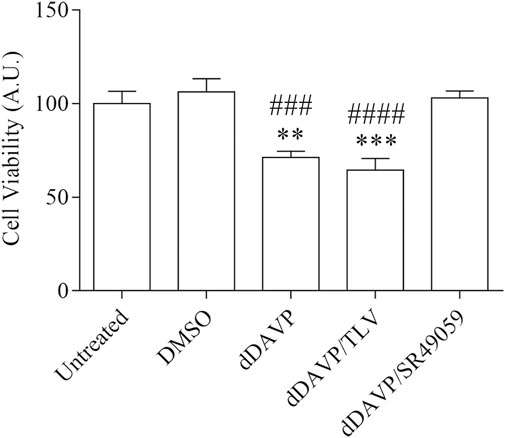
FIGURE 7. Effect of Vasopressin receptors on cell viability. Cells were left under basal conditions or treated as described in the methods section and were stained with crystal violet solution. Treatment with 100 nM dDAVP significantly reduced cell viability compared with untreated cells. The same effect was observed in cells treated with 100 nM dDAVP and 100 nM tolvaptan for 72 h. In contrast, stimulation with 100 nM SR49059 did not affect dDAVP cell viability. Data are presented as means ± S.E.M. of six independent experiment and analyzed by one-way ANOVA followed by Dunnett’s Multiple Comparison test (**p < 0.01 and ***p < 0.001 vs. untreated; ###p < 0.001 and ####p < 0.0001 vs. DMSO).
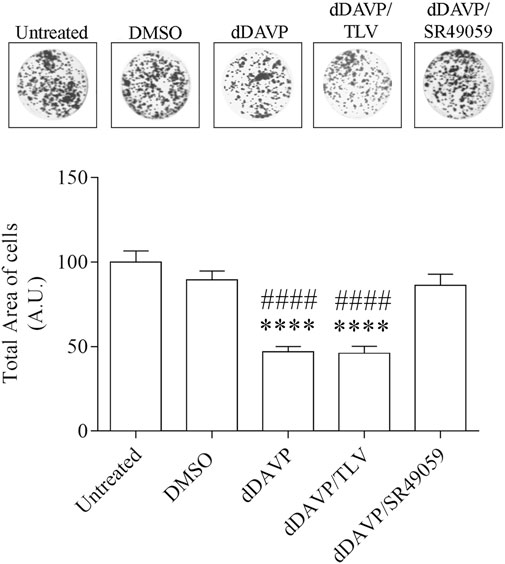
FIGURE 8. Effect of Vasopressin receptors on cell growth. Cells were left under basal conditions or treated as described in the methods section, stained with 0.2% Coomassie Blue solution, and the total area of the growth cells was measured using Metamorph software. Compared to untreated cells, treatment with dDAVP significantly decreased the cell total growth area. A similar effect was observed when cells were treated with 100 nM dDAVP and 100 nM tolvaptan for 72 h. Incubation with 100 nM SR49059 abolished the effect of dDAVP on cell growth. Data are presented as means ± S.E.M. of 6 independent experiments and analyzed by one-way ANOVA followed by Dunnett’s Multiple Comparison test (****p < 0.0001 vs. untreated; ####p < 0.0001 vs. DMSO).
To evaluate whether the reduction of glycerol permeability observed under dDAVP stimulation can be ascribed to AQP3 function, glycerol uptake was measured in the presence of DFP00173, a selective inhibitor of AQP3 (Table 1; Figure 9). Incubation with DFP00173 abolished the effect exerted by SR49059 on dDAVP stimulation (dDAVP/SR49059/DFP00173 = 42.30 ± 1.57%, n = 138 vs. dDAVP/SR49059 = 96.04 ± 4.15%, n = 160) suggesting that AQP3 is committed for glycerol transport under these conditions. Crystal violet assay (Figure 10, dDAVP/SR49059/DFP00173 = 76.42 ± 2.99% vs. dDAVP/SR49059 = 102.9 ± 3.70%; n = 6) and the test to evaluate the total area of growth cells (Figure 11, dDAVP/SR49059/DFP00173 = 50.23 ± 1.82%, n = 3 vs. dDAVP/SR49059 = 86.16 ± 6.63%, n = 6) revealed and confirmed that selective inhibition of AQP3 using DFP00173 prevented the SR49059 action on dDAVP treatment.
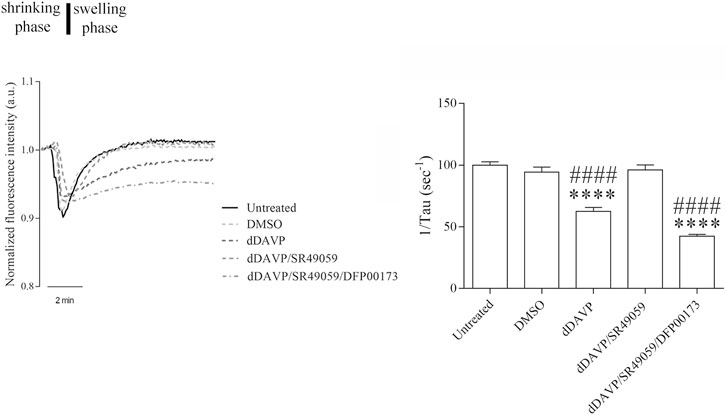
FIGURE 9. Effect of AQP3 on glycerol permeability. Cells were grown, treated, and then labeled with calcein as described in the Methods section. The histogram shows that treatment with 2.5 µM DFP00173 for 48 h prevented the SR49059 action on dDAVP stimulation. Data are presented as means ± S.E.M. of 3 independent experiments and analyzed by one-way ANOVA followed by Dunnett’s Multiple Comparison test (****p < 0.0001 vs. Untreated; ####p < 0.0001 vs. DMSO).
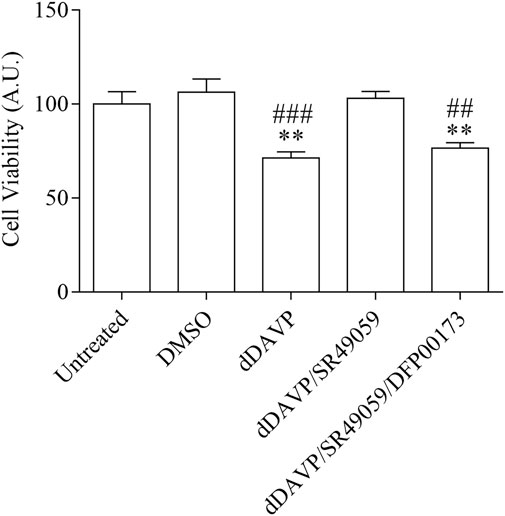
FIGURE 10. Effect of AQP3 on cell viability. Cells were left under basal conditions or treated as described in the methods section and were stained with crystal violet solution. Compared to untreated cells, treatment with 2.5 µM DFP00173 for 48 h prevented the SR49059 action on dDAVP treatment. Data are presented as means ± S.E.M. of 6 independent experiments and analyzed by one-way ANOVA followed by Dunnett’s Multiple Comparison test (**p < 0.01 vs. untreated; ##p < 0.01 and ###p < 0.001 vs. DMSO).
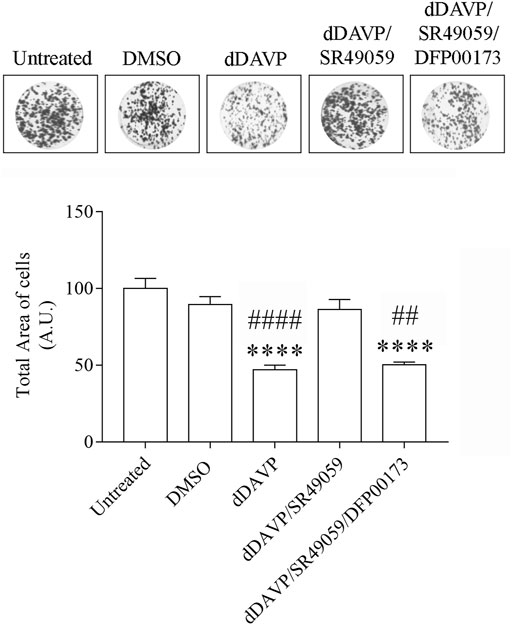
FIGURE 11. Effect of AQP3 on cell growth. Cells were left under basal conditions or treated as described in the methods section, stained with 0.2% Coomassie Blue solution, and the total area of the growth cells was measured using Metamorph software. Compared to untreated cells, treatment with 2.5 µM DFP00173 for 48 h prevented the SR49059 action on dDAVP treatment. Data are presented as means ± S.E.M. of 3 independent experiments and analyzed by one-way ANOVA followed by Dunnett’s Multiple Comparison test (****p < 0.0001 vs. untreated; ##p < 0.01 and ####p < 0.0001 vs. DMSO).
Expression of VRs and AQP3 in Human Colon Carcinoma Biopsies and RNA-Seq Analysis
Specimens of neoplastic colon tissues and part of normal mucosa obtained from four patients were analyzed to investigate the expression of VRs and AQP3. Real-Time PCR experiments (Figure 12) showed significant downregulation of the V1aR expression in the tumor biopsies compared with the corresponding healthy mucosa (Figure 12A, N = 1.0 vs. T = 0.33 ± 0.14; n = 4). By contrast, no relevant changes were found in the expression of V2R (Figure 12B, N = 1.0 vs. T = 0.88 ± 0.72; n = 4) and AQP3 (Figure 12C, N = 1.0 vs. T = 1.66 ± 1.03; n = 4). Similar observations were obtained by immunoblotting studies showing that compared with normal colon mucosa, in tumors specimens V1aR protein expression significantly decreased (Figure 13A, N = 100 vs. T = 48.63 ± 4.95; n = 4) while no significant alterations in the abundance of V2R (Figure 13B, N = 100 vs. T = 69.34 ± 16.82; n = 4) and AQP3 (Figure 13C, N = 100 vs. T = 125.1 ± 45.58; n = 4) were detected.
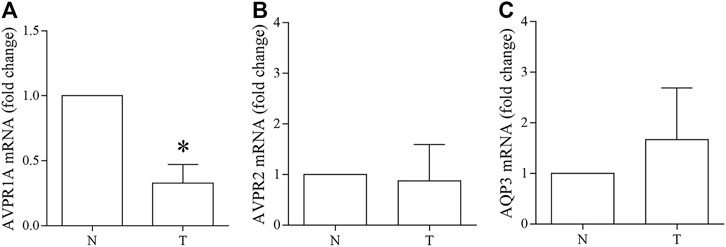
FIGURE 12. Vasopressin receptors and AQP3 gene expression in human colon carcinoma biopsies. Real-Time PCR was performed as described in the methods (A) Real-time PCR experiments show that the V1aR expression is significantly downregulated in the tumor biopsies compared with the corresponding healthy mucosa. (B–C) No relevant changes were found in the expression of V2R and AQP3. Data are shown as mean ± S.E.M. and analyzed by Student’s t-test (*p < 0.05 vs. untreated).
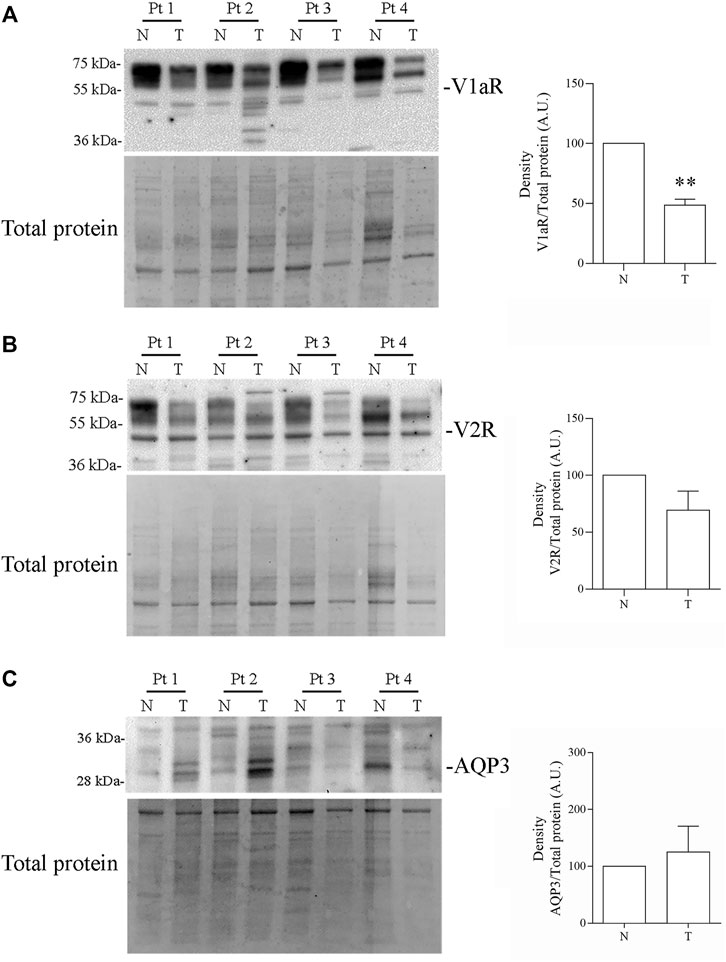
FIGURE 13. Expression of Vasopressin receptors and AQP3 in human colon biopsy. Equal amount of proteins (20 µg) of total homogenates from human colon biopsies were blotted and probed with the indicated antibodies. (A) Immunodetection revealed that V1aR protein expression is significantly decreased in tumors compared to the normal colon mucosa. (B–C) Immunodetection revealed that V2R and AQP3 protein expression is not altered in human colon adenocarcinoma. Data are shown as mean ± S.E.M. and analyzed by Student’s t-test (**p < 0.01 vs. normal colon mucosa).
Because of the small number of available human biopsies and to further validate the obtained data, publicly available pre-analyzed gene expression data were downloaded for a total of 288 primary colon tumors from the TCGA RNA-Seq dataset and compared with 308 normal colon controls (GTExproject). Both genes AVPR1A and AVPR2 were significantly (Mann-Whitney p-value <0.0001) down-regulated in tumors, while AQP3 showed an opposite trend (Figure 14).
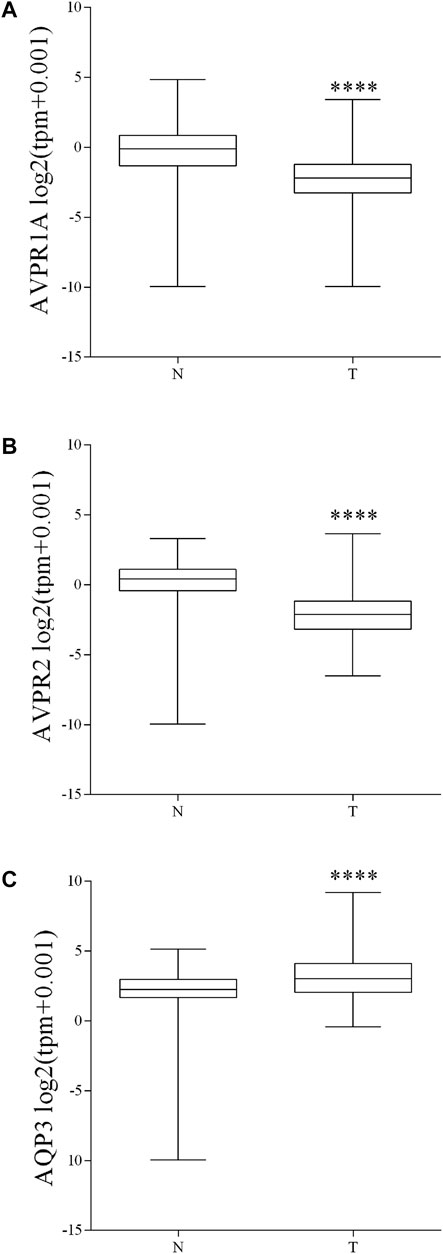
FIGURE 14. Expression of Vasopressin receptors and AQP3 genes in human colon adenocarcinoma. Publicly available pre-analyzed gene expression (tpm) data from 288 primary colon tumors and 308 normal colon controls were downloaded and plotted as distribution in log2 (tpm+0.001) values. (A–B) Bioinformatic analysis of RNA-Seq showed that in colon cancer, gene expression of vasopressin receptors is significantly decreased. (C) Bioinformatic analysis of RNA-Seq showed that AQP3 gene expression is significantly increased in colon cancer compared to the normal colonic mucosa. Data are reported as box plot and analyzed by two-tailed Mann Whitney U test (****p < 0.0001).
Discussion
The major finding of this study is that the hormone vasopressin controls the expression and the function of AQP3 in human colon carcinoma cells. Specifically, long-term treatment with dDAVP increases AQP3 mRNA expression through V2R and decreases AQP3-mediated glycerol transport through V1aR signaling. Physiologically, vasopressin receptors are widely expressed in different tracts of the gastrointestinal tube including the colon (Monstein et al., 2008). Neoplastic tissue can express normal and abnormal forms of vasopressin and VRs which may exert distinct actions on cancer growth and metabolism (North, 2000) and a differentiated sensitivity to vasopressin (North et al., 1997). In MCF-7 breast cancer cells, an abnormal V2R mRNA coding for a V2R mutant has been detected. This mRNA contains a stop codon within the reading frame and therefore leads to a C-terminally truncated receptor similar to that causing the nephrogenic diabetes insipidus (Rosenthal et al., 1994). Loss-of-function mutants of V2R are often located intracellularly and may also form heterodimers with wildtype V2R (Zhu and Wess, 1998) and V1aR (Terrillon et al., 2004). VRs mutants might be likely considered sponges for normal receptors and then act as negative regulators for VRs localization and function (Zhu and Wess, 1998; Terrillon et al., 2004). Moreover, the selectivity of the VRs antagonists, respect to these abnormal forms of VRs is unknown at moment. Immunolocalization experiments showed that V2R staining is widely distributed within the entire cells likely suggesting the expression of a non-canonical form of V2R, beyond the normal V2R and that may render the effect of vasopressin on cells expressing these receptors multifaceted. Also, western blotting studies reveal several few bands in HCT8 cells and tumor specimens compared with the healthy mucosa obtained from the same patient likely proposing the expression of post-translationally modified proteins or altered variants of the receptors. The possible expression and function of putative VRs variants have not been clarified here, nevertheless, in the present study, we report that HCT8 cells express functional V1a and V2 receptors which are sensitive to the action of dDAVP. dDAVP is a stable analog of vasopressin and it is widely applied clinically to treat bleeding disorders, nocturnal polyuria, and central diabetes insipidus due to the antidiuretic properties mediated by the V2R (Mannucci, 1997; Kapić et al., 2005; Weiss and Everaert, 2019). However, affinity binding assays showed that dDAVP exhibits differences in the affinity binding across species (Chini and Manning, 2007). dDAVP displayed a higher affinity for V2R in rats than in humans. In human receptor assays, dDAVP displays selectivity for V2R, V1aR, and V1bR (Cheng et al., 2004; Chini and Manning, 2007). Here, treatment with dDAVP increases the expression level of mRNA AQP3 through V2R but not via V1aR as demonstrated by using selective VRs antagonists. These findings, also, underline the distinct and opposite responses of the VRs to dDAVP action in terms of AQP3 mRNA expression level. Long-term regulation of AQP3 expression is complex and involves several transcription factors (Yde et al., 2021). In the context of inflammation, cytokines, and growth factors, such as IFNγ, TNFα, and hEGF can modulate AQP3 expression. In HT29 cells, IFNγ and TNFα reduce AQP3 expression through STAT1 and SP3 respectively (Peplowski et al., 2017; Peplowski et al., 2018). Conversely, in human colorectal carcinoma cells HCT116, hEGF upregulates AQP3 expression through PI3K/AKT signaling (Li et al., 2013). Furthermore, Mg2+ and the vasoactive intestinal polypeptide (VIP) upregulate AQP3 expression in a cAMP-dependent manner by involving the cAMP response element-binding protein (CREB) (Itoh et al., 2003; Okahira et al., 2008). In this study, however, the possible involvement of transcription factors in controlling the dDAVP dependent AQP3 expression was not investigated but based on the data obtained with the VRs antagonists, we might propose that the increase in AQP3 expression elicited by dDAVP is dependent on a cAMP/PKA pathway.
Colon epithelium is mainly involved in water reabsorption through the paracellular route or the transcellular pathway via aquaporins (Iwata et al., 1997; Liao et al., 2021). Several studies report that AQP3 may play a key role in intestinal water uptake. A significant decrease in AQP3 protein abundance has been described in rectosigmoid specimens obtained by patients with diarrhea-predominant irritable bowel syndrome (IBS-D) compared with healthy subjects (Camilleri et al., 2019). However, our study shows that treatment with dDAVP does not alter the protein abundance of AQP3 despite the increase of the AQP3 mRNA. The discrepancy in AQP3 mRNA expression compared with AQP3 protein abundance has been found also in colonic epithelial cells isolated from rats fed with cholic acid (Yde et al., 2016) and might be due to post-transcriptional, or post-translational regulation mechanisms, and even the gating of the channel (Zeuthen and Klaerke, 1999) which might explain the reduction in glycerol permeability observed under dDAVP stimulation. On another hand, the intracellular trafficking of AQP3 might be controlled by a complex network of kinases such as PKC (Yasui et al., 2008). Alternatively, it cannot be excluded that the total abundance of AQP3 might be the result of two opposite forces mediated by V2R and V1aR respectively. In this respect, it has been shown that V1aR can limit the functions mediated by V2R (Bankir, 2001; Izumi et al., 2008).
In this study, incubation with dDAVP slightly but significantly increases the osmotic water permeability which might be not due to AQP3 that is instead functionally downregulated. Other aquaporins including AQP1, AQP4, and AQP5, that are expressed in HCT8 cells, might be involved in dDAVP dependent water transport. Further investigation is needed to clarify this aspect. On the other hand, functional studies reveal that treatment with dDAVP significantly decreases the glycerol uptake through V1aR. Glycerol is a key substrate for cell metabolism and is required for gluconeogenesis and lipid synthesis. However, whether the AQP3-dependent glycerol transport correlates with metabolic disorders and cancer progression remains to be better clarified (Li et al., 2016; Calamita et al., 2018). In gastric cells, inhibition of AQP3 reduces cell proliferation possibly via the PI3K/Akt pathway (Li et al., 2016). In this study, stimulation with dDAVP impairs cell growth regardless of V2R function. Also, we could not detect any significant changes in the expression level of PCNA, a known marker of cell proliferation. Conversely, specific inhibition of V1aR with SR49059 prevents the inhibitory action of dDAVP on cell growth. Inhibition of AQP3 with DFP00173 unmasks the inhibitory action of SR49059 on V1aR, likely supporting the notion that the effect of dDAVP on cell viability, mediated by V1aR signaling, occurs through inhibition of AQP3. In this respect, the incubation with DFP00173 alone also reduced the glycerol rate intake and cell growth (Table 1), likely suggesting AQP3 as a selective downstream effector of the combined actions of V1aR and V2R.
In the liver and renal polycystic disease, vasopressin increases the intracellular level of cAMP and cell proliferation (Wang et al., 2008; Mancinelli et al., 2016) via V2R signals. Targeting the V2R with tolvaptan has been, therefore, proposed for the therapeutical treatment of the autosomal dominant polycystic kidney disease (ADPKD) and renal carcinoma (van Gastel and Torres, 2017; Sinha et al., 2020). By contrast, in adrenocortical tumor cells, vasopressin blocks the cell cycle and reduces cell growth by inhibiting cyclin D1 (Schwindt et al., 2003). Adrenal tumors overexpress V1 receptors (Gagliardi et al., 2009). In adrenocortical carcinoma cells, stimulation with vasopressin, through V1R promotes cell senescence via RhoA signaling (Forti and Armelin, 2007). On another hand, dDAVP has been proposed to reduce tumor angiogenesis (Ripoll et al., 2013) and for the treatment of osteosarcoma, breast, and colon cancers for its ability to reduce cell growth and colony cell formation through V2R. Nevertheless, in these studies the expression and function of the V1aR have not been tested (Ripoll et al., 2010; Ripoll et al., 2013; Sobol et al., 2021), although vasopressin receptors, V1aR and V2R, are both expressed in neoplastic tissues, including colon mucosa (North, 2000). Inline, Real-Time PCR, and western blotting studies identified both VRs in HCT8 cells and colon cancer specimens. These findings were further supported by RNA-seq analysis showing that neoplastic colon specimens express VRs and AQP3. Although, RNAseq studies do not provide the relative expression of V1aR, V2R, and AQP3 in matching normal and tumor tissues from the same patient. However, the low number of biopsies does not allow us to propose a possible correlation between the relative expression of VRs and AQP3 functionality in the same tumor sample, which might be useful to design a therapeutic strategy and possibly to propose a classification of colon diseases based on differences in the expression and function of VRs and AQP3. To conclude in the present study, the action of dDAVP on human colon cells has been investigated by analyzing the relative contribution of V1aR and V2R on AQP3 expression and function using selective VRs antagonists. These findings indeed propose AQP3 as an effector of the orchestrated functions of V1aR and V2R. Several questions remain still open and needed to be further investigated. Nevertheless, the obtained data suggest that the AVP-dependent AQP3 pathway might represent a novel target in colon diseases associated with abnormal cell growth.
Data Availability Statement
The original contributions presented in the study are included in the article/Supplementary Material, further inquiries can be directed to the corresponding author.
Ethics Statement
The studies involving human participants were reviewed and approved by the Ethical Committee of the University of Pisa (Protocol # 9989 from 2-20-2019). The patients/participants provided their written informed consent to participate in this study.
Author Contributions
Conceptualization, MC, GT, and GV; Methodology, MC, MD, MM, PF, and PL; Investigation, GT, AD, MR, DS, and MV; Writing, GT, MC, MR, MD, and MM; Funding acquisition, GT. All authors have read and agree to the published version of the manuscript.
Funding
This work was supported by a project PRIN (2017R5ZE2C_002) to GT.
Conflict of Interest
The authors declare that the research was conducted in the absence of any commercial or financial relationships that could be construed as a potential conflict of interest.
The handling editor SD declared a past collaboration with the author GT.
Publisher’s Note
All claims expressed in this article are solely those of the authors and do not necessarily represent those of their affiliated organizations, or those of the publisher, the editors and the reviewers. Any product that may be evaluated in this article, or claim that may be made by its manufacturer, is not guaranteed or endorsed by the publisher.
Acknowledgments
We acknowledge Prof. Luana Poeta for her critical reading of the paper.
Supplementary Material
The Supplementary Material for this article can be found online at: https://www.frontiersin.org/articles/10.3389/fcell.2022.919438/full#supplementary-material
References
Aburada, T., Ikarashi, N., Kagami, M., Ichikawa, Y., Sugitani, M., Maniwa, A., et al. (2011). Byakkokaninjinto Prevents Body Water Loss by Increasing the Expression of Kidney Aquaporin-2 and Skin Aquaporin-3 in KKAy Mice. Phytother. Res. 25 (6), 897–903. doi:10.1002/ptr.3358
Alonso, D. F., Skilton, G., Farías, E. F., Joffé, E. B. d. K., and Gomez, D. E. (1999). Antimetastatic Effect of Desmopressin in a Mouse Mammary Tumor Model. Breast Cancer Res. Treat. 57 (3), 271–275. doi:10.1023/a:1006291607871
Bankir, L. (2001). Antidiuretic Action of Vasopressin: Quantitative Aspects and Interaction between V1a and V2 Receptor-Mediated Effects. Cardiovasc Res. 51 (3), 372–390. doi:10.1016/s0008-6363(01)00328-5
Birnbaumer, M., Gilbert, S., and Rosenthal, W. (1994). An Extracellular Congenital Nephrogenic Diabetes Insipidus Mutation of the Vasopressin Receptor Reduces Cell Surface Expression, Affinity for Ligand, and Coupling to the Gs/adenylyl Cyclase System. Mol. Endocrinol. 8 (7), 886–894. doi:10.1210/mend.8.7.7984150
Boone, M., and Deen, P. M. T. (2008). Physiology and Pathophysiology of the Vasopressin-Regulated Renal Water Reabsorption. Pflugers Arch. - Eur. J. Physiol. 456 (6), 1005–1024. doi:10.1007/s00424-008-0498-1
Briley, E. M., Lolait, S. J., Axelrod, J., and Felder, C. C. (1994). The Cloned Vasopressin V1a Receptor Stimulates Phospholipase A2, Phospholipase C, and Phospholipase D through Activation of Receptor-Operated Calcium Channels. Neuropeptides 27 (1), 63–74. doi:10.1016/0143-4179(94)90017-5
Cabrijan, T., Skreb, F., and Susković, T. (1985). Syndrome of Inappropriate Secretion of Anti-diuretic Hormone (SIADH) Produced by an Adenocarcinoma of the Colon. Report of One Case. Endocrinologie 23 (3), 213–216.
Calamita, G., Perret, J., and Delporte, C. (2018). Aquaglyceroporins: Drug Targets for Metabolic Diseases? Front. Physiol. 9, 851. doi:10.3389/fphys.2018.00851
Camilleri, M., Carlson, P., Chedid, V., Vijayvargiya, P., Burton, D., and Busciglio, I. (2019). Aquaporin Expression in Colonic Mucosal Biopsies from Irritable Bowel Syndrome with Diarrhea. Clin. Transl. Gastroenterology 10 (4), e00019. doi:10.14309/ctg.0000000000000019
Carter, D. A., Fai, C. K., and Murphy, D. (1993). Neurohypophyseal Peptides as Regulators of Growth and Development. J. Mol. Neurosci. 4 (1), 11–19. doi:10.1007/bf02736686
Centrone, M., D’Agostino, M., Difonzo, G., De Bruno, A., Di Mise, A., Ranieri, M., et al. (2020a). Antioxidant Efficacy of Olive By-Product Extracts in Human Colon HCT8 Cells. Foods 10 (1), 11. doi:10.3390/foods10010011
Centrone, M., Gena, P., Ranieri, M., Di Mise, A., D’Agostino, M., Mastrodonato, M., et al. (2020b). In Vitro and In Vivo Nutraceutical Characterization of Two Chickpea Accessions: Differential Effects on Hepatic Lipid Over-Accumulation. Antioxidants 9 (3), 268. doi:10.3390/antiox9030268
Cheng, L. L., Stoev, S., Manning, M., Derick, S., Pena, A., Mimoun, M. B., et al. (2004). Design of Potent and Selective Agonists for the Human Vasopressin V1b Receptor Based on Modifications of [Deamino-Cys]arginine Vasopressin at Position 4. J. Med. Chem. 47 (9), 2375–2388. doi:10.1021/jm030611c
Chini, B., and Manning, M. (2007). Agonist Selectivity in the Oxytocin/vasopressin Receptor Family: New Insights and Challenges. Biochem. Soc. Trans. 35 (Pt 4), 737–741. doi:10.1042/bst0350737
Corciulo, S., Nicoletti, M. C., Mastrofrancesco, L., Milano, S., Mastrodonato, M., Carmosino, M., et al. (2019). AQP1-Containing Exosomes in Peritoneal Dialysis Effluent As Biomarker of Dialysis Efficiency. Cells 8 (4), 330. doi:10.3390/cells8040330
Di Giusto, G., Flamenco, P., Rivarola, V., Fernández, J., Melamud, L., Ford, P., et al. (2012). Aquaporin 2-increased Renal Cell Proliferation Is Associated with Cell Volume Regulation. J. Cell. Biochem. 113 (12), 3721–3729. doi:10.1002/jcb.24246
Di Mise, A., Venneri, M., Ranieri, M., Centrone, M., Pellegrini, L., Tamma, G., et al. (2019). Lixivaptan, a New Generation Diuretic, Counteracts Vasopressin-Induced Aquaporin-2 Trafficking and Function in Renal Collecting Duct Cells. Int. J. Mol. Sci. 21 (1), 183. doi:10.3390/ijms21010183
Forti, F. L., and Armelin, H. A. (2011). Arginine Vasopressin Controls p27Kip1 Protein Expression by PKC Activation and Irreversibly Inhibits the Proliferation of K-Ras-dependent Mouse Y1 Adrenocortical Malignant Cells. Biochimica Biophysica Acta (BBA) - Mol. Cell Res. 1813 (8), 1438–1445. doi:10.1016/j.bbamcr.2011.04.007
Forti, F. L., and Armelin, H. A. (2007). Vasopressin Triggers Senescence in K-Ras Transformed Cells via RhoA-dependent Downregulation of Cyclin D1. Endocr. Relat. Cancer 14 (4), 1117–1125. doi:10.1677/erc-07-0154
Gagliardi, L., Hotu, C., Casey, G., Braund, W. J., Ling, K.-H., Dodd, T., et al. (2009). Familial Vasopressin-Sensitive ACTH-independent Macronodular Adrenal Hyperplasia (VPs-AIMAH): Clinical Studies of Three Kindreds. Clin. Endocrinol. (Oxf) 70 (6), 883–891. doi:10.1111/j.1365-2265.2008.03471.x
Giron, S., Tejera, A. M., Ripoll, G. V., Gomez, D. E., and Alonso, D. F. (2002). Desmopressin Inhibits Lung and Lymph Node Metastasis in a Mouse Mammary Carcinoma Model of Surgical Manipulation. J. Surg. Oncol. 81 (1), 38–44. doi:10.1002/jso.10141
Gregoire, F., Lucidi, V., Zerrad-Saadi, A., Virreira, M., Bolaky, N., Delforge, V., et al. (2015). Analysis of Aquaporin Expression in Liver with a Focus on Hepatocytes. Histochem Cell Biol. 144 (4), 347–363. doi:10.1007/s00418-015-1341-3
Gupta, A., Sasarula, S., and Rao, P. V. (1986). The Syndrome of Inappropriate Secretion of Antidiuretic Hormone in a Case of Carcinoma of the Breast. J. Assoc. Physicians India 34 (6), 441–442.
Heasley, L. E. (2001). Autocrine and Paracrine Signaling through Neuropeptide Receptors in Human Cancer. Oncogene 20 (13), 1563–1569. doi:10.1038/sj.onc.1204183
Itoh, A., Tsujikawa, T., Fujiyama, Y., and Bamba, T. (2003). Enhancement of Aquaporin-3 by Vasoactive Intestinal Polypeptide in a Human Colonic Epithelial Cell Line. J. Gastroenterol. Hepatol. 18 (2), 203–210. doi:10.1046/j.1440-1746.2003.02949.x
Iwata, G., Iwai, N., and Nose, H. (1997). Segmental Difference of Water and Electrolyte Transport in Rat Colon in Vivo. J. Basic Clin. Physiol. Pharmacol. 8 (1-2), 13–29. doi:10.1515/jbcpp.1997.8.1-2.13
Izumi, Y., Nakayama, Y., Memetimin, H., Inoue, T., Kohda, Y., Nonoguchi, H., et al. (2008). Regulation of V2R Transcription by Hypertonicity and V1aR-V2R Signal Interaction. Am. J. Physiology-Renal Physiology 295 (4), F1170–F1176. doi:10.1152/ajprenal.00119.2008
Jayadeep, S., Nandakrishna, B., Varma, M., Vidyasagar, S, Khan, M. F., and Pai, K. (2020). Syndrome of Inappropriate Antidiuretic Hormone Release as the Initial Presentation of Adenocarcinoma of the Colon. J. R. Coll. Physicians Edinb 50 (3), 277–280. doi:10.4997/jrcpe.2020.312
Jung, H. J., Jang, H.-J., and Kwon, T.-H. (2021). Aquaporins Implicated in the Cell Proliferation and the Signaling Pathways of Cell Stemness. Biochimie 188, 52–60. doi:10.1016/j.biochi.2021.04.006
Jung, H. J., Park, J.-Y., Jeon, H.-S., and Kwon, T.-H. (2011). Aquaporin-5: a Marker Protein for Proliferation and Migration of Human Breast Cancer Cells. PLoS One 6 (12), e28492. doi:10.1371/journal.pone.0028492
Kapić, E., Bečić, F., and Todić, M. (2005). Modern Approach in Treatment of Diabetes Insipidus. Bosn J Basic Med Sci 5 (2), 38–42. doi:10.17305/bjbms.2005.3282
Klarenbeek, J. B., Goedhart, J., Hink, M. A., Gadella, T. W. J., and Jalink, K. (2011). A mTurquoise-Based cAMP Sensor for Both FLIM and Ratiometric Read-Out Has Improved Dynamic Range. PLoS One 6 (4), e19170. doi:10.1371/journal.pone.0019170
Kreda, S. M., Gynn, M. C., Fenstermacher, D. A., Boucher, R. C., and Gabriel, S. E. (2001). Expression and Localization of Epithelial Aquaporins in the Adult Human Lung. Am. J. Respir. Cell Mol. Biol. 24 (3), 224–234. doi:10.1165/ajrcmb.24.3.4367
Levin, M. H., and Verkman, A. S. (2006). Aquaporin-3-dependent Cell Migration and Proliferation during Corneal Re-epithelialization. Invest. Ophthalmol. Vis. Sci. 47 (10), 4365–4372. doi:10.1167/iovs.06-0335
Li, A., Lu, D., Zhang, Y., Li, J., Fang, Y., Li, F., et al. (2013). Critical Role of Aquaporin-3 in Epidermal Growth Factor-Induced Migration of Colorectal Carcinoma Cells and its Clinical Significance. Oncol. Rep. 29 (2), 535–540. doi:10.3892/or.2012.2144
Li, J., Zhang, X., He, Q., Feng, W., Ding, L., Wang, Z., et al. (2021). Pancreatic Neuroendocrine Tumor Producing Vasopressin. Med. Baltim. 100 (40), e27453. doi:10.1097/md.0000000000027453
Li, Z., Li, B., Zhang, L., Chen, L., Sun, G., Zhang, Q., et al. (2016). The Proliferation Impairment Induced by AQP3 Deficiency Is the Result of Glycerol Uptake and Metabolism Inhibition in Gastric Cancer Cells. Tumor Biol. 37 (7), 9169–9179. doi:10.1007/s13277-015-4753-8
Liao, S., Gan, L., Lv, L., and Mei, Z. (2021). The Regulatory Roles of Aquaporins in the Digestive System. Genes & Dis. 8 (3), 250–258. doi:10.1016/j.gendis.2019.12.011
Mancinelli, R., Franchitto, A., Glaser, S., Vetuschi, A., Venter, J., Sferra, R., et al. (2016). Vasopressin Regulates the Growth of the Biliary Epithelium in Polycystic Liver Disease. Lab. Invest. 96 (11), 1147–1155. doi:10.1038/labinvest.2016.93
Mannucci, P. M. (1997). Desmopressin (DDAVP) in the Treatment of Bleeding Disorders: the First 20 Years. Blood 90 (7), 2515–2521. doi:10.1182/blood.v90.7.2515.2515_2515_2521
Marlar, S., Jensen, H. H., Login, F. H., and Nejsum, L. N. (2017). Aquaporin-3 in Cancer. Int. J. Mol. Sci. 18 (10), 2106. doi:10.3390/ijms18102106
Méndez-Giménez, L., Rodríguez, A., Balaguer, I., and Frühbeck, G. (2014). Role of Aquaglyceroporins and Caveolins in Energy and Metabolic Homeostasis. Mol. Cell. Endocrinol. 397 (1-2), 78–92. doi:10.1016/j.mce.2014.06.017
Miller, R. L., Sandoval, P. C., Pisitkun, T., Knepper, M. A., and Hoffert, J. D. (2013). Vasopressin Inhibits Apoptosis in Renal Collecting Duct Cells. Am. J. Physiology-Renal Physiology 304 (2), F177–F188. doi:10.1152/ajprenal.00431.2012
Mobasheri, A., and Marples, D. (2004). Expression of the AQP-1 Water Channel in Normal Human Tissues: a Semiquantitative Study Using Tissue Microarray Technology. Am. J. Physiology-Cell Physiology 286 (3), C529–C537. doi:10.1152/ajpcell.00408.2003
Mobasheri, A., Wray, S., and Marples, D. (2005). Distribution of AQP2 and AQP3 Water Channels in Human Tissue Microarrays. J. Mol. Hist. 36 (1-2), 1–14. doi:10.1007/s10735-004-2633-4
Mola, M. G., Nicchia, G. P., Svelto, M., Spray, D. C., and Frigeri, A. (2009). Automated Cell-Based Assay for Screening of Aquaporin Inhibitors. Anal. Chem. 81 (19), 8219–8229. doi:10.1021/ac901526k
Mola, M. G., Saracino, E., Formaggio, F., Amerotti, A. G., Barile, B., Posati, T., et al. (2021). Cell Volume Regulation Mechanisms in Differentiated Astrocytes. Cell Physiol. Biochem. 55 (S1), 196–212. doi:10.33594/000000469
Monstein, H.-J., Truedsson, M., Ryberg, A., and Ohlsson, B. (2008). Vasopressin Receptor mRNA Expression in the Human Gastrointestinal Tract. Eur. Surg. Res. 40 (1), 34–40. doi:10.1159/000108655
Moon, C., Soria, J.-C., Jang, S. J., Lee, J., Hoque, M. O., Sibony, M., et al. (2003). Involvement of Aquaporins in Colorectal Carcinogenesis. Oncogene 22 (43), 6699–6703. doi:10.1038/sj.onc.1206762
Navarro-Almenzar, B., and Perianes, V. C. (2020). Syndrome of Inappropriate Antidiuretic Hormone Secretion in a Patient with Diffuse Large B-Cell Lymphoma. Med. Clínica Engl. Ed. 154 (11), 473. doi:10.1016/j.medcli.2019.06.031
North, W. G., Fay, M. J., and Du, J. (1999). MCF-7 Breast Cancer Cells Express Normal Forms of All Vasopressin Receptors Plus an Abnormal V2R☆. Peptides 20 (7), 837–842. doi:10.1016/s0196-9781(99)00070-4
North, W. G., Fay, M. J., Longo, K., and Du, J. (1997). Functional Vasopressin V1 Type Receptors Are Present in Variant as Well as Classical Forms of Small-Cell Carcinoma. Peptides 18 (7), 985–993. doi:10.1016/s0196-9781(97)00072-7
North, W. G. (2000). Gene Regulation of Vasopressin and Vasopressin Receptors in Cancer. Exp. Physiol. 85, 27s–40s. doi:10.1111/j.1469-445x.2000.tb00005.x
Okahira, M., Kubota, M., Iguchi, K., Usui, S., and Hirano, K. (2008). Regulation of Aquaporin 3 Expression by Magnesium Ion. Eur. J. Pharmacol. 588 (1), 26–32. doi:10.1016/j.ejphar.2008.03.063
Papadopoulos, M. C., Saadoun, S., and Verkman, A. S. (2008). Aquaporins and Cell Migration. Pflugers Arch. - Eur. J. Physiol. 456 (4), 693–700. doi:10.1007/s00424-007-0357-5
Pei, H. P., Liu, Z., Huang, L. S., and Zhu, H. (2011). Significance of Aquaporin-1 and Aquaporin-3 Expression in Colorectal Carcinoma. Zhonghua Wei Chang. Wai Ke Za Zhi 14 (4), 275–278.
Peplowski, M. A., Dicay, M., Baggio, C. H., Wysokinski, F., Renaux, B., Hollenberg, M. D., et al. (2018). Interferon Gamma Decreases Intestinal Epithelial Aquaporin 3 Expression through Downregulation of Constitutive Transcription. J. Mol. Med. 96 (10), 1081–1093. doi:10.1007/s00109-018-1681-2
Peplowski, M. A., Vegso, A. J., Iablokov, V., Dicay, M., Zaheer, R. S., Renaux, B., et al. (2017). Tumor Necrosis Factor α Decreases Aquaporin 3 Expression in Intestinal Epithelial Cells through Inhibition of Constitutive Transcription. Physiol. Rep. 5 (19), e13451. doi:10.14814/phy2.13451
Pifano, M., Garona, J., Capobianco, C. S., Gonzalez, N., Alonso, D. F., and Ripoll, G. V. (2017). Peptide Agonists of Vasopressin V2 Receptor Reduce Expression of Neuroendocrine Markers and Tumor Growth in Human Lung and Prostate Tumor Cells. Front. Oncol. 7, 11. doi:10.3389/fonc.2017.00011
Ranieri, M., Di Mise, A., Centrone, M., D’Agostino, M., Tingskov, S. J., Venneri, M., et al. (2021). Olive Leaf Extract (OLE) Impaired Vasopressin-Induced Aquaporin-2 Trafficking through the Activation of the Calcium-Sensing Receptor. Sci. Rep. 11 (1), 4537. doi:10.1038/s41598-021-83850-5
Ranieri, M., Di Mise, A., Tamma, G., and Valenti, G. (2019). Vasopressin-aquaporin-2 Pathway: Recent Advances in Understanding Water Balance Disorders. F1000Res 8, 149. doi:10.12688/f1000research.16654.1
Ripoll, G. V., Garona, J., Hermo, G. A., Gomez, D. E., and Alonso, D. F. (2010). Effects of the Synthetic Vasopressin Analog Desmopressin in a Mouse Model of Colon Cancer. Anticancer Res. 30 (12), 5049–5054.
Ripoll, G. V., Garona, J., Pifano, M., Farina, H. G., Gomez, D. E., and Alonso, D. F. (2013). Reduction of Tumor Angiogenesis Induced by Desmopressin in a Breast Cancer Model. Breast Cancer Res. Treat. 142 (1), 9–18. doi:10.1007/s10549-013-2724-6
Robben, J. H., Knoers, N. V. A. M., and Deen, P. M. T. (2005). Characterization of Vasopressin V2 Receptor Mutants in Nephrogenic Diabetes Insipidus in a Polarized Cell Model. Am. J. Physiology-Renal Physiology 289 (2), F265–F272. doi:10.1152/ajprenal.00404.2004
Rosenthal, W., Seibold, A., Antaramian, A., Gilbert, S., Birnbaumer, M., Bichet, D. G., et al. (1994). Mutations in the Vasopressin V2 Receptor Gene in Families with Nephrogenic Diabetes Insipidus and Functional Expression of the Q-2 Mutant. Cell Mol. Biol. (Noisy-le-grand) 40 (3), 429–436.
Russo, A., Ranieri, M., Di Mise, A., Dossena, S., Pellegrino, T., Furia, E., et al. (2017). Interleukin-13 Increases Pendrin Abundance to the Cell Surface in Bronchial NCI-H292 Cells via Rho/actin Signaling. Pflugers Arch. - Eur. J. Physiol. 469 (9), 1163–1176. doi:10.1007/s00424-017-1970-6
Schwindt, T. T., Forti, F. L., Juliano, M. A., Juliano, L., and Armelin, H. A. (2003). Arginine Vasopressin Inhibition of Cyclin D1 Gene Expression Blocks the Cell Cycle and Cell Proliferation in the Mouse Y1 Adrenocortical Tumor Cell Line. Biochemistry 42 (7), 2116–2121. doi:10.1021/bi026807g
Sinha, S., Dwivedi, N., Tao, S., Jamadar, A., Kakade, V. R., Neil, M. O., et al. (2020). Targeting the Vasopressin Type-2 Receptor for Renal Cell Carcinoma Therapy. Oncogene 39 (6), 1231–1245. doi:10.1038/s41388-019-1059-0
Sobol, N., Solernó, L., Beltrán, B., Vásquez, L., Ripoll, G., Garona, J., et al. (2021). Anticancer Activity of Repurposed Hemostatic Agent Desmopressin on AVPR2-expressing H-uman O-steosarcoma. Exp. Ther. Med. 21 (6), 566. doi:10.3892/etm.2021.9998
Terrillon, S., Barberis, C., and Bouvier, M. (2004). Heterodimerization of V1a and V2 Vasopressin Receptors Determines the Interaction with β-arrestin and Their Trafficking Patterns. Proc. Natl. Acad. Sci. U.S.A. 101 (6), 1548–1553. doi:10.1073/pnas.0305322101
Thibonnier, M., Conarty, D. M., and Plesnicher, C. L. (2000). Mediators of the Mitogenic Action of Human V1vascular Vasopressin Receptors. Am. J. Physiology-Heart Circulatory Physiology 279 (5), H2529–H2539. doi:10.1152/ajpheart.2000.279.5.H2529
Thibonnier, M. (1992). Signal Transduction of V1-Vascular Vasopressin Receptors. Regul. Pept. 38 (1), 1–11. doi:10.1016/0167-0115(92)90067-5
Valenti, G., and Tamma, G. (2021). The Vasopressin-Aquaporin-2 Pathway Syndromes. Handb. Clin. Neurol. 181, 249–259. doi:10.1016/b978-0-12-820683-6.00018-x
van Gastel, M. D. A., and Torres, V. E. (2017). Polycystic Kidney Disease and the Vasopressin Pathway. Ann. Nutr. Metab. 70 Suppl 1, 43–50. doi:10.1159/000463063
Wang, X., Wu, Y., Ward, C. J., Harris, P. C., and Torres, V. E. (2008). Vasopressin Directly Regulates Cyst Growth in Polycystic Kidney Disease. J. Am. Soc. Nephrol. 19 (1), 102–108. doi:10.1681/asn.2007060688
Weiss, J. P., and Everaert, K. (2019). Management of Nocturia and Nocturnal Polyuria. Urology 133, 24–33. doi:10.1016/j.urology.2019.09.022
Xia, H., Ma, Y.-F., Yu, C.-H., Li, Y.-J., Tang, J., Li, J.-B., et al. (2014). Aquaporin 3 Knockdown Suppresses Tumour Growth and Angiogenesis in Experimental Non-small Cell Lung Cancer. Exp. Physiol. 99 (7), 974–984. doi:10.1113/expphysiol.2014.078527
Yamamoto, N., Yoneda, K., Asai, K., Sobue, K., Tada, T., Fujita, Y., et al. (2001). Alterations in the Expression of the AQP Family in Cultured Rat Astrocytes during Hypoxia and Reoxygenation. Mol. Brain Res. 90 (1), 26–38. doi:10.1016/s0169-328x(01)00064-x
Yasir, M., and Mechanic, O. J. (2022). Syndrome of Inappropriate Antidiuretic Hormone Secretion. Treasure Island (FL): StatPearls StatPearls Publishing Copyright © 2022, StatPearls Publishing LLC.
Yasui, H., Kubota, M., Iguchi, K., Usui, S., Kiho, T., and Hirano, K. (2008). Membrane Trafficking of Aquaporin 3 Induced by Epinephrine. Biochem. Biophysical Res. Commun. 373 (4), 613–617. doi:10.1016/j.bbrc.2008.06.086
Yasui, M., Zelenin, S. M., Celsi, G., and Aperia, A. (1997). Adenylate Cyclase-Coupled Vasopressin Receptor Activates AQP2 Promoter via a Dual Effect on CRE and AP1 Elements. Am. J. Physiology-Renal Physiology 272 (4 Pt 2), F443–F450. doi:10.1152/ajprenal.1997.272.4.F443
Yde, J., Keely, S. J., and Moeller, H. B. (2021). Expression, Regulation and Function of Aquaporin-3 in Colonic Epithelial Cells. Biochimica Biophysica Acta (BBA) - Biomembr. 1863 (7), 183619. doi:10.1016/j.bbamem.2021.183619
Yde, J., Keely, S., Wu, Q., Borg, J. F., Lajczak, N., O’Dwyer, A., et al. (2016). Characterization of AQPs in Mouse, Rat, and Human Colon and Their Selective Regulation by Bile Acids. Front. Nutr. 3, 46. doi:10.3389/fnut.2016.00046
Zeuthen, T., and Klaerke, D. A. (1999). Transport of Water and Glycerol in Aquaporin 3 Is Gated by H+. J. Biol. Chem. 274 (31), 21631–21636. doi:10.1074/jbc.274.31.21631
Keywords: vasopressin, V1aR, V2R, AQP3, glycerol, tolvaptan, SR49059, DFP00173
Citation: Centrone M, D’Agostino M, Ranieri M, Mola MG, Faviana P, Lippolis PV, Silvestris DA, Venneri M, Di Mise A, Valenti G and Tamma G (2022) dDAVP Downregulates the AQP3-Mediated Glycerol Transport via V1aR in Human Colon HCT8 Cells. Front. Cell Dev. Biol. 10:919438. doi: 10.3389/fcell.2022.919438
Received: 13 April 2022; Accepted: 15 June 2022;
Published: 08 July 2022.
Edited by:
Silvia Dossena, Paracelsus Medical University, AustriaReviewed by:
Tae-Hwan Kwon, Kyungpook National University, South KoreaNazih Nakhoul, Tulane University, United States
Copyright © 2022 Centrone, D’Agostino, Ranieri, Mola, Faviana, Lippolis, Silvestris, Venneri, Di Mise, Valenti and Tamma. This is an open-access article distributed under the terms of the Creative Commons Attribution License (CC BY). The use, distribution or reproduction in other forums is permitted, provided the original author(s) and the copyright owner(s) are credited and that the original publication in this journal is cited, in accordance with accepted academic practice. No use, distribution or reproduction is permitted which does not comply with these terms.
*Correspondence: Grazia Tamma, Z3JhemlhLnRhbW1hQHVuaWJhLml0
†These authors have contributed equally to this work and share first authorship
 Mariangela Centrone
 Mariagrazia D’Agostino1†
 Marianna Ranieri
 Maria Grazia Mola
 Pinuccia Faviana
 Domenico Alessandro Silvestris
 Annarita Di Mise
 Giovanna Valenti
 Grazia Tamma