
94% of researchers rate our articles as excellent or good
Learn more about the work of our research integrity team to safeguard the quality of each article we publish.
Find out more
ORIGINAL RESEARCH article
Front. Cell Dev. Biol., 27 September 2022
Sec. Signaling
Volume 10 - 2022 | https://doi.org/10.3389/fcell.2022.893677
This article is part of the Research TopicMitochondrial signaling in disease: from cancer to neurodegenerationView all 6 articles
 James Kealey1
 Heiko Düssmann1,2Irene Llorente-Folch1,2,3Natalia Niewidok1Manuela Salvucci1,2
 Jochen H. M. Prehn1,2*†
 Beatrice D’Orsi1,4*†
Metabolic reprogramming is a hallmark of cancer. Somatic mutations in genes involved in oncogenic signaling pathways, including KRAS and TP53, rewire the metabolic machinery in cancer cells. We here set out to determine, at the single cell level, metabolic signatures in human colon cancer cells engineered to express combinations of activating KRAS gene mutations and TP53 gene deletions. Specifically, we explored how somatic mutations in these genes and substrate availability (lactate, glucose, substrate deprivation) from the extracellular microenvironment affect bioenergetic parameters, including cellular ATP, NADH and mitochondrial membrane potential dynamics. Employing cytosolic and mitochondrial FRET-based ATP probes, fluorescent NADH sensors, and the membrane-permeant cationic fluorescent probe TMRM in HCT-116 cells as a model system, we observed that TP53 deletion and KRAS mutations drive a shift in metabolic signatures enabling lactate to become an efficient metabolite to replenish both ATP and NADH following nutrient deprivation. Intriguingly, cytosolic, mitochondrial and overall cellular ATP measurements revealed that, in WT KRAS cells, TP53 deficiency leads to an enhanced ATP production in the presence of extracellular lactate and glucose, and to the greatest increase in ATP following a starvation period. On the other hand, oncogenic KRAS in TP53-deficient cells reversed the alterations in cellular ATP levels. Moreover, cell population measurements of mitochondrial and glycolytic metabolism using a Seahorse analyzer demonstrated that WT KRAS TP53-silenced cells display an increase of the basal respiration and tightly-coupled mitochondria, in the presence of glucose as substrate, compared to TP53 competent cells. Furthermore, cells possessing oncogenic KRAS, independently of TP53 status, showed less pronounced mitochondrial membrane potential changes in response to metabolic nutrients. Furthermore, analysis of cytosolic and mitochondrial NADH levels revealed that the simultaneous presence of TP53 deletion and oncogenic KRAS showed the most pronounced alteration in cytosolic and mitochondrial NADH during metabolic stress. In conclusion, our findings demonstrate how activating KRAS mutation and loss of TP53 remodel cancer metabolism and lead to alterations in bioenergetics under metabolic stress conditions by modulating cellular ATP production, NADH oxidation, mitochondrial respiration and function.
Cancer cells have an altered metabolism which promotes cell survival and proliferation (De Berardinis and Chandel, 2016; Pavlova, Zhu and Thompson, 2022). Such alteration is due to an increased glucose uptake, an exacerbated production of lactate and an inhibition of oxidative phosphorylation system (OXPHOS) that occurs even in the presence of oxygen, thus leading to a state of aerobic glycolysis (Heiden, Cantley and Thompson, 2009). Indeed, tumor cells reprogram their glucose metabolism, restricting it mainly to glycolysis, a phenomenon named as the “Warburg effect” (Geschickter and Warburg, 1930; Warburg, 1956; DeBerardinis and Chandel, 2020). This complex metabolic rewiring is controlled by mitochondria that finely integrate a variety of intracellular signaling pathways, within the mitochondria or with other cellular compartments, to meet bioenergetics needs and facilitate the uncontrolled proliferation of tumor cells (Ward and Thompson, 2012; Epstein, Gatenby and Brown, 2017; Pavlova, Zhu and Thompson, 2022). Glycolytic fueling has been shown to be associated with activating mutations or copy number alterations in genes, such as RAS, MYC, or inactivation or repression of genes, such as the tumor suppressor TP53 (DeBerardinis et al., 2008; Jones and Thompson, 2009). Besides metabolic alterations, these mutations orchestrate several other hallmarks of cancer, including deregulation of cell cycle and cell death pathways, immunosuppression and enhanced migration (Cannino et al., 2018).
Colorectal cancer (CRC) has one of the highest morbidities and mortality rates among solid cancers, accounting for almost 10% of the global incidence of cancer (Sung et al., 2021). CRC is highly heterogeneous at the molecular level and patients display the presence of distinct metabolic alterations that require effective molecular subtyping strategies for therapeutic intervention. Up to 40% of CRC cases contain RAS mutations (Lowy and Willumsen, 1993; Andreyev et al., 2001; Scott et al., 2020). The majority of these mutations are KRAS, highlighting the importance of studying these defects (Downward, 1998; Matallanas et al., 2011; Slattery et al., 2018). Similarly, dysregulation in TP53 gene is one of the most frequent events that occurs in approximately 60% of CRC patients and TP53 mutational status is highly associated with CRC progression and poorer clinical outcome (Muzny et al., 2012; Robles, Jen and Harris, 2016; Nakayama and Oshima, 2019).
Despite researchers’ efforts in understanding the impact of somatic gene mutations in KRAS and TP53 on bioenergetics, cell proliferation and survival in CRC, the dependence of these mechanisms on the mutational status of the tumor still needs elucidation. In the present study, we investigate, at the single cell level, metabolic signatures in isogenic pairs of human colon cancer HCT-116 cells, which differ by single or double genetic mutations in KRAS and TP53 genes. Employing single cell time-lapse imaging approaches, we here show, how KRAS and TP53 mutations influence bioenergetic parameters, including cellular ATP, NADH and mitochondrial membrane potential dynamics following extracellular nutrients availability.
Lipofectamine 2000 and Tetramethylrhodamine methyl ester (TMRM) were obtained from Bio Sciences. All other chemicals, including RPMI 1640 medium, Fetal Bovine Serum, d-glucose, lactate and Carbonyl cyanide 4-(trifluoromethoxy)phenylhydrazone (FCCP) were purchased from Sigma Aldrich.
All HCT-116 human colon cancer cells were maintained in RPMI 1640 medium supplemented with 10% fetal bovine serum, 100 μg/ml penicillin/streptomycin, 2 mM glutamine, and cultured at 37°C in a humidified atmosphere of 5% CO2. Several clones of HCT-116 have been employed and are listed in Table 1. In detail, HCT-116 WT cells were isolated from a patient with colorectal carcinoma and a mutation in codon 13 of the RAS proto-oncogene (KRASG13D) of these tumor cells is present. TP53-deficient HCT-116 (p53 KO) cells were kindly provided by Prof. B. Vogelstein (The Johns Hopkins University School of Medicine, Baltimore, MD, United States) (Bunz et al., 1998; Sur et al., 2009). Hke3 cells were generated from HCT-116 by a somatic deletion of the KRASG13D allele, reverting the oncogenic KRAS phenotype (Shirasawa et al., 1993; Charitou et al., 2019). However, a recent study has shed further light on the accurate KRAS status revealing that the Hke3 cell line is KRAS dosage mutant, with expression and activity of the KRAS mutation approximately 70% lower when compared to the parental cell line (Fasterius et al., 2017). Hke3 cells were kindly provided by Prof. W. Kolch (Conway Institute of Biomolecular and Biomedical Research, University College Dublin, Dublin, Republic of Ireland) (Fasterius et al., 2017; Charitou et al., 2019). p53 has been knocked down in-house by a commercial lentiviral shRNA targeting TP53 (TRCN0000003753, Sigma) in Hke3 cell lines. These cells were subsequently selected by applying puromycin (15 μg/ml) to generate stable cell lines (Hke3 p53 KD). These pairs of cell lines are considered isogenic and constitute an ideal setting to study phenotypic heterogeneity derived from single mutations. For the purposes of comparison, the Hke3 and Hke3 p53 KD cells are referred to as KRAS WT in this manuscript, as seen in Table 1.
TABLE 1. Origin and mutations of human colorectal cancer HCT-116 cell lines.
Prior to experiments, cells were first seeded in sterile 12 mm Willco dishes (Willco Wells B.V.) for 24 h before transfection using Lipofectamine 2000 (Bio Sciences) as per the manufacturer’s instructions. For cytosolic and mitochondrial ATP measurements, cells were transfected with a vector expressing the genetically-encoded FRET-based cytosolic (ATeam; AT1.03/pcDNA3.1) and mitochondrial (ATeam 1.03R122K/R126K) ATP indicators, respectively [kindly supplied by Dr Hiroyuki Noji (Imamura et al., 2009)]. The ATP-sensitive FRET probes consist of variants of CFP (mseCFP) and YFP (cp173-mVenus) connected by the ɛ subunit of Bacillus subtilis FoF1-ATP synthase. Upon ATP level changes, the ɛ subunit retracts the two fluorophores close to each other, which increases FRET efficiency (Imamura et al., 2009). For cytosolic NADH levels, cells were transfected with a pcDNA3.1-Peredox-mCherry Plasmid (#32383, Addgene). The Peredox-mCherry NADH sensor has been developed by fusing a circular permuted, monomeric T-Sapphire (cpmTS) as fluorescence reporter to a T-Rex tandem dimer (Hung et al., 2011). The Peredox sensor was mainly sensitive to the [NADH][NAD+] ratio and resistant to pH changes or other metabolites with structural similarity to NADH. When NAD+ binds to the Rex subunits there is a minimal fluorescence emission. In contrast, when NADH binds to the subunits, a conformational change in the probe occurs, leading to a large increase in the T-Sapphire fluorescent signal (Hung et al., 2011).
Experiments were carried out as follows and illustrated in Figure 1A: 1) 1 hour before experiment, the medium was removed and replaced with Krebs-HEPES buffer (KB, 140 mM NaCl, 5.9 mM KCl, 1.2 mM MgCl2, 15 mM HEPES) containing 30 nM TMRM and 2.5 mM CaCl2, during which cells were starved of nutrients and TMRM equilibrates across plasma and mitochondrial membranes; 2) a baseline was recorded for 20 min as equilibration time; 2 mM lactate was added to the KB at the 20 min time-point, which converts to pyruvate promoting mitochondrial respiration; 3) 5 mM glucose was added on stage at the 40 min time-point, which is imported into the cell promoting glycolysis; and finally 4) 10 µM FCCP was added at the 60 min time-point to induce mitochondrial membrane depolarization and cause disruption of ATP synthesis.
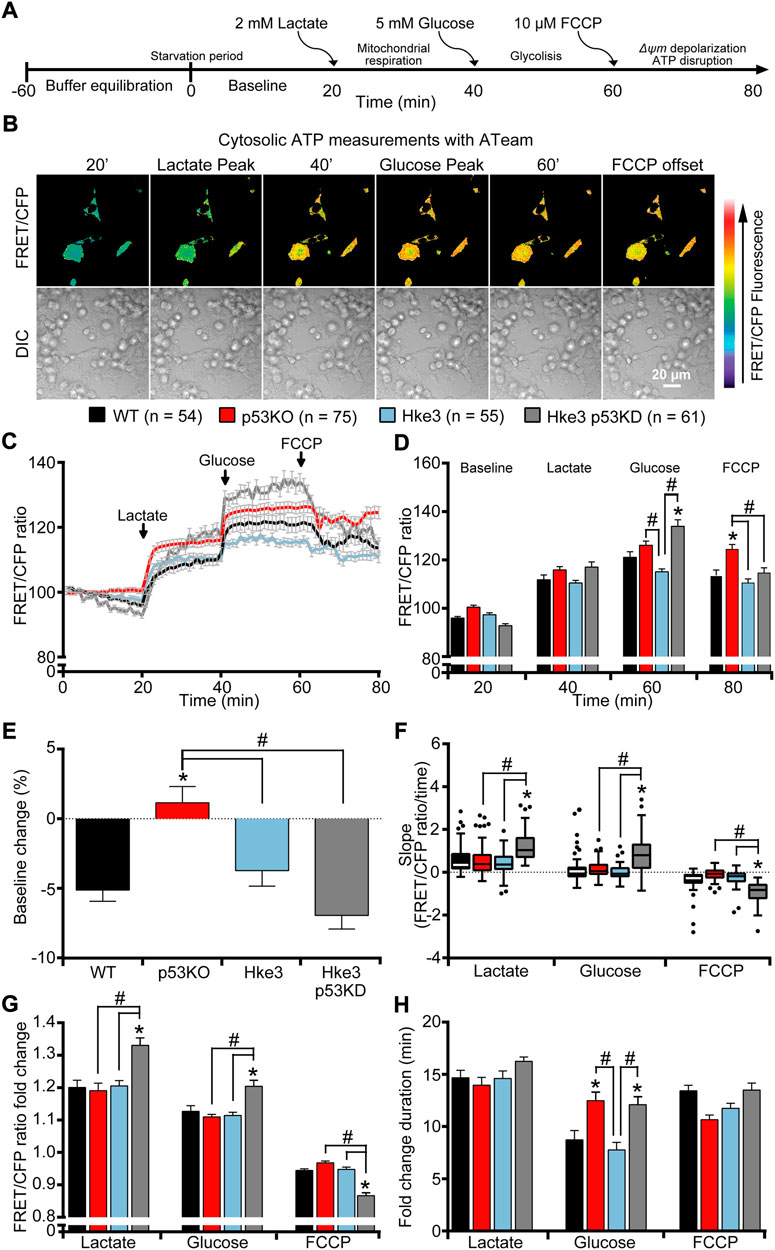
FIGURE 1. TP53-silenced Hke3 cells with a competent KRAS gene display significantly increased cytosolic ATP kinetics in response to extracellular substrates addition. WT, p53 KO, Hke3 and Hke3 p53 KD HCT-116 cells were separately transfected with the cytosolic ATP-sensitive (ATeam) FRET probe, loaded with 30 nM TMRM as a Δψm indicator (non-quenched mode), mounted on the heated stage of an LSM 710 confocal microscope and assayed over 80 min at 37°C. (A) Experimental model schematic. Cells were allowed to equilibrate for 60 min on stage (starvation period), after which alterations in Δψm and cytosolic ATP were monitored in single cells. Following a baseline of 20 min, cells were exposed to sequential additions of 2 mM lactate, 5 mM glucose and 10 µM FCCP at the indicated time points (20, 40 and 60 min) to promote mitochondrial respiration, glycolysis and, Δψm depolarization and mitochondrial ATP disruption, respectively. (B) Differential interference contrast (DIC) and fluorescence measurements were recorded for TMRM, FRET, CFP, YFP by time-lapse confocal microscopy. FRET/CFP ratio and DIC representative images of Hke3 cells expressing ATeam probe are shown as a ratio of FRET/CFP normalized to baseline to monitor cytosolic ATP. Scale bar = 20 µm. (C) Kinetics of all cells monitored, expressed as means ± SEM are shown, additions are labelled with black arrows on top of the graph. (D) Analysis of the cytosolic ATP levels (FRET/CFP, normalized) before each drug treatment (20, 40 and 60 min) and at the end of the experiment (80 min). (E) Change of cytosolic ATP baseline levels (FRET/CFP, normalized) over the first 20 min, (F) quantification of the slope of cytosolic ATP (the change in FRET/CFP ratio over time in minutes), (G) the mean fold change in FRET/CFP ratio and (H) the mean duration for this change in FRET/CFP ratio after each treatment are illustrated. Means ± SEM are shown from at least three independent experiments for each cell line (WT, n = 54; p53 KO, n = 75; Hke3 n = 55; Hke3 p53 KD, n = 61). *p ≤ 0.05 compared to WT control cells; #p ≤ 0.05 between cell lines (ANOVA, post-hoc Tukey).
HCT-116 cell lines, transfected with the FRET-based cytosolic or mitochondrial ATP indicators, ATeam or mitoATeam respectively, were washed twice with KB and the medium replaced with 1 ml of KB containing the membrane-permeant cationic fluorescent probe TMRM (30 nM) and 2.5 mM CaCl2. A thin layer of mineral oil was added on top of the KB to prevent evaporation and Willco dishes were placed on the stage of a LSM 710 confocal microscope equipped with a 40 × 1.3 NA (ATeam) or 63 × 1.4 NA (mitoATeam) oil-immersion objective and thermostatically regulated chamber set at 37 °C (Carl Zeiss). TMRM was excited at 561 nm, and the emission was collected in the range of 575–735 nm. CFP was excited at 405 nm, and emission was collected at 445–505 (CFP) and 505–555 nm (FRET). Yellow fluorescent protein (YFP) was excited directly using the 488 nm line of the Argon Laser and detected in the same range used for FRET. Images were captured every 1 min throughout these experiments.
HCT-116 cells were prepared as above-described and the medium replaced with 1 ml of KB with 2.5 mM CaCl2. A thin layer of mineral oil was added on top of the KB to prevent evaporation and the Willco dishes were placed on the stage of a LSM 710 confocal microscope equipped with a 40 × 1.3NA oil-immersion objective and thermostatically regulated chamber set at 37°C (Carl Zeiss). Peredox and mCherry were excited at 405 and 561 nm, respectively, and the emission was collected at 484–572 (T-Sapphire) and 581–727 nm (mCherry). TMRM was not used in the Peredox experiments as the red fluorescence of the TMRM interferes with the mCherry fluorescence of the probe. The binding of NADH does not cause any change in the intensity of the mCherry fluorescence. Thus, the mCherry signal was used to normalize the T-Sapphire signal and the green-to-red fluorescence increases in conjunction with an increase in the [NADH][NAD+] ratio (Hung et al., 2011). Images were captured every 1 min throughout these experiments.
Cells, in 1 ml of KB containing TMRM (30 nM) and 2.5 mM CaCl2, were transferred to a heated stage above a 40x/1.3 NA Plan-Neofluar of an inverted epifluorescence microscope (Axiovert 200M, Zeiss) controlled by MetaMorph version 6.5 (Universal Imaging Co.). Ultraviolet excitation at 340 nm can be used to investigate NADH levels in the mitochondria (Patterson et al., 2000; Shuttleworth, Brennan and Connor, 2003; Kasischke et al., 2004). The pyridine ring present in NADH absorbs the UV light and naturally emits light at a higher wavelength in a process known as auto-fluorescence. However, this signal is much stronger in the mitochondria than in the cytosol. Experiments were carried out using a 100 W Mercury short-arc lamp (HBO 103 W/2, Osram, Germany) for excitation with illumination wavelength of 340 nm for NADH excitation with an exposure time of 500 ms and a ND filter of 6% in the excitation light path. Emission was collected at 450–480 nm. TMRM was excited at 545 nm, and the emission was collected in the range of 575–735 nm. Images were captured using an EMCCD camera with binning two for NADH auto-fluorescence and full resolution for TMRM and PHC (Ixon EM DU-897-BI, Andor, NI) every 1 min throughout these experiments.
All microscope settings including laser intensity and scan time were kept constant for the whole set of experiments. Control experiments were carried out and showed that photo toxicity had a negligible impact. All images were processed and analyzed using ImageJ (National Institutes of Health, Bethesda, MD, United States) and MetaMorph Software version 7.5 or version 6.5 (Universal Imaging Co.). Time-lapse sequences were imported into ImageJ (National Institutes of Health, Bethesda, MD, United States) and background was first subtracted from each image. After creating combined images of the three fields of view for each channel sequence, a median filter with a radius of one pixel was applied. The combined images were then processed using MetaMorph Software version 7.5. Single-cell kinetic measurements (time-stamp, fluorescence intensity or ratio) were input to Excel 2010 macros that automatically generated trace characteristics, including fluorescence intensity, area under the curve, percentage difference from baseline, and maxima and minima values after drugs addition. Normalized values were then calculated as a percentage of baseline values. The baseline was calculated as the mean value of the first 10 images in each experiment). Mean ± SEM values are shown in the all kinetic curves and bar charts. Baseline values for each cell line were calculated as the percentage difference between the normalized values at min one and min 20 for each cell (Baseline change (%) = ΔBaselinet20-t1*100). When the % baseline fluorescence is decreasing it is displayed as a negative value. Onset values were calculated as the mean fluorescence intensity for all cells in the minute before additions of lactate, glucose, FCCP or at the end of the experiment, i.e. at 20, 40, 60 and 80 min [Onset = (FRET/CFP)tx]. Slopes were analyzed by calculating the slope of the kinetic trace for each cell in the corresponding time frame as change in FRET/CFP ratio over time in minutes [Slope = Δ(FRET/CFP)/ΔTime with FRET/CFP ratio value for the corresponding time period (21st and 40th min for lactate, 41st and 60th min for glucose, 61st and 80th min for FCCP]. Independent of the curve shape an overall drop of the signal within this time frame will result in a negative slope, while an overall increase will result in a positive slope. In cases where kinetic responses to nutrients or FCCP were close to a linear curve the slope reflects the overall kinetics. We consider that this is the case for the decrease in ATeam and mitoATeam after FCCP, and the increase for mitoAteam after lactate addition, as well as the increase for TMRM after lactate and glucose addition. Data were then grouped per exposure period (baseline, lactate, glucose and FCCP) and displayed as a Tukey box plot of all cells for each cell line. In a Tukey box plot the center line displays the median value with the whiskers showing the lowest datum, within the 1.5 interquartile range of the lower quartile and the highest datum, within the 1.5 interquartile range of the upper quartile. Any data points outside of this range are displayed as a single point. Fold changes were calculated by comparing the peak intensity of each cell post treatment to the intensity in the minute prior to the treatment [Fold Change = Max (FRET/CFP)Δt/(FRET/CFP)tx]. In the case of FCCP causing a decrease in fluorescence signal, the endpoint was taken as the point where the decrease was no longer exponential in nature (FCCP Offset = Plateau FRET/CFPΔt). Change durations were obtained by noting the time taken for each cell to reach its peak/lowest intensity after each addition (Change Duration = Fold Change Δt). All experiments were performed a minimum of three times from independent cell cultures. To analyze single-cell behavior, individual response was treated as an independent event in statistical analyses.
For cytosolic NADH and ATP measurements, the data were obtained ratiometrically from the different image channels. Regarding the Peredox mCherry NADH sensor, the mCherry signal was used to create a mask which was multiplied by the T-Sapphire signal. The result was then normalized to the mCherry signal. For the ATeam and mitoATeam analysis, the YFP signal was used to create a mask which was multiplied by the FRET signal. The result was then divided by the CFP signal. A custom made MetaMorph journal was used to obtain the average intensity signal from all regions, and an excel macro was then applied to sort the values and to convert them to a percentage normalized to the baseline. Mitochondria within cells were segmented from background using the YFP time lapse images. The segmented mitochondrial areas were converted into a mask used to remove background values from any further analysis of the FRET/CFP stack. To this end, the FRET image stack was first multiplied by the YFP-mask and divided by CFP image stack, and regions of interest were then selected for analysis. For mitochondrial NADH measurements, the values were taken from the resulting images. All experiments were performed at least three times independently of each other.
Cellular ATP was quantified using CellTiter-Glo® luminescence assay (Promega). Cells were seeded at a density of 25,000 cells in a 96 well plate and left in the incubator to adhere overnight. Following this incubation time, the medium was removed and replaced with 100 μl kB buffer. Four control wells containing buffer were also prepared without cells to obtain a value for background luminescence. ATP was quantified following the manufacturer’s instructions. Briefly, 100 μl of the assay buffer was added to each well (containing 100 μl of medium) and cells were incubated for 2 min at RT on a shaker. The plate was left at RT for another 10 min to stabilize the signal, and the contents transferred to a black bottom 96 well plate and then loaded on a Clariostar reader (BMG Labtech) to measure luminescence with a settling time of 0.2 s and the top optic. Protein concentration was assessed with micro BCA (bicinchoninic acid) assay (Pierce) in order to account for differences in cell number. Serial fold dilutions of ATP were prepared to generate an ATP standard curve and moles of ATP normalized to protein concentration.
Metabolic studies were performed using Seahorse XF96 Extracellular Flux Analyzer (Seahorse Bioscience) (Qian and Van Houten, 2010; Lucantoni et al., 2018) to perform either mitochondrial or glycolytic stress tests, according to the manufacturer’s instructions. Hke3 and Hke3 p53 KD cells were plated in XF96 V7 cell culture at 10×104 cells/well and incubated for 48 h in a 37°C, 5% CO2 incubator in RPMI medium. Cells were equilibrated with Seahorse XF DMEM Medium, pH 7.4 (Agilent) for 1 h immediately before extracellular flux assay. Drugs were prepared in the same medium in which the experiment was conducted and were injected from the reagent ports automatically to the wells at the times indicated. During glycolytic stress tests, inhibitors were injected sequentially as follows at the indicated times: 10 mM glucose (G), 1 μM Antimycin/1 μM Rotenone (A/R) and 20 μM Monensin (M). Extracellular acidification rate (ECAR) was measured in mpH/min normalized to protein concentration (μg) to provide measures of bulk glycolytic capacity, allowing determination of glycolysis. Mitochondrial function in Hke3 and Hke3 p53 KD cells was determined through sequential addition of 3 μM Oligomycin (O), 0.5 μM FCCP (F), and 1 μM Antimycin/1 μM rotenone (A/R). Oxygen consumption rate (OCR) was measured in pmolO2/min normalized to protein concentration (μg) to provide bulk measures of oxidative phosphorylation. This allowed the determination of basal oxygen consumption, oxygen consumption linked to ATP synthesis (ATP), non-ATP linked oxygen consumption (proton leak), mitochondrial uncoupled respiration (MUR), and non-mitochondrial oxygen consumption (NM), in this order (Qian and Van Houten, 2010; Mookerjee et al., 2017). Basal respiration was calculated by subtracting non-mitochondrial respiration from OCR after the initial stabilization (third measurement), and was considered 100%.
Cells were seeded in a Nunc Micro Well 96 well optical bottom plate (Thermo Scientific) at a density of 1×10⁴ cells per well. The day of the treatment cells were incubated in medium with 1 μg/ml Hoechst 33,588 and 1 μg/ml Propidium iodide (PI). After 0, 24 and 48 h treatment, plates were imaged at 30 fields of view per well using a Cellomics Arrayscan VTI (Thermo Scientific) microscope set up with a temperature of 37°C and 5% of CO2 in humidified atmosphere. Images were taken at a resolution of 0.645 μm/pixel using a ×10 Plan-Apo objective lens (NA 0.45), a LED light source set to 20% output (Lumencor Sola, AHF, Germany) and a monochrome CCD camera (Orca-AG, Hamamatsu Photonics, Hertfordshire, UK). The following filters sets were used: Hoechst excitation 387 ± 11 nm, emission 447 ± 30 nm; PI excitation 560 ± 12 nm, emission 620 ± 60 nm all using a HC-Quad band beam splitter with transition wavelength of 410, 504, 582, and 669 nm (Semrock, AHF, Germany). Images were analyzed using a customized processing pipeline to identify nuclei with Hoechst staining (total cell number) and nuclei of dead cells (PI positive) using CellProfiler r2.2.0 (Carpenter et al., 2006). Cellular viability was assessed at basal conditions or 24 and 48 h following 5 mM glucose or high-glucose concentration (11 mM).
Data are given as means ± S.E.M (standard errors of the means). Data were analyzed using one-way analysis of variance (ANOVA) followed by Tukey’s post hoc test or Student’s t-test for two-group comparison. p values <0.05 were considered to be statistically significant. When significant, exact p values were stated in the figure legends.
TP53 deficiency enhances cellular ATP production during metabolic stress and the concomitance of oncogenic KRAS reverses this alteration in colon cancer cells.
In order to investigate how human colon cancer HCT-116 cells, that harbor mutations in KRAS and TP53 genes, respond to nutrients availability from the extracellular microenvironment, we started our experiments by characterizing parental HCT-116 WT (TP53 competent but holding a KRAS mutation on exon two codon G13) and three isogenic derived mutant cell lines covering all four combinations of TP53 and KRAS mutational status (p53 KO, TP53-deficient and KRAS mutated; Hke3, TP53 and KRAS competent and Hke3 p53 KD, TP53-silenced and KRAS competent) as listed in Table 1 [see also Supplementary Figure S1A and materials and methods (Brattain et al., 1984; Shirasawa et al., 1993; Bunz et al., 1998; Sur et al., 2009; Fasterius et al., 2017; Charitou et al., 2019)]. To assess whether TP53 loss and mutated KRAS may affect intracellular and mitochondrial bioenergetics in this colon cancer cell model, we monitored cytosolic and mitochondrial ATP levels at single cell resolution, using ATP-sensitive FRET probes targeted to the cytosol (ATeam) or mitochondria (mitoATeam), respectively (Imamura et al., 2009). Experiments were conducted in all four HCT-116 cell lines by time-lapse confocal microscopy and cells were exposed to extracellular substrates as shown in Figure 1A. Briefly, to stimulate the consumption of intracellular metabolites for survival, HCT-116 cells were first deprived of nutrients for 60 min, after which a baseline was recorded for 20 min as equilibration recording time (still in nutrients deprivation condition). To promote mitochondrial respiration, glycolysis, mitochondrial membrane potential depolarization and disruption of ATP synthesis in this order, cells were exposed to sequential addition of 2 mM lactate (at the 20 min time-point), 5 mM glucose (at 40 min) and 10 µM OXPHOS uncoupler FCCP (at 60 min), and recorded till 80 min (Figure 1A). The addition of FCCP indicates the loss of mitochondrial contribution to cytosolic ATP.
Individual single cell analysis revealed divergent cytosolic ATP concentration across all cell lines during substrates exposure (Figures 1B–D). We first observed that TP53-deficient and KRAS mutated (p53 KO) cells retained the cytosolic ATP depletion observed in the first 20 min of baseline, when cells are starved of nutrients, compared to other mutant cells, indicating that these were consuming reserves of ATP present in the cytosol during that period (Figures 1C,E). Moreover, TP53 and KRAS mutations drove a shift in metabolic signatures enabling lactate to become an efficient metabolite to replenish cytosolic ATP following stress induced by nutrient starvation (Figures 1B–D,F). Of note, TP53-silenced and KRAS competent (Hke3 p53 KD) cells displayed the greatest alterations in cytosolic ATP following substrates addition compared to the other cell lines. In detail, lactate and glucose triggered a rapid and constant cytosolic ATP production while a prompt drop of ATP was observed when Hke3 p53 KD cells were subjected to the mitochondrial protonophore FCCP, as shown by quantification of the FRET/CFP ratio (Figure 1D), analysis of the slope of cytosolic signal (Figure 1F) and the corresponding fold change in fluorescence (Figures 1G,H), suggesting that TP53-silenced Hke3 cells generate more cytosolic ATP after metabolic stress.
Similarly, mitochondrial ATP dynamics were determined at single cell level as above-described and analysis of cells monitored showed that, differently to what was detected with the cytosolic ATP-sensitive FRET probe, exposure to lactate to fuel mitochondrial respiration, exhibited minimal changes in mitochondrial ATP in any of the cells regardless of their mutational status (Figures 2A–C,E), indicating that the majority of produced ATP, following lactate addition, was immediately exported into the cytosol. If anything, cells competent in TP53 and KRAS (Hke3) maintained stable mitochondrial ATP basal levels (Figure 2D) and displayed the highest mitochondrial ATP production in response to lactate (Figure 2F). On the other hand, TP53-silenced Hke3 and KRAS competent cells (Hke3 p53 KD) showed significantly increased mitochondrial ATP levels when glycolysis was promoted (Figures 2B,C,F), and the greatest mitochondrial ATP decrease when mitochondrial ATP synthesis was disrupted, compared to the other mutants and parental cell lines (Figures 2B,C, E-G).
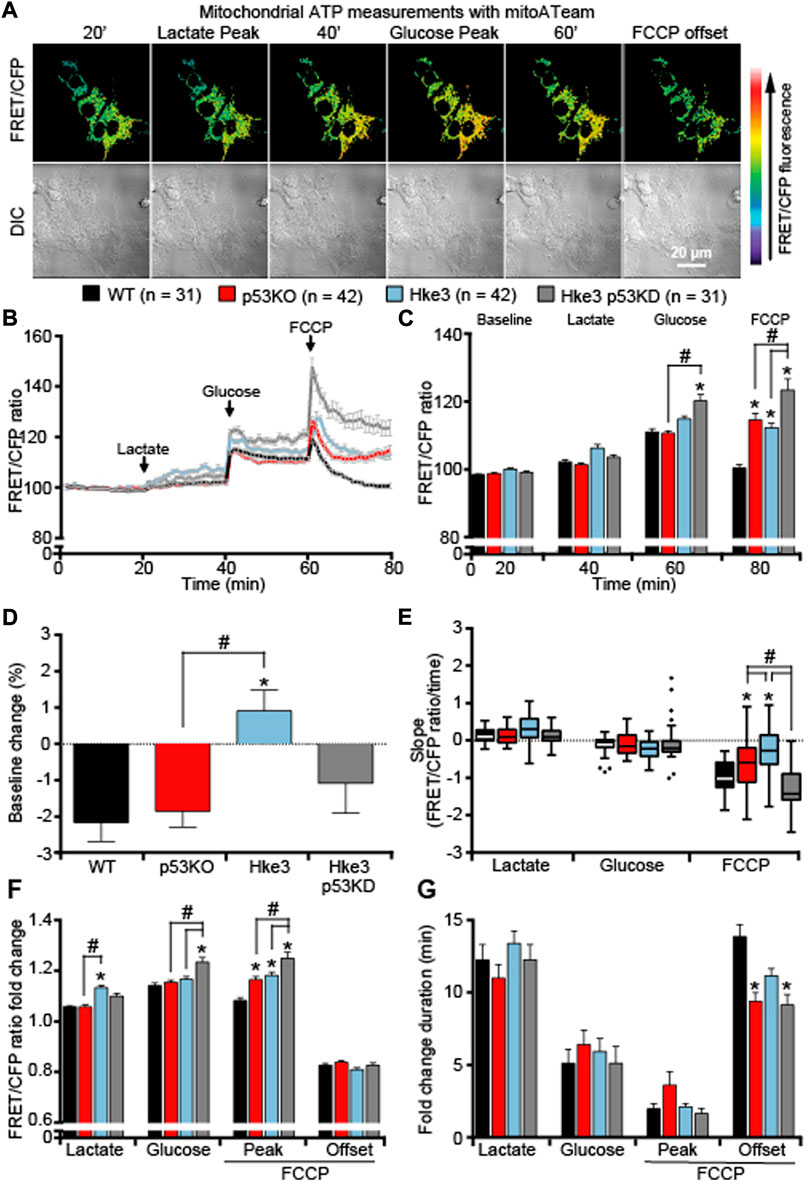
FIGURE 2. TP53-silenced Hke3 cells with a competent KRAS show significantly increased mitochondrial ATP levels during metabolic stress. WT, p53 KO, Hke3 and Hke3 p53 KD HCT-116 cells were separately transfected with the mitochondrial ATP-sensitive (mitoATeam) FRET probe, loaded with 30 nM TMRM as a Δψm indicator (non-quenched mode), mounted on the heated stage of an LSM 710 confocal microscope and assayed over 80 min at 37°C. Cells were exposed as mentioned and illustrated in Figure 1A. (A) Differential interference contrast (DIC) and fluorescence measurements were recorded for TMRM, FRET, CFP, YFP by time-lapse confocal microscopy. FRET/CFP ratio and DIC representative images of Hke3 cells expressing mitoATeam probe are shown as a ratio of FRET/CFP normalized to baseline to monitor mitochondrial ATP. Scale bar = 20 µm. (B) Kinetics of all cells monitored, expressed as means ± SEM are shown, additions are labelled with black arrows on top of the graph. (C) Analysis of the mitochondrial ATP levels (FRET/CFP, normalized) before each drug treatment (20, 40 and 60 min) and at the end of the experiment (80 min). (D) Change of mitochondrial ATP baseline levels (FRET/CFP, normalized) over the first 20 min, (E) quantification of the slope of mitochondrial ATP (the change in FRET/CFP ratio over time in minutes), (F) the mean fold change in FRET/CFP ratio and (G) the mean duration for this change in FRET/CFP ratio after each treatment are illustrated. Means ± SEM are shown from at least three independent experiments for each cell line (WT, n = 31; p53 KO, n = 42; Hke3 n = 42; Hke3 p53 KD, n = 31). *p ≤ 0.05 compared to WT control cells; #p ≤ 0.05 between cell lines (ANOVA, post-hoc Tukey). (H) Total ATP concentration normalized to microgram of proteins for each cell line after 80 min of nutrients starvation. All data are expressed as mean ± SEM from experimental triplicates and three independent cultures. *p ≤ 0.05 compared to WT control cells; #p ≤ 0.05 between cell lines (ANOVA, post-hoc Tukey).
In order to confirm whether the ATP production/consumption observed at the single cell microscopy level reflected population-based studies, a biochemical luciferase assay was performed to measure the overall ATP concentration. Indeed, we found that Hke3 p53 KD cells displayed the highest ATP concentration (29.95 μM/μg) following 80 min of starvation at population level compared to the other cells (Figure 3A). In contrast, the lowest overall ATP levels were observed in p53 KO cells (21.58 μM/μg; Figure 3A), indicating that a varying combination of deficiency in TP53 and mutational KRAS status is required to produce significant differences in cellular ATP concentration following nutrient starvation.
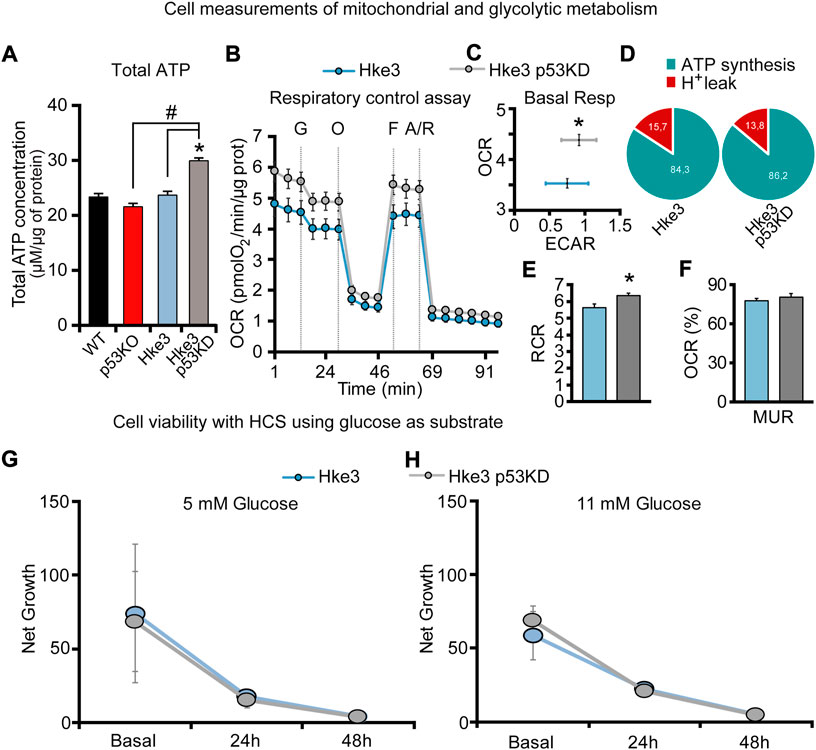
FIGURE 3. TP53-silenced Hke3 cells with a competent KRAS display higher basal respiration and tightly-coupled mitochondria. (A) Total ATP concentration normalized to micrograms of proteins for each cell line after 80 min of nutrients starvation. All data are expressed as mean ± SEM from experimental triplicates and three independent cultures. *p ≤ 0.05 compared to WT control cells; #p ≤ 0.05 between cell lines (ANOVA, post-hoc Tukey). (B–F) Cellular oxygen consumption rate (OCR) and extracellular acidification rate (ECAR) were measured in Hke3 and Hke3 p53 KD cultured cells in ambient O2 concentrations using a Seahorse XF96 Extracellular Flux Analyzer. Sequential injection of substrate (10 mM glucose, G) and metabolic inhibitors Oligomycin (O, 3 μM), FCCP (F, 0.5 μM) and Antimycin/Rotenone (A/R, 1 μM/1 μM) was performed at the indicated times (dashed lines) and enabled determination of bioenergetic parameters. Bioenergetic profiles (B) and basal OCR and ECAR (C) are represented. ATP synthesis and proton (H+) leak parameters were calculated (D) and the ratio represented as respiratory control rate (RCR; E). Basal respiration was calculated subtracting non-mitochondrial respiration from OCR after the initial stabilization (third measurement), and it was considered 100%. The percentage of maximal uncoupled respiration (MUR; K) in basal state (non-stimulated conditions) were calculated in relation to basal OCR and determined in the presence of glucose. All data represent mean values ±SEM from four independent experiments from a total of 26–52 wells. OCR and ECAR were normalized to micrograms of protein in each monitored well. *p < 0.05 compared to Hke3 cells (Student’s t test). (G,H) Cell net growth (calculated as the ratio of the number of living/proliferating cells (Hoechst 33,588) and dead cells (PI) for Hke3 (in blue) and Hke3 p53 KD (in grey) cultured cells in RPMI with 5 mM (G) and 11 mM (H) glucose. (p ≥ 0.05; ANOVA, post-hoc Tukey).
Metabolic flux technology using the Seahorse analyzer has emerged to assess the bioenergetic state of cells in vitro/ex vivo. For this reason, we also performed glycolytic capacity and respiratory control assays in Hke3 and Hke3 p53 KD cells using a Seahorse analyzer. Cells were sequentially treated as follows at the indicated times (see also Materials and Methods): Glucose 10 mM (G), Oligomycin 3 μM (O), FCCP 0.5 μM (F), and 1 μM Antimycin/1 μM Rotenone (A/R; Figure 3B) and ECAR and OCR were measured. We observed an increase of the basal respiration (Figure 3C) and mitochondrial Respiratory Control Ratio (RCR = ATP synthesis/proton leak; Figures 3D,E), showing tightly-coupled mitochondria, in the presence of glucose as substrate in TP53-silenced Hke3 cells compared to TP53 competent Hke3 cells, implying that loss of TP53 promoted enhanced mitochondrial function. However, Mitochondrial Uncoupled Respiration (MUR) was not significantly altered (Figure 3F) in Hke3 p53 KD cells compared to their control.
In parallel, to characterize whether TP53 loss could provide different proliferative properties in Hke3 cells in the absence/presence of challenge, we tested cellular viability using HCS at basal conditions or 24 and 48 h following glucose exposure at normal (5 mM) or high-glucose conditions (11 mM). We observed that TP53-silencing in Hke3 cells did not confer a significant proliferative advantage compared to Hke3 cells either in basal conditions or using glucose as a substrate (Figures 3G,H).
Collectively, these experiments demonstrated that TP53 deficiency enhances ATP production during metabolic stress by nutrients availability and the concomitant presence of oncogenic KRAS reverses these ATP alterations (data summarized in Table 2).

TABLE 2. Summary of cytosolic, mitochondrial and overall cellular ATP measurements.
In parallel with the cytosolic and mitochondrial ATP measurements, we also monitored mitochondrial membrane potential (Δψm) by employing the membrane-permeant cationic fluorescent probe, TMRM, to determine whether mutations in KRAS and TP53 genes may affect, in human colon cancer cells, also this bioenergetic parameter in response to nutrients availability. Interestingly, TMRM fluorescence intensity decreased only in TP53-deficient and KRAS mutated (p53 KO) cells over the opening 20 min of the experiment following nutrients starvation (Figures 4B,D), while exposure to lactate and glucose caused a slight rise in TMRM fluorescence in all 4 cell lines (Figures 4A–C). However, cells possessing KRAS mutation (WT and p53 KO) showed significantly slower Δψm kinetics compared to cells harboring WT KRAS (Hke3 and Hke3 p53 KD; Figures 4B,C,F,G), possibly indicative of decreased mitochondrial respiration efficiency. Moreover, a complete Δψm depolarization was detected in all 4 cell lines in response to FCCP (Figures 4A–C,E–G), although this was depleted faster in TP53-deficient cells (Figure 4E; data summarized in Table 3).
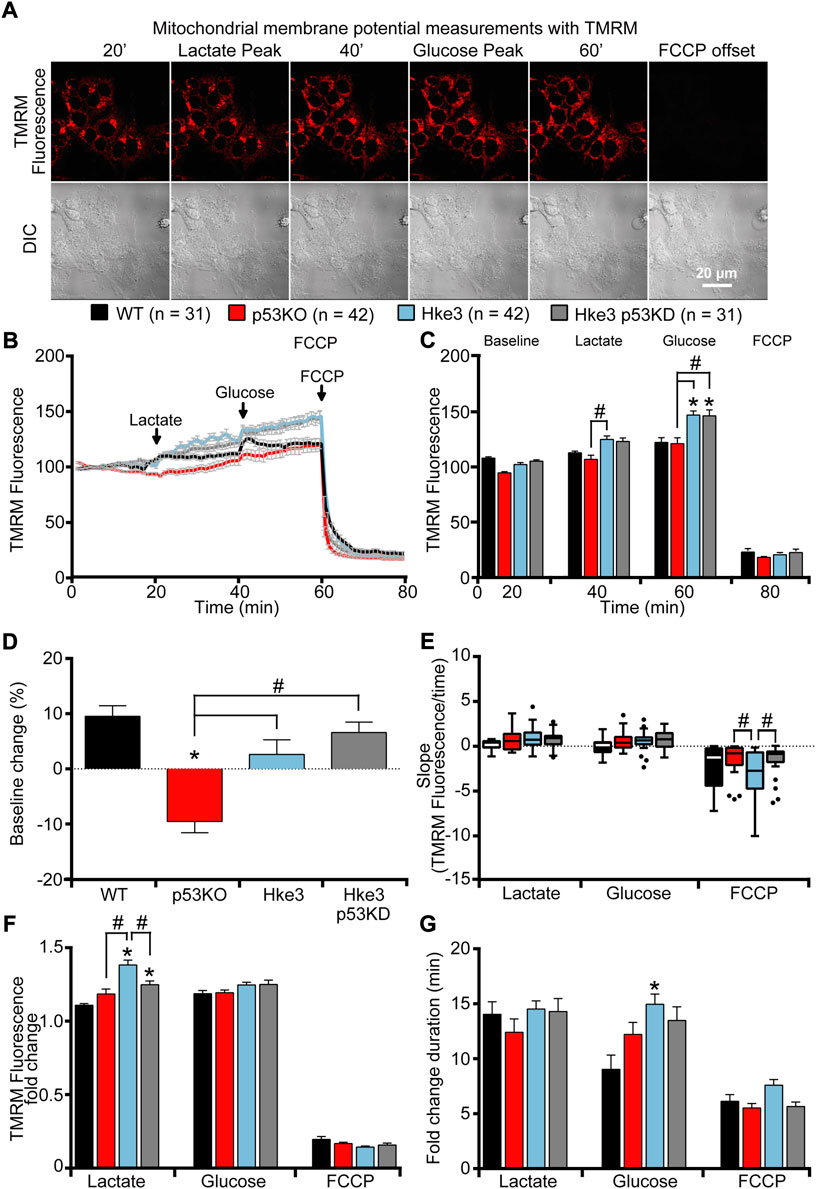
FIGURE 4. KRAS mutation leads to minimal mitochondrial membrane potential changes in response to metabolic substrates. WT, p53 KO, Hke3 and Hke3 p53 KD HCT-116 cells were separately loaded with 30 nM TMRM as a Δψm indicator (non-quenched mode), mounted on the heated stage of an LSM 710 confocal microscope and assayed over 80 min at 37°C. Cells were exposed as mentioned and illustrated in Figure 1A. DIC and fluorescent measurements were recorded for TMRM by time-lapse confocal microscopy. Mitochondrial membrane potential imaging data are expressed as a fluorescence intensity normalized to baseline. (A) Mitochondrial membrane potential, before and after drugs addition, was analyzed, and TMRM fluorescence and DIC representative images of Hke3 cells are shown. (B) Kinetics of all cells monitored are shown as means ± SEM. Scale bar = 20 µm. (C) Analysis of TMRM fluorescence levels before each drug treatment (20, 40 and 60 min) and at the end of the experiment (80 min), additions are indicated with black arrows on top. (D) TMRM baseline levels over the first 20 min, (E) quantification of the slope of TMRM fluorescence (the change in TMRM fluorescence intensity over time in minutes), (F) the mean fold change in TMRM fluorescence intensity (G) and the mean duration for change in TMRM fluorescence intensity after each treatment are illustrated. Means ± SEM are shown from at least three independent experiments for each cell line (WT, n = 31; p53 KO, n = 42; Hke3 n = 42; Hke3 p53 KD, n = 31). *p ≤ 0.05 compared to WT control cells; #p ≤ 0.05 between cell lines (ANOVA, post-hoc Tukey).

TABLE 3. Summary of mitochondrial membrane potential measurements.
We next analyzed whether the cytosolic and mitochondrial ATP levels observed in colon cancer cells in the presence or absence of somatic mutations in KRAS and TP53 genes were associated with corresponding readings in cytosolic and mitochondrial NADH levels. An identical set of single cell imaging experiments (above-described; Figure 1A) was performed in all four combinations of HCT-116 cells with TP53 and KRAS mutational status following substrates availability. Analysis of cytosolic NADH levels, using a Peredox-mCherry NADH sensor (Hung et al., 2011), revealed heterogeneous cytosolic NADH responses to substrates (Figures 5A–C). In detail, lactate exposure, after a period of starvation, prompted an increase in cytosolic NADH (Figures 5A,B), due to the fact that extracellular lactate is imported into the starved cells and converted into pyruvate to fuel mitochondrial respiration. This was followed by a rapid decrease in the NADH fluorescence ratio across all cell types, suggesting that the malate-aspartate shuttle was functioning to regenerate mitochondrial NADH for ATP production by oxidizing NADH to NAD+ in the cytosol. A second increase/decrease in fluorescence ratio was detected immediately after glucose addition (Figures 5A,B); however, this occurred at a different extent compared to lactate exposure as cells were no longer starved and favored glycolysis over mitochondrial respiration. Finally, the addition of FCCP resulted in a third rise/drop in the cytosolic NADH (Figures 5A,B), most likely caused by a reversal of the malate-aspartate NADH shuttle, an event that can occur under stress conditions (Pelley, 2012; Kane, 2014). Quantification of individual cells, at the chosen time-points, revealed that TP53-silenced Hke3 and KRAS competent cells (Hke3 p53 KD) showed more stable basal cytosolic NADH levels (in the first 20 min) during starvation period (Figure 5D) and significantly decreased NADH levels following lactate exposure (Figures 5B,C,F,G) compared to other mutant cells. Similarly, TP53 and KRAS competent cells (Hke3) displayed reduced cytosolic NADH following glucose and FCCP addition (Figure 5C), highlighting the fact that cells possessing oncogenic KRAS, and especially those in which TP53 is absent, may have an enhanced cytosolic NADH oxidation during metabolic stress. However, cytosolic NADH oxidation occurred more rapidly in Hke3 after lactate addition and more slowly in p53 KO cells (TP53-deficient and KRAS mutated) after glucose (Figure 5E).
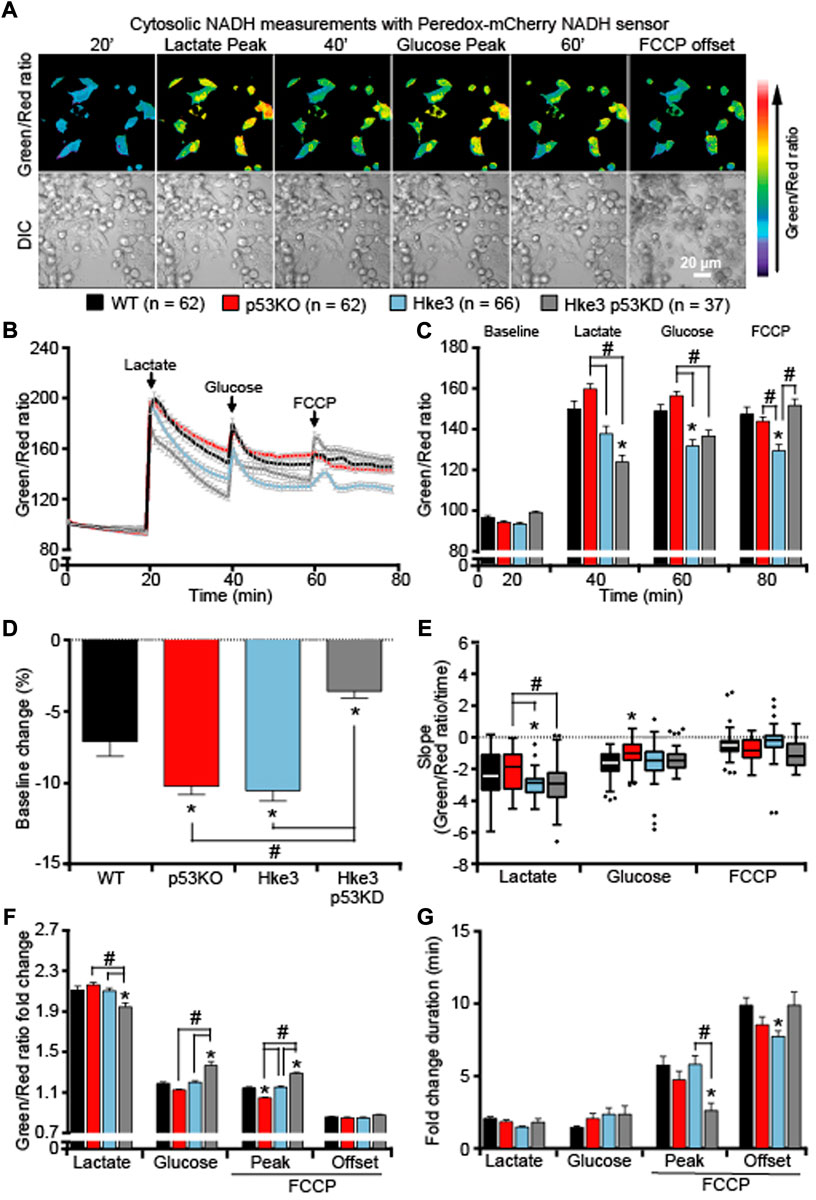
FIGURE 5. Cytosolic NADH oxidation following substrates addition depends on a correct expression of both TP53 and KRAS. WT, p53 KO, Hke3 and Hke3 p53 KD HCT-116 cells were separately transfected with the cytosolic-targeted NADH-sensitive Peredox-mCherry fluorescent probe, mounted on the heated stage of an LSM 710 confocal microscope and assayed over 80 min at 37°C. Cells were exposed as mentioned and illustrated in Figure 1A. DIC and fluorescent measurements were recorded for GFP and mCherry by time-lapse confocal microscopy. (A) Peredox imaging data are shown as a ratio images of Green (excitation with 405 nm)/Red (excitation with 561 nm). Representative DIC and Peredox ratio images of Hke3 cells which report cytosolic NADH are shown before and after drugs addition. Scale bar = 20 µm. (B) Kinetics of all cells monitored are shown as means normalized to baseline ±SEM. (C) Analysis of the cytosolic NADH levels before each drug treatment (20, 40 and 60 min) and at the end of the experiment (80 min), additions are labelled with black arrows on top of the graph. (D) Cytosolic NADH baseline levels over the first 20 min, (E) quantification of the slope of cytosolic NADH (the change in Green/Red ratio over time in minutes), (F) the mean fold change in Green/Red ratio and (G) the mean duration for change in Green/Red ratio after each treatment are illustrated. Means ± SEM are shown from at least three independent experiments for each cell line (WT, n = 62; p53 KO, n = 62; Hke3 n = 66; Hke3 p53 KD, n = 37). *p ≤ 0.05 compared to WT control cells; #p ≤ 0.05 between cell lines (ANOVA, post-hoc Tukey).
Having observed how KRAS and TP53 status altered cytosolic NADH responses, we then examined mitochondrial NADH kinetics following metabolic stress and substrates addition. As the oxidized form NAD+ does not emit visible fluorescence, it is possible to use bound NADH in a cell as a direct indicator of cellular respiration (Chance, 1954; Chance and Thorell, 1959) and exploit its auto-fluorescence to directly monitor mitochondrial NADH (Duysens and Amesz, 1957; Lucantoni et al., 2021). This is also sensitive to NADPH; however, the main auto-fluorescence signal derives from the NADH inside the mitochondria where, in fact, we find the highest signal. Quantification of NADH auto-fluorescence indicated significant decreased mitochondrial NADH following nutrients deprivation (Figures 6A–D), substrates addition and FCCP (Figures 6A–C) in all cells regardless of their mutational status compared to parental cells (WT) in which only KRAS mutation is present. However, these reduced NADH alterations were especially pronounced in cells possessing an active KRAS, independently of TP53 status (Figures 6B–D), suggesting that mitochondrial NADH is enhanced by the presence of oncogenic KRAS during metabolic stress. Moreover, analysis of the slope of mitochondrial signal revealed that mitochondrial NADH oxidation occurs faster in cells competent in TP53 and KRAS (Hke3) following lactate, glucose and FCCP addition and slower in TP53-deficient cells, regardless KRAS status, after lactate and FCCP (Figure 6E). Nevertheless, evaluation of the corresponding fold change in fluorescence showed a reduced mitochondrial NADH response particularly in cells simultaneously harboring deficient TP53 and mutated KRAS (p53 KO; Figure 6F. G).
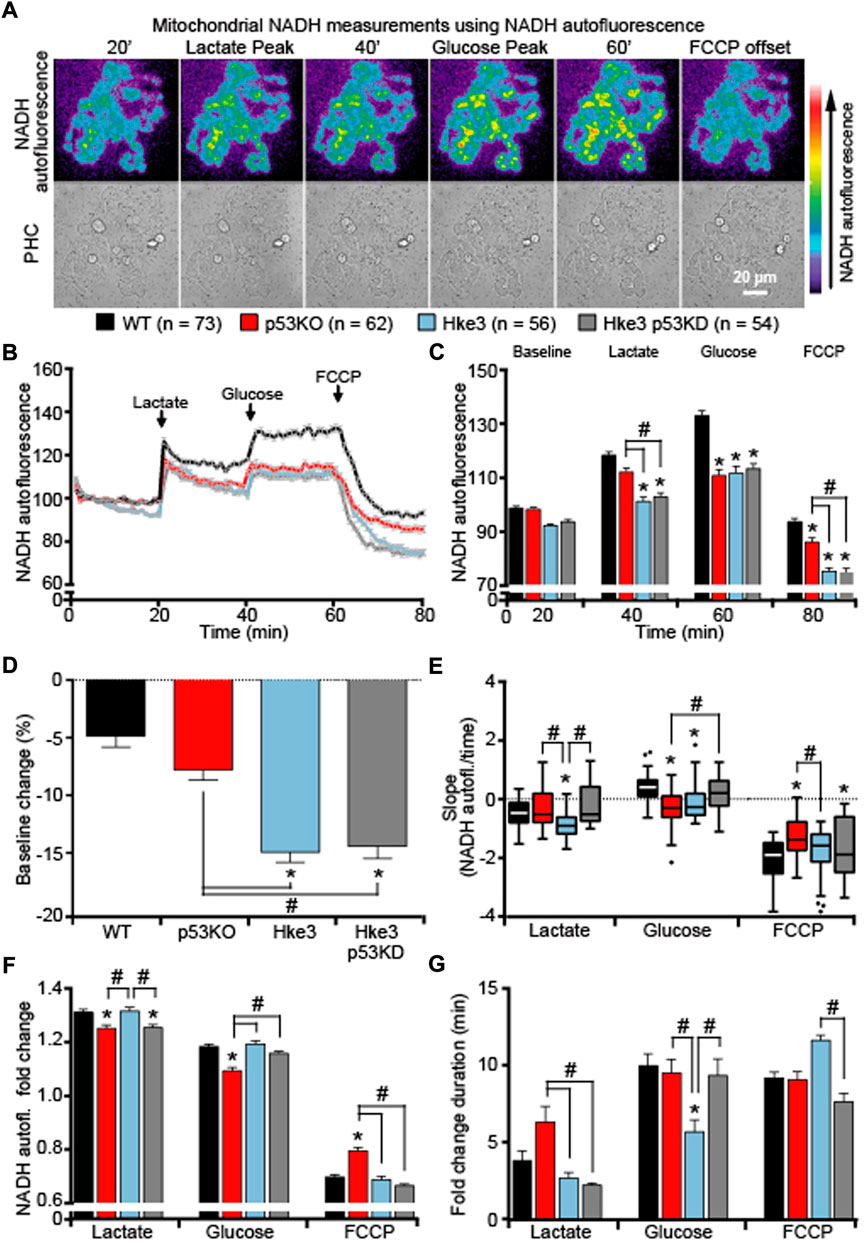
FIGURE 6. TP53-deficient KRAS mutated cells display major alterations in mitochondrial NADH in response to metabolic substrates. WT, p53 KO, Hke3 and Hke3 p53 KD HCT-116 cells were separately mounted on the heated stage of an Axiovert 200 M motorized microscope and assayed over 80 min at 37°C. Cells were exposed as mentioned and illustrated in Figure 1A. Fluorescent measurements were recorded for NADH auto-fluorescence and phase contrast (PHC) by time-lapse fluorescence microscope. Fluorescent imaging data are expressed as NADH fluorescence normalized to baseline. (A) Representative imaging data of Hke3 cells show the inhomogeneous fluorescence of NADH per cell reflecting the predominant mitochondrial localization and are selected to illustrate levels before and after drugs addition. Scale bar = 20 µm. (B) Kinetics normalized to baseline of all cells monitored shown as means ± SEM. (C) Analysis of the mitochondrial NADH levels before each drug treatment (20, 40 and 60 min) and at the end of the experiment (80 min), additions are labelled with black arrows on top of the graph. (D) Mitochondrial NADH baseline levels over the first 20 min, (E) quantification of the slope of mitochondrial NADH (the change in fluorescence intensity over time in minutes), (F) the mean fold change in fluorescence intensity and (G) the mean duration for change in fluorescence intensity after each treatment are illustrated. Means ± SEM are shown from at least three independent experiments for each cell line (WT, n = 73; p53 KO, n = 62; Hke3 n = 56; Hke3 p53 KD, n = 54). *p ≤ 0.05 compared to WT control cells; #p ≤ 0.05 between cell lines (ANOVA, post-hoc Tukey).
All together, these data exhibited that oncogenic KRAS enhances cytosolic and mitochondrial NADH and the presence of TP53 coexistent mutational status may trigger the major alterations in cellular NADH levels during metabolic stress (please see Table 4 for a summary of key findings).

TABLE 4. Summary of cytosolic and mitochondrial NADH measurements.
In the present study, we identified how tumor suppressors and/or oncogenic mutations, such as KRAS and TP53 genes, alter cancer metabolism, and specifically how they rewire cellular bioenergetic parameters. Using genetically engineered human colon cancer HCT-116 cells in combination with single cell imaging approaches, we demonstrated that TP53 and KRAS mutations and nutrients availability from the extracellular microenvironment affect cellular ATP, NADH and mitochondrial membrane potential dynamics both at cytosolic and mitochondrial level. First, we showed that, in WT KRAS cells, TP53 deficiency leads to the greatest increase in ATP following a period of nutrient starvation and an enhanced ATP production in the presence of substrates, such as lactate and glucose. Conversely, KRAS mutation in TP53-deficient cells reversed these alterations. Moreover, KRAS mutation, independently of TP53 status, produces minimal mitochondrial membrane potential variations in response to nutrients availability. Finally, we determine that the simultaneous presence of TP53 deficiency and KRAS mutation triggers significant shifts in cytosolic and mitochondrial NADH levels during metabolic stress induced by nutrients deprivation or accessibility.
KRAS and TP53 somatic mutations are two of the most common and well characterized mutations in CRC, a disease that develops in a stepwise fashion in terms of genetic mutations, activation of oncogenes and loss of function of tumor suppressing genes (Vogelstein et al., 1988; Fearon and Vogelstein, 1990; Smith et al., 2002; Hasbullah and Musa, 2021). In the recent years, several studies have been focused in understanding the effects of KRAS mutation and TP53 loss in numerous cell models and systems, largely demonstrating that they play a role in cancer cell energy metabolism through regulation of processes, such as glucose transport, lactate metabolism and mitochondrial function. In detail, it has been shown that oncogenic KRAS alters ATP production, decreases aerobic respiration and increases ROS generation, while TP53 dampens glycolysis and modulates OXPHOS and glutamine metabolism (Chen and Russo, 2012; Tarrado-Castellarnau, de Atauri and Cascante, 2016). Moreover, other research groups revealed that KRAS mutation, on its own, mainly increases cell proliferation, reprograms metabolic pathways and affects mitochondrial metabolism (Weinberg et al., 2010; Gaglio et al., 2011; Pylayeva-Gupta, Grabocka and Bar-Sagi, 2011; Simanshu, Nissley and McCormick, 2017). Similarly, p53 influences metabolic signaling through a number of different mechanisms, including the interaction with substrates and enzymes involved in energy metabolism (Vousden and Prives, 2009; Frezza and Martins, 2012; Berkers et al., 2013; Kruiswijk, Labuschagne and Vousden, 2015), i.e the activation of p53 by malate dehydrogenase (MDH) in response to low glucose (Lee et al., 2009) or increasing flux through the pentose phosphate pathway (PPP), which promotes anabolism needed for cell growth (Buzzai et al., 2007). Our study supports these previously reported activities, but also gives new important insights in KRAS and TP53 role in cancer metabolism. In fact, our data obtained from single cell imaging experiments suggested that TP53 deficiency increases cytosolic, mitochondrial and overall cellular ATP production during metabolic stress induced by nutrients availability, including substrates deprivation, glucose and lactate exposure, in HCT-116 colon cancer cells (Figures 1, 2 and Table 2). It is worth to note that cytosolic ATP depends on the amount of ATP produced and cellular ATP consumption. The kinetics of the change in cytosolic ATP concentration is then an indicator how fast this new equilibrium is reached. However, we have also to consider a change of mitochondria from ATP producer to ATP consumer with the possibility of a reversal of the ATP synthase after mitochondrial membrane potential depolarization. For example, mitochondrial ATP in cells with lactate and glucose as metabolites, treated with FCCP, increased which is an indicator that, at least the uptake of ATP from the cytosol into the mitochondrial matrix took place (a requirement for the ATP synthase reversal). Nevertheless, this did not seem to lead to a recovery of mitochondrial membrane potential which would have been indicated by an increase in TMRM nor did it lead to a recovery of mitochondrial NADH. Moreover, cell population measurements of mitochondrial and glycolytic metabolism in Hke3 and Hke3 p53 KD cells using a Seahorse analyzer demonstrated that TP53-silenced Hke3 cells display an increase of the basal respiration and tightly-coupled mitochondria, in the presence of glucose as substrate, compared to TP53 competent Hke3 cells (Figure 3). It is interesting in this context that CRC cells may rely more on OXPHOS than glycolysis compared with normal colon cells (Kaldma et al., 2014; Chekulayev et al., 2015). However, as all population-based assays, this technology is lacking high-temporal resolution. In addition, measurement of bioenergetics in individual cells, their cell-to-cell heterogeneity, and measurement of bioenergetics in specific cellular compartments (such as cytosol vs mitochondria) are only possible at single-cell resolution. Single cell analyses employing cytosolic and mitochondrial FRET-based ATP probes, fluorescent NADH sensors, or probes such as TMRM also enable dynamic computational modelling of cellular bioenergetics in dependence on their mutational status, allowing the identification of new therapeutic targets.
To date, what is known in literature is that glycolytic HCT-116 TP53-deficient cells generate more ATP when compared to TP53-proficient cells (Matoba et al., 2006) and TP53 deficiency can increase metabolites flux through PPP activity, thereby reducing substrates for ATP production during glycolysis (Flöter, Kaymak and Schulze, 2017). p53 also responds to changes in energy levels in cells (Okorokov and Milner, 1999) and it inhibits the expression of glucose transporters GLUT1 and GLUT4, thus dampening glycolysis (Schwartzenberg-Bar-Yoseph, Armoni and Karnieli, 2004; Kondoh et al., 2005), also under hypoxic conditions by inducing RRAD (RAS-related associated with diabetes), the Ras-related small GTPase (Zhang et al., 2014). This would further support our results showing that TP53-silenced Hke3 cells (Hke3 p53 KD) import glucose faster than TP53-proficient cells (Hke3), leading to a larger increase in fluorescence (Figures 1, 2 and Table 2). This effect is accompanied by the ability of p53 to support mitochondrial fatty acid oxidation (FAO) and drive OXPHOS (Lebedeva, Eaton and Shadel, 2009; Liu et al., 2014). Intriguingly, the concomitant presence of oncogenic KRAS in TP53-deficient cells entirely inverts the alteration of cellular ATP levels in response to substrates in our system (Figures 1, 2 and Table 2). In line with our findings, transformed KRAS mouse fibroblasts displayed lower ATP content, reduced OXPHOS ability and more sensitivity to glucose depletion when compared to their immortalized normal counterparts (F. Chiaradonna et al., 2006a; Ferdinando Chiaradonna et al., 2006b). Oncogenic KRAS has also been shown to have significant effects on the activity and function of the mitochondria, suppressing mitochondrial complex I activity (Hu et al., 2012), leading to reduced respiration (Baracca et al., 2010), possibly decreasing mitochondrial ATP generation. Otherwise, KRAS mutated cells use OXPHOS-independent ROS generation through complex III for growth, and utilize glucose metabolism to fuel the PPP rather than ATP production (Weinberg et al., 2010). It has also been shown that the activity of NF-κB resulted enhanced in TP53-deficient primary mouse embryonic fibroblasts and, in these cells, the oncogenic RAS-induced cell transformation and acceleration of aerobic glycolysis were blocked in the absence of NF-κB. However, this was restored by GLUT3 expression, indicating that TP53 loss can facilitate the glycolysis by upregulating the expression of GLUT3 through NF-κB pathway (Kawauchi et al., 2008). Furthermore, it is known that the glycolytic pathway is regulated by p53 through the expression of Hexokinase II (HK2), which controls the production of Glucose-6-Phosphate (G6P) (Mathupala, Heese and Pedersen, 1997; Flöter, Kaymak and Schulze, 2017). Mutations or deletions in TP53 in cancers result in the upregulation of both glucose transporters and HK2 and glycolysis by expression of glycolytic enzymes, like PGM, and inhibition of Tumor Protein 53-Induced Glycolysis and Apoptosis Regulator (TIGAR) (DeBerardinis, 2008). Cancer-associated mutations in TP53 have been shown to result in loss of the ability to block G6PD activity, resulting in an increased PPP flux and glycolysis (Jiang et al., 2011). Another target of TP53 is Glutaminase 2 (GLS2), which is localized in the mitochondria and hydrolyzes glutamine into glutamate, thereby promoting ATP production through the mitochondrial oxidative phosphorylation (Hu et al., 2010; Liu et al., 2019; Yu et al., 2022). In addition, KRAS has also been demonstrated to lead to an increase of glycolytic enzyme expression (Ying et al., 2012; Pupo et al., 2019).
Notably, we also demonstrate that KRAS mutation leads to minimal mitochondrial membrane potential changes, detected in terms of alterations in TMRM fluorescence levels, in response to metabolic substrates and this event occurs independently of TP53 status (Figure 4 and Table 3). Indeed, oncogenic KRAS inhibits mitochondrial function by inducing Hypoxia Inducing Factors 1α (HIF-1 α), which causes increased expression of pyruvate dehydrogenase kinase 1 (PDK1) that, in turn, prevents the activity of pyruvate dehydrogenase (PDH), decreasing the amount of pyruvate that enters the TCA cycle and suppressing mitochondrial O2 consumption (Kim et al., 2006; Chun et al., 2010; Kaplon et al., 2013; Kierans and Taylor, 2021).
Additionally, our results evidence that, in this human colon cancer cell model, co-operation between KRAS and p53 is crucial in explicating a correct cellular NADH oxidation. In fact, the double concomitant deficiency of TP53 and mutation in KRAS produced significantly altered cytosolic and mitochondrial NADH levels in response to substrates, indicating a clear interplay between them during metabolic stress (Figures 5, 6 and Table 4). In depth, while cytosolic NADH oxidation during lactate exposure occurred rapidly in TP53 and KRAS competent cells (Hke3), thus exhibiting a greater capacity for OXPHOS and superior mitochondrial function, and more slowly during glucose addition in TP53-deficient and KRAS mutated cells (p53 KO; Figure 5), mitochondrial NADH oxidation resulted faster in TP53 and KRAS competent cells (Hke3) during lactate and glucose exposure (Figure 6), implying that both TP53 and KRAS are needed for a proper mitochondrial function. This could indicate higher lactate dehydrogenase (LDH) activity in KRAS-mutated cells or a higher rate of NADH oxidation in WT KRAS cells. For instance, some reports have shown that LDH expression and activity are increased in KRAS mutated lung cancers (McCleland et al., 2013; Xie et al., 2014) and increased GLUT expression in KRAS mutated cells that amplified glycolysis rate in pancreatic cancer (Bryant et al., 2014). Of note, a superior mitochondrial function may lead to increased cytosolic NADH oxidation by the malate-aspartate shuttle, responsible for conversion of oxaloacetate to malate in the inner mitochondrial membrane space and aspartate in the mitochondrial matrix (Birsoy et al., 2015; Sullivan et al., 2015). Oncogenic KRAS produces increased expression of the malate dehydrogenase (MDH) and aspartate aminotransferase (GOT), thus regulating the malate-aspartate shuttle activity (Lyssiotis et al., 2013; Hanse et al., 2017). As TP53-deficient cells displayed lower increases in NADH fluorescence compared to TP53-proficient cells (Figures 5, 6), this may also indicate reduced activity of the malate-aspartate shuttle in cells where TP53 is absent. Several links between TP53-related cancer and cell metabolism and MDH1 have been found (Bensaad et al., 2006; Matoba et al., 2006; Kawauchi et al., 2008; Lee et al., 2009).
In our study, the interplay between different KRAS and TP53 mutational status is obvious and leads to an impairment of both cytosolic and mitochondrial bioenergetics. However, it is worth noting that all our experiments have been performed in atmospheric normoxic oxygen conditions (21%) and we here explore only loss of function of TP53. Indeed, we are aware that cancer tissue oxygenation, and especially in the core of the tumor, would be a hypoxic environment (1–4%) and some p53 missense mutant proteins demonstrate an ability to gain new functions.
Long ago, interactions between RAS and TP53 have been demonstrated to contribute to transformation of normal cells (Eliyahu et al., 1984; Parada et al., 1984). Mutant TP53 has been shown to co-operate with oncogenic KRAS in the formation of PDAC tumors in mouse models (Bailey et al., 2016) and in pancreatic cancer metastasis (Weissmueller et al., 2014). Similarly, combination of oncogenic KRAS and TP53 loss triggered lung tumorigenesis and reliance on catabolism of branched-chain amino acids (BCAAs) as nutrients (Mayers et al., 2016) and KRAS has been shown to suppress p53 by activating the NRF2-regulated antioxidant defense system in human lung cancer cells (Yang et al., 2020). Studies on CRC patients have found that co-mutations of both TP53 and KRAS were rare, suggesting alternate pathways for them in the development of CRC (Smith et al., 2002). Conversely, other reports detected co-existing mutations in 26 out of 140 patients (Tortola et al., 1999), and more recently 26% of 229 patients presented mutations of both KRAS and TP53 (Chow et al., 2016) and a mild correlation was observed between the expression of the KRAS gene and TP53 immunoexpression in colorectal adenocarcinoma (Rachmawati et al., 2019).
Rewiring of cellular metabolism represents a fundamental trait of most cancer cells. Beyond its role in providing energy substrates and biomolecules for cell proliferation, cellular metabolism has also been found to be tightly associated with cancer cell fate and phenotype, and to contribute to the complex tumor heterogeneity that exists within the tumor mass (Lee, 2015). Differences in cellular bioenergetics influences how tumor cells interact with immune cells and other cells of the surrounding tumor microenvironment (TME) (Fu et al., 2017). It has been shown that the presence of TP53 and KRAS mutations has strong implications for the function of the surrounding TME (Michel et al., 2021; Nenkov et al., 2021; Pereira et al., 2022), immune signaling and escape (Mantovani et al., 2008; Hamarsheh et al., 2020). Both immune and stromal cells have been shown to be compromised by TP53- and KRAS-mediated tumor signaling, thereby enhancing tumor development and growth. In CRC, a high prevalence of KRAS mutations correlates with chronic inflammatory diseases, and TP53 mutations contribute to immune surveillance, angiogenesis and remodeling of the extracellular matrix (Michel et al., 2021; Nenkov et al., 2021; Pereira et al., 2022).
In conclusion, our results identify how, in colon cancer cells, the oncogenic mutation in KRAS and deletion of tumor suppressor TP53 rewire cancer metabolism and, in particular, how they co-operate in this system, to alter cytosolic and mitochondrial bioenergetics.
The raw data supporting the conclusions of this article will be made available by the authors, without undue reservation.
JK, HD, IL-F, MS, JHMP, and BD designed the study. JK, HD, IL-F, NN, and BD designed and performed experiments. JK, HD, IL-F, NN, MS, and BD analyzed and interpreted data. JHMP and BD wrote the manuscript. JHMP acquired funding.
This work was generously supported through grants from Science Foundation Ireland and the Health Research Board (13/IA/1881; 16/US/3301; 18/RI/5792) to JP.
We thank Prof. B. Vogelstein (The Johns Hopkins University School of Medicine, Baltimore, MD, United States) for kindly providing TP53-deficient HCT-116 cells, Prof. W. Kolch (University College Dublin, Dublin, Republic of Ireland) for HCT-116 Hke3 cells, and Ina Woods for excellent technical support.
The authors declare that the research was conducted in the absence of any commercial or financial relationships that could be construed as a potential conflict of interest.
All claims expressed in this article are solely those of the authors and do not necessarily represent those of their affiliated organizations, or those of the publisher, the editors and the reviewers. Any product that may be evaluated in this article, or claim that may be made by its manufacturer, is not guaranteed or endorsed by the publisher.
The Supplementary Material for this article can be found online at: https://www.frontiersin.org/articles/10.3389/fcell.2022.893677/full#supplementary-material
Andreyev, H. J. N., Norman, A. R., Cunningham, D., Oates, J., Dix, B. R., Iacopetta, B. J., et al. (2001). Kirsten ras mutations in patients with colorectal cancer: The “RASCAL II” study. Br. J. Cancer 85 (5), 692–696. doi:10.1054/bjoc.2001.1964
Baracca, A., Chiaradonna, F., Sgarbi, G., Solaini, G., Alberghina, L., and Lenaz, G. (2010). Mitochondrial Complex I decrease is responsible for bioenergetic dysfunction in K-ras transformed cells. Biochim. Biophys. Acta 1797 (2), 314–323. doi:10.1016/j.bbabio.2009.11.006
Bensaad, K., Tsuruta, A., Selak, M. A., Vidal, M. N. C., Nakano, K., Bartrons, R., et al. (2006). TIGAR, a p53-inducible regulator of glycolysis and apoptosis. Cell. 126 (1), 107–120. doi:10.1016/j.cell.2006.05.036
Berkers, C. R., Maddocks, O. D. K., Cheung, E. C., Mor, I., and Vousden, K. H. (2013). Metabolic regulation by p53 family members. Cell. Metab. 18, 617–633. doi:10.1016/j.cmet.2013.06.019
Birsoy, K., Wang, T., Chen, W. W., Freinkman, E., Abu-Remaileh, M., and Sabatini, D. M. (2015). An essential role of the mitochondrial electron transport chain in cell proliferation is to enable aspartate synthesis. Cell. 162 (3), 540–551. doi:10.1016/j.cell.2015.07.016
Brattain, M. G., Levine, A. E., Chakrabarty, S., Yeoman, L. C., Willson, J. K., and Long, B. (1984). Heterogeneity of human colon carcinoma. Cancer Metastasis Rev. 3 (3), 177–191. doi:10.1007/BF00048384
Bryant, K. L., Mancias, J. D., Kimmelman, A. C., and Der, C. J. (2014). Kras: Feeding pancreatic cancer proliferation. Trends biochem. Sci. 39, 91–100. doi:10.1016/j.tibs.2013.12.004
Bunz, F., DutriAux, A., Lengauer, C., Waldman, T., Zhou, S., Brown, J. P., et al. (1998). Requirement for p53 and p21 to sustain G2 arrest after DNA damage. Science (5393), 1497–1501. doi:10.1126/science.282.5393.1497
Buzzai, M., Jones, R. G., Amaravadi, R. K., Lum, J. J., DeBerardinis, R. J., Zhao, F., et al. (2007). Systemic treatment with the antidiabetic drug metformin selectively impairs p53-deficient tumor cell growth. Cancer Res. 67 (14), 6745–6752. doi:10.1158/0008-5472.CAN-06-4447
Cannino, G., Ciscato, F., Masgras, I., Sanchez-Martin, C., and Rasola, A. (2018). Metabolic plasticity of tumor cell mitochondria. Front. Oncol. 8, 333. doi:10.3389/fonc.2018.00333
Carpenter, A. E., Jones, T. R., Lamprecht, M. R., Clarke, C., Kang, I. H., Friman, O., et al. (2006). CellProfiler: Image analysis software for identifying and quantifying cell phenotypes. Genome Biol. 7 (10), R100. doi:10.1186/gb-2006-7-10-r100
Chance, B. (1954). Spectrophotometry of intracellular respiratory pigments. Science 120 (3124), 767–775. doi:10.1126/science.120.3124.767
Chance, B., and Thorell, B. (1959). Localization and assay of respiratory enzymes in single living cells: Fluorescence measurements of mitochondrial pyridine nucleotide in aerobiosis and anaerobiosis. Nature 184 (4691), 931–934. doi:10.1038/184931a0
Charitou, T., Srihari, S., Lynn, M. A., Jarboui, M. A., Fasterius, E., Moldovan, M., et al. (2019). Transcriptional and metabolic rewiring of colorectal cancer cells expressing the oncogenic KRASG13D mutation. Br. J. Cancer 121 (1), 37–50. doi:10.1038/s41416-019-0477-7
Chekulayev, V., Mado, K., Shevchuk, I., Koit, A., Kaldma, A., Klepinin, A., et al. (2015). Metabolic remodeling in human colorectal cancer and surrounding tissues: Alterations in regulation of mitochondrial respiration and metabolic fluxes. Biochem. Biophys. Rep. 4, 111–125. doi:10.1016/j.bbrep.2015.08.020
Chen, J. Q., and Russo, J. (2012). Dysregulation of glucose transport, glycolysis, TCA cycle and glutaminolysis by oncogenes and tumor suppressors in cancer cells. Biochim. Biophys. Acta 1826, 370–384. doi:10.1016/j.bbcan.2012.06.004
Chiaradonna, F., Gaglio, D., Vanoni, M., and Alberghina, L. (2006a). Expression of transforming K-Ras oncogene affects mitochondrial function and morphology in mouse fibroblasts. Biochim. Biophys. Acta 1757 (9–10), 1338–1356. doi:10.1016/j.bbabio.2006.08.001
Chiaradonna, F., Sacco, E., Manzoni, R., GiorgioM., , VanoniM., , and Alberghina, L. (2006b). Ras-dependent carbon metabolism and transformation in mouse fibroblasts. Oncogene 25 (39), 5391–5404. doi:10.1038/sj.onc.1209528
Chow, O. S., Kuk, D., Keskin, M., Smith, J. J., Camacho, N., Pelossof, R., et al. (2016). KRAS and combined KRAS/TP53 mutations in locally advanced rectal cancer are independently associated with decreased response to neoadjuvant therapy. Ann. Surg. Oncol. 23 (8), 2548–2555. doi:10.1245/s10434-016-5205-4
Chun, S. Y., Johnson, C., Washburn, J. G., Cruz-Correa, M. R., Dang, D. T., and Dang, L. H. (2010). Oncogenic KRAS modulates mitochondrial metabolism in human colon cancer cells by inducing HIF-1α and HIF-2α target genes. Mol. Cancer 9, 293. doi:10.1186/1476-4598-9-293
De Berardinis, R. J., and Chandel, N. S. (2016). Fundamentals of cancer metabolism. Sci. Adv. 2, e1600200. doi:10.1126/sciadv.1600200
DeBerardinis, R. J., and Chandel, N. S. (2020). We need to talk about the Warburg effect. Nat. Metab. 2, 127–129. doi:10.1038/s42255-020-0172-2
DeBerardinis, R. J. (2008). Is cancer a disease of abnormal cellular metabolism? New angles on an old idea. Genet. Med. 10, 767–777. doi:10.1097/GIM.0b013e31818b0d9b
DeBerardinis, R. J., Lum, J. J., Hatzivassiliou, G., and Thompson, C. B. (2008). The Biology of cancer: Metabolic reprogramming fuels cell growth and proliferation. Cell. Metab. 7, 11–20. doi:10.1016/j.cmet.2007.10.002
Downward, J. (1998). Ras signalling and apoptosis. Curr. Opin. Genet. Dev. 8 (1), 49–54. doi:10.1016/S0959-437X(98)80061-0
Duysens, L. N. M., and Amesz, J. (1957). Fluorescence spectrophotometry of reduced phosphopyridine nucleotide in intact cells in the near-ultraviolet and visible region. Biochim. Biophys. Acta 24 (C), 19–26. doi:10.1016/0006-3002(57)90141-5
Eliyahu, D., Raz, A., Gruss, P., Givol, D., and OrenM., (1984). Participation of p53 cellular tumour antigen in transformation of normal embryonic cells. Nature 312 (5995), 646–649. doi:10.1038/312646a0
Epstein, T., Gatenby, R. A., and Brown, J. S. (2017). The Warburg effect as an adaptation of cancer cells to rapid fluctuations in energy demand. PLoS ONE 12 (9), e0185085. doi:10.1371/journal.pone.0185085
Fasterius, E., Raso, C., Kennedy, S., Rauch, N., Lundin, P., Kolch, W., et al. (2017). A novel RNA sequencing data analysis method for cell line authentication. PLoS ONE 12 (2), e0171435. doi:10.1371/journal.pone.0171435
Fearon, E. R., and Vogelstein, B. (1990). A genetic model for colorectal tumorigenesis. Cell. 61, 759–767. doi:10.1016/0092-8674(90)90186-I
Flöter, J., Kaymak, I., and Schulze, A. (2017). Regulation of metabolic activity by p53. Metabolites 7, E21. doi:10.3390/metabo7020021
Frezza, C., and Martins, C. P. (2012). From tumor prevention to therapy: Empowering p53 to fight back. Drug resist. updat. 15 (5–6), 258–267. doi:10.1016/j.drup.2012.10.001
Fu, Y., Liu, S., Yin, S., Niu, W., Xiong, W., Tan, M., et al. (2017). The reverse Warburg effect is likely to be an Achilles’ heel of cancer that can be exploited for cancer therapy. Oncotarget 8, 57813–57825. doi:10.18632/oncotarget.18175
Gaglio, D., Metallo, C. M., Gameiro, P. A., Hiller, K., Danna, L. S., Balestrieri, C., et al. (2011). Oncogenic K-Ras decouples glucose and glutamine metabolism to support cancer cell growth. Mol. Syst. Biol. 7, 523. doi:10.1038/msb.2011.56
Geschickter, C. F., and Warburg, O. (1930). Warburg report on the metabolism of tumors. J. Chem. Educ doi:10.1021/ed007p179
Hamarsheh, S., GroB, O., Brummer, T., and Zeiser, R. (2020). Immune modulatory effects of oncogenic KRAS in cancer. Nat. Commun. 11 (1), 5439. doi:10.1038/s41467-020-19288-6
Hanse, E. A., Ruan, C., KachManM., , Wang, D., Lowman, X. H., and KelekAr, A. (2017). Cytosolic malate dehydrogenase activity helps support glycolysis in actively proliferating cells and cancer. Oncogene 36 (27), 3915–3924. doi:10.1038/onc.2017.36
Hasbullah, H. H., and Musa, M. (2021). Gene therapy targeting p53 and kras for colorectal cancer treatment: A myth or the way forward? Int. J. Mol. Sci. 22, 11941. doi:10.3390/ijms222111941
Heiden, M. G. V., Cantley, L. C., and Thompson, C. B. (2009). Understanding the warburg effect: The metabolic requirements of cell proliferation. Science 324, 1029–1033. doi:10.1126/science.1160809
Hu, W., Zhang, C., Wu, R., Sun, Y., Levine, A., and Feng, Z. (2010). Glutaminase 2, a novel p53 target gene regulating energy metabolism and antioxidant function. Proc. Natl. Acad. Sci. U. S. A. 107 (16), 7455–7460. doi:10.1073/pnas.1001006107
Hu, Y., Lu, W., Chen, G., Wang, P., Chen, Z., Zhou, Y., et al. (2012). K-ras G12V transformation leads to mitochondrial dysfunction and a metabolic switch from oxidative phosphorylation to glycolysis. Cell. Res. 22 (2), 399–412. doi:10.1038/cr.2011.145
Hung, Y. P., Albeck, J. G., Tantama, M., and Yellen, G. (2011). Imaging cytosolic NADH-NAD + redox state with a genetically encoded fluorescent biosensor. Cell. Metab. 14 (4), 545–554. doi:10.1016/j.cmet.2011.08.012
Imamura, H., Nhat, K. P. H., Togawa, H., Saito, K., Iino, R., Kato-Yamada, Y., et al. (2009). Visualization of ATP levels inside single living cells with fluorescence resonance energy transfer-based genetically encoded indicators. Proc. Natl. Acad. Sci. U. S. A. 106, 15651–15656. doi:10.1073/pnas.0904764106
Jiang, P., Du, W., Wang, X., Mancuso, A., Gao, X., Wu, M., et al. (2011). P53 regulates biosynthesis through direct inactivation of glucose-6-phosphate dehydrogenase. Nat. Cell. Biol. 13 (3), 310–316. doi:10.1038/ncb2172
Jones, R. G., and Thompson, C. B. (2009). Tumor suppressors and cell metabolism: A recipe for cancer growth. Genes. Dev doi:10.1101/gad.1756509
Kaldma, A., Klepinin, A., Chekulayev, V., Mado, K., Shevchuk, I., Timohhina, N., et al. (2014). An in situ study of bioenergetic properties of human colorectal cancer: The regulation of mitochondrial respiration and distribution of flux control among the components of ATP synthasome. Int. J. Biochem. Cell. Biol. 55, 171–186. doi:10.1016/j.biocel.2014.09.004
Kane, D. A. (2014). Lactate oxidation at the mitochondria: A lactate-malate-aspartate shuttle at work. Front. Neurosci. 8 (OCT), 366. doi:10.3389/fnins.2014.00366
Kaplon, J., Zheng, L., Meissl, K., Chaneton, B., Selivanov, V. A., Mackay, G., et al. (2013). A key role for mitochondrial gatekeeper pyruvate dehydrogenase in oncogene-induced senescence. Nature 498 (7452), 109–112. doi:10.1038/nature12154
Kasischke, K. A., Vishwasrao, H. D., Fisher, P. J., Zipfel, W. R., and Webb, W. W. (2004). Neural activity triggers neuronal oxidative metabolism followed by astrocytic glycolysis. Science 305 (5680), 99–103. doi:10.1126/science.1096485
Kawauchi, K., Araki, K., Tobiume, K., and Tanaka, N. (2008). p53 regulates glucose metabolism through an IKK-NF-kappaB pathway and inhibits cell transformation Nat. Cell. Biol. 10 (5), 611–618. doi:10.1038/ncb1724
Kierans, S. J., and Taylor, C. T. (2021). Regulation of glycolysis by the hypoxia-inducible factor (HIF): Implications for cellular physiology. J. Physiol. 599, 23–37. doi:10.1113/JP280572
Kim, J. W., Tchernyshyov, I., Semenza, G. L., and Dang, C. V. (2006). HIF-1-mediated expression of pyruvate dehydrogenase kinase: A metabolic switch required for cellular adaptation to hypoxia. Cell. Metab. 3 (3), 177–185. doi:10.1016/j.cmet.2006.02.002
Kondoh, H., Lleonart, M. E., Gil, J., Wang, J., Degan, P., Peters, G., et al. (2005). Glycolytic enzymes can modulate cellular life span. Cancer Res. 65 (1), 177–185. doi:10.1158/0008-5472.177.65.1
Kruiswijk, F., Labuschagne, C. F., and Vousden, K. H. (2015). P53 in survival, death and metabolic health: A lifeguard with a licence to kill. Nat. Rev. Mol. Cell. Biol. 16, 393–405. doi:10.1038/nrm4007
Lebedeva, M. A., Eaton, J. S., and Shadel, G. S. (2009). Loss of p53 causes mitochondrial DNA depletion and altered mitochondrial reactive oxygen species homeostasis. Biochim. Biophys. Acta 1787 (5), 328–334. doi:10.1016/j.bbabio.2009.01.004
Lee, M., and Yoon, J. H. (2015). Metabolic interplay between glycolysis and mitochondrial oxidation: The reverse Warburg effect and its therapeutic implication. World J. Biol. Chem. 6 (3), 148–161. doi:10.4331/wjbc.v6.i3.148
Lee, S. M., Kim, J. H., Cho, E. J., and Youn, H. D. (2009). A nucleocytoplasmic malate dehydrogenase regulates p53 transcriptional activity in response to metabolic stress. Cell. Death Differ. 16 (5), 738–748. doi:10.1038/cdd.2009.5
Liu, J., Zhang, C., Hu, W., and Feng, Z. (2019). Tumor suppressor p53 and metabolism. J. Mol. Cell. Biol. 11, 284–292. doi:10.1093/jmcb/mjy070
Liu, Y., He, Y., Jin, A., Tikunov, A. P., Zhou, L., Tollini, L. A., et al. (2014). Ribosomal protein-Mdm2-p53 pathway coordinates nutrient stress with lipid metabolism by regulating MCD and promoting fatty acid oxidation. Proc. Natl. Acad. Sci. U. S. A. 111 (23), E2414–E2422. doi:10.1073/pnas.1315605111
Lowy, D. R., and Willumsen, B. M. (1993). Function and regulation of ras. Annu. Rev. Biochem. 62, 851–891. doi:10.1146/annurev.bi.62.070193.004223
Lucantoni, F., Lindner, A. U., O'Donovan, N., Dussmann, H., and Prehn, J. H. M. (2018). Systems modeling accurately predicts responses to genotoxic agents and their synergism with BCL-2 inhibitors in triple negative breast cancer cells Cell. Death Dis. 9 (2), 42. doi:10.1038/s41419-017-0039-y
Lucantoni, F., Salvucci, M., Dussmann, H., and Prehn, J. H. M. (2021). BCL(X)L and BCL2 increase mitochondrial dynamics in breast cancer cell: Evidence from functional and genetic studies. Biochim. Biophys. Acta. Mol. Cell. Res. 1868 (10), 119095. doi:10.1016/j.bbamcr.2021.119095
Lyssiotis, C. A., Son, J., Cantley, L. C., and Kimmelman, A. C. (2013). Pancreatic cancers rely on a novel glutamine metabolism pathway to maintain redox balance. Cell. Cycle 12, 1987–1988. doi:10.4161/cc.25307
Mantovani, A., Allavena, P., Sica, A., and Balkwill, F. (2008). Cancer-related inflammation. Nature 454, 436–444. doi:10.1038/nature07205
Matallanas, D., Birtwistle, M., Romano, D., Zebisch, A., Rauch, J., von Kriegsheim, A., et al. (2011). Raf family kinases: Old dogs have learned new tricks. Genes. Cancer. 2 (3), 232–260. doi:10.1177/1947601911407323
Mathupala, S. P., Heese, C., and Pedersen, P. L. (1997). Glucose catabolism in cancer cells. The type II hexokinase promoter contains functionally active response elements for the tumor suppressor p53. J. Biol. Chem. 272 (36), 22776–22780. doi:10.1074/jbc.272.36.22776
Matoba, S., Kang, J. G., Patino, W. D., Wragg, A., Boehm, M., Gavrilova, O., et al. (2006). p53 regulates mitochondrial respiration. Science 312 (5780), 1650–1653. doi:10.1126/science.1126863
Mayers, J. R., Torrence, M. E., Danai, L. V., Papagiannakopoulos, T., Davidson, S. M., Bauer, M. R., et al. (2016). Tissue of origin dictates branched-chain amino acid metabolism in mutant Kras-driven cancers. Science 353 (6304), 1161–1165. doi:10.1126/science.aaf5171
McCleland, M. L., Adler, A. S., Deming, L., Cosino, E., Lee, L., Blackwood, E. M., et al. (2013). Lactate dehydrogenase B is required for the growth of KRAS-dependent lung adenocarcinomas. Clin. Cancer Res. 19 (4), 773–784. doi:10.1158/1078-0432.CCR-12-2638
Michel, M., Kaps, L., Maderer, A., Galle, P. R., and Moehler, M. (2021). The role of p53 dysfunction in colorectal cancer and its implication for therapy. Cancers 13, 2296. doi:10.3390/cancers13102296
Mookerjee, S. A., Gerencser, A. A., Nicholls, D. G., and Brand, M. D. (2017). Quantifying intracellular rates of glycolytic and oxidative ATP production and consumption using extracellular flux measurements. J. Biol. Chem. 292 (17), 7189–7207. doi:10.1074/jbc.M116.774471
Muzny, D. M., Bainbridge, M. N., Chang, K., Dinh, H. H., Drummond, J. A., Fowler, G., et al. (2012). Comprehensive molecular characterization of human colon and rectal cancer. Nature 487 (7407), 330–337. doi:10.1038/nature11252
Nakayama, M., and Oshima, M. (2019). Mutant p53 in colon cancer. J. Mol. Cell. Biol. 11, 267–276. doi:10.1093/jmcb/mjy075
Nenkov, M., Ma, Y., GaBler, N., and Chen, Y. (2021). Metabolic reprogramming of colorectal cancer cells and the microenvironment: Implication for therapy. Int. J. Mol. Sci. 22, 6262. doi:10.3390/ijms22126262
Okorokov, A. L., and Milner, J. (1999). An ATP/ADP-Dependent molecular switch regulates the stability of p53-DNA complexes. Mol. Cell Biol. 19 (11), 7501–7510. doi:10.1128/mcb.19.11.7501
Parada, L. F., Land, H., Weinberg, R. A., Wolf, D., and Rotter, V. (1984). Cooperation between gene encoding p53 tumour antigen and ras in cellular transformation. Nature 312 (5995), 649–651. doi:10.1038/312649a0
Patterson, G. H., Knobel, S. M., Arkhammar, P., Thastrup, O., and Piston, D. W. (2000). Separation of the glucose-stimulated cytoplasmic and mitochondrial NAD(P)H responses in pancreatic islet β cells. Proc. Natl. Acad. Sci. U. S. A. 97 (10), 5203–5207. doi:10.1073/pnas.090098797
Pavlova, N. N., Zhu, J., and Thompson, C. B. (2022). The hallmarks of cancer metabolism: Still emerging. Cell. Metab. 34 (3), 355–377. doi:10.1016/j.cmet.2022.01.007
Pelley, J. W. (2012). “Organization, synthesis, and repair of DNA,” in Elsevier’s integrated review biochemistry. doi:10.1016/b978-0-323-07446-9.00015-5
Pereira, F., Ferreira, A., Reis, C. A., Sousa, M. J., Oliveira, M. J., and Preto, A. (2022). KRAS as a modulator of the inflammatory tumor microenvironment: Therapeutic implications. Cells 11 (3), 398. doi:10.3390/cells11030398
Pupo, E., Avanzato, D., Middonti, E., Bussolino, F., and Lanzetti, L. (2019). KRAS-driven metabolic rewiring reveals novel actionable targets in cancer. Front. Oncol. 9, 848. doi:10.3389/fonc.2019.00848
Pylayeva-Gupta, Y., Grabocka, E., and Bar-Sagi, D. (2011). RAS oncogenes: Weaving a tumorigenic web. Nat. Rev. Cancer 11, 761–774. doi:10.1038/nrc3106
Qian, W., and Van Houten, B. (2010). Alterations in bioenergetics due to changes in mitochondrial DNA copy number. Methods 51, 452–457. doi:10.1016/j.ymeth.2010.03.006
Rachmawati, M., Yulianti, H., Hernowo, B. S., Suryanti, S., Wijaya, I., Rahadiani, N., et al. (2019). The correlation of KRAS gene expression and P53 immunoexpression in colorectal adenocarcinoma. Open Access Maced. J. Med. Sci. 7 (12), 1940–1945. doi:10.3889/oamjms.2019.549
Robles, A. I., Jen, J., and Harris, C. C. (2016). Clinical outcomes of TP53 mutations in cancers. Cold Spring Harb. Perspect. Med. 6 (9), a026294. doi:10.1101/cshperspect.a026294
Schwartzenberg-Bar-Yoseph, F., Armoni, M., and Karnieli, E. (2004). The tumor suppressor p53 down-regulates glucose transporters GLUT1 and GLUT4 gene expression. Cancer Res. 64 (7), 2627–2633. doi:10.1158/0008-5472.CAN-03-0846
Scott, A., Goffredo, P., Ginader, T., Hrabe, J., Gribovskaja-Rupp, I., Kapadia, M. R., et al. (2020). The impact of KRAS mutation on the presentation and prognosis of non-metastatic colon cancer: An analysis from the national cancer database. J. Gastrointest. Surg. 24 (6), 1402–1410. doi:10.1007/s11605-020-04543-4
Shirasawa, S., FuruseM., , YokoyamaN., , and Sasazuki, T. (1993). Altered growth of human colon cancer cell lines disrupted at activated Ki-ras. Science 260 (5104), 85–88. doi:10.1126/science.8465203
Shuttleworth, C. W., Brennan, A. M., and Connor, J. A. (2003). NAD(P)H fluorescence imaging of postsynaptic neuronal activation in murine hippocampal slices. J. Neurosci. 23 (8), 3196–3208. doi:10.1523/jneurosci.23-08-03196.2003
Simanshu, D. K., Nissley, D. V., and McCormick, F. (2017) ‘RAS proteins and their regulators in human disease’, Cell. 170(1):17–33. doi:10.1016/j.cell.2017.06.009
Slattery, M. L., Mullany, L. E., Sakoda, L. C., Wolff, R. K., Samowitz, W. S., and Herrick, J. S. (2018). The MAPK-signaling pathway in colorectal cancer: Dysregulated genes and their association with micrornas. Cancer Inf. 17, 1176935118766522. doi:10.1177/1176935118766522
Smith, G., Carey, F. A., Beattie, J., Wilkie, M. J. V., Lightfoot, T. J., Coxhead, J., et al. (2002). Mutations in APC, Kirsten-ras, and p53 - alternative genetic pathways to colorectal cancer. Proc. Natl. Acad. Sci. U. S. A. 99 (14), 9433–9438. doi:10.1073/pnas.122612899
Sullivan, L. B., Gui, D. Y., Hosios, A. M., Bush, L. N., Freinkman, E., and Vander Heiden, M. G. (2015). Supporting aspartate biosynthesis is an essential function of respiration in proliferating cells. Cell. 162 (3), 552–563. doi:10.1016/j.cell.2015.07.017
Sung, H., Ferlay, J., Siegel, R. L., Laversanne, M., Soerjomataram, I., Jemal, A., et al. (2021). Global cancer statistics 2020: GLOBOCAN estimates of incidence and mortality worldwide for 36 cancers in 185 countries. Ca. Cancer J. Clin. 71 (3), 209–249. doi:10.3322/caac.21660
Sur, S., Pagliarini, R., Bunz, F., Rago, C., Diaz, L. A., Kinzler, K. W., et al. (2009). A panel of isogenic human cancer cells suggests a therapeutic approach for cancers with inactivated p53. Proc. Natl. Acad. Sci. U. S. A. 106 (10), 3964–3969. doi:10.1073/pnas.0813333106
Tarrado-Castellarnau, M., de Atauri, P., and Cascante, M. (2016). Oncogenic regulation of tumor metabolic reprogramming. Oncotarget 7, 62726–62753. doi:10.18632/oncotarget.10911
Tortola, S., MarcuEllo, E., Gonzalez, I., Reyes, G., Arribas, R., Aiza, G., et al. (1999). p53 and K-ras gene mutations correlate with tumor aggressiveness but are not of routine prognostic value in colorectal cancer. J. Clin. Oncol. 17 (5), 1375–1381. doi:10.1200/jco.1999.17.5.1375
Vogelstein, B., Fearon, E. R., Hamilton, S. R., Kern, S. E., Preisinger, A. C., LeppertM., , et al. (1988). Genetic alterations during colorectal-tumor development. N. Engl. J. Med. 319 (9), 525–532. doi:10.1056/nejm198809013190901
Vousden, K. H., and Prives, C. (2009). Blinded by the light: The growing complexity of p53. Cell. 137, 413–431. doi:10.1016/j.cell.2009.04.037
Warburg, O. (1956). On the origin of cancer cells. Science 123 (3191), 309–314. doi:10.1126/science.123.3191.309
Ward, P. S., and Thompson, C. B. (2012). Metabolic reprogramming: A cancer hallmark even warburg did not anticipate. Cancer Cell. 21 (3), 297–308. doi:10.1016/j.ccr.2012.02.014
Weinberg, F., Hamanaka, R., Wheaton, W. W., Weinberg, S., Joseph, J., Lopez, M., et al. (2010). Mitochondrial metabolism and ROS generation are essential for Kras-mediated tumorigenicity. Proc. Natl. Acad. Sci. U. S. A. 107 (19), 8788–8793. doi:10.1073/pnas.1003428107
Weissmueller, S., Manchado, E., Saborowski, M., Morris, J. P., Wagenblast, E., Davis, C. A., et al. (2014). Mutant p53 drives pancreatic cancer metastasis through cell-autonomous PDGF receptor β signaling. Cell. 157 (2), 382–394. doi:10.1016/j.cell.2014.01.066
Xie, H., Hanai, J. I., Ren, J. G., Kats, L., Burgess, K., Bhargava, P., et al. (2014). Targeting lactate dehydrogenase-A inhibits tumorigenesis and tumor progression in mouse models of lung cancer and impacts tumor-initiating cells. Cell. Metab. 19 (5), 795–809. doi:10.1016/j.cmet.2014.03.003
Yang, H., Xiang, S., Kazi, A., and Sebti, S. M. (2020). The GTPase KRAS suppresses the p53 tumor suppressor by activating the NRF2-regulated antioxidant defense system in cancer cells. J. Biol. Chem. 295 (10), 3055–3063. doi:10.1074/jbc.RA119.011930
Ying, H., Kimmelman, A. C., Lyssiotis, C. A., Hua, S., Chu, G. C., Fletcher-Sananikone, E., et al. (2012). Oncogenic kras maintains pancreatic tumors through regulation of anabolic glucose metabolism. Cell. 149 (3), 656–670. doi:10.1016/j.cell.2012.01.058
Yu, L., Wu, M., Zhu, G., and Xu, Y. (2022). Emerging roles of the tumor suppressor p53 in metabolism. Front. Cell. Dev. Biol. 9, 762742. doi:10.3389/fcell.2021.762742
Keywords: metabolic stress, bioenergetics, Cancer Metabolism, colorectal cancer, OxPhos
Citation: Kealey J, Düssmann H, Llorente-Folch I, Niewidok N, Salvucci M, Prehn JHM and D’Orsi B (2022) Effect of TP53 deficiency and KRAS signaling on the bioenergetics of colon cancer cells in response to different substrates: A single cell study. Front. Cell Dev. Biol. 10:893677. doi: 10.3389/fcell.2022.893677
Received: 10 March 2022; Accepted: 09 September 2022;
Published: 27 September 2022.
Edited by:
Giuseppe Filomeni, Danish Cancer Society, DenmarkReviewed by:
Federico Lucantoni, Principe Felipe Research Center (CIPF), SpainCopyright © 2022 Kealey, Düssmann, Llorente-Folch, Niewidok, Salvucci, Prehn and D’Orsi. This is an open-access article distributed under the terms of the Creative Commons Attribution License (CC BY). The use, distribution or reproduction in other forums is permitted, provided the original author(s) and the copyright owner(s) are credited and that the original publication in this journal is cited, in accordance with accepted academic practice. No use, distribution or reproduction is permitted which does not comply with these terms.
*Correspondence: Jochen H. M. Prehn, cHJlaG5AcmNzaS5pZQ==; Beatrice D’Orsi, YmVhdHJpY2UuZG9yc2lAaW4uY25yLml0
†These authors have contributed equally to this work and share last authorship
Disclaimer: All claims expressed in this article are solely those of the authors and do not necessarily represent those of their affiliated organizations, or those of the publisher, the editors and the reviewers. Any product that may be evaluated in this article or claim that may be made by its manufacturer is not guaranteed or endorsed by the publisher.
Research integrity at Frontiers
Learn more about the work of our research integrity team to safeguard the quality of each article we publish.